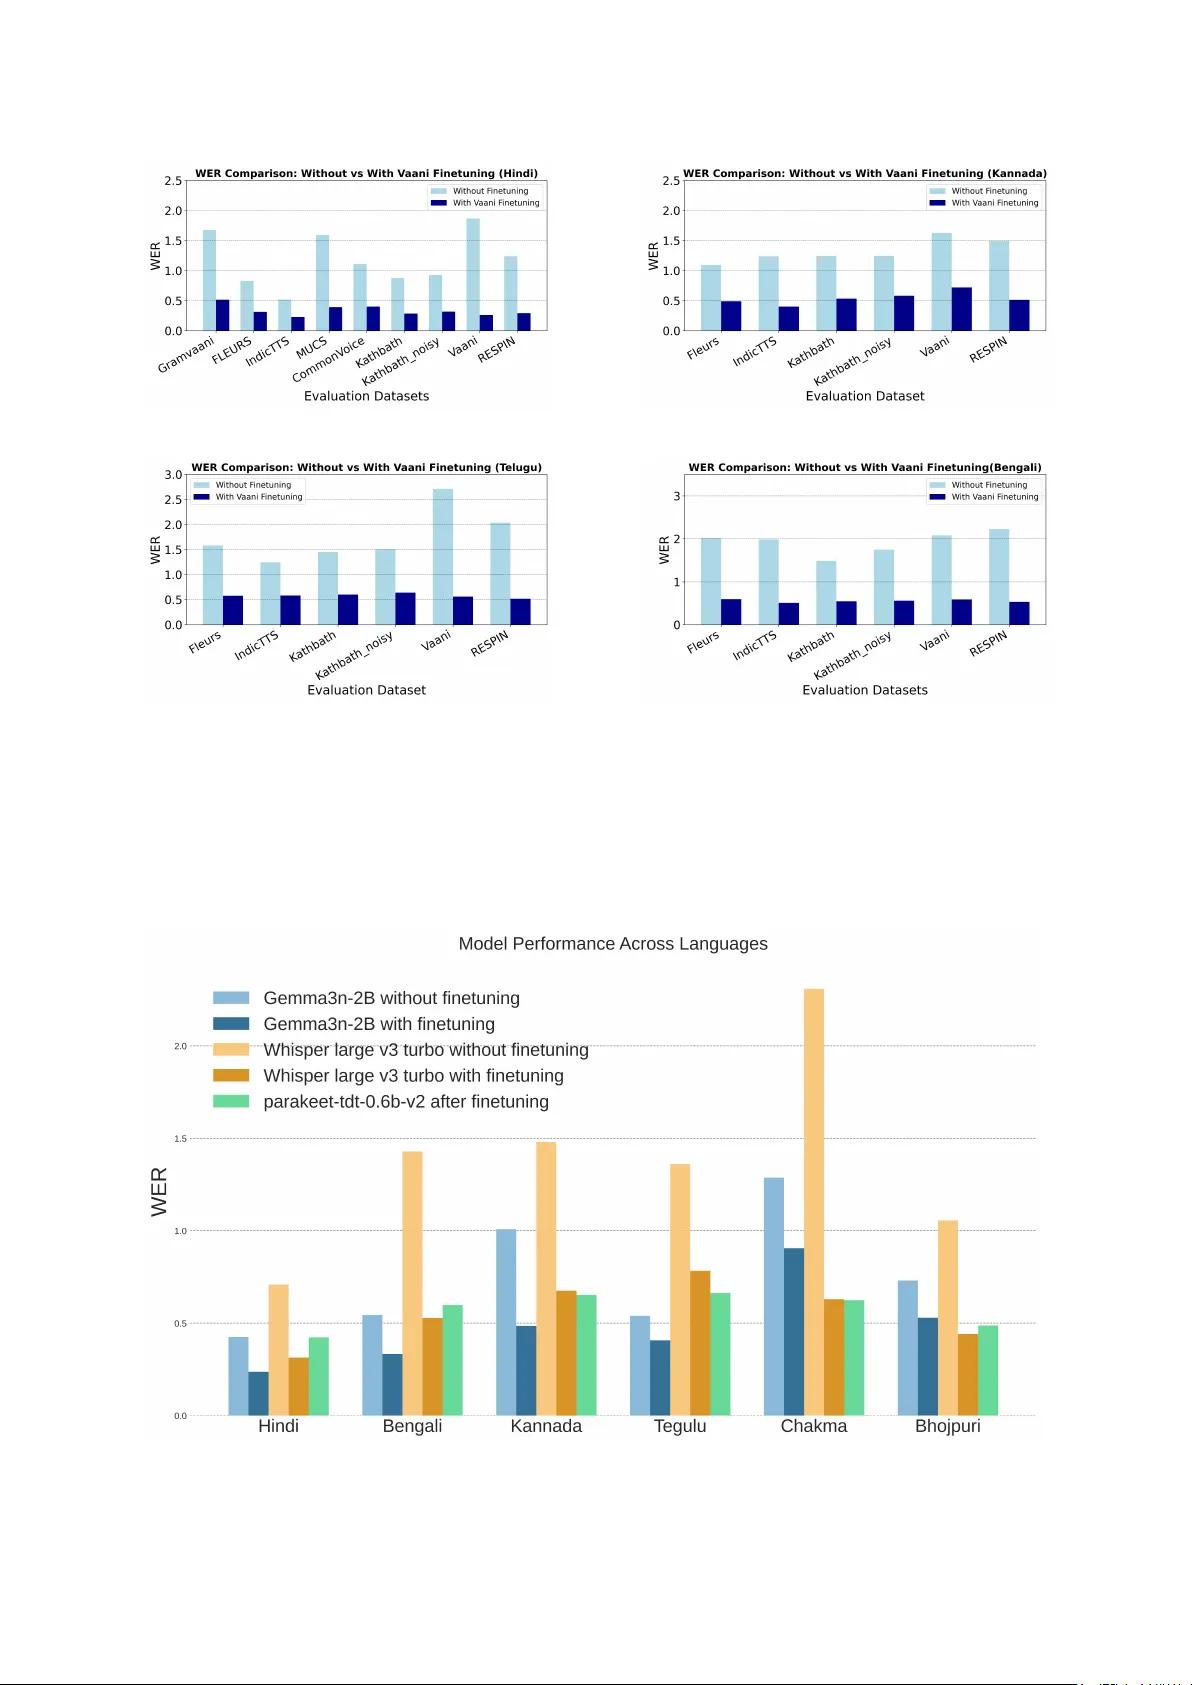
V A A N I : Capturing the language landscape f or an inclusiv e digital India Sujith Pulikodan 1 Abhayjeet Singh 2 Agneedh Basu 1 Lokesh Rady 1 Nihar Desai 1 Pa van K umar J 1 Prajjwal Srivasta v 1 Prana v D Bhat 1 Raghu Dharmaraju 1 Ritika Gupta 2 Sathvik Udupa ∗∗ Saurabh Kumar 2 Sumit Sharma 2 V aibha v V ishwakarma ∗∗ V isruth Sanka 1 Dinesh T ewari 3 Harsh Dhand 3 Amrita Kamat 3 Sukhwinder Singh 3 Shikhar V ashishth 3 Partha T alukdar 3 Raj Acharya ∗ Prasanta Kumar Ghosh 2 1 AI & Robotics T echnology Park (AR TP ARK), I-Hub @ IISc 2 Indian Institute of Science 3 Google DeepMind ∗ Currently at Quest Alliance ∗∗ W ork done while at Indian Institute of Science Abstract Project V AANI is an initiativ e to create an India-representativ e multi-modal dataset that comprehensiv ely maps India’ s linguis- tic div ersity , starting with 165 districts across the country in its first two phases. Speech data is collected through a care- fully structured process that uses image- based prompts to encourage spontaneous re- sponses. Images are captured through a separate process that encompasses a broad range of topics, gathered from both within and across districts. The collected data un- dergoes a rigorous multi-stage quality ev al- uation, including both automated and man- ual checks to ensure highest possible stan- dards in audio quality and transcription ac- curacy . Follo wing this thorough valida- tion, we have open-sourced around 289K images, approximately 31,270 hours of au- dio recordings, and around 2,067 hours of transcribed speech, encompassing 112 lan- guages from 165 districts from 31 States and Union territories. Notably , significant of these languages are being represented for the first time in a dataset of this scale, mak- ing the V AANI project a groundbreaking ef- fort in preserving and promoting linguistic inclusivity . This data can be instrumental in building inclusi ve speech models for India, and in adv ancing research and dev elopment across speech, image, and multimodal ap- plications. 1 Intr oduction India is one of the most linguistically di verse countries in the world. This linguistic di versity arises from a range of factors including historical and cultural influences, geographical dispersion, ethnic and social div ersity , political-administrati ve needs and religious variations ( Kidwai , 2019 ). Nearly 1.4 billion people in India communicate using a range of languages and dialects, often shaped by their regional and cultural context. Mul- tilingualism is the norm, with man y Indians pro- ficient in more than one language. According to the 2011 census ( of India , 2011 ), after de- tailed linguistic scrutin y and rationalization, 1,369 mother tongues were identified. After inguistic scrutiny , edit and rationalization, and those spoken by over 10,000 indi viduals were grouped into 121 languages. These belong to fiv e language fami- lies: Indo-European (23 languages, 78.05% of the population), Dravidian (17 languages, 19.64%), Austro-Asiatic (14 languages, 1.11%), T ibeto- Burmese (66 languages, 1.01%), and Semito- Hamitic (1 language, <0.01%). Among these, 22 languages are of ficially recognized under the Eighth Schedule of the Indian Constitution ( of In- dia , n.d. ). In multilingual contexts, voice-based technolo- gies play a critical role in bridging accessibility gaps, particularly in domains such as education, gov ernance, and health care ( K umar and Agarwal , 2012 )( Bre wer et al. , 2005 ). Speech technologies enable interaction between diverse social groups who speak dif ferent languages. By reducing de- pendence on text-based literacy and supporting communication in nativ e languages, speech inter- faces promote greater inclusion in digital spaces ( W u et al. , 2025 ). Recent advancements in Artificial Intelligence (AI), particularly in generativ e AI, hav e rev olu- tionized how we process and generate language. T echniques like attention mechanisms( V aswani et al. , 2017 ) and diffusion models ( Ho et al. , 2020 ), coupled with self-supervised pretraining followed by fine-tuning, ha ve dri ven significant progress ( Lee et al. , 2023 ). Ho wev er , these models rely heavily on high-quality and representativ e training data. Language modeling efforts often treat “lan- guage” as a singular , monolithic label ( Backus , 1999 ). In practice, spoken language varies sig- nificantly across regions, communities, education le vels, and genders, ev en within the same official language ( Shapiro and Schif fman , 2008 )( Sailaja , 2012 ). Thus, datasets anchored only on lan- guage identifiers miss important re gional and so- ciolinguistic v ariations. T o dev elop inclusi ve and robust models, we need data that reflects both language-anchored and region-anchored vari- ations in speech patterns. 2 Related works Data collection for speech technology typically follo ws two main strategies: read speech and spontaneous speech. In read speech, speakers re- cite predetermined text, which simplifies organiza- tion and annotation, since the content is controlled and consistent. This approach is particularly use- ful for creating initial datasets where linguistic clarity is key . In contrast, spontaneous speech cap- tures natural, unscripted responses from speakers based on stimuli, offering richer linguistic diver - sity and more authentic language usage. Howe ver , spontaneous speech presents greater challenges, as it requires extensi ve transcription and annotation, making the process more resource-intensiv e. This method is crucial for developing datasets that re- flect real-world communication but demands sub- stantial ef fort to meet specific use case needs. Thanks to the efforts of research communi- ties and v arious organizations, many datasets are now av ailable for Indic languages, each with v arying degrees of cov erage. Some no- table datasets include: IndicV oice ( Javed et al. , 2024 ), Shrutilipi ( Bhogale et al. , 2023 ), Kath- bath ( Ja ved et al. , 2023 ), Spring-inx ( Gang- war et al. , 2023 ), FLEURS ( Conneau et al. , 2023 ), CommonV oice( Ardila et al. , 2019 ), In- dicTTS( Baby et al. , 2016 ), CMU W ilderness Mul- tilingual Speech Dataset ( Black , 2019 ) and MUCS Dataset( Diwan et al. , 2021a ). Although there are multiple datasets, gaps remain in ensuring their in- clusion in languages and communities. Some ke y drawbacks are outlined belo w . Lack of extensive language coverage: Ef- forts to collect speech data for Indic languages hav e predominantly focused on major languages, mainly those recognized in the Indian constitution. These efforts often concentrate on the 22 officially recognized languages, which limits inclusi vity and representation of the country’ s v ast linguistic di- versity . Lack of geographic and other demographic coverage: Language is a continuum — it varies significantly based on geography . W ithin a sin- gle language, we often observe substantial varia- tion from place to place. Most existing datasets do not adequately account for this diversity and hav e failed to capture the regional and dialectal dif ferences present within languages. Given the high lev els of linguistic and geographical div ersity Dataset Y ear Selection Method Duration (Hours) No. Langs Languages Cover ed IndicV oice 2024 Mix ed 19550 22 as, bn, bho, gu, hi, kn, kok, ml, mr , or, pa, raj, ta, te, ur , etc. Shrutilipi 2023 Read 6457 12 as, bn, gu, hi, kn, ml, mr , or , pa, ta, te, ur Kathbath 2023 Read 1684 12 bn, gu, hi, kn, ml, mr , or, pa, ta, te, ur , as Spring-inx 2023 Mix ed 2005 10 bn, hi, kn, ml, mr , or , pa, ta, te, ur FLEURS 2023 Mix ed 163 13 as, bn, gu, hi, kn, ml, mr , or , pa, sd, ta, te, ur CommonV oice 2023 Read 373 10 as, bn, gu, hi, kn, ml, mr , or , ta, te CMU W ilder - ness 2023 Read 286 18 as, bn, gu, hi, kn, ml, mr , or , pa, ta, te, ur , etc. MUCS Dataset 2023 Mix ed 8 8 as, bn, gu, hi, kn, mr , ta, te IndicTTS 2023 Read 225 13 as, bn, gu, hi, kn, ml, mni, mr , or , raj, ta, te T able 1: Indic Corpus. Language codes: as (Assamese), bn (Bengali), bho (Bhojpuri), gu (Gujarati), hi (Hindi), kn (Kannada), kok (K onkani), ml (Malayalam), mr (Marathi), or (Odia), pa (Punjabi), raj (Rajasthani), ta (T amil), te (T elugu), ur (Urdu), sd (Sindhi), mni (Manipuri). across India, such datasets may not truly represent the wide range of speech patterns found across the country . Lack of multimoldel data: Furthermore, AI is increasingly moving to ward multimodal systems, which require datasets covering defferent modali- ties. Howe ver , most publicly av ailable speech fo- cused datasets for Indic languages are limited to a two-modality setup, speech and text. Building multimodal datasets will be crucial to enable the de velopment of robust multimodal models tailored for Indic languages and contexts. T o address this gap, the V AANI initiative adopts a geo-centric data collection approach to build a more inclusive and representati ve dataset. This method is specifically designed to capture the rich linguistic diversity of India, including low- resource and underrepresented languages. By pri- oritizing inclusivity and di versity , V AANI con- tributes to the de velopment of equitable AI so- lutions for language technologies. Its innov a- ti ve prompting strategy enables the creation of a multimodal dataset comprising images, speech, and text, which lays the groundwork for building robust multimodal models tailored to Indic lan- guages. 3 The Dataset V AANI is an India-representativ e multimodal, multilingual dataset. It contains audio record- ings collected along with the images shown to the speak ers, and where a vailable, the correspond- ing transcriptions. Each speaker was presented with an image and asked to describe it in their o wn words, enabling the creation of aligned im- age–speech–text triplets. Phase 1 and Phase 2 of the dataset include data collected from 165 districts across the country , cov ering 112 languages. It comprises 24,009,427 audio segments collected from 158,441 speakers recorded in response to 289,838 images, with a to- tal audio duration of approximately 31,270 hours. From this collection, 2,067 hours of audio hav e been manually transcribed, with transcription data distributed nearly ev enly across the 165 districts, ensuring balanced geographic representation. 3.1 District r epresented The data has been collected from 165 districts across 28 states and 3 union territories in India. In southern India, Andhra Pradesh includes Anantpur , Annamaya, Chittoor , Guntur, Krishna, Manyam, Srikakulam, Sri Satya Sai, V ishakhap- atnam, and Adilabad. Karnataka contributes Ban- galore, Belgaum, Bellary , Bijapur , Bidar , Cham- rajnagar , Dakshina Kannada, Dharwad, Gulbarg a, K oppal, Mysore, Raichur , and Shimoga. K erala is represented by Kasaragod, K ollam, Kozhik ode, Thiruv ananthapuram, and W ayanad. Goa is repre- sented by North Goa and South Goa. T amil Nadu contributes Chennai, Kanyakumari, Namakkal, and Nilgiris. T elangana includes Hyderabad, Karimnagar , K omaram Bheem, Mahabubabad, and Nalgonda. In the North-East, Arunachal Pradesh con- tributes Longding, Lo wer Dibang V alley , and Papum Pare. Assam includes Hailakandi, Kam- rup Metropolitan, Karbi Anglong, and Sonitpur . Meghalaya includes North Garo Hills, South Garo Hills, and W est Garo Hills. Nagaland contributes Dimapur and Kohima. T ripura includes Dhalai, South T ripura, Unakoti, and W est T ripura. Mi- zoram is represented by Aizawl, and Sikkim by Gangtok. Manipur includes Imphal W est. Eastern India includes Bihar with Araria, Be- gusarai, Bhagalpur , Darbhanga, East Champaran, Gaya, Gopalganj, Jahanabad, Jamui, Kaimur, Katihar , Kishanganj, Lakhisarai, Madhepura, Muzaf farpur , Patna, Purnia, Saharsa, Samastipur, Saran, Sitamarhi, Supaul, V aishali, and W est Champaran. Jharkhand is represented by Deoghar , Garhwa, Jamtara, P alamu, Ranchi, and Sahebganj. Odisha includes Khordha, Malkangiri, Nuapada, and Sambalpur . W est Bengal includes Alipurduar , Cooch Behar , Darjeeling, Dakshin Dinajpur , Jal- paiguri, Jhargram, Kolkata, Malda, North 24 Par- ganas, Paschim Medinipur , and Purulia. In the W est, Gujarat includes De vbhoomi Dwarka, Gandhinagar , Navsari, and V alsad. Ra- jasthan includes Barmer , Bikaner, Churu, Jaipur , Jaisalmer , and Nagaur . Maharashtra includes Au- rangabad, Chandrapur , Dhule, Gondia, Mumbai Suburban, Nagpur , Sindhudurg, Pune, Solapur , and W ashim. In northern India, Haryana includes Charkhi Dadri, Jhajjar , and Rohtak, while Himachal Pradesh contributes Shimla. Punjab includes Fazilka, Kapurthala, and Pathankot. Uttarakhand contributes T ehri Garhwal and Uttarkashi. Uttar Pradesh includes Budaun, Deoria, Etah, Ghazipur , Gorakhpur , Hamirpur , Jalaun, Jyotiba Phule Na- gar , Lalitpur , Lucknow , Muzaff arnagar , Saharan- pur , Shamli, and V aranasi. In central India, Madhya Pradesh includes Bhopal, Dhar , Katni, and Umaria. Chhattisgarh includes Balrampur , Bastar , Bilaspur , Jashpur , Kabirdham, K orba, Koriya, Narayanpur , Raigarh, Raipur , Rajnandgaon, Sar guja, and Sukma. Lastly , the districts from the three UTs include Chandigarh, Ne w Delhi, Srinagar . The districts were selected to ensure maximum cov erage of the languages reported in the 2011 Census of India( of India , 2011 ). For each district, approximately 200 hours of audio data were col- lected, with around 5-10% manually transcribed. T o capture regional linguistic variations, data was gathered from multiple locations within each dis- trict. 3.2 Languages captur ed The dataset covers 112 languages and dialects spo- ken across India, reflecting its rich linguistic di- versity . These are Agariya, Angami, Angika, Ao, Assamese, A wadhi, Baghati, Bagheli, Bagri, Ba- jjika, Bearybashe, Bengali, Bhatri, Bhili, Bho- jpuri, Bihari, Bundeli, Chakhesang, Chakma, Figure 1: Districts cov ered in Phase 1 and Phase 2 of the V aani Project Chhattisgarhi, Desia, Dogari, Dogri, Dorli, Du- ruwa, English, Galo, Garhwali, Garo, Gondi, Gu- jarati, Hajong, Halbi, Harauti, Haryan vi, Hindi, Idu Mishmi, Jaipuri, Kannada, Karbi, Kash- miri, Khandeshi, Khariboli, Khortha, K okborok, K onkani, K oya, Kuki, Kumaoni, Kurmali, K u- rukh, Lambani, Lepcha, Liangmai, Liangmei, Limbu, Lotha, Magadhi, Maithili, Malayalam, Malv ani, Malvi, Manipuri, Mara, Marathi, Mar- wadi, Meitei, Mewari, Mewati, Mizo, Nagamese, Nepali, Nimadi, Nyishi, Oriya, Pahadi, Paniya, Phom, Powari, Punjabi, Rajasthani, Rajbanshi, Rengma, Rongmei, Sadri, Sambalpuri, Sang- tam, Santali, Shekhawati, Sikkimese, Sindhi, Sirmauri, Sumi, Surgujia, Surjapuri, Sylheti, T agin, T angkhul, T amil, T elugu, T enyidie, Thethi, Thadou, T ulu, Urdu, V aiphei, W agdi, W ancho, Y imchunger , and Zeme. This comprehensiv e inclusion of both widely spoken and underrepresented languages ensures the dataset is well-suited for developing inclusi ve and re gionally representati ve speech technologies. Our unique data collection approach, where participants were encouraged to speak their na- ti ve language from div erse geographies, enabled us to capture se veral lesser-kno wn and under- documented languages, some of which may be digitally recorded for the first time at this scale. These languages include Angika, an Eastern Indo- Aryan language from Bihar and Jharkhand with distinct grammar and vocab ulary; K ortha, a Ma- gahi dialect spoken in the Santhal Pargana divi- sion in Jharkhand; Malvani, a dialect of Konkani recognized by many speakers as a distinct lan- guage due to its cultural and linguistic uniqueness; Shekhaw ati, a Rajasthani dialect spoken in Jhun- jhunu, Sikar , and Churu with similarities to Mar- wari; Duruwa, a Central Dra vidian language spo- ken in Odisha and Chhattisgarh; Jaipuri, another Rajasthani dialect with unique phonetic features centered in Jaipur; Bearybashe, a language of the Beary community in coastal Karnataka that blends Kannada, T ulu, and Urdu; Kurumuli, a Dravidian language of the Kuruma community in Karnataka and Kerala; Kudukh, a Munda language spoken by the Oraon tribe in Jharkhand; Bajjika, a Bhojpuri dialect with unique phonetics spoken in V aishali and Muzaffarpur districts of Bihar; Agariya, a Hindi dialect spoken in Madhya Pradesh with distinct lexical traits; and Halbi, an Indo-Aryan language found in Chhattisgarh and Maharashtra with features separating it from standard Hindi. Apart from these, 34 rare languages were col- lected from North-Eastern India alone - Angami, Ao, Chakhesang, Chakma, Galo, Garo, Hajong, Idu mishmi, Karbi, K okborok, Kuki, Liangmei, Lotha, Nagamese, Nyishi, Phom, Rengma, Rong- mei, Sadri, Sangtam, Sumi, T agin, T enyidie, W an- cho, Y imchunger , and Zeme. Man y of these do not e ven ha ve their o wn scripts. W e believ e that open-sourcing these record- ings will support inclusi ve technology de velop- ment and preserve linguistic di versity . 3.3 Metadata Each audio segment in the dataset is accompanied by the follo wing metadata fields: ’State’, ’Dis- trict’, ’Gender’, ’Pincode’, ’Asserted Language’, and ’Languages Spoken’. These fields provide critical conte xtual information for organizing and analyzing the data. The ’State’ and ’District’ fields enable precise geographical localization, while ’Gender’ supports demographic analysis. The ’Pincode’ field adds further regional specificity . The ’Asserted Language’ indicates the language the speaker claims to have used, ensuring align- ment between transcription and linguistic context. ’Languages Spoken’ captures the speaker’ s multi- lingual background, offering insight into language contact and influence. T ogether, these metadata supports ef fecti ve cate gorization and enhances the utility of the dataset for building regionally and linguistically inclusi ve speech technologies. Follo wing a rigorous curation process, the dataset has been open-sourced via our web portal, with options to download data at either the state or district lev el. It is also available on Hugging Face to support broader research and de velopment ef forts. 4 Experiments The V aani dataset is multimodal and cov ers many Indian languages. T o demonstrate its utility , we conducted a limited set of experiments on a sub- set of the data, using transcribed speech, untran- scribed speech, and image data. 4.1 ASR Finetuning : Language Specific The V aani dataset comprises approximately 2,067 hours of transcribed speech across multiple lan- guages. Here we demonstrate the performance im- prov ements achiev able by fine-tuning open-source models on part of the data separately for 4 lan- guages and ev aluate using multiple benchmark datasets to assess the consistency of the perfor- mance gains. W e fine-tuned the Whisper-small model (244M parameters)( Radford et al. , 2022 ) separately for Hindi (331 hours), Kannada (80.244 hours), T el- ugu (69.039 hours), and Bengali (101 hours) on a subset of the V aani dataset, and ev aluated each model independently on multiple benchmark datasets Experiments demonstrate consistent perfor- mance improv ements across all languages com- pared to open-source models, illustrating the util- ity of the V aani dataset for fine-tuning ASR mod- els. 4.2 ASR Finetuning : Multilingual Setup In this work, we demonstrate the performance im- prov ements achiev ed through limited fine-tuning of open-source speech and multimodal models on our dataset, and we ev aluate their behavior across languages to assess the consistenc y of these gains. W e conduct e xperiments using three mod- els: Gemma-3n-2B ( T eam , 2025 ), Whisper-lar ge- v3-turbo( Radford et al. , 2022 ) , and parakeet- tdt-0.6b-v2( NVIDIA , 2025 ). All models are fine-tuned in a multilingual setting using a subset of the transcribed speech data from Hindi (593.93 hours), Kannada (120.20 hours), T elugu (113.04 hours), and Bengali (113.236 hours), along with two low-resource languages: Chakma (31.58 hours) and Bhojpuri (23.69 hours). For Gemma-3n-2B, we employ LoRA-based parameter-ef ficient fine-tuning, while the other models are fully fine-tuned. The fine-tuned models are ev aluated across multiple benchmark datasets, including V aani, to assess impro vements in multilingual and lo w-resource speech recognition performance. Specifically , Hindi models are ev aluated on GramV aani( Bhanushali et al. , 2022 ), FLEURS, MUCS( Diwan et al. , 2021b ), CommonV oice, Kathbath, Kathbath-Noisy ( Jav ed et al. , 2023 ), V AANI, and RESPIN( Kumar et al. , 2024 ). Ben- gali and T elugu models are e valuated on FLEURS, CommonV oice, Kathbath, Kathbath-Noisy , and V AANI, while Kannada models are assessed on FLEURS, Kathbath, Kathbath-Noisy , V AANI, and RESPIN. In contrast, Chakma and Bhojpuri models are e v aluated solely on V AANI, due to (a) Hindi (b) Kannada (c) T elugu (d) Bengali Figure 2: W ord Error Rate (WER) comparison for Whisper-small models fine-tuned on the V aani dataset across multiple languages. Each subplot shows performance on benchmark datasets for the respectiv e language. Figure 3: A verage WER of models on the benchmark datasets across different languages. the lack of other public benchmarks. W e normal- ized the output of Gemma-3n-2B when comput- ing WER for the non-finetuned model to remove repeated words. The ev aluation results consistently show mea- surable performance improv ements across all models and languages after fine-tuning. 4.3 Region Specific finetuning In order to highlight the importance of re gion- specific data, we fine-tuned models for the Hindi dataset at the state lev el, and the performance was measured across multiple states. W e fine- tuned the model on Hindi data separately for each state—Bihar (130.02 hours), Uttar Pradesh (75.63 hours), Chhattisgarh (60.45 hours), Maharash- tra (21.81 hours), Jharkhand (15.63 hours), Ut- tarakhand (10.59 hours), Rajasthan (5.54 hours), Goa (4.88 hours), and Andhra Pradesh (4.49 hours)—and e valuated performance using test data from the same states. The ev aluation results sho w that a model trained on data from a specific state performs compara- ti vely better on nearby states than on distant ones, e ven within the same language. 4.4 Language Identification W e apply V aani dataset to the task of spoken lan- guage identification (LID). The model architecture builds on the Whisper-medium encoder , followed by a pooled attention layer for aggregating frame- le vel embeddings, and a two-layer artificial neu- ral network (ANN) classifier with a hidden size of 512. Training is performed end-to-end on our cu- rated dataset of 42 languages, each balanced with 10 hours of speech data, using an 8:1:1 split for training, v alidation, and testing. W e optimize the model with AdamW at a learn- ing rate of 1e-5, employing linear decay with warmup, and fully fine-tune the encoder . T raining is conducted for up to 2,500 steps. The model was e valuated on the test split this curated dataset and also on two e xternal datasets : Kathbath( Ja ved et al. , 2023 ) and FLEURS( Conneau et al. , 2023 ). As sho wn in T able 2 , our model achie ves consistent perfor- mance across the three ev aluation datasets, with ov erall accuracies of 74.8% (V aani T est), 76.1% (FLEURS), and 65.8% (Kathbath). As seen in the confusion matrices in Figure 6 , the model achiev es high accuracy for most languages, though confu- sions remain among closely related dialects (e.g., Hindi–Khariboli–Maithili, Odia-Sambalpuri, and Bajjika–Magahi–Bhojpuri), highlighting the chal- lenge of fine-grained language classification. 4.5 Image Retrie val W e aimed to explore the image modality within the V aani dataset, which contains over 240K im- ages collected specifically for this purpose. Since speakers were prompted to speak about images, the corresponding audio often includes details re- lated to the visual content. Multiple speakers may describe the same image, and parts of these utter- ances are transcribed. For this experiment, we ag- gregated the transcribed segments for each image and used Lar ge language Model(LLM) to generate a single consolidated description. For the experiments, we used the SigLIP2 ( Tschannen et al. , 2025 ) model and the Hindi por- tion of the dataset. The model w as fine-tuned on image–Hindi transcription pairs, using approx- imately 45,000 images for training, and ev aluated on an image retriev al task with around 9,500 test images. The fine-tuned model demonstrated per- formance improv ements ov er the original model. 5 Data Collection W e aimed to build a dataset that prioritizes inclu- si vity for people rather than focusing solely on languages. Pre vious ef forts hav e predominantly adopted a language-specific approach, often re- stricted to of ficially recognized languages. This has excluded many languages spoken across a lin- guistically di verse country like India, where hun- dreds of languages thriv e. Additionally , we sought Figure 4: WER heatmap sho wing state-wise e valuation results for Hindi models fine-tuned on data from indi vidual states. The results highlight that models tend to perform better on geographically proximate states compared to distant ones, e ven within the same language. (a) FLEURS:Confusion matrices (b) KA THBA TH:Confusion matrices Figure 6: Confusion matrices for LID experiment Figure 7: Performance of SigLIP2 fine-tuned on the Hindi portion of the V aani dataset for the image retrie val task. to capture more spontaneity in speech, designing our collection process to encourage natural, unbi- ased expressions, ensuring a more authentic repre- sentation of ho w people communicate. 5.1 Collection Strategy Our approach to data collection was district- centric rather than language-centric, aiming to capture speech data from indi viduals across In- dia, representing a wide range of demographics. This included considerations of gender, socioeco- nomic background, education, and age. T o ensure an efficient and scalable process, data collection was organized at the district level. In Phase 1 of the project, we successfully covered 85 districts across 12 states; and in Phase 2 we are covering 80 more districts across 23 states and 3 UTs, ensuring a broad representation of the country’ s linguistic and social diversity . This approach allows for a more comprehensi v e understanding of speech pat- terns and language use across different communi- ties. W e aimed to capture spontaneous speech from speakers to reflect the natural linguistic variations of their speech. T o achie ve this, we used care- fully selected and specifically prepared images as stimuli. When presented with an image, the speaker was encouraged to describe it, fostering a more natural and creativ e response. This approach minimized bias and reduced potential inhibitions, which might arise from more structured prompts, such as text-based stimuli. By using images, we provided speakers with greater freedom of expres- sion, leading to more authentic and varied speech compared to the more constrained responses gen- erated by text prompts. Furthermore, compared to con versational data collection, which can be in- fluenced by social factors or biases, image-based prompts allo wed for a more genuine and uninhib- ited language expression from the speak er . Figure 8: Sample images that used for capturing data for a district 5.2 Collection goals The districts were selected based on linguistic di- versity , with the goal of covering 80 districts in Phase 1 and 85 districts in Phase 2, across 25 states in India. From each district, our goal was to open source around 200 hours of audio data, with 10% of it manually transcribed. Comprehensi ve metadata was collected for each speaker , including age, gender , languages spoken, education, socio- economic background, location, and duration of stay in that location. T o ensure ethical data use, each participant provided a signed consent form, transferring o wnership of the data and enabling its open-source distribution without restrictions. . 5.3 Collection Pr ocess The collection process is operationally challeng- ing, resource intensiv e, and time-consuming. T o address this, we enlisted the support of vendors to manage the process effecti vely . The vendors es- tablished an extensi ve network of coordinators in each district to facilitate data collection. For au- dio collection and transcription, we collaborated with three vendors, Shaip( Shaip , 2025 ), Meg- dap( Megdap , 2025 ), and Karya( Karya , 2025 ) each tasked with providing high-quality audio data, and transcriptions of 10% of those audios, that pass the quality ev aluations. W e also engaged GTS( GTS.AI , 2025 ) as the vendor to collect ap- proximately 1500 images from each district. Figure 9: Automated QC-Process flow The overall process consists of image capturing, speech data collection, and transcription. 5.3.1 Image capturing In our approach, we presented carefully selected images to participants and asked them to describe the content. For this, we gathered 1,700 to 2,000 images per district, consisting of both district- specific and general images. These images were ne wly captured for this project with assistance from external vendors. The topics for each dis- trict were identified based on local context and shared with the vendors. They were instructed to deli ver images in .jpg format, with a resolution of 640x400 pixels and a file size of under 500 KB. The image collection process adhered to a set of strict specifications to ensure quality , rele vance, and ethical standards. All images were required to be physically captured and not sourced from on- line or third-party media. Each image needed to be clear, well-focused, and free from any blurring or visual distortions. The object rele vant to each category had to be prominently visible without any obstructions. Furthermore, images were required to be unique for ev ery district and category , with no duplication permitted across different regions or categories. T o maintain priv acy and compli- ance, images were not allowed to include person- ally identifiable information such as people, rec- ognizable logos, or priv ately owned objects. Im- portantly , the images needed to depict content that could be meaningfully described, as they were in- tended to prompt spoken responses from partici- pants. Finally , the date of image capture w as man- dated to be no earlier than July 1, 2023, ensuring the recency and rele v ance of the content. T o ensure quality , we de veloped an in-house pipeline for assessing the images deliv ered by ven- dors. This process included both automated vali- dation and a human-in-the-loop revie w . Each im- age underwent a series of automated and manual checks to verify quality , uniqueness, and compli- ance with provided guidelines. Only those images that satisfied all the defined criteria were accepted and subsequently used for data collection. 5.3.2 Speech data collection T o facilitate high-quality data collection, we es- tablished comprehensiv e audio and transcription specifications that were shared with the vendors in v olved in the project. These specifications de- fined both the technical format of the recordings and the style of data collection to ensure consis- tency , clarity , and linguistic div ersity . The audio recordings were required to adhere to the following technical standards: a sampling rate of 16kHz, 16 bits per sample, and a single audio channel. Additionally , the audio must be raw — free from any transcoding or post-processing—to preserve its authenticity and suitability for model training. V endors were also giv en clear instructions re- garding the style of data collection. The speech had to be spontaneous, with utterances spoken in response to visual prompts. Participants were sho wn images selected randomly from a curated pool, and for each image, they were expected to provide 10–20 seconds of ef fectiv e speech. In- structions emphasized the importance of v ariety in the spoken responses to ensure linguistic richness and di versity . T o minimize the impact of background noise and maintain recording quality , specific environ- mental guidelines were also issued. Recordings had to be conducted in quiet en vironments, free from household noises (e.g., television, kitchen sounds, or water flow) and outdoor disturbances (e.g., birds or traf fic). Indoor recordings were to be made in rooms without echo, and speakers were instructed not to record while mo ving. When using smartphones, all notifications and vibration modes were to be disabled. Furthermore, record- ings had to be clean and free of distortions such as clipping, DC drift, signal dropouts, or non-speech interference. Microphone arrangement was also addressed to ensure optimal audio capture. The recording de- vice had to be placed no more than two feet from the speaker’ s mouth, and the distance and orienta- tion were to remain consistent throughout the ses- sion. Ideally , the microphone should be positioned directly in front of the speaker , at a minimum dis- tance of one foot, and kept at a fixed location for the duration of recording. Speaker selection followed strict criteria to en- sure nati vity , demographic div ersity , and balanced representation. Participants were required to be between the ages of 20 and 70, with uniform dis- tribution across this age range. Each district had to include at least 800 speakers, with gender balance maintained. No individual speaker was permitted to contribute more than 15 minutes of ef fectiv e speech. All speakers were required to be nati ve residents of the pincode recorded in the metadata, verified using identity documents such as P AN or Aadhaar cards. Participants were encouraged to speak in the language or dialect they typically use at home with family members. Additionally , for each speaker , information about their residential history — specifically where they had liv ed and for ho w long since birth — was collected and sub- mitted alongside the recordings. T o collect data from speakers, the vendors uti- lized their own mobile applications along with a web application for quality control. Coordinators, selected and onboarded from each district, trav- eled to assigned locations within their districts. They onboarded speakers while ensuring di versity across gender, age groups, education le vels, and socio-economic backgrounds. Speakers were reg- istered on the platform with the assistance of co- ordinators. Initially , they were shown sample im- ages and asked to speak about them. The sam- ple data w as then validated by the vendor’ s quality control teams. If the data met quality standards, the speaker was officially onboarded to the plat- form. After onboarding, speakers were presented with a set of images, including district-specific and generic ones, and were asked to record au- dio. Each speaker contributed up to 15 min- utes of audio data. During onboarding, details such as age, gender , kno wn languages, and socio- economic background were also collected. Once the recordings were completed, the application provided an option to submit the data, which was then processed further . The data collected from users undergoes an ini- tial quality check by the vendors to ensure its in- tegrity . This includes verifying the audio quality , as well as the completeness and accuracy of the metadata. T o ensure geographical cov erage, pin- code information is captured during user onboard- ing, and the GPS location of the mobile device is used for v alidation. Once the data is collected and v alidated by the vendors, it is submitted for further processing. 5.3.3 T ranscription Process Segments for transcription are selected from the audio data based on a pre-defined criteria and sent back to the vendors. The criteria ensures that a fixed percentage of each speak er’ s data is tran- scribed while maintaining div ersity across speaker metadata and language. T o maintain linguistic and contextual accurac y , specifications require tran- scribers to be from the same district where the audio data was collected. V endors recruited and trained transcribers, post which the y transcribe the selected audio segments on the basis of guide- lines and specifications. Once transcription is completed and under goes quality control, the tran- scribed data is submitted for further processing. 6 Quality contr ol The dataset underwent a comprehensive quality assurance process to ensure its reliability and ac- curacy across all components, including audio recordings, metadata, transcriptions, and data for- matting. The quality ev aluation pipeline was meticulously designed to identify and resolve any issues that could compromise the dataset’ s in- tegrity . The process incorporated both automated and manual checks. Automated checks e valuated the quality of audio, metadata, and transcriptions. For audio, these checks detected issues such as ex- cessi ve noise, interruptions, or distortions. Meta- data quality was assessed to ensure that all re- quired fields were accurately filled, consistent, and adhered to predefined standards. Similarly , tran- scription quality was ev aluated for accuracy and alignment with the audio content. Data formatting was also revie wed to prev ent structural errors that could impact do wnstream applications. Any in- consistencies, such as mismatched labels, missing data, or errors in transcription, were flagged for correction. Manual checks were conducted by trained e v al- uators from the corresponding districts to address finer nuances that automated tools might ov erlook. These included ev aluating subtle audio issues, en- suring metadata accuracy , and verifying the con- text and correctness of transcriptions. Local ev al- uators played a crucial role in maintaining contex- tual and linguistic integrity . The v endors submitted the data in organized batches through repositories hosted on Google Cloud Platform (GCP). This secure and ef ficient deli very system ensured that the data transfer pro- cess was streamlined. Each batch underwent a final revie w to confirm compliance with quality standards before being integrated into the larger dataset for further analysis and processing The v arious process in volv ed the the QC process ex- plained belo w 6.1 A utomated Quality control In the automated pipeline, audio quality and tran- scription quality are e valuated separately . 6.1.1 A udio In this process, the quality of the audio, file format, audio format, and metadata are ev aluated at mul- tiple stages based on the complexity of the work- flo w . This approach enables timely feedback to the vendors, allowing them to take correctiv e actions and resubmit the data as needed. Stage 1 - Pre Initial Check The workflo w performs a detailed quality check of the data to ensure its accuracy and consistency across multiple aspects. It validates the structure and content of the metadata and audio files, focus- ing on se veral ke y areas: Structural V alidation: The workflow checks that metadata files follow a strict format. Each required field, such as Speaker ID, Phone Brand, Phone Model, Gender , Age, and more, is ev alu- ated to ensure it is present and correctly format- ted. For instance, the fields must contain only al- lo wed characters and end with a newline. Missing Figure 10: Manual audio QC process or improperly formatted fields are flagged for cor- rection. File Naming and Path V alidation: The sys- tem ensures that file names and paths are consis- tent and meet predefined standards. Files with spaces, an incorrect number of underscores, or mismatched district or state names are identified as errors. This step also verifies that filenames cor- rectly correspond to the associated metadata and image references. Data Consistency Checks: The workflo w cross-checks metadata with actual data entries. It identifies mismatched or missing speaker IDs, re- peated speaker IDs or utterance IDs, and ensures that references to images or other files match those in the database. Any mismatch between metadata and the submitted files is flagged. A udio Quality and Format V alidation: The audio files are checked for proper file format and extension. Files with unsupported formats or in- correct extensions are flagged. The workflow also v alidates that the total duration of the audio files falls within an acceptable range. Consent and Supporting Documents: The presence of mandatory consent forms and meta- data files is verified. Missing files, such as speaker metadata or consent PDFs, are flagged as critical issues. Encoding and F ormatting Standards: The workflo w ensures text files end with a ne wline, do not contain non-standard Unicode characters, and maintain consistent formatting. This prevents po- tential issues during data processing. Geographical and Contextual V alidation: Metadata fields like district and state are cross- verified to ensure they match the expected values. Images or audio files associated with specific dis- tricts are checked for consistency with the meta- data. These rigorous checks are designed to catch inconsistencies, formatting errors, and missing data, enabling vendors to receive timely feedback for corrections. This ensures the final dataset is high-quality and ready for do wnstream processing and analysis. Stage 2 - Initial Check The workflo w conducts a comprehensive series of checks on both audio data and metadata to ensure the dataset’ s quality and integrity . These checks v alidate v arious aspects of the data and identify inconsistencies or errors that need to be addressed. Checks perf ormed on the audio files: Basic Properties: These checks ensure that all audio files meet the required technical speci- fications: a sample rate of 16 kHz, a single au- dio channel (mono), and 16-bit precision. Files that fail to meet these standards are automatically flagged for re view . File Integrity: Audio files are examined for re- dundancy , such as repeated filenames in the cur- rent or previous batches. Symbols in file names are checked to ensure they comply with allo wed naming con ventions. Segment Details: Segmentation within the au- dio files is rigorously validated. Issues such as ov erlapping segment durations, negati v e dura- tions, or segments shorter than 0.5 seconds are flagged. Speakers exceeding the allo wed duration of 15 minutes are also identified. Silence Analysis: Silence at the beginning, end, or within audio segments is systematically ana- lyzed to ensure clarity and usability of the record- ings. Specifically , se gments are flagged if they contain silence exceeding 0.3 seconds at the start or end, as this may indicate delayed speech or im- proper trimming. Additionally , mid-segment si- lences longer than 1 second are identified, as they can disrupt the natural flow of speech and affect model training or transcription accuracy . These checks help ensure that the audio quality is suitable for processing. Consistency: The duration values listed in the .tsv files provided by the vendor are compared against the actual audio durations. Discrepancies — such as metadata durations exceeding actual audio lengths — are flagged. File Presence: Missing or empty .tsv files corresponding to .wav files are identified. Sim- ilarly , cases where image references in metadata do not match the av ailable audio files are flagged. Metadata Checks: Demographic V alidation: Specific checks are applied to ensure the validity of demographic in- formation provided by speakers. The pincode must correspond accurately to the specified state, ensuring geographical consistency . The speaker’ s age must fall within a v alid range of 20 to 70 years, and the number of years they report staying in a location cannot exceed their age, maintaining logical consistency . Additionally , the language in which the recording is made must be among the languages the speaker has reported as known, en- suring linguistic alignment between the metadata and the audio content. Consistency Across Batches: Metadata is compared across batches to identify inconsisten- cies — such as differing demographic details for the same speaker or mismatches between speaker records and batch information. Speaker V alidation: Metadata is analyzed to detect speakers with incomplete or inconsistent data. Speakers with fewer than 10 v alid audio files, or those whose metadata conflicts with prior sub- missions, are flagged for exclusion. Comprehensi ve Cr oss-V alidation: Alignment Between Metadata and A udio: The workflo w ensures that metadata entries cor- rectly correspond to associated audio files. Mis- matches in filenames, segment durations, or de- mographic data are highlighted for correction. These detailed checks help maintain high stan- dards of quality and consistency , facilitating accu- rate do wnstream processing and analysis. Stage 3 - Single A udio Check The Signal-to-Noise Ratio (SNR) of the audio seg- ments is calculated to e valuate the clarity and qual- ity of the recordings. SNR is a critical metric that measures the lev el of the desired audio signal rel- ati ve to the background noise. For each segment, the SNR is compared against a predefined thresh- old, ensuring that only recordings with an accept- able lev el of clarity are retained. If any segment fails to meet this threshold, it is flagged for man- ual re view . 6.1.2 Sample Selection f or A udio Manual QC process The files flagged during the single audio check are selected for manual revie w . Additionally , we en- sure that at least one segment from each speaker is included. These segments are randomly sam- pled so that 10% of the data that passed both the pre-initial and initial checks also undergoes man- ual quality control. 6.1.3 Files selections f or transcription The pipeline is designed to streamline the selec- tion of audio segments for transcription at the district le vel, focusing on metadata utilization, speaker di versity , and balanced language represen- tation. By incorporating statistical analysis, ran- dom sampling, and transcript-based strategies, it ensures fair and comprehensi ve audio file selec- tion. Segment selection follows systematic ap- proaches that prioritize linguistic div ersity and equitable speaker representation while av oiding ov er-representation of dominant demographics. T ranscript-based selection and threshold checks further enhance balance across multiple languages and districts. The iterative process dynamically adjusts to achiev e target duration thresholds with- out compromising di versity . District-le vel analysis identifies data cov erage gaps through calculated selection rates, ensuring uniform data collection and av oiding the neglect of underrepresented regions. Metadata management is a ke y aspect, with selected files recorded along- side attrib utes such as filename, district, language, duration, and selection criteria. This structured ap- proach supports seamless downstream processing and analysis. The workflow includes robust output and log- ging systems that save detailed logs, metadata, and summary statistics in specified directories. These outputs of fer a transparent vie w of selection progress and completion, enabling ef ficient data tracking and ongoing refinement. 6.1.4 A utomated T ranscription Quality control Stage 1 - Pre Initial Check The transcription data under goes rigorous quality checks to ensure accuracy and consistency . Each segment and its associated metadata are scruti- nized for potential errors. The checks v alidate that segment names and transcriber IDs are correctly assigned, and the segment duration aligns with the number of words, flagging se gments where the word count falls belo w a defined threshold. T ranscriptions are ev aluated for the presence of in- v alid elements such as numbers, incomplete sen- tences, or missing punctuation like open or un- closed brackets. Additionally , checks ensure that non-nati ve characters are not used, and any miss- ing or mismatched segments between the tran- scription files and the original audio data are iden- tified. The transcription metadata undergoes a parallel v alidation process. Critical fields like T ranscriber ID, Gender, Socio economic, Education, Pincode, and Experience years are v erified for presence and correctness. Errors such as duplicate fields, in- v alid filenames, or missing entries are flagged. Metadata validations extend to logical consistenc y checks, such as ensuring the transcriber’ s age and experience v alues are non-negati ve and that age is greater than or equal to experience. In v alid sym- bols in language-related fields and discrepancies in transcriber information, such as mismatched or missing demographic details, are also highlighted. Finally , checks confirm the proper formatting of metadata files, ensuring no blank lines, incorrect colon usage, or repeated entries within a batch. These thorough validations maintain the reliabil- ity of transcription data for do wnstream use. Stage 2 - Initial Check The transcription data undergoes advanced quality checks to ensure linguistic and structural consis- tency , leveraging both statistical and logical ev al- uations. Each segment is analyzed for adherence to defined thresholds, such as LM loglikelihood, where transcriptions must exhibit linguistic plau- sibility within acceptable bounds. The W ord Er- ror Rate (WER) is also assessed, with segments exceeding predefined thresholds flagged for re- vie w . Scripts used in the transcription are verified for uniformity , ensuring that characters from unin- tended or mixed scripts are not present. A critical ratio analysis ev aluates the relationship between the number of words and segment duration, flag- ging segments that are either too verbose or too sparse relativ e to their length. Additionally , the presence of repeated words is measured, and seg- ments with a high repetition ratio are identified. Language consistency is scrutinized by cross- checking the transcription language with the ex- pected language for the segment. A mismatch trig- gers an error for correction. The geographic rele- v ance of the transcription is also validated, com- paring pincode information against the expected region. A significant difference between the pin- code in the transcription metadata and the desig- nated area triggers a warning. These checks col- lecti vely ensure that the transcriptions are linguis- tically accurate, structurally coherent, and con- textually rele v ant, contrib uting to a high-quality dataset for do wnstream applications. 6.2 Manual Quality contr ol T o ensure ef fecti ve quality control, we ha ve assembled and trained a team of v alidators from across the districts, supervised by experienced data annotation professionals from across hailing from dif ferent nativ e languages. Data v alidation is carried out at the district lev el by v alidators from each respecti ve district. A multi-le vel quality check process is in place to guarantee the highest data quality . The first lev el of quality checks is conducted by the experts, with random samples being revie wed by a supervisor . If quality issues are identified greater than a set threshold (10 percent), the entire dataset is sent for further v al- idation by additional experts to ensure accuracy and consistency . 6.2.1 A udio In this manual quality check for audio, sev eral im- portant aspects are assessed to ensure clarity and rele vance. First, it is confirmed that humans are speaking in the audio and that only one person is speaking about the image. The speaker’ s gender is identified, and the language expert af firms that the audio is understandable. Additionally , the speaker is identified as someone from the district, ensuring contextual accuracy . The audio is free from dis- turbances that could hinder comprehension, and it sounds like a complete, coherent sentence. Fur- thermore, it is verified that the audio content is rele vant to the image, and no flags were raised on the speaker’ s appropriateness. Priv acy and con- fidentiality are also prioritized by ensuring there is no personally identifiable information (PII) in the image or audio files. This process helps main- tain high standards of transcription and ensures the quality and rele vance of the audio content. 6.2.2 T ranscription T o ensure the quality of speech transcription, a thorough manual check is conducted with the help of a language expert. This process inv olves veri- fying that the transcribed text exactly matches the audio, ensuring the script aligns with the language being spoken. The language expert also checks for repetition of words, confirming that the tran- scription remains fluent and without unnecessary redundancy . Additionally , the nature of the speech is assessed to confirm whether it is natural, as op- posed to unnatural, read, or guided speech, ensur- ing authenticity in transcription. Priv acy and con- fidentiality are also prioritized by ensuring there is no personally identifiable information (PII) in the image or audio files. These steps, supported by the language expert’ s insights, contribute to the accu- racy and reliability of the transcription process. 7 Conclusions and Futur e work W e present a multimodal dataset comprising 31,270 hours of audio and 2,067 hours of tran- scriptions, collected using approximately 289K images. The dataset is accompanied by rich meta- data and has undergone a thorough curation pro- cess. Our limited experiments demonstrate the utility of the data across different modalities. W e plan to expand data collection to additional dis- tricts and release the dataset to support a more in- clusi ve Digital India. References Rosana Ardila, Megan Branson, Kelly Da vis, Michael Henretty , Michael K ohler, Josh Meyer , Reuben Morais, Lindsay Saunders, Francis M T yers, and Gregor W eber . 2019. Common voice: A massiv ely-multilingual speech corpus. arXiv pr eprint arXiv:1912.06670 . Arun Baby , Anju Leela Thomas, NL Nishanthi, TTS Consortium, et al. 2016. Resources for in- dian languages. In Pr oceedings of T ext, Speech and Dialogue . Ad Backus. 1999. Mixed nativ e languages: A challenge to the monolithic view of language. T opics in Language Disor ders , 19(4):11–22. Anish Bhanushali, Grant Bridgman, Deekshitha G, Prasanta Ghosh, Pratik Kumar , Saurabh Ku- mar , Adithya Raj K olladath, Nithya Ravi, Aa- diteshwar Seth, Ashish Seth, Abhayjeet Singh, Vrunda Sukhadia, Umesh S, Sathvik Udupa, and Lodagala V . S. V . Durga Prasad. 2022. Gram V aani ASR Challenge on spontaneous telephone speech recordings in re gional v ari- ations of Hindi . In Interspeech 2022 , pages 3548–3552. Kaushal Bhogale, Abhigyan Raman, T ahir Javed, Sumanth Doddapaneni, Anoop Kunchukuttan, Pratyush Kumar , and Mitesh M Khapra. 2023. Ef fectiv eness of mining audio and text pairs from public data for improving asr systems for lo w-resource languages. In ICASSP 2023-2023 IEEE International Confer ence on Acoustics, Speech and Signal Pr ocessing (ICASSP) , pages 1–5. IEEE. Alan W Black. 2019. Cmu wilderness multi- lingual speech dataset. In ICASSP 2019-2019 IEEE International Confer ence on Acoustics, Speech and Signal Pr ocessing (ICASSP) , pages 5971–5975. IEEE. Eric Brewer , Michael Demmer , Bowei Du, Melissa Ho, Matthew Kam, Sergiu Nedevschi, Joyojeet Pal, Rabin Patra, Sonesh Surana, and K evin Fall. 2005. The case for technology in de veloping regions. Computer , 38(6):25–38. Alexis Conneau, Min Ma, Simran Khanuja, Y u Zhang, V era Axelrod, Siddharth Dalmia, Jason Riesa, Clara Riv era, and Ankur Bapna. 2023. Fleurs: Fe w-shot learning ev aluation of uni versal representations of speech. In 2022 IEEE Spoken Language T echnology W orkshop (SLT) , pages 798–805. IEEE. Anuj Diwan, Rakesh V aideeswaran, Sanket Shah, Ankita Singh, Srini v asa Raghav an, Shreya Khare, V init Unni, Saurabh Vyas, Akash Ra- jpuria, Chiranjeevi Y arra, Ashish Mittal, Pras- anta Kumar Ghosh, Preethi Jyothi, Kalika Bali, V iv ek Seshadri, Sunayana Sitaram, Samarth Bharadwaj, Jai Nanav ati, Raoul Nanav ati, and Karthik Sankaranarayanan. 2021a. Mucs 2021: Multilingual and code-switching asr challenges for lo w resource indian languages . In Inter- speech 2021 . ISCA. Anuj Diwan, Rakesh V aideeswaran, Sanket Shah, Ankita Singh, Srini v asa Raghav an, Shreya Khare, V init Unni, Saurabh Vyas, Akash Ra- jpuria, Chiranjeevi Y arra, Ashish Mittal, Pras- anta Kumar Ghosh, Preethi Jyothi, Kalika Bali, V iv ek Seshadri, Sunayana Sitaram, Samarth Bharadwaj, Jai Nanav ati, Raoul Nanav ati, and Karthik Sankaranarayanan. 2021b. MUCS 2021: Multilingual and Code-Switching ASR Challenges for Lo w Resource Indian Lan- guages . In Interspeech 2021 , pages 2446–2450. Arjun Gangwar , S Umesh, Rithik Sarab, Akhilesh K umar Dubey , Govind Div akaran, Suryakanth V Gangashetty , et al. 2023. Spring- inx: A multilingual indian language speech corpus by spring lab, iit madras. arXiv pr eprint arXiv:2310.14654 . GTS.AI. 2025. AI Data Solutions for Machine Learning. https://gts.ai . Accessed: 2025-08-03. Jonathan Ho, Ajay Jain, and Pieter Abbeel. 2020. Denoising dif fusion probabilistic models . Gov ernment of India. 2011. Census of india 2011: Languages. https://censusindia. gov.in . Accessed: 2024-12-07. Gov ernment of India. n.d. The con- stitution of india: Eighth schedule. https://legislative.gov.in/ constitution- of- india . Accessed: 2024-12-07. T ahir Jav ed, Kaushal Bhogale, Abhigyan Raman, Pratyush Kumar , Anoop Kunchukuttan, and Mitesh M Khapra. 2023. Indicsuperb: A speech processing uni versal performance benchmark for indian languages. In Pr oceedings of the AAAI Confer ence on Artificial Intelligence , vol- ume 37, pages 12942–12950. T ahir Ja ved, Janki Atul Naw ale, Eldho It- tan Geor ge, Sakshi Joshi, Kaushal Santosh Bhogale, Deovrat Mehendale, Ishvinder V iren- der Sethi, Aparna Ananthanarayanan, Haf- sah Faquih, Pratiti P alit, et al. 2024. In- dicvoices: T owards building an inclusiv e mul- tilingual speech dataset for indian languages. arXiv pr eprint arXiv:2403.01926 . Karya. 2025. AI Solutions for Language Under- standing. https://www.karya.in . Ac- cessed: 2025-08-03. A yesha Kidw ai. 2019. The people’ s linguistic sur- ve y of india volumes: Neither linguistics, nor a successor to grierson’ s lsi, but still a point of reference. Social Change , 49(1):154–159. Arun Kumar and Sheetal K Agarwal. 2012. Spo- ken web: using v oice as an accessibility tool for disadvantaged people in dev eloping regions. A CM SIGACCESS Accessibility and Comput- ing , 104:3–11. Saurabh Kumar , Abhayjeet Singh, Jesuraj Ban- dekar , Savitha Murthy , Sumit Sharma, Sand- hya Badiger , Sathvik Udupa, Amala Nagireddi, Srini vasa Raghav an KM, Rohan Saxena, et al. 2024. RESPIN-S1.0: A read speech corpus of 10000+ hours in dialects of nine Indian Lan- guages. In The Thirty-ninth Annual Confer - ence on Neural Information Pr ocessing Systems Datasets and Benchmarks T rac k . Alycia Lee, Brando Miranda, and Sanmi Ko yejo. 2023. Beyond scale: The div ersity coefficient as a data quality metric demonstrates llms are pre-trained on formally di verse data . arXiv pr eprint arXiv:2306.13840 . Megdap. 2025. AI Solutions for Language Un- derstanding. https://megdap.com . Ac- cessed: 2025-08-03. NVIDIA. 2025. parakeet-tdt-0.6b-v2. https://huggingface.co/nvidia/ parakeet- tdt- 0.6b- v2 . Accessed: 2025-02-18. Alec Radford, Jong W ook Kim, T ao Xu, Greg Brockman, Christine McLea ve y , and Ilya Sutske ver . 2022. Robust speech recognition via large-scale weak supervision . Pingali Sailaja. 2012. Indian English: Features and sociolinguistic aspects. Language and Lin- guistics Compass , 6(6):359–370. Shaip. 2025. AI T raining Data for Machine Learn- ing Models. https://www.shaip.com . Accessed: 2025-08-03. Michael C Shapiro and Harold F Schiffman. 2008. Language and society in South Asia , volume 1. Motilal Banarsidass Publishe. Gemma T eam. 2025. Gemma 3n . Michael Tschannen, Alexe y Gritsenko, Xiao W ang, Muhammad Ferjad Naeem, Ibrahim Alabdulmohsin, Nikhil Parthasarathy , T alfan Ev ans, Lucas Beyer , Y e Xia, Basil Mustafa, et al. 2025. Siglip 2: Multilingual vision- language encoders with improv ed semantic un- derstanding, localization, and dense features. arXiv pr eprint arXiv:2502.14786 . Ashish V aswani, Noam Shazeer , Niki Parmar , Jakob Uszkoreit, Llion Jones, Aidan N Gomez, Łukasz Kaiser , and Illia Polosukhin. 2017. At- tention is all you need. Advances in neural in- formation pr ocessing systems , 30. Shaomei W u, Kimi W enzel, Jingjin Li, Qisheng Li, Alisha Pradhan, Raja Kushalnagar , Colin Lea, et al. 2025. Speech ai for all: Promoting accessibility , fairness, inclusi vity , and equity . In Pr oceedings of the Extended Abstracts of the CHI Confer ence on Human F actors in Comput- ing Systems , pages 1–6. A T ranscription Guidelines V aani Audio T ranscription Guidelines (Last up- dated: Oct 3, 2022) The follo wing transcription guidelines are adapted from the Digital India Bhashini Project (Sep 12, 2022 version), which in turn are inspired by similar guidelines created by a commercial transcription agency and by NIST . General Prin- ciples T ranscribe a word only if you can hear and understand it properly . If the spoken word/text cannot be understood due to the speaker’ s man- ner of speech then mark it as [unintelligible]. On the other hand, if the spoken text cannot be heard due to poor recording, volume or noise then mark it as [inaudible]. An audio segment will be con- sidered as in valid if more than 25Do not para- phrase the speech. Do not correct grammatical er- rors made by the speakers. In the case of misspo- ken words, transcribe the one with a spelling mis- take followed by the correct spelling within curly braces. Example: If a speaker pronounces "remu- neration" as “renumeration” then it should still be transcribed as “renumeration remuneration”. Do not expand spoken short forms (e.g., ain’t, don’t, can’t, it should be retained as it is) Retain collo- quial slang as it is (e.g., gotcha, gonna, wanna, etc). If the spoken words belong to a language that the transcriber does not kno w then it should be tagged as
with the appropriate timestamps. If transcription of a sen- tence contains for more than 25Every pause more than 0.5sec should be transcribed as V erbatim transcrip- tion The speech should be transcribed verbatim. Ho wev er , the follo wing rules should be used for transcribing errors made by the speakers. Errors that should be transcribed as it is: Speech errors: “I was in my office, no sorry , home” should be transcribed as it is. Slang words: kinda, gonna, wanna, etc should be transcribed as it is. Repeti- tions: “I hav e I ha ve got the book” should be tran- scribed as it is. Errors that should be transcribed: False starts: “I, um, er , I was going to the mall” should be tran- scribed as it is. Filler sounds: um, uh, er , hmm, etc. should be transcribed as it is. Stutters: “I w- w-went t-t-to the mall” should be transcribed as it is. Follo wing the guidelines for the SWITCH- BO ARD corpus there should be a hyphen between the stutters as sho wn in the above sentence. Non-speech (acoustic) e vents Fore ground sounds made by the speaker should be transcribed. These include lip smacks, tongue clicks, inhalation and exhalation between words, yawning coughing, throat clearing, sneezing, laughing, chuckling, etc. The categories speci- fied in T able 1 in the guidelines for the SWITCH- BO ARD corpus , should be used. Names, ti- tles, acronyms, punctuations, and numbers Proper names should be transcribed in a case-sensitive manner in applicable languages (e.g., English). Initials should be in capital letters with no period follo wing. For example: “M K Stalin would be sworn in as the Chief Minister”. T itles and abbre- viations are transcribed as words. For example: Dr . → Doctor except if the abbreviated form is pronounced as it is. For example, if the speaker says “ Apple Inc” (instead of “ Apple Incorporate”), the word ’Inc’ should be transcribed. Punctuation marks should be used in transcription as appropri- ate. For example: "don’t" Apart from the letters (or Aksharas) only the following special charac- ters can be used - COMMA (,), FULLSTOP (.), QUESTION MARK (?), APOSTR OPHE (‘). UN- DERSCORE ( ’_’ ) to be used only for acronym (see the next bullet). Purna viram (|) may be used to indicate end of a sentence only . Numbers should be transcribed as they are spo- ken and normalized to word form (no numerals). For e xample: 16 → sixteen, 112 → one hun- dred and twelve. T imes of the day and dates: al- ways capitalize AM and PM (wherev er applica- ble). When using o’clock, spell out the numbers: ele ven o’clock. Incomplete utterances These are utterances which are incomplete because the speaker forgot what he wanted to say or was stopped mid-way and corrected an error or was interrupted by some- one. Indicate such utterances by putting a ‘–’ at the end of the utterance as opposed to a full-stop or question mark. T able 2: f1-scores (%) of our whisper-medium + pooled attention + ANN model across languages on our test set, and two e xternal test sets: FLEURS, and Kathbath. Language V aani T est FLEURS Kathbath Angika 54.4 – – Assamese 98.5 90.8 – Bajjika 71.3 – – Bengali 73.6 88.1 88.6 Bhojpuri 44.2 – – Chakma 95.6 – – Chhattisgarhi 66.5 – – English 93.8 – – Garhwali 67.9 – – Garo 99.2 – – Gujarati 93.8 80.3 78.0 Halbi 82.4 – – Haryan vi 68.8 – – Hindi 25.9 40.0 39.3 Kannada 84.4 93.9 91.1 Khariboli 25.4 – – Khortha 78.5 – – K okborok 94.2 – – K onkani 76.0 – – Kumaoni 28.2 – – Kurukh 88.3 – – Magahi 46.2 – – Maithili 21.0 – – Malayalam 95.6 99.2 98.2 Malv ani 81.6 – – Marathi 65.0 63.2 61.1 Marwari 55.3 – – Nagamese 81.2 – – Nepali 96.8 88.7 – Odia 76.9 74.3 47.0 Punjabi 77.7 87.7 85.2 Rajasthani 61.0 – – Sadri 51.1 – – Sambalpuri 77.4 – – Sumi 81.7 – – Surgujia 58.1 – – Surjapuri 87.7 – – T amil 92.1 97.0 96.9 T elugu 80.8 92.9 95.5 T ulu 90.3 – – Urdu 34.4 33.2 51.0 W ancho 96.5 – – Overall Accuracy 74.8 76.1 65.8
Comments & Academic Discussion
Loading comments...
Leave a Comment