Physics-Informed Neural Networks for Predicting Hydrogen Sorption in Geological Formations: Thermodynamically Constrained Deep Learning Integrating Classical Adsorption Theory
Accurate prediction of hydrogen sorption in fine-grained geological materials is essential for evaluating underground hydrogen storage capacity, assessing caprock integrity, and characterizing hydrogen migration in subsurface energy systems. Classica…
Authors: Mohammad Nooraiepour, Mohammad Masoudi, Zezhang Song
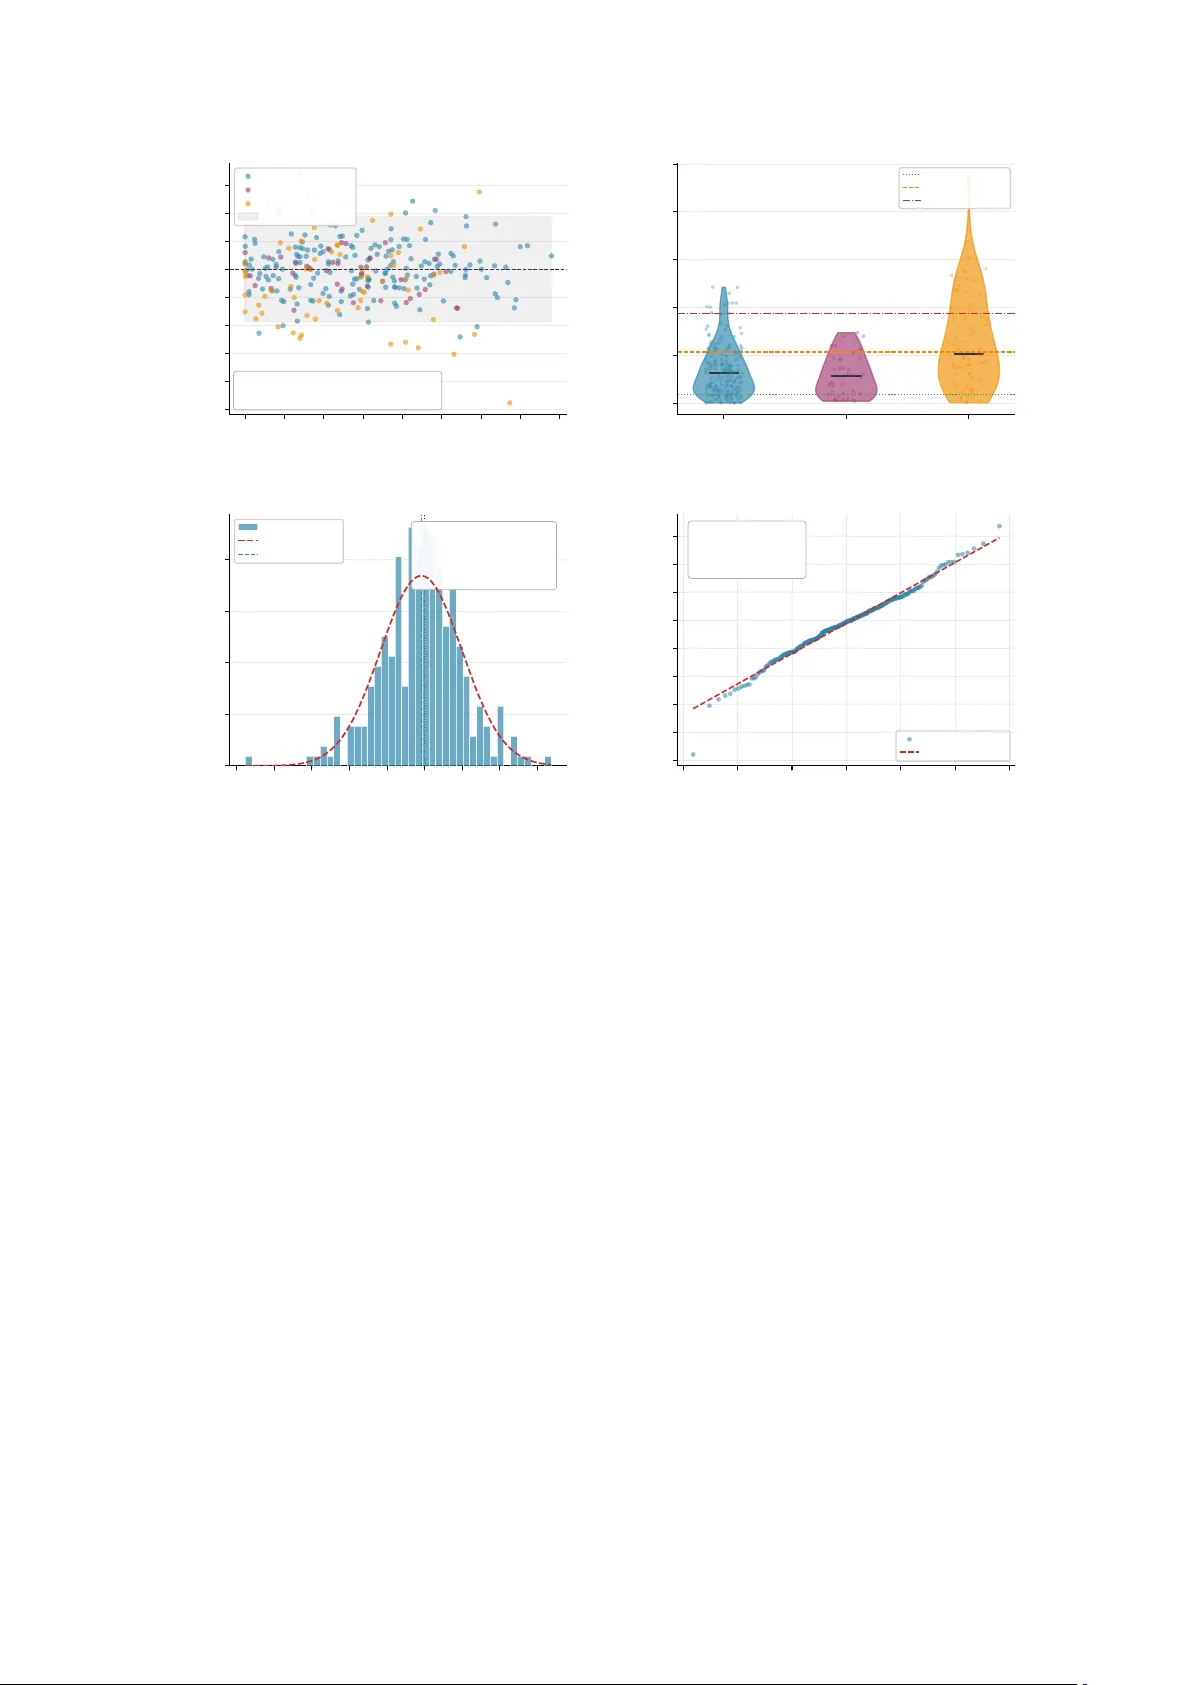
Physics-Informe d Neural Networks for Predicting Hydr ogen Sorption in Geological Formations: Thermodynamically Constrained De ep Learning Integrating Classical Adsorption Theory Mohammad Nooraiepour 1, ∗ , Mohammad Masoudi 1,2 , Zezhang Song 3 , and Helge Hellevang 1 1 Faculty of Mathematics & Natural Sciences, University of Oslo, P .O . Box 1047 Blindern, 0316 Oslo , Norway 2 SIN TEF Industry , Applied Geoscience Department, 7465 Trondheim, Norway 3 College of Geosciences, China University of Petroleum, Beijing 102249, China ∗ Corresponding author: mohammad.nooraiepour@geo.uio.no Abstract Accurate prediction of hy drogen sorption in ne-grained geological materials is essential for evaluating underground hydrogen storage capacity , assessing caprock integrity , and characteriz- ing hydrogen migration in subsurface energy systems. Classical isotherm models succee d at the individual sample level but fail when generalized across heterogeneous populations, with the co e- cient of determination collapsing from 0.80–0.90 for single-sample ts to 0.09–0.38 for aggregated multi-sample datasets, regardless of functional form. W e present a multi-scale physics-informed neural network framework that addresses this limitation by embedding classical adsorption theor y and thermodynamic constraints directly into the learning process. The framework utilizes 1,987 hydrogen sorption isotherm measurements across thr ee lithological classes (clays, shales, coals), supplemented by 224 characteristic uptake measurements. A seven-category physics-informe d feature engineering scheme generates 62 thermodynamically meaningful descriptors from raw material characterization data. The loss function enforces saturation limits, monotonic pressure response, and V an’t Ho temperature dependence through penalty weighting, while a three-phase curriculum training strategy ensures stable integration of competing physical constraints. An architecture-diverse ensemble of ten members provides calibrated uncertainty quantication, with post-hoc temperature scaling achieving target prediction interval coverage . The optimized PINN achieves R 2 = 0.9544, RMSE = 0.0484 mmol/g, and MAE = 0.0231 mmol/g on the held-out test set, with 98.6% monotonicity satisfaction and zero non-physical negative predictions. Physics-informed regularization yields a 10–15% cross-lithology generalization advantage over a well-tuned random forest under leave-one-lithology-out validation, conrming that thermodynamic constraints transfer meaningfully across geological boundaries. The framework is directly extensible to competitive mul- ticomponent sorption, cyclic injection-withdrawal mo deling, and integration with molecular-scale simulations, providing a transferable computational foundation for accelerating the safe deployment of underground hydrogen energy infrastructur e. Ke ywords: Underground hydrogen storage; Hydrogen sorption; Thermodynamic constraints; Classical adsorption isotherms; Deep learning; Feature engineering ; Uncertainty quantication; Physics-informed neural networks; Clay minerals; Shale; Coal. 1 1 Introduction The global transition to low-carbon energy systems represents one of the dening challenges of the 21st century , driven by climate change mitigation imperatives and the need to reduce fossil fuel dependence. Central to this transformation is the development of reliable, scalable energy storage te chnologies capable of addressing the intermittency inherent to rene wable sources such as wind and solar [ 1 , 2 ]. Underground hy drogen storage (UHS) has emerged as a particularly promising appr oach for large-scale energy management, utilizing subsurface geological formations as gigawatt-scale repositories that enable both short- and long-term energy buering, grid stabilization, and seasonal load balancing [ 3 – 6 ]. By facilitating hydrogen’s integration as a clean, high-energy-density carrier , UHS plays a critical role in global decarbonization pathways. Howev er , the ecacy of UHS, and indee d numerous other subsurface applications, depends funda- mentally on understanding hydrogen-r ock interactions at the uid-mineral interface. These interactions govern processes across diverse geo-energy and geo-environmental contexts, including natural hy- drogen exploration and in situ generation, hy drogen farming, enhanced geothermal systems, and the long-term containment of radioactive or hazardous waste [ 7 – 14 ]. Among the key physicochemical processes at play , hydrogen sorption and desorption exert profound inuence on system performance, yet remain inadequately characterized—particularly in ne-grained sedimentar y formations. Fine-grained rocks, including clay-rich mudstones, organic-rich shales, and coal seams, are ubiqui- tous in sedimentar y basins and exhibit highly variable p etrophysical properties governed by microstruc- tural and compositional heterogeneity [ 15 – 22 ]. In UHS contexts, sorption-desorption mechanisms directly inuence storage capacity , with materials such as kerogen-rich shales and coals demonstrating signicant hydrogen retention potential due to high surface areas, micropore volumes, and organic content [ 23 – 27 ]. Notably , hydrogen exhibits lower sorption anity than CO 2 or CH 4 in coal matrices, motivating innovative co-injection strategies for combine d hydrogen storage and carbon se questration [ 28 , 29 ]. Beyond storage capacity , sorption dynamics govern hydrogen migration through caprocks and sealing formations, directly impacting containment eciency , leakage risk assessment, and migration pathway prediction in natural hydrogen systems [ 14 , 30 – 32 ]. In radioactive waste repositories, where hydrogen generation from canister corrosion or organic matter degradation poses integrity risks, clay- rich formations such as Callov o-Oxfordian claystone or Opalinus Clay rely on sorption pr operties to mitigate gas migration and prev ent pressure-induced fracturing [ 11 , 12 , 33 – 35 ]. Predicting hydrogen sorption-desorption behavior in ge ological media p oses substantial challenges. The process is gov erned by complex, nonlinear interactions among mineralogical composition, pore architecture, surface chemistry , micropore v olume, and moisture content [ 13 , 27 , 31 , 36 ]. In ne-grained systems, additional phenomena, including clay swelling, capillary condensation, and pronounced hysteresis—further complicate mechanistic understanding [ 27 ]. Traditional characterization methods, primarily volumetric and gravimetric te chniques [ 37 ], pro vide foundational insights but suer fr om inherent limitations: they ar e time-intensive, costly , technically demanding, and susceptible to signicant measurement errors [ 37 ]. Moreover , standard protocols typically employ dried, powdered samples that fail to capture the intrinsic heterogeneity , structural anisotropy , and uid saturation eects characteristic of in situ reservoir conditions [ 27 , 38 , 39 ]. As demand grows for rapid, accurate assessments of hydrogen storage potential across diverse geological settings, ther e is an urgent ne ed for computational methodologies that overcome these e xperimental constraints while maintaining physical rigor . 2 Machine learning (ML) oers transformative p otential for modeling the high-dimensional, nonlinear relationships inherent to geochemical systems [ 40 – 44 ]. Implemented architectures, including ensemble methods and deep neural networks, have demonstrated success in predicting complex subsurface processes through pattern recognition and robust feature extraction [ 44 – 48 ]. However , purely data- driven approaches oen prioritize empirical accuracy over physical consistency [ 49 – 51 ], resulting in models that may violate fundamental thermodynamic principles, exhibit non-physical extrapolation behavior , or lack interpretability—critical shortcomings for scientic and engineering applications where mechanistic understanding and regulatory condence are paramount. T o address these challenges, w e develop a physics-informe d neural network (PINN) framework that integrates classical adsorption theory with deep learning architectures. Our approach embeds established isotherm mo dels directly into the loss function, ensuring predictions satisfy fundamental physical constraints such as saturation limits, monotonic uptake b ehavior , and thermodynamic consistency . Thermodynamic rigor is further enforced through V an’t Ho analysis [ 52 ] and isosteric heat calculations via the Clausius-Clapeyron equation [ 53 ]. The model leverages multi-category feature engineering to capture thermodynamic state variables, pore structure descriptors, surface chemistry parameters, and kinetic properties across thr ee distinct lithological classes: clays, shales, and coals. W e employ deep residual networks (ResNet) augmented with multi-head attention me chanisms to extract hierarchical feature representations and captur e complex, non-additive interactions among input variables, thereby enhancing generalization across diverse compositional and environmental conditions. The framework is trained and validated on a comprehensive laborator y dataset of hydrogen sorption isotherms and adsorption potential in clays, shales, and coals samples spanning pressures up to 200 bar , temperatures from 0 ° C to 90 ° C , and diverse mineralogical and textural properties ( e.g., BET surface areas spanning three orders of magnitude, variable micropore v olumes, clay mineralogy), as presented in [ 27 ]. This dataset is constructed to b e both statistically robust and physically representativ e of realistic subsurface scenarios, ensuring model predictions remain plausible under operational conditions. V alidation employs k-fold cross-validation, supplemented by physics-constrained synthetic benchmarks, to provide performance assessment under both interpolative and controlled extrapolative scenarios. The contributions of this study are threefold. First, we present a PINN architecture that delivers accurate, interpretable adsorption predictions grounded in both empirical evidence and physical law , yielding not only isotherm pr edictions but also meaningful sorption parameters (e.g., Langmuir volumes, adsorption anities) that inform engineering design and geological risk assessment. Se cond, w e demon- strate substantial improv ements in scalability and eciency relative to both traditional experimental campaigns and purely empirical ML models, enabling rapid screening of hydr ogen storage potential using readily obtainable rock-matrix descriptors and thermodynamic conditions. Third, the frame- work is inher ently extensible: it can be adapted to multicomponent gas systems (e.g., H 2 –CH 4 –CO 2 mixtures) for competitive sorption modeling, extended to cyclic sorption-desorption pr edictions for operational lifetime assessments, and interface d with pore-scale simulation to ols (molecular dynamics, grand canonical Monte Carlo) to enable multiscale understanding of hydrogen behavior in porous media. Ultimately , this work establishes a robust, physics-informed computational framework for evaluating hydrogen sorption in clay- and organic-rich geological formations, bridging theoretical understanding and data-driven prediction to accelerate the development of safe, ecient hydrogen energy infrastructure. 3 2 Relevant Theor y Accurate prediction of hydrogen sorption in geological formations requires integrating classical ad- sorption theory with thermodynamic principles to ensure physically consistent results. This section establishes the theoretical foundation for our physics-informed neural network (PINN) frame work by presenting: (i) the statistical-mechanical basis of adsorption equilibria, (ii) classical isotherm models and their applicability to dier ent lithologies, and (iii) thermodynamic constraints that enforce physical consistency in data-driven predictions. These the oretical elements are subsequently emb edded into the PINN loss function to ensure that mo del predictions satisfy fundamental physical laws, including saturation limits, monotonic pressure response, and temperature-dependent behavior governed by V an’t Ho and Clausius-Clapeyron relations. 2.1 Statistical-Mechanical Foundations Adsorption equilibria emerge fr om the minimization of the grand p otential at constant temperature , volume, and chemical potential [ 54 , 55 ]. The grand potential Ω is dened as: Ω = A − µN (1) where A is the Helmholtz free energy , µ is the chemical potential of the adsorbate in the bulk gas phase, and N is the number of adsorbe d molecules. At equilibrium, ∂ Ω /∂ N | T ,V ,µ = 0 , establishing equality between the chemical potentials of the bulk and adsorb ed phases. This condition fundamentally links the bulk gas pressure to the surface e xcess concentration. The chemical potential of an ideal gas is expressed as µ = µ ◦ + RT ln( p/p ◦ ) , where µ ◦ is the standard chemical potential, p is pressure , and p ◦ is the reference pressure. For real gases at elevated pressures, the fugacity f replaces pressure , with µ = µ ◦ + RT ln( f /p ◦ ) . This relationship be comes essential when modeling hydrogen sorption at high pressures, where non-ideal behavior cannot be neglected. Statistical mechanics provides the bridge b etween molecular-scale interactions and macroscopic adsorption behavior through the grand canonical partition function Ξ [ 56 – 58 ]: Ξ( T , V , µ ) = ∞ X N =0 Q ( N , V , T ) e β µN (2) where Q ( N , V , T ) is the canonical partition function for N adsorbed molecules, β = 1 / ( k B T ) , and k B is the Boltzmann constant. The average number of adsorbed molecules is obtained via ⟨ N ⟩ = k B T ( ∂ ln Ξ /∂ µ ) T ,V . For a system of non-interacting adsorption sites with uniform binding energy ϵ , this formalism directly yields the Langmuir isotherm. Extensions to heterogeneous surfaces with a distribution of binding energies g ( ϵ ) produce more complex isotherm shapes, including the Freundlich and T emkin forms. More sophisticated treatments emplo y density functional theory (DFT) to account for both uid- solid and uid-uid correlations, enabling prediction of density proles ρ ( r ) within conned geometries characteristic of nanoporous shales and coals [ 59 ]. While molecular-scale simulations (grand canonical Monte Carlo, molecular dynamics) provide detailed insights into hydr ogen behavior in specic pore 4 structures, the y remain computationally prohibitive for rapid screening across diverse ge ological scenarios. This motivates our dev elopment of a PINN framew ork that captures the essential physics through classical models while maintaining computational eciency . 2.2 Classical Equilibrium Isotherms Classical isotherm models provide functional forms relating gas pressure to adsorb ed quantity , each with distinct assumptions about surface pr operties and adsorption mechanisms. T able 1 presents an overview of nine fundamental models outlined in this se ction, highlighting their parameter counts, applicable pressure ranges, key features, and optimal lithological applications. Understanding the physical basis and limitations of each model is essential for selecting appropriate functional forms within the PINN framework and for interpr eting the learned parameters in terms of material properties. 2.2.1 Henry’s Law At suciently low pressures, where surface cov erage is dilute and adsorbate-adsorbate interactions are negligible, adsorption follows a linear r elationship [ 60 ]: Q ( p ) = K H p (3) where Q is the adsorb ed amount (mol kg − 1 ), p is pressure (Pa), and K H is Henr y’s constant (mol kg − 1 Pa − 1 ). This relationship represents the initial slop e of all physical adsorption isotherms and is thermodynamically consistent with the limit of innite dilution. Henry’s constant is directly related to the adsorbate-surface interaction energy and pro vides fundamental insights into hydrogen solubility in formation waters and w eak physisorption on mineral surfaces. While applicable only at ver y low pressures ( < 0.1 MPa), Henry’s law ser ves as an important b oundary condition for validating isotherm models in the dilute limit. 2.2.2 Langmuir Mo del The Langmuir model assumes monolayer adsorption on a homogeneous surface with identical, non- interacting sites [ 61 ]: Q ( p ) = Q max K L p 1 + K L p (4) where Q max (mol kg − 1 ) represents the monolay er saturation capacity and K L (Pa − 1 ) is the Langmuir equilibrium constant, related to the adsorption energy . A s pressur e increases, Q asymptotically ap- proaches Q max , reecting complete surface coverage. The model provides a clear physical interpretation: Q max is proportional to the number of available adsorption sites, while K L reects the anity b etween hydrogen and the surface. The Langmuir model performs well for adsorption on homogeneous clay minerals and certain shales at moderate pressures (0.1 to 10 MPa), where monolayer coverage dominates. Howev er , it oen fails to capture b ehavior on heterogeneous surfaces or at very high pressures where multilayer adsorption or pore-lling mechanisms become signicant. 5 2.2.3 Freundlich Model The Freundlich model is an empirical power-law r elationship developed for heterogeneous surfaces [ 62 ]: Q ( p ) = K F p 1 /n , n > 1 (5) where K F (mol kg − 1 Pa − 1 /n ) is the Freundlich capacity factor and n (dimensionless) is the heterogeneity parameter . V alues of n > 1 indicate favorable adsorption, with larger n reecting greater surface heterogeneity . Unlike Langmuir , this model do es not predict saturation, making it suitable only for intermediate pressure ranges. The power-law form arises naturally from assuming an exponential distribution of adsorption site energies. The Freundlich model is particularly useful for describing geological materials, where surface heterogeneity and pore-size distributions lead to a broad spectrum of binding energies. Its primar y limitation is the lack of a thermo dynamically consistent saturation limit, which renders it unsuitable for high-pressur e extrapolation. 2.2.4 Brunauer-Emmett- T eller (BET) Model The BET model extends Langmuir theor y to multilayer adsorption, accounting for adsorbate-adsorbate interactions beyond the rst layer [ 63 ]: Q ( p ) = Q m C p p 0 1 − p p 0 h 1 + ( C − 1) p p 0 i (6) where Q m (mol kg − 1 ) is the monolay er capacity , C is a constant r elated to the net heat of adsorption in the rst layer ( C = exp[( E 1 − E L ) / ( RT )] , where E 1 is the rst-layer adsorption energy and E L is the heat of liquefaction), and p 0 is the saturation vapor pressure at temperatur e T . The BET model is foundational in surface area analysis, typically applied to nitrogen adsorption isotherms at 77 K within the relativ e pressure range 0 . 05 < p/p 0 < 0 . 35 . For thermodynamic conditions, where T > T c (critical temperature 33 K), the concept of saturation pressure be comes problematic, limiting direct application of the BET model. Nevertheless, BET -derived surface ar eas remain valuable input featur es for predicting sorption capacity . 2.2.5 T emkin Model The T emkin model accounts for indirect adsorbate-adsorbate interactions by assuming the heat of adsorption decreases linearly with surface coverage [ 64 ]: Q ( p ) = RT b T ln( K T p ) (7) where b T ( J mol − 1 ) is related to the variation in adsorption energy and K T (Pa − 1 ) is the T emkin equilibrium constant. This logarithmic form reects the energetic heterogeneity arising from repulsive interactions between adsorb ed molecules or surface p otential variations. The T emkin model is particu- larly relevant for adsorption on charged clay mineral surfaces (montmorillonite, illite) and hydrated interlayer sites, where electrostatic eects modulate binding energies. Its applicability is generally limited to intermediate coverage ranges, as it predicts unphysical behavior at very low and v ery high 6 pressures. 2.2.6 T oth Model The T oth model incorporates surface heterogeneity through a modied saturation function [ 65 – 67 ]: Q ( p ) = Q max p ( b + p t ) 1 /t (8) where Q max (mol kg − 1 ) is the saturation capacity , b (Pa t ) is a parameter related to adsorption anity , and t (dimensionless, 0 < t ≤ 1 ) quanties surface heterogeneity . When t = 1 , the T oth mo del reduces to the Langmuir form, while t < 1 represents increasingly heter ogeneous surfaces. This model provides e xcellent ts across an extended pr essure range (0.1 to 20 MPa) and is particularly eective for describing heterogeneous matrices with mixed mineralogy and variable pore sizes, which create a distribution of adsorption energies. 2.2.7 Sips (Langmuir-Freundlich) Model The Sips model combines Langmuir saturation behavior with Freundlich-type heterogeneity [ 68 ]: Q ( p ) = Q max ( K S p ) 1 /n s 1 + ( K S p ) 1 /n s (9) where K S (Pa − 1 ) is the Sips e quilibrium constant and n s (dimensionless, n s ≥ 1 ) is the heterogeneity ex- ponent. This mo del interpolates between Freundlich behavior at low pressures (wher e the denominator approaches unity) and Langmuir-like saturation at high pressures. The Sips model is particularly suitable where surface heterogeneity is pronounced, but a well-dened saturation capacity exists. Its three- parameter form provides sucient exibility to capture comple x isotherm shapes while maintaining thermodynamic consistency through the saturation limit. 2.2.8 Redlich-Peterson Model The Redlich-Peterson model oers a generalized three-parameter framework that encompasses b oth Langmuir and Freundlich behavior [ 69 ]: Q ( p ) = K RP p 1 + A RP p β (10) where K RP (mol kg − 1 Pa − 1 ), A RP (Pa − β ), and β ( 0 < β ≤ 1 ) control isotherm cur vature and saturation behavior . When β = 1 , the model reduces to Langmuir with Q max = K RP / A RP and K L = A RP . When A RP p β ≪ 1 , it approaches Freundlich behavior with K F = K RP and exponent β . This versatility enables the Re dlich-Peterson model to describe sorption over a ver y wide pressure range (0.01 to 30 MPa) in heterogeneous geological me dia. Howe ver , its exibility comes at the cost of parameter identiability: the thr ee parameters can exhibit strong corr elations during optimization, potentially leading to multiple local minima and reduced physical interpretability . 7 2.2.9 Dubinin-Radushkevich (D-R) Model The Dubinin-Radushkevich model describ es micropore lling through a Gaussian distribution of adsorption potentials [ 70 ]: Q ( p ) = Q s exp − B ϵ 2 , ϵ = R T ln 1 + 1 p (11) where Q s (mol kg − 1 ) is the micropore saturation capacity , B (mol 2 J − 2 ) is related to the mean adsorption energy , and ϵ ( J mol − 1 ) is the adsorption p otential. The D-R model is particularly valuable for analyzing pore lling, rather than surface coverage, which gov erns uptake. The parameter B can be related to the characteristic energy of adsorption, E = 1 / √ 2 B , providing insights into the strength of adsorbate- adsorbent interactions. The D-R mo del is most accurate at medium to high pressures (1 to 20 MPa), where micropore saturation becomes the dominant mechanism. T able 1: Comparison of classical adsorption isotherm models for hydrogen sorption prediction. The table summarizes nine fundamental isotherm models, presenting their applicable pressure ranges, distinguishing features, primary advantages, optimal lithological applications, and parameter identiability characteristics. Model Param. Pressure Range Ke y Features Advantages Best Applica- tion Parameter Identia- bility Henry’s Law 1 V ery low Linear , dilute gas Thermodynamic ba- sis, simple Initial slope analysis High Langmuir 2 Low to medium Monolayer , uniform sites Physical meaning, well-dened Shales (mono- layer) High Freundlich 2 Wide range Empirical power- law Heterogeneity cap- ture Coals (microp- orous) Medium BET 2 Low relative Multilayer forma- tion Surface area analysis N 2 characteriza- tion Medium T emkin 2 Medium Heat de creases lin- early Interaction energet- ics Charged clay minerals Medium T oth 3 Wide range Modied saturation Extended pressure ts Heterogeneous surfaces Medium Sips 3 Wide range Langmuir + hetero- geneity Mixed mineralogies Clays (heteroge- neous) Medium Redlich- Peterson 3 V ery wide range Langmuir- Freundlich hybrid Maximum versatility Universal tting Low Dubinin- Radushkevich 2 Medium to high Micropore lling Pore volume analysis Micropore char- acterization Medium Note: Pressure range descriptors for hy drogen sorption under supercritical conditions: V er y low ( < 0.1 MPa), Low (0.1–1 MPa), Medium (1–10 MPa), High (10–20 MPa), Wide (0.1–20 MPa), V ery wide (0.01–30 MPa). BET model applies to relativ e pressure ( p/p 0 ) range 0.05–0.35, primarily used for nitrogen adsorption at 77 K. Parameter identiability indicates the reliability of obtaining unique, well-constrained parameter values during model tting: High denotes well-separated, independent parameters with unique solutions; Medium indicates moderate parameter correlation with generally stable ts; Low reects high parameter correlation and potential multiple local optima during optimization. 2.3 Thermodynamic Constraints and T emperature Dep endence T o ensure physically consistent pr edictions, the PINN framework must incorp orate thermodynamic principles that govern the temperature dependence of adsorption equilibria and establish b ounds on model b ehavior . Three key relationships are enforced: the V an’t Ho equation for temp erature- dependent equilibrium constants, the Clausius-Clap eyron equation for isosteric heat of adsorption, and 8 thermodynamic consistency constraints. 2.3.1 V an’t Ho Relationship The temperature dependence of adsorption e quilibrium constants follows the V an’t Ho e quation [ 52 ]: d ln K d (1 /T ) = − ∆ H ◦ R (12) where K is the equilibrium constant ( e.g., K L , K S , K T ), ∆ H ◦ is the standard enthalpy of adsorption ( J mol − 1 ), R is the gas constant, and T is absolute temperature (K). For exothermic adsorption ( ∆ H ◦ < 0 ), K decreases with increasing temperature, reducing sorption capacity at elevated temp eratures. Integration of Equation 12 yields: K ( T ) = K 0 exp − ∆ H ◦ RT (13) where K 0 is a pre-exponential factor . This relationship is embedde d into the PINN loss function to ensure that predicted temperature dependencies are thermodynamically consistent. Physically reasonable values of ∆ H ◦ for hydrogen physisorption on geological materials are expected to show weak van der W aals interactions. 2.3.2 Isosteric Heat of Adsorption The isosteric heat of adsorption, q st , quanties the dierential enthalpy change upon adsorbing an additional molecule at constant surface coverage. It is obtained from the Clausius-Clapeyron equation applied to adsorption isotherms measured at multiple temperatures [ 53 ]: q st = − R ∂ ln p ∂ (1 /T ) Q (14) where the derivative is taken at constant adsorbe d amount Q . In practice, q st is calculated from experimental isotherms by plotting ln p versus 1 /T at xed Q values; the slope yields − q st /R . For heterogeneous surfaces, q st typically decreases with increasing coverage as high-energy sites are occupied rst. The PINN framew ork can enforce that predicted q st values remain within physically plausible b ounds and exhibit monotonic or physically justiable coverage dependence, preventing unphysical extrapolation. 2.3.3 Thermodynamic Consistency Constraints Beyond temperature dependence, several thermo dynamic principles must be satised to ensure the physical validity of predicted isotherms: (i) Saturation limits: For models with explicit saturation capacities (Langmuir , Sips, T oth, D-R), the predicted Q max or Q s must be positive and consistent with material properties such as total por e volume or surface area. The PINN loss function p enalizes predictions that violate 0 < Q ( p ) ≤ Q max . (ii) Monotonicity: Physical adsorption isotherms must b e monotonically increasing with pressure at constant temperature: ∂ Q/∂ p | T ≥ 0 . This constraint pre vents unphysical oscillations or decreasing 9 behavior in predicted isotherms, particularly during extrapolation b eyond the training data range . (iii) Convexity and boundar y behavior: At low pressur es, isotherms should approach Henry’s law behavior ( Q ∼ p ), while at high pressures, saturation or sub-linear growth is expected. These asymptotic behaviors can b e enforced through penalty terms that evaluate isotherm cur vature and limiting slopes. (iv) Gibbs adsorption consistency: The Gibbs adsorption isotherm relates surface excess to pressure and surface tension, providing an independent thermodynamic check. It is not directly enforced in the current framew ork. The theoretical framework established in this section forms the foundation for our physics-informed neural network appr oach. By embedding classical isotherm models ( § 2.2.2 – § 2.2.9 ) into a hybrid loss function that combines data-driven tting with physics-based penalties, the PINN architecture ensures predictions satisfy fundamental thermodynamic constraints. The V an’t Ho relationship (Equation 12 ) and Clausius-Clapeyron equation (Equation 14 ) enforce temperature-dependent consistency , while monotonicity and saturation b ounds prevent unphysical behavior during extrapolation. This integration of domain knowledge with ML enables accurate, interpretable predictions across diverse ge ological conditions while addressing the key limitations of purely empirical approaches. The following section describes the neural network architecture, feature engineering strategies, and training proce dures that operationalize these theoretical principles. 3 Materials and Methods This section presents the adaptive physics-informed neural network (PINN) framework for predicting hydrogen sorption behavior across ne-graine d geological materials. The metho dology integrates multi-scale data processing, classical isotherm modeling, physics-informed feature engineering, and deep learning architectures with embedded thermo dynamic constraints. Complete metho dological details, including algorithmic specications, statistical validation procedures, and hyperparameter optimization protocols, are pro vided in the Supplementar y Information (Appendix 6 ). 3.1 Dataset and Integrated Data Processing Pipeline The dataset comprises 1,987 hydr ogen sorption isotherm measurements across three lithological classes: 1,197 measurements on clay mineral samples, 585 on shale formations, and 205 on coal specimens, spanning pressures fr om 0.1 to 200 bar and temperatures from 273 to 363 K. Additionally , 224 character- istic adsorption capacity measurements pro vide complementary material property information. Data originate from multiple indep endent studies employing v olumetric and gravimetric techniques [ 27 ], necessitating careful harmonization before physics-informed modeling. W e developed a comprehensive data integration pip eline implementing: (i) intelligent column mapping across heterogeneous data sources using pattern matching and domain-spe cic heuristics, (ii) lithology-aware processing pr eserving material-spe cic properties while enabling cr oss-lithology learn- ing, and (iii) multi-level quality assessment including completeness scoring, interquartile range outlier detection, and thermodynamic consistency validation. Critical preprocessing steps enforce fundamental physical constraints: monotonicity checks conrm non-decreasing sorption with increasing pressure at constant temperature, saturation limits prev ent unphysical uptake predictions, and temp erature dependencies are validated against V an’t Ho behavior (Se ction 2.3 ). Features were standardized to 10 zero mean and unit variance within each lithological class to preserve material-specic scaling while enabling eective gradient-based optimization. Detailed data integration protocols, quality metrics, and validation procedures are pro vided in Appendix 6.1 . 3.2 Classical Isotherm Analysis and Thermodynamic Parameter Extraction Classical isotherm models provide physically interpretable baseline performance and e xtract thermo- dynamic parameters that constrain subsequent PINN training. W e implemente d a comprehensive two-stage analysis: (i) individual sample tting, extracting sample-specic parameters and thermo- dynamic properties, and (ii) aggregated data analysis, evaluating whether classical models generalize across heterogeneous samples without ML augmentation. Individual sample characterization tted nine classical models (Henr y , Langmuir , Freundlich, BET , T emkin, T oth, Sips, Re dlich-Peterson, Dubinin-Radushkevich) to each sample’s isotherm data using dierential evolution optimization within physically meaningful parameter bounds. Physics-based validators enforced fundamental constraints, including positive sorption capacities, thermodynam- ically consistent equilibrium constants, and monotonic pressur e response. Parameter uncertainty was quantied via bo otstrap resampling (500 iterations), and cross-validation (v e-fold splitting) was used to assess generalization performance. For multi-temperature measurements, V an’t Ho analy- sis extracted standard enthalpy ( ∆ H ads ), entropy ( ∆ S ads ), and Gibbs free energy ( ∆ G ads ) according to Equation 12 . Isosteric heats of adsorption were calculate d via the Clausius-Clapeyron e quation (Equation 14 ), providing cov erage-dependent energetics that reveal surface heterogeneity . Aggregated analysis e valuated 22 functional forms (10 physics-based classical isotherms plus 12 mathematical equations including p olynomials, exponentials, power laws, and growth curves) tted to lithology-specic and combined datasets. Statistical validation employed bootstrap resampling (1,000 iterations), ve-fold cross-validation, and residual diagnostics (Shapiro- Wilk and Durbin- W atson tests) to assess model adequacy and generalization. This dual-stage approach establishes both thermo dynamic foundations for PINN constraints and empirical justication for PINN necessity . Complete tting procedures, parameter bounds, validation metrics, and comparative results appear in Appendix 6.2 . 3.3 Property-Uptake Correlation and Feature Selection T o establish quantitative relationships between material properties and hydrogen sorption capacity , we implemented a systematic correlation analysis with b ootstrap uncertainty quantication (1,000 iterations) to obtain robust condence intervals. Pearson correlation coecients identied linear rela- tionships, while super vised learning models ( linear regression, ridge regression with L2 r egularization α = 1 . 0 , random forest with 50 estimators and maximum depth 5) captured non-linear dependencies. Generalization performance was evaluated via ve-fold cross-validation, and feature importance rank- ings from random forests (100 estimators) identied properties most strongly predicting uptake across lithologies. Lithology-specic hydrogen uptake distributions w ere characterized through comprehensiv e de- scriptive statistics (central tendency , dispersion, range boundaries) that inform PINN output constraints: maximum obser ved uptake values establish physical upper b ounds, while mean and median values guide output layer initialization. This analysis validates the physical mechanisms governing sorption and provides guidance on feature selection for neural network architecture design. Detaile d correlation 11 matrices, super vised learning results, feature importance rankings, and lithology-sp ecic statistics are provided in Appendix 6.3 . 3.4 Physics-Informed Feature Engine ering Beyond raw measurements, eective neural network training requires engineered features that encode the physical relationships governing hydrogen sorption. W e developed a systematic se ven-category framework generating 105 to 120 physics-informed features ( depending on lithology): (1) Thermodynamic descriptors: T emp erature conversions, logarithmic pressure, reduced temper- ature and pressur e ( T r = T /T c , p r = p/p c where T c = 33 . 19 K, p c = 13 . 13 bar), inv erse temperature ( 1 /T ), and approximate Gibbs fr ee energy . (2) Pore structure descriptors: Micropore fraction ( V micro /V total ), surface area density ( S BET /V total ), connement parameter ( d pore /d H 2 where d H 2 = 0 . 289 nm), and logarithmic transformations compress- ing multi-order-of-magnitude property ranges. (3) Surface chemistr y and comp osition: Lithology-specic features including TOC for shales ( r = 0 . 755 correlation with uptake, Appendix 6.3 ), carb on maturity indices and fuel ratio for coals, and clay mineralogy parameters. (4) Interaction features: T emperature-surface area products ( S BET × T ), pressure-pore volume products ( p × V pore ), and adsorption driving force ( Φ ads = p · S BET /T ). (5) Kinetic descriptors: Knudsen diusion coecients, molecular mean free path, and diusion timescales. (6) Mole cular sieving parameters: Sieving factors, pore accessibility indices, and ultramicr op- ore/supermicropore indicators. (7) Classical model-inspired features: Langmuir-inspired saturation terms, Freundlich p ower laws, and T emkin logarithmic forms. Ensemble feature selection combined Pearson correlation, mutual information, random forest importance, and F-statistics to identify the 50 most informative features. RobustScaler transformation (median centering, IQR scaling) provided outlier resistance while preserving rank-order relationships. Complete feature engineering formulations, selection validation, and scaling procedures app ear in Appendix 6.4 . 3.5 Multi-Scale P hysics-Informed Neural Network Architecture The PINN architecture integrates three design innovations addressing data-constraine d geological modeling: (i) hierarchical multi-scale feature extraction through parallel pathways (64, 128, 256 neurons) capturing patterns at multiple abstraction lev els, (ii) physics-informed gating mechanisms ( g = σ ( W g [ p ; T ] + b g ) ) that dynamically emphasize thermodynamically relevant features, and (iii) progressiv e dimensional modulation via encoder-decoder topology (256, 512, 256, 128 neurons) with residual connections mitigating vanishing gradients. The architecture totals 887,447 trainable parame- ters, balancing sucient capacity for heterogeneous sorption physics across thr ee lithologies against tractability for moderate-size d datasets. Hidden layers employ Swish activation ( f ( x ) = x · σ ( x ) ), enabling complex non-linearities, while output layers use Soplus activation ( f ( x ) = ln(1 + e x ) ), enforcing non-negativity constraints without discontinuous gradients. 12 The multi-term physics-informed loss function combines data delity , physical consistency , hard constraints, and monotonicity: L total = λ 1 L data + λ 2 L physics + λ 3 L bounds + λ 4 L monotonicity (15) where data loss employs sigmoid temperature-scaled weighting addressing target distribution skewness, physics loss penalizes violations of lithology-specic Langmuir saturation limits extracted fr om classical isotherm analysis (clays: 1.2 mmol/g, shales: 1.0 mmol/g, coals: 0.88 mmol/g), bounds constraints enforce 0 ≤ Q ≤ q max , and monotonicity terms ensure ∂ Q/∂ p | T ≥ 0 via automatic dierentiation. Loss weights adapt dynamically through gradient-magnitude-based normalization, ensuring balanced contributions across comp eting obje ctives. Detaile d architecture specications, loss function derivations, and adaptive weighting algorithms appear in Appendix 6.5 . 3.6 Progressiv e T raining Strategy and Ensemble Methods Training pr ocee ds through three sequential phases implementing curriculum learning: (i) data-driven warmup (50 epochs, data loss only , learning rate η = 1 . 2 × 10 − 3 ), (ii) physics integration (250 epochs, linearly increasing physics weight from 0 to 1, cosine annealing η = 5 × 10 − 4 to η min = 10 − 6 ), and (iii) full constraints (100 epochs, all loss terms active, η = 10 − 4 to η min = 10 − 7 ). AdamW optimizer with weight decay λ wd = 10 − 5 , batch size 64, and automatic mixed precision accelerate convergence. Gradient clipping (maximum norm 1.0) prevents exploding gradients during physics loss backpropagation. Systematic hyperparameter optimization spanning 30+ experiments identie d optimal congu- rations: dropout rate 0.10 (balancing regularization against capacity pr eser vation), 400 total training epochs (convergence completeness versus ov ertting risk), initial learning rate η = 1 . 2 × 10 − 3 , and batch size 64 (gradient stability versus stochastic regularization). Comprehensive regularization inte- grates L2 weight decay , dropout, batch normalization, data augmentation via mini-batch sampling, early stopping, and stratied sample-level train-validation-test splitting that pre vents information leakage. Predictive uncertainty quantication employs architecture-diverse ensemble learning with 10 members exhibiting genuine topological variation (width variations: 0.75 × , 1.0 × , 1.25 × base neurons; depth variations: 3 to 5 lay ers; hybrid congurations; regularization div ersity) rather than dropout-only variation. Each memb er trains with distinct random initializations across 10 dierent see ds (from 42 to 9999), exploring independent optimization traje ctories. Ensemble predictions aggregated via mean and standard deviation, with post-hoc temp erature-scaling calibration optimizing coverage rates on held-out validation data. Complete training protocols, hyp erparameter search results, ensemble diversity analysis, and calibration procedures appear in Appendix 6.6 . 3.7 Evaluation Framework and Interpretability Analysis Model evaluation employs 35 metrics spanning ve domains: (i) the regression performance of the models was evaluated using the following standard metrics: the coecient of determination ( R 2 ), which quanties the proportion of variance in the observed hydrogen adsorption values explained by the model; the root mean squared error (RMSE), which measures the square root of the average squared dierences between predicted and actual values (in mmol/g); the mean absolute error (MAE), 13 representing the average absolute deviation between predictions and observations (in mmol/g); the mean absolute percentage error (MAPE), expr essing the average absolute error as a percentage of the true values; and the mean bias error (MBE), which indicates the average signe d deviation (positive values denote systematic overpr ediction, negative values underprediction) between predicted and observed adsorption capacities (in mmol/g). (ii) correlation metrics (Pearson, Spearman, Kendall tau), (iii) physics consistency metrics ( constraint violation rate, saturation consistency , monotonicity score), (iv) uncertainty quantication metrics (prediction inter val coverage at 68%, 95%, 99% condence levels, calibration error , sharpness, uncertainty- error correlation), and (v) statistical tests (Shapiro- Wilk, Durbin- W atson, heteroscedasticity tests). Evaluation is performed on a strictly held-out test set (15% of the total data), completely isolated from training, validation, and hyperparameter selection. Interpretability analysis emplo ys three complementary methodologies: SHAP (Shapley A dditive Explanations), providing game-theoretic feature attribution capturing feature interactions [ 71 , 72 ], Accumulated Local Eects (ALE) plots visualizing global marginal eects while accounting for feature correlations [ 73 , 74 ], and Frie dman’s H-statistic quantifying pair wise interaction strength [ 75 , 76 ]. These methods validate that the PINN captures physically meaningful relationships between litho- logical properties and thermodynamic conditions. Comprehensive evaluation results, interpr etability visualizations, and comparative benchmarking against classical models appear in Section 4 . Detailed evaluation protocols and interpretability methodologies are pr ovided in Appendix 6.7 . 4 Results 4.1 Dataset Characterization and Experimental Coverage The hydrogen sorption dataset comprises 1,987 isotherm measurements across three distinct geological lithologies: clay minerals (1,197), shale formations (585), and coal samples (205). These data are complemented by 224 characteristic uptake measurements (123 clays, 39 shales, 62 coals) representing maximum or equilibrium hydrogen sorption capacities under sp ecic experimental conditions. The dataset encompasses pr essures fr om near-ambient conditions to 200 bar and temp eratures ranging from cryogenic conditions ( − 253 ° C) to elevated subsurface temperatures (120 ° C), providing cov erage across both liqueed hydrogen storage scenarios and deep geological formation conditions. Clay minerals demonstrate the broadest experimental parameter space, with specic surface areas spanning 2.96 to 273.1 m 2 /g (mean 81.8 ± 73.6 m 2 /g) and temperature coverage from − 253 ° C to 120 ° C. Isotherm measurements exhibit mean temperature and pressure conditions of 43.3 ± 30.4 ° C and 50.8 ± 47.0 bar , respectively , with hydrogen uptake averaging 0.204 ± 0.290 mmol/g (median 0.063 mmol/g). The large standard deviations and skewed distributions reect the structural diversity of clay mineralogies, from low-surface-area non-swelling clays (e.g., kaolinite) to high-surface-area swelling clays ( e.g., smectites, montmorillonite, and v ermiculite). Pore volume (0.128 ± 0.112 cm 3 /g) and micropore volume (0.021 ± 0.025 cm 3 /g) exhibit right-skew ed distributions characteristic of hierarchical pore structures, with strong positive correlations to uptake capacity (Pearson r = 0 . 52 and r = 0 . 29 , respectively). Shale formations exhibit substantially lower specic surface areas (0.030 ± 0.015 m 2 /g, range 0.01– 0.05 m 2 /g). Compositional analysis reveals a mean total organic carbon (TOC) content of 10 . 5 ± 6 . 1 wt% (median 9.7 wt%, range 0.7–19.4 wt%), calcite content of 26 . 0 ± 33 . 4 wt%, quartz content of 14 20 . 3 ± 15 . 9 wt%, pyrite content of 2 . 2 ± 2 . 7 wt%, and clay mineral content of 25 . 3 ± 24 . 7 wt%. These statistical distributions reect the strong mineralogical heterogeneity that is characteristic of ne-grained sedimentar y deposits. Calcite and clay minerals show the widest variability (standard deviations exceeding their respective means), indicating the presence of both carb onate-dominated and siliciclastic/clay-dominated end-members within the sample set. T OC values exhibit mo derate dispersion and remain almost entirely below 20 wt%. Coal samples display intermediate surface area characteristics (2.81 ± 4.59 m 2 /g, range 0.05–30.51 m 2 /g), with measurements extending to 120 bar and 105 ° C (mean conditions: 39.6 ± 15.9 ° C, 55.5 ± 39.6 bar). Coal properties reveal mean xe d carbon content of 64.1 ± 17.7 wt%, volatile matter of 20.0 ± 14.3 wt%, and vitrinite reectance (%R o ) of 2.12 ± 1.59%, spanning low-volatile bituminous to anthracite ranks. Hydrogen uptake exhibits bimodal behavior with mean values of 0.179 ± 0.167 mmol/g for isotherm measurements (median 0.143 mmol/g) and 0.378 ± 0.206 mmol/g for characteristic capacity measurements (me dian 0.320 mmol/g). Str ong correlations exist between xed carbon content and uptake ( r = 0 . 71 ), micropore volume and uptake ( r = 0 . 65 ), and a pronounced negative correlation between volatile matter and uptake ( r = − 0 . 71 ), indicating that coal rank and micropore development are primary controls on hydrogen storage capacity . Strong correlations between material properties and uptake capacity pro vide clear physical con- straints for model development. Across all lithologies, sp ecic surface area demonstrates positive correlations with hydrogen uptake (clays: r = 0 . 60 ; shales: limited data; coals: r = 0 . 13 ), though the relationship weakens in coals where micropore architecture supersedes total surface ar ea as the dominant control. Pore volume metrics exhibit lithology-dep endent b ehavior: in clays, total pore volume correlates moderately with uptake ( r = 0 . 52 ), while in coals, micropore volume shows a stronger association ( r = 0 . 65 ) due to size-sele ctive mole cular sieving eects that preferentially accumulate hydrogen in sub-nanometer pores. Coal-specic parameters reveal that xed carb on content ( r = 0 . 71 ) and volatile matter content ( r = − 0 . 71 ) ser ve as robust proxies for sorption capacity , reecting the fundamental relationship between coal rank, aromaticity , and microporosity development during coali- cation. These strong correlations ( | r | > 0 . 5 ) establish physically grounded featur e relationships that can be leveraged for PINN training while maintaining interpretability . The dataset’s multi-scale nature, spanning molecular-level physisorption to bulk-scale storage phenomena, presents both opportunities and challenges for physics-informed mo deling. The pressure range (0–200 bar) encompasses distinct adsorption regimes governed by dierent theoretical frame- works: dilute Henr y’s law linearity at low pressures ( < 1 bar), Langmuir-type monolayer saturation at intermediate pressures (1–50 bar ), and potential multilayer formation or micropore condensation mechanisms at elevated pressures ( > 50 bar). T emperature variations spanning supercritical to sub- critical hydrogen conditions may enable thermodynamic validation through V an’t Ho analysis of temperature-dependent equilibrium constants and isosteric heat calculations via the Clausius-Clap eyron equation (Equation 14 ). The lithology-sp ecic variations in sorption behavior necessitate adaptive network architectures capable of capturing material-dependent phenomena while remaining consistent with the universal thermodynamic principles established in Se ction 2.3 . Statistical distributions reveal pronounced non-normality across all measur ed parameters (Shapiro- Wilk p < 0 . 05 for all variables), with skewness values ranging from − 3 . 2 to +4 . 8 , necessitating log-transformations for pressure, uptake, and surface area features to stabilize variance and impr ove model convergence during gradient-based 15 optimization. 4.2 Classical Isotherm Model Performance and Generalization Assessment 4.2.1 Individual Sample Fitting: Mo del Performance and Lithology-Sp ecic Preferences Classical isotherm tting yielded 621 model evaluations, of which 617 converged successfully (99.4% success rate). Nine theoretical frameworks as pr esented in Section 2.2 were systematically evaluated: Henry , Langmuir , Freundlich, BET , T emkin, T oth, Sips, Redlich-Peterson, and Dubinin-Radushkevich models. Model sele ction was guided by Akaike information criterion ( AIC), Bayesian information criterion (BIC), and physics compliance scores, with the best-performing model sele cted for each sample based on a composite ranking that balanced statistical t quality , thermodynamic consistency , and parameter identiability . Overall t quality for individual samples demonstrates strong sample-sp ecic predictive capability , with median R 2 = 0.970 and mean R 2 = 0.861 ± 0.213 across all selected models (T able 2 ; Fig. 1 ). Quality assessment categorizes 55.1% of ts as excellent (R 2 > 0 . 95 ), 14.5% as good (0.85–0.95), 11.6% as fair (0.70–0.85), and 18.8% as requiring further e valuation (R 2 < 0 . 70 ) (Fig. 1 c). Clay minerals exhibit the highest average t quality (mean R 2 = 0.903 ± 0.153, median = 0.973), followed by shales (mean R 2 = 0.836 ± 0.267, median = 0.968) and coals (mean R 2 = 0.807 ± 0.238, median = 0.976) (Fig. 1 a). The higher median than mean values across all lithologies indicate that most samples achieve excellent individual ts, with lower means reecting a small subset of poorly tting samples warranting exclusion from training datasets. T able 2: Summary of classical isotherm model performance for individually tted samples across geological lithologies. Statistics presented as mean ± standard deviation. Model preference indicates the percentage of samples best represented by each theoretical framework aer multi-criteria selection ( AIC, BIC, physics score). Lithology Mean R 2 Median R 2 RMSE T op Model Excellent Fits (mmol/g) (Preference) (%) Clays 0.903 ± 0.153 0.973 0.029 ± 0.044 Sips (57.6%) 63.6 Shales 0.836 ± 0.267 0.968 0.030 ± 0.048 Sips (52.4%) 52.4 Coals 0.807 ± 0.238 0.976 0.026 ± 0.035 Sips (73.3%) 40.0 Overall 0.861 ± 0.213 0.970 0.029 ± 0.044 Sips (59.4%) 55.1 Secondary mo del preferences: Freundlich (26.1%), Redlich-Peterson (7.2%), T emkin (4.3%), BET (1.4%), D-R (1.4%) Quality categories based on the coecient of determination thresholds established for training dataset curation: Excellent (R 2 > 0 . 95 ), Good (0.85–0.95), Fair (0.70–0.85), Po or ( < 0.70 ) . Model preferences show lithology-dependent patterns reecting underlying sorption mechanisms (Fig. 1 b). The Sips (Langmuir-Freundlich) mo del emerges as the dominant framework across all litholo- gies, selected for 59.4% of samples overall (57.6% clays, 52.4% shales, 73.3% coals). This prevalence indicates that hydrogen sorption in these geological materials exhibits combined Langmuir-type sat- uration with Freundlich-type surface heterogeneity , consistent with the compiled dataset of [ 27 ]. The Freundlich model ranks second in prefer ence (26.1% overall), particularly for samples exhibiting pronounced heterogeneity without clear saturation behavior within the measur ed pressure range. Clay- specic features include prefer ence for Redlich-Peterson (15.2%) and T emkin (3.0%) models in select high-surface-area samples, reecting complex multi-site adsorption energetics. Shale formations show occasional BET model selection (4.8%), suggesting multilayer formation on specic mineral surfaces, while coal samples uniquely exhibit Dubinin-Radushkevich model applicability (6.7%), consistent with 16 micropore volume-lling mechanisms characteristic of high-rank coals. The model performance assessment established quality tiers for subsequent analyses. Quality scoring combined statistical metrics (R 2 , residual patterns), physics compliance, data suciency (minimum 6 pressure points), and parameter identiability . Clays Shales Coals Lithology 0.00 0.20 0.40 0.60 0.70 0.85 0.95 1.00 Coefficient of Determination (R²) 0.973 0.968 0.976 Excellent Good Fair (a) Individual Sample Fit Quality 0 20 40 60 80 100 Sample Selection Frequency (%) Clays Shales Coals 58% 52% 73% 24% 33% 20% 15% (b) Best-Model Preference by Lithology Sips Freundlich Redlich-Peterson Temkin BET Dubinin-Radushkevich Langmuir Toth Henry Clays Shales Coals Overall 0 10 20 30 40 50 60 70 80 Proportion of Samples (%) 55 57 53 55 21 14 14 12 10 13 12 12 19 33 19 (c) Fit Quality Tier Distribution Quality Tier Excellent (R²>0.95) Good (0.85-0.95) Fair (0.70-0.85) Poor (<0.70) Clays Shales Coals Lithology −35 −30 −25 −20 −15 −10 −5 0 5 Gibbs Free Energy Δ G (kJ mol −1 ) -17.283 -14.793 -19.032 Strong Physisorption Moderate Physisorption Weak Physisorption ΔG = 0 (threshold) (e) Thermodynamic Favourability (298 K) Clays Shales Coals Lithology 0 1 2 3 4 5 Sips q max (mmol g −1 ) 0.831 0.586 0.455 (d) Sips Model Parameters Clays Shales Coals Lithology 0.00 0.25 0.50 0.75 1.00 1.25 1.50 1.75 2.00 Sips Heterogeneity Exponent n s 1.069 0.882 0.687 n s = 1 (homogeneous) Figure 1: Classical isotherm model-tting performance across individual geological samples of clays, shales, and coals. Nine classical models were tted per isotherm. The b est model was selected via the lowest AIC. High per-sample accuracy shows eective capture of local adsorption, yet fails to generalise across samples or aggregates (see Fig. 2 ). (a) Best-t mo del R 2 distributions by lithology (violin plots with interquartile boxes and data points). Dashed lines mark thresholds: R 2 = 0 . 95 (excellent), 0 . 85 (good), 0 . 70 (acceptable). (b) Model preference by lithology (% of samples with lowest AIC). Sips model dominates overall (59.4% of best ts). (c) Sample quality tiers by lithology: Excellent ( R 2 > 0 . 95 ), Good ( 0 . 85 – 0 . 95 ), Fair ( 0 . 70 – 0 . 85 ), Poor ( R 2 < 0 . 70 ). Percentages show tier shares within each lithology . (d) Sips mo del parameter distributions: maximum capacity q max (mmol g − 1 ) and heter ogeneity exponent n s (reference line at n s = 1 , Langmuir limit). (e) Gibbs free energy of adsorption ( ∆ G , kJ mol − 1 ) by lithology , derived from isosteric estimates. Shaded bands indicate physisorption strength: weak (0 to − 10 ), moderate ( − 10 to − 20 ), str ong ( < − 20 ). 4.2.2 Individual Sample Fitting: Parameter Uncertainty and Cross- V alidation Bootstrap resampling with 500 iterations pro vided 95% condence intervals for all tted parameters, enabling assessment of parameter identiability and stability . For the dominant Sips mo del, tted parameters span physically meaningful ranges (Fig. 1 d): maximum sorption capacity q max = 0 . 774 ± 1 . 324 mmol/g (range 0.032–8.295 mmol/g, me dian 0.445 mmol/g), anity constant K S = 0 . 045 ± 0 . 112 bar − 1 (range 0.00036–0.680 bar − 1 , median 0.012 bar − 1 ), and heterogeneity exponent n s = 0 . 763 ± 0 . 323 (range 0.105–1.466, median 0.702). The heterogeneity parameter distribution ( n s < 1 for most samples) indicates that geological materials exhibit surface energy distributions rather than uniform adsorption sites. Freundlich model parameters show capacity factors K F = 0 . 015 ± 0 . 032 and heterogeneity 17 indices n = 1 . 88 ± 1 . 88 (median 1.20), with n > 1 validating favorable adsorption conditions. Five-fold cross-validation assessed model generalization capability within individual samples, yield- ing mean cross-validation R 2 values comparable to training ts (dierence typically < 0.02), indicating minimal overtting for sample-spe cic predictions. Bootstrap-derived condence intervals rev ealed that saturation capacity parameters ( q max , Q s ) exhibit relatively tight bounds (typical 95% CI spanning 10–30% of mean value), while anity constants show broader uncertainty ranges (50–100% of mean) due to correlation with heterogeneity parameters. This parameter correlation structure informed subsequent PINN initialization strategies, where saturation capacities wer e constrained more tightly than anity parameters. 4.2.3 Individual Sample Fitting: P hysics V alidation and Thermodynamic Consistency Physics-based validators enforced fundamental constraints during optimization, computing compliance scores for each tted model. V alidation criteria included: (i) positive parameter constraints ( q max , K , n > 0 ), (ii) saturation limit adherence ( q max ≥ Q obs,max ), (iii) monotonicity requirements ( ∂ Q/∂ p ≥ 0 ), (iv) Freundlich favorability ( n > 1 for physical adsorption), and (v) BET relative pressure bounds ( 0 . 05 < p/p 0 < 0 . 35 ). A verage physics compliance scores excee ded 0.90 for all individual samples across lithologies, with 89.9% of selected models achieving perfe ct or near-perfect scores ( ≥ 0 . 95 ). Seven samples yielded physics scor es below 0.70, were agged for manual r eview , and were checked and re-imported to prev ent potential experimental artifacts or non-equilibrium measurements from corrupting model initialization. Thermodynamic analysis of temperature-dependent datasets for samples with multi-temp erature measurements extracted Gibbs fr ee energy values via tted equilibrium constants. Results uniformly indicate favorable adsorption ( all ∆ G < 0 ), with mean ∆ G = − 16 . 6 ± 5 . 8 kJ/mol (range − 30 . 8 to − 5 . 4 kJ/mol) (Fig. 1 e). Energy distribution classies 61.7% as moderate physisorption ( − 20 < ∆ G < − 10 kJ/mol), 23.3% as strong physisorption ( ∆ G < − 20 kJ/mol), and 15.0% as weak physisorption ( ∆ G > − 10 kJ/mol). These values align with expe cted hydrogen physisorption energetics on mineral surfaces, validating that tted parameters r eect genuine physical phenomena rather than mathematical artifacts. 4.2.4 Aggregated Data Analysis: Generalization Failure and Model Limitations While individual sample tting demonstrates that classical isotherms accurately describ e single-sample behavior , a critical question remains: can these models generalize across heterogeneous sample p opula- tions without adaptive ML ar chitectures? T o address this question, we conducted a rigorous general- ization assessment by tting 22 distinct functional forms (10 classical isotherm models and 12 pur ely mathematical e quations) to aggregated datasets at three hierarchical levels: per-lithology aggrega- tion and complete aggregation across all lithologies. Each t employed b ootstrap resampling with 1,000 iterations and ve-fold cross-validation to quantify parameter uncertainty and generalization performance. Aggregated tting results re veal systematic and severe generalization failures across all lithologies and model typ es (T able 3 ; Fig. 2 a). For clay minerals, the b est-performing mo del (4th-order polynomial) achieved training R 2 = 0.172 and cross-validation R 2 = 0.165 ± 0.013, representing an 80% reduction in explanatory power compared to individual sample ts (mean R 2 = 0.903). Classical isotherm models performed marginally worse, with Redlich-Peterson yielding R 2 = 0.161 (CV = 0.154 ± 0.017, 95% CI 18 Clays Shales Coals All Combined 0.0 0.2 0.4 0.6 0.8 1.0 Coefficient of Determination (R²) −81% −95% −52% −86% Near-zero predictability (a) Individual vs. Aggregated Model Performance Individual sample fits Best aggregated model CV R² (mean) Redlich-Peterson Sips Langmuir Freundlich T oth T emkin BET Henry D-R Polynomial-4 Clays Shales Coals All Combined 0.161 0.146 0.098 0.091 0.085 0.079 0.070 0.054 0.062 0.172 0.041 0.041 0.035 0.033 0.030 0.028 0.026 0.019 0.022 0.042 0.388 0.384 0.384 0.370 0.352 0.341 0.312 0.270 0.295 0.389 0.115 0.110 0.099 0.095 0.088 0.083 0.075 0.059 0.068 0.120 (b) Aggregated Fit Quality (All Models × Lithologies) 0 10 −6 10 −5 10 −4 10 −3 10 −2 10 −1 10 0 Parameter V alue (log scale) Clays RP - K (Pa −1 ) Clays RP - g Shale Sips - q max Shale Sips - K (Pa −1 ) Coal Lang - q max Coal Lang - K L (Pa −1 ) ×312 ×2 ×6 ×1819 ×7 ×391 (c) Bootstrap 95% CI Width (Parameter Instability) Clays (R-P model) Shales (Sips model) Coals (Langmuir) Fold 1 Fold 2 Fold 3 Fold 4 Fold 5 Cross-V alidation Fold −0.2 −0.1 0.0 0.1 0.2 0.3 0.4 0.5 0.6 Cross-V alidation R² Worse than mean baseline (d) Cross-V alidation Fold-to-Fold Variability (Redlich-Peterson / Best Model) Clays Shales Coals All Combined <10 bar 10-25 bar 25-50 bar 50-100 bar 100-200 bar >200 bar Pressure Regime −0.20 −0.15 −0.10 −0.05 0.00 0.05 0.10 0.15 0.20 Mean Residual (mmol g −1 ) Under-prediction Over-prediction Under-prediction Durbin-Watson: 1.18-1.37 (ideal = 2.0; positive autocorrelation) (e) Systematic Residual Bias by Pressure Regime (S-shaped Misspecification Pattern) Clays Shales Coals 0.00 0.05 0.10 0.15 0.20 0.25 0.30 0.35 0.40 0.45 Aggregated R² Figure 2: Failure of classical isotherm models in aggregated, cross-sample generalisation. While individual- sample ts achieve median R 2 = 0 . 97 (Fig. 1 ), aggregating data within each lithology and re-tting yields 80–90% mean reduction in R 2 , motivating the physics-informed neural network approach. (a) Comparison of individual- sample R 2 , aggregated R 2 , and cross-validation R 2 by lithology and overall. Percentage reductions annotate performance collapse. ( b) Aggregated R 2 heatmap for nine classical models plus fourth-order polynomial across four groupings ( clays, shales, coals, all combined). Colour scale 0–0.45; best model per group highlighted (b old border). (c) Bo otstrap parameter uncertainty (95% CI error bars) for dominant model per lithology: Redlich– Peterson ( clays), Sips (shales), Langmuir (coals). Fold-width annotations (e.g. × 10 2 ) indicate parameter instability . (d) Five-fold cross-validation R 2 by lithology . Shale folds reach negative values, showing worse-than-mean performance. (e) Residual bias across six pressure bins ( < 10 to > 200 bar). S-shaped pattern (under-prediction at low/high pr essures, over-pr ediction at intermediate) re veals structural misspecication. Durbin– W atson statistics (1.18–1.37) conrm positive residual autocorrelation. [0.139, 0.189]). Residual analysis via the Shapiro- Wilk normality test universally rejected the null hypothesis (all p < 0 . 001 ), indicating systematic model misspe cication. The Durbin- W atson statistic (D W = 1.31 for the Re dlich-Peterson) deviated substantially from the ideal value of 2, indicating strong positive autocorr elation in the residuals and signaling unmodele d pr essure-dependent systematic errors. Aggregated shale data analysis exhibited catastrophic generalization failure, with all models achiev- ing training R 2 < 0 . 05 and negative cross-validation R 2 values (range − 0.08 to − 0.01), indicating that model predictions performed worse than simply pr edicting the mean uptake across all samples. The 4th-order polynomial achieved R 2 = 0.042 with CV R 2 = − 0.017 ± 0.067, while classical models (Hill, Sips, Langmuir) yielded nearly identical poor p erformance (R 2 ≈ 0 . 041 , CV ≈ − 0.014). Bootstrap condence inter vals spanning [0.02, 0.08] conrm that even under optimistic resampling scenarios, aggregated shale measurements retain essentially zer o predictive power . The aggregated coal dataset demonstrated the best generalization performance among all lithologies, though it still show ed substantial degradation relative to individual ts. Polynomial-4 achieved R 2 = 19 T able 3: Aggregated data generalization performance comparing classical isotherm models and mathematical equations across lithologies. Bootstrap condence intervals computed from 1,000 iterations. Cross-validation statistics from ve-fold splitting. All models demonstrate severe generalization failure , with R 2 values 70–95% lower than individual sample ts. Dataset Best Model T yp e Training R 2 CV R 2 95% CI (mean ± std) (Bo otstrap) Clays Polynomial-4 Math 0.172 0.165 ± 0.013 [0.151, 0.199] Redlich-Peterson Classical 0.161 0.154 ± 0.017 [0.139, 0.189] Sips Classical 0.146 0.139 ± 0.017 [0.126, 0.169] Shales Polynomial-4 Math 0.042 − 0.017 ± 0.067 [0.019, 0.085] Hill Classical 0.041 − 0.014 ± 0.065 [0.022, 0.076] Sips Classical 0.041 − 0.014 ± 0.065 [0.023, 0.078] Coals Polynomial-4 Math 0.389 0.392 ± 0.178 [0.311, 0.533] Redlich-Peterson Classical 0.388 0.404 ± 0.178 [0.295, 0.511] Langmuir Classical 0.384 0.407 ± 0.179 [0.288, 0.512] All Combined Polynomial-4 Math 0.120 0.115 ± 0.021 [0.120, 0.182] Redlich-Peterson Classical 0.115 0.110 ± 0.019 [0.115, 0.177] Sips Classical 0.110 0.105 ± 0.020 [0.110, 0.172] Individual sample ts ( § 4.2.1 ): Clays R 2 = 0.903, Shales R 2 = 0.836, Coals R 2 = 0.807 Negative CV R 2 for shales indicates predictions worse than mean-only baseline 0.389 with CV = 0.392 ± 0.178, while classical models (Redlich-Peterson R 2 = 0.388, Langmuir R 2 = 0.384) performed comparably . Howe ver , the large cross-validation standard deviation ( ± 0.178) signals high sensitivity to fold composition, with R 2 varying from 0.29 to 0.53 across folds. This 52% reduction in explanatory power relative to individual ts (R 2 = 0.807) reects coal rank heterogeneity , which introduces systematic variations in micropore structure and sorption energetics that xed functional forms cannot accommodate. Complete dataset aggregation yielded the poorest o verall performance, with the best model R 2 = 0.120 (Polynomial-4, CV = 0.115 ± 0.021). Classical models achieved R 2 = 0.115 (Re dlich-Peterson) and R 2 = 0.110 (Sips), representing 86% reduction fr om the ov erall individual sample mean R 2 = 0.861. Bootstrap condence intervals [0.11, 0.18] conrm that the inability to generalize is not an artifact of parameter estimation uncertainty but reects fundamental model inadequacy when confronting multi-lithology heterogeneity . The near-identical performance of physics-based classical mo dels (mean R 2 = 0.089 ± 0.030) and purely empirical mathematical equations (mean R 2 = 0.096 ± 0.020) demonstrates that physical grounding provides no advantage when functional forms lack sucient complexity to capture sample-specic variations (Fig. 2 b). Statistical comparison between classical and mathematical model categories show no signicant performance dierences at any aggregation level. For clays, classical models achieved mean R 2 = 0.117 ± 0.040 versus mathematical R 2 = 0.125 ± 0.033 (dierence not signicant). For shales, classical mean R 2 = 0.035 ± 0.011 versus mathematical R 2 = 0.040 ± 0.004 (b oth eectively zero). For coals, mathematical equations marginally outp erformed (R 2 = 0.382 ± 0.009 versus classical R 2 = 0.334 ± 0.126), though high variance indicates instability . These results validate that the generalization failure stems not from inappropriate functional form selection but from the fundamental inability of xed parametric models to adapt to sample-specic heterogeneity without incorporating material property information or learning sample-dependent parameters. Residual diagnostics across all aggregated ts reveal systematic patterns that further illuminate model limitations (Fig. 2 e). Shapiro– Wilk tests uniformly reject the null of residual normality ( p < 0 . 001 20 for all models), with visual inspection rev ealing heavy tails and multimodal distributions, indicating unmodeled subp opulations. The Durbin– W atson statistic ranges from 1.18 to 1.37 (ideal = 2), indicating strong p ositive auto correlation: consecutive residuals exhibit similar signs and magnitudes. This autocorrelation manifests as pressure-regime-specic biases: mo dels systematically underpredict uptake at lo w pressur es (0–10 bar), ov erpredict at interme diate pr essures (10–50 bar), and underpredict again at high pressures ( > 50 bar), cr eating characteristic “S-shape d” residual patterns. Such systematic errors signal that the pressure-uptake relationship varies across samples in ways that xed isotherm equations cannot represent. Bootstrap parameter distributions provide additional evidence of model instability (Fig. 2 c). For the Redlich-Peterson model tted to clay aggregates, the anity parameter K exhibits 95% CI spanning four orders of magnitude [6.4 × 10 − 7 , 2.0 × 10 − 4 ], while the heterogeneity exponent g spans [2.05, 3.26], indicating that resampled datasets yield fundamentally dier ent parameter estimates. Similarly , Sips model parameters for shale aggregates show saturation capacity q max CI [0.039, 0.246] and anity constant CI [8.3 × 10 − 5 , 0.151], representing 6-fold and 1,800-fold ranges respectively . These enormous condence intervals reect that aggregated data contain multiple “optimal” parameter sets correspond- ing to dierent sample subpopulations, with bootstrap resampling randomly emphasizing dierent subgroups in each iteration. Cross-validation fold-to-fold variability corroborates this interpretation (Fig. 2 d). For clay aggregates, Redlich-Peterson R 2 varies from 0.137 to 0.172 across folds (26% relative range), while shale aggregates show fold R 2 ranging from − 0.140 to 0.043 (spanning negative to marginally positive). Coal aggregates exhibit R 2 range 0.38 to 0.42 (10% relativ e range), the most stable of any lithology , but still indicating substantial sensitivity . This fold sensitivity directly demonstrates that model performance depends critically on which samples are included in training versus testing, validating that heterogeneity e xceeds the model’s representational capacity . 4.2.5 Implications for P hysics-Informed Neural Network Development The sheer contrast between individual sample success (mean R 2 = 0.861) and aggregated failure (mean R 2 = 0.089–0.382 dep ending on lithology) provides quantitative justication for physics-informed neural network (PINN) approaches. Classical isotherm models succee d when applied to homogeneous single-sample datasets where sorption mechanisms remain constant across measurements, but fail when confronting heterogeneous multi-sample datasets where mechanisms var y sample-to-sample. This failure pattern indicates that the required modeling framework must combine: (i) xed physics constraints encoding universal thermodynamic principles that govern all samples ( saturation limits, monotonicity , V an’t Ho temperature dependence), and (ii) adaptive sample-spe cic parameters that capture material property variations (surface area, mineralogy , rank), determining individual sorption characteristics. 4.3 Property-Uptake Relationships and Feature Selection PINN addresses both requirements simultaneously through its hybrid architecture. The physics compo- nent provides thermodynamic loss terms derived from classical models (Section 4.2 ), ensuring predictions respect saturation limits, maintain monotonic pressure response, and exhibit thermo dynamically consis- tent temperature dependencies. The neural network component introduces sample-conditional inputs 21 (material properties from Section 4.3 ) that enable learning of material-sp ecic mappings while sharing representational structure across samples. This architecture transforms the generalization problem from “nd one function describing all samples” (doomed to fail as demonstrate d above) to “nd a parameterized family of functions indexed by material pr operties” (tractable given sucient sample diversity and physical constraints). The aggregated analysis establishes spe cic quantitative targets for PINN performance. Minimum acceptable performance requires exceeding the b est aggregated classical model by substantial margins. Ideally , PINN cross-validation performance should approach individual sample tting quality (R 2 ≈ 0 . 85 ), demonstrating that incorporating material properties and physical constraints enables accurate prediction across heterogeneous samples without requiring sample-specic model selection or parameter tting. The 70–95% p erformance gap between current aggregated ts and individual ts quanties the value proposition that PINNs must deliver . The comprehensive pr operty-uptake analysis evaluated 43 distinct material properties across 224 hydrogen uptake measur ements (123 clay , 39 shale, and 62 coal samples). Property availability varied substantially across lithologies, r eecting dierences in standard characterization protocols for each geological material class, as we outlined in [ 27 ]. Hydr ogen uptake distributions conrmed lithology- specic sorption behaviors previously identied in isotherm analysis (Section 4.1 ), as summarized in Fig. 3 a. Coal samples exhibited the highest mean uptake (0.378 ± 0.205 mmol/g, median 0.320 mmol/g, range 0.03–0.88 mmol/g), with narrow distributions (coecient of variation 54%) indicating consistent sorption capacity across rank variations. Shale measurements demonstrated bimodal character , with mean uptake (0.282 ± 0.450 mmol/g) and occasional high-uptake outliers associated with elevated organic content. Clay minerals showed intermediate mean uptake (0.232 ± 0.276 mmol/g, median 0.122 mmol/g) with the widest range (0–1.2 mmol/g) and highest variability (coecient of variation 119%), consistent with surface area heterogeneity spanning tw o orders of magnitude. 4.3.1 Correlation Structures, Bootstrap Uncertainty , and Predictive Mo deling Pearson correlation analysis identie d 23 property-uptake relationships excee ding | r | > 0 . 3 with statistical signicance ( p < 0 . 05 ), distributed across lithologies as 2 clay correlations, 12 shale correla- tions, and 9 coal correlations (Fig. 3 b,e). Bootstrap resampling with 1,000 iterations provided robust uncertainty quantication for these relationships, yielding 95% condence intervals that account for sampling variability and non-normal distributions (Fig. 3 c). Clay minerals exhibited strong positive corr elations between uptake and textural properties. Spe- cic surface area demonstrate d the strongest relationship ( r = 0 . 598 , p < 0 . 001 , n = 121 ), with bootstrap analysis conrming stability (mean b ootstrap r = 0 . 597 , 95% CI [0.472, 0.704]) (Fig. 3 d). This relationship validates the dominant role of physisorption on accessible surfaces in clay sorption me cha- nisms. Pore volume also correlated positively ( r = 0 . 523 , p < 0 . 001 , n = 56 , 95% CI [0.295, 0.699]), though the broader condence interval reects greater uncertainty due to sparse measurements (45.5% completeness). Micropore volume showed weaker correlation ( r = 0 . 292 , p = 0 . 012 , n = 74 , 95% CI [0.058, 0.494]), suggesting that total surface area dominates over pore size distribution in controlling clay sorption capacity . Shale correlations revealed mineralogical controls on hydrogen uptake. T otal organic carb on exhibited the strongest positive correlation ( r = 0 . 755 , p < 0 . 001 , n = 39 , 95% CI [0.596, 0.862]) (Fig. 3 d), 22 Clays Shales Coals 0.0 0.5 1.0 1.5 2.0 H 2 Uptake (mmol g −1 ) mean=0.232 med=0.122 CV=118% n=123 mean=0.282 med=0.160 CV=159% n=39 mean=0.378 med=0.320 CV=54% n=62 (a) H 2 Uptake Distributions by Lithology −0.75 −0.50 −0.25 0.00 0.25 0.50 0.75 Pearson Correlation Coefficient r Pore Volume SSA (m 2 g −1 ) Pyrite SSA (m 2 g −1 ) Quartz Langite Ankerite TOC Volatile Matter Ash Avg Pore Diameter Vitrinite Reflectance % R o Micropore Volume Fixed Carbon r =0.523, n=56 r=0.598, n=121 Clays r=-0.644, n=39 r=-0.497, n=32 r=-0.492, n=39 r=-0.475, n=32 r=0.549, n=39 r=0.755, n=39 Shales r=-0.709, n=50 r=-0.373, n=50 r=0.369, n=42 r=0.490, n=45 r=0.650, n=13 r=0.711, n=48 Coals (b) Significant Property-Uptake Correlations ( | r | > 0.3 , p < 0.05 ) Correlation sign Positive Negative −0.75 −0.50 −0.25 0.00 0.25 0.50 0.75 1.00 Pearson r with 95% Bootstrap CI (1000 iterations) Pore Volume SSA (m 2 g −1 ) Pyrite Ankerite TOC Volatile Matter Micropore Volume Fixed Carbon n=56 n=121 n=39 n=39 n=39 n=50 n=13 n=48 Clays Shales Coals (c) Bootstrap 95% Confidence Intervals for Key Correlations Clays Shales Coals 0 2 4 6 8 Number of Significant Correlations ( p < 0.05 , | r | > 0.3 ) 2 5 5 6 3 Total: 2 Total: 12 Total: 9 T otal: 23 significant correlations (2 clay, 12 shale, 9 coal) (e) Correlation Sign Distribution by Lithology Positive ( r > 0.3 ) Negative ( r < −0.3 ) 0 50 100 150 SSA (m 2 g −1 ) 0.0 0.2 0.4 0.6 0.8 1.0 H 2 Uptake (mmol g −1 ) r = 0.586 p<0.001 n = 121 Clays (d) 0 2 4 6 8 TOC (wt%) r = 0.682 p<0.001 n = 39 Shales 30 40 50 60 70 80 Fixed Carbon (wt%) r = 0.784 p<0.001 n = 48 Coals Key Property-Uptake Relationships (dominant driver per lithology) with linear regression and 95% bootstrap CI Figure 3: Property–uptake relationships for hydr ogen sorption across 224 measur ements in clays ( n = 123 ), shales ( n = 39 ), and coals ( n = 62 ). Pearson correlation analysis revealed 23 signicant relationships ( | r | > 0 . 3 , p < 0 . 05 ; 2 clay , 12 shale, 9 coal), with b ootstrap resampling (1000 iterations) for uncertainty quantication. Results highlight lithology-specic controls — surface area in clays, organic content in shales, and rank-dep endent aromaticity in coals — motivating the lithology-branched PINN architecture (Section 3.5 ). (a) Hydrogen uptake distributions by lithology (violin plots with interquartile boxes, medians, and data points). Coals showed highest mean uptake ( 0 . 378 ± 0 . 205 mmol g − 1 , CV 54%), shales the widest range ( 0 . 282 ± 0 . 450 mmol g − 1 ), and clays the greatest r elative variability ( 0 . 232 ± 0 . 276 mmol g − 1 , CV 119%). (b) Signicant property–uptake correlations ( | r | > 0 . 3 , p < 0 . 05 ), grouped by lithology and sorted by decreasing | r | . Bar color indicates sign (green = positive, red = negative); values show Pearson r and valid n . (c) Bootstrap 95% condence intervals for the three strongest correlations per lithology (1000 iterations). Wide CI for coal micropore volume ( r = 0 . 650 , 95% CI [0.118, 0.894], n = 13 ) reects data sparsity limiting model performance. ( d) Dominant driver of uptake for each lithology with linear regression and 95% bo otstrap condence bands (500 iterations): specic surface area (clays, r = 0 . 598 , n = 121 ), total organic carbon (shales, r = 0 . 755 , n = 39 ), xed carbon (coals, r = 0 . 711 , n = 48 ). (e) Numb er of positive ( r > 0 . 3 ) and negative ( r < − 0 . 3 ) signicant correlations by lithology . Shales show the most diverse pattern (12 total: 7 p ositive, 5 negative), clays only positive (2 total), and coals predominantly positive (9 total: 6 positive, 3 negative). indicating that organic-hosted porosity and surface sites dominate sorption in organic-rich formations. Ankerite ( r = 0 . 549 , p < 0 . 001 ) and berlinite ( r = 0 . 470 , p = 0 . 003 ) showed positive correlations, potentially reecting associations with organic-rich inter vals rather than direct mineralogical eects. Conversely , pyrite content demonstrated a strong negative correlation ( r = − 0 . 644 , p < 0 . 001 , 95% CI [ − 0.783, − 0.445]). Quartz ( r = − 0 . 492 , p = 0 . 001 ), dolomite ( r = − 0 . 405 , p = 0 . 011 ), and microcline ( r = − 0 . 338 , p = 0 . 035 ) also correlated negatively , consistent with their roles as matrix minerals diluting organic content. Surface area in shale samples exhibited an unexpecte d negative corr elation ( r = − 0 . 497 , p = 0 . 004 , n = 32 ), contradicting typical physisorption expe ctations and suggesting that inorganic mineral surfaces contribute minimally to hydrogen uptake r elative to organic matter . Coal samples rev ealed rank-dependent and textural controls consistent with coalication theory . 23 Fixed carbon content showed the strongest positive correlation ( r = 0 . 711 , p < 0 . 001 , n = 48 , 95% CI [0.555, 0.821]) (Fig. 3 d), while volatile matter e xhibited a nearly equal-magnitude negative correlation ( r = − 0 . 709 , p < 0 . 001 , n = 50 , 95% CI [ − 0.822, − 0.554]). These mirror-image relationships reect the fundamental coalication trend: increasing rank enhances aromaticity and micropore development, both favoring hydrogen adsorption, while v olatile matter decreases with rank advancement. Vitrinite reectance reinforced this pattern ( r = 0 . 490 , p < 0 . 001 , n = 45 ), conrming that higher-rank coals exhibit enhanced sorption capacity . Micropore volume demonstrated the strongest textural correlation ( r = 0 . 650 , p = 0 . 016 , n = 13 ), though limited sample size yields broad condence intervals (95% CI [0.118, 0.894]) (Fig. 3 c). Ash content ( r = − 0 . 373 , p = 0 . 008 ) and moisture ( r = − 0 . 328 , p = 0 . 023 ) exhibited negative correlations r eecting dilution eects. Supervise d learning models traine d on the identied property sets quantie d the collective predic- tive power of these correlations and guide d PINN feature selection (Fig. 4 a,c). Acr oss all lithologies, random forest regression outperforme d both linear and ridge regression, conrming the non-linear and interactive nature of property-uptake relationships. Shales achieved the b est overall generalization performance, b eneting from comprehensive coverage of mineralogical features. Ridge regression was essential for stabilizing shale predictions, improving upon unregularized linear regression by a factor of 48 in cross-validation R 2 (0.551 versus − 1.130), demonstrating the critical imp ortance of regularization. Clay minerals achiev ed moderate cross-validation performance (random forest CV R 2 = 0.523) with high fold-to-fold variance reecting surface area heterogeneity . Coal mo dels yielded the weakest generalization (random forest CV R 2 = 0.352), attributable to the critical importance of micropore volume yet its limited availability (21% completeness) and the non-linear rank ee cts not fully captured by available proxies. These results establish quantitative performance baselines and conrm that surface area, TOC, xed carb on, and micropore volume constitute the essential property inputs for PINN feature engineering, while the persistent p erformance gaps justify the adaptive multi-scale PINN architecture described in Section 3.5 . 4.3.2 Feature Importance Hierarchies and Implications for PINN Design Random forest models with 100 estimators provided stable feature imp ortance rankings based on mean decrease in node impurity (Fig. 4 b), establishing priority hierar chies for PINN input layer design and validating physical mechanisms inferred from correlation analysis. Clay mineral importance conrmed surface area dominance, with specic surface area accounting for 80.9% of total predictive importance and micropore volume for the remaining 19.1%. This 4:1 importance ratio substantially exceeds the corresponding correlation ratio ( r = 0 . 598 versus r = 0 . 292 ), indicating that surface area provides both stronger individual prediction and greater synergy with implicit structural factors encoded in ensemble de cision trees. This result justies surface-area-centric architectures for clay-specic PINN branches, with micropore metrics serving as secondary renements. Shale importance analysis rev ealed more distribute d control. T otal organic carbon ranked rst (52.7% imp ortance), validating its status as the primary sorption predictor . A verage pore diameter contributed 13.5%, while berlinite (11.2%) and langite (15.4%) likely reect pro xies for organic-rich facies rather than direct mineralogical eects. Notably , specic surface area ranked seventh (1.3% importance) despite its signicant negative correlation, conrming that TOC and pore structure capture the critical variance while mineral surface area adds minimal incremental information. Detailed mineralogy bey ond 24 Clays Shales Coals −4 −3 −2 −1 0 5-Fold CV R 2 (mean ± SD) 0.348 -1.130 -1.085 0.347 0.551 -0.290 0.523 0.787 0.352 Below-zero: worse than mean predictor (a) Ridge: +0.5x vs Linear Predictive Model Performance (5-Fold Cross-Validation) Linear Regression Ridge Regression Random Forest Lin Rid Ran Lin Rid Ran Lin Rid Ran −7 −6 −5 −4 −3 −2 −1 0 1 Per-Fold R 2 Clays Shales Coals (c) Cross-Validation Fold V ariability (5 Folds, 3 Models × 3 Lithologies) Linear Ridge RandomForest 0 20 40 60 80 100 Property Data Completeness (%) 0.3 0.4 0.5 0.6 0.7 | Pearson r | with H 2 Uptake SSA (m 2 g −1 ) TOC SSA (m 2 g −1 ) Micropore Volume Fixed Carbon Data-sparse zone (<30%) (d) Data Completeness vs. Correlation Strength (point size ∝ √ n ) Lithology Clays Shales Coals −0.4 −0.2 0.0 0.2 0.4 0.6 RF Feature Importance (mean node impurity decrease) SSA (m 2 g −1 ) Micropore Volume TOC Langite Avg Pore Diameter Berlinite Vitrinite Refl. % R o Volatile Matter Avg Pore Diameter SSA (m 2 g −1 ) Fixed Carbon 80.9% physisorption surface 19.1% pore geometry Clays 52.7% organic-hosted porosity 15.4% organic-rich facies proxy 13.5% pore geometry 11.2% organic-rich facies proxy Shales 23.2% coalification degree 22.0% inverse maturity proxy 12.7% pore geometry 12.4% surface area 9.4% aromaticity proxy Coals (e) PINN Feature Priority by Lithology Branch (top features, coloured by mechanism) Mechanism type Structural Chemical Rank 0.00 0.05 0.10 0.15 0.20 0.25 0.30 RF Feature Importance (Mean Node Impurity Decrease) Liptinite Vol Moisture Vitrinite Vol Inertinite Vol Pore Volume Ash Fixed Carbon SSA (m 2 g −1 ) Avg Pore Diameter Volatile Matter Vitrinite Reflectance % R o 9.4% 12.4% 12.7% 22.0% 23.2% Coals Siderite Apatite Dolomite Clay Plagioclase Feldspar Quartz Microcline Calcite Pyrite Ankerite SSA (m 2 g −1 ) Sample Type Micropore Volume Berlinite Avg Pore Diameter Langite TOC 11.2% 13.5% 15.4% 52.7% Shales Micropore Volume SSA (m 2 g −1 ) 19.1% 80.9% Clays (b) Random Forest Feature Importance (100 Estimators, per Lithology) Figure 4: Sup ervised predictive modelling and Random Forest feature importance for hydrogen uptake across three lithologies, pr oviding performance baselines and feature priorities for PINN input layer design. Three model classes were teste d — linear regression, Ridge regression ( α = 1 . 0 ), and Random Forest (100 estimators, max depth 5), using 5-fold cross-validation. (a) Five-fold cross-validation R 2 (mean ± SD) by model and lithology (grouped bars with per-fold error bars). Red zone indicates worse-than-mean p erformance. Ridge markedly improves shale R 2 from − 1 . 130 (linear) to 0 . 551 due to multicollinearity . Random Forest yields the highest performance overall ( clay CV R 2 = 0 . 523 ; coal CV R 2 = 0 . 352 ). (b) Random Forest feature importance (mean decrease in impurity) by lithology (stacked horizontal bars). V alues ≥ 5% labelled. Clays are dominated by specic surface area (80.9%). Shales show distributed importance led by TOC (52.7%), langite (15.4%), average pore diameter (13.5%), and b erlinite (11.2%). Coals are led by vitrinite reectance (%R o , 23.2%) and volatile matter (22.0%). (c) Per-fold R 2 variability (box-and-strip plots) for each model–lithology combination. Red zone marks negative performance. Shale linear regression shows extreme instability ( some folds R 2 < − 1 . 8 ), while Random Forest remains consistently positive . (d) Property data completeness (%) vs. absolute Pearson | r | for signicant pairs ( p < 0 . 05 , | r | > 0 . 2 ), with point size ∝ √ n and colour by lithology . Purple zone ( < 30% completeness) highlights coal micropore volume (21% complete, | r | = 0 . 650 ), the strongest predictor yet least measured — a key challenge for coal PINN development. (e) PINN input feature priorities by lithology (lollipop chart), coloured by mechanism: blue (structural: surface area, pores), green (chemical: organics, mineral proxies), orange (rank: coalication indicators). Clay branches prioritize surface area; shale branches require TOC and pore metrics; coal branches emphasize rank indicators (%R o , volatile matter) plus te xture. these top-ranked parameters therefore warrants low er priority in shale-specic PINN input layers. Coal importance identie d vitrinite reectance (%R o ) as the dominant predictor (23.2%), surpassing volatile matter (22.0%) and xed carbon (9.4%) despite mo derate correlation strength ( r = 0 . 490 ), indicating that rank indicators provide non-redundant information beyond comp ositional proxies. A verage p ore diameter (12.7%) and sp ecic surface area (12.4%) together accounted for 25% of total importance, highlighting the dual role of textural controls alongside rank. Critically , micr opore volume ’s strong correlation ( r = 0 . 650 ) is absent fro m the importance ranking entirely , reecting its 21% data completeness prev enting the ensemble from r elying on it during training (Fig. 4 d). This discrepancy between physical importance and data availability constitutes the central challenge for coal PINN development: the property most strongly governing sorption capacity is also the least measured, ne ces- 25 sitating physics-based constraints and rank-deriv ed proxy relationships to comp ensate for measurement sparsity . T aken together , these importance hierarchies establish concrete and lithology-sp ecic feature prioritization for the PINN architecture (Fig. 4 e). Clay networks are surface-area dominated; shale networks require organic content and por e structure as mandatory inputs; and coal networks depend critically on rank indicators combined with textural metrics. The persistent gaps b etween correlation strength and predictive performance, most pr onounced in coals, conrm that the adaptive non-linear architecture described in Section 3.5 is ne cessary to capture threshold eects, feature interactions, and data-sparse physical controls that xed parametric models and linear combinations cannot represent. 4.4 Data Integration, Feature Engine ering, and Dataset Curation Integration of material property characterizations (Section 4.3 ) with isotherm measurements (Sec- tion 4.2 ) unied heterogeneous data sources into a cohesive dataset suitable for PINN training. Using composite reference-sample keys, the matching algorithm established that 65% of samples appear in both property and isotherm tables, while the r emaining 35% contribute capacity-only measur ements. This dual population enables the network to learn both pressure-dependent sorption cur ves from fully characterized samples and property-uptake correlations from capacity measurements, maximizing information extraction from available data. 4.4.1 Physics-Informed Feature Engineering Systematic application of the sev en-category feature engineering framework (Section 3.4 ) generated 62 derived features transforming raw measurements into thermodynamically meaningful descriptors. Feature distribution across categories reects the relative complexity of each physical domain: thermo- dynamic descriptors (14 features, 22.6%) capture fundamental driving forces through temperature and pressure transformations; pore structur e descriptors (15 features, 24.2%) quantify connement eects and accessible surface area; surface chemistr y parameters (11 features, 17.7%) encode lithology-sp ecic compositional controls; interaction terms (14 features, 22.6%) represent synergistic eects between material properties and measurement conditions; and kinetic and molecular sieving descriptors (8 features combined, 12.9%) ag transport limitations and size-exclusion constraints. The 62 engineered features represent appro ximately a sixfold expansion relative to the 10–12 raw measured properties per sample, achieving substantial dimensional enrichment without excessive proliferation. Feature completeness varies systematically by categor y: thermodynamic features achieve 100% completeness by construction, structural features inherit source property completeness (42–98%), and compositional features reect lithology-sp ecic measurement availability (100% for shales, 50–80% for coals, 8–60% for clays). This completeness hierarchy directly informed ensemble feature selection, as described b elow , by prioritizing highly complete features to minimize reliance on imputed values in the nal training set (Fig. 5 ). 4.4.2 Preprocessing, Outlier Treatment, and Feature Selection Adaptive preprocessing addressed missing values through a three-tier imputation strategy stratied by completeness: K -nearest neighbors imputation ( k = 5 ) for low-missingness features ( < 10% ), 26 0.0 0.1 0.2 0.3 0.4 0.5 0.6 0.7 Bootstrap Feature Importance (|Pearson r|, 95% CI, 1000 iterations) Pore Volume Inverse T emperature Ratio Hydrogen Mesopore Fraction Micropore Fraction T emperature (K) Product Adsorption Driving Force Henry Coefficient Approx Inertinite Pyrite TOC Ratio TOC SSA Ratio C H Ratio SSA Log Pressure Product Pore Volume Pressure (Bar) Product Volatile Matter Pyrite Wt Percent Ro Log Ro Berlinite Wt Calcite Wt Clay Quartz Ratio Clay Wt (a) T op 20 Features — Ensemble Selection with Bootstrap Confidence Intervals Feature Category Thermodynamic Pore Structure Surface Chemistry Classical Models Interactions Kinetic Molecular Sieving 0.3 0.4 0.5 0.6 0.7 Bootstrap Mean Importance (|Pearson r|, 1000 iterations) 0.05 0.10 0.15 0.20 0.25 0.30 0.35 0.40 Bootstrap 95% CI Width (instability) Clay Wt Clay Quartz Ratio Calcite Wt Berlinite Wt Log Ro Percent Ro Pyrite Wt Volatile Matter Pore Volume Pressure (Bar) Product SSA Log Pressure Product C H Ratio TOC SSA Ratio High importance Stable (preferred) L ow importance U nstable (b) Feature Importance vs. Bootstrap Stability (point size = ensemble vote count) Category / Votes Thermodynamic Pore Structure Surface Chemistry Classical Models Interactions Kinetic Votes: 1 method Votes: 2 Votes: 3 Votes: 4 methods Fold 1 Fold 2 Fold 3 Fold 4 Fold 5 Cross-Validation Fold 0.0 0.2 0.4 0.6 0.8 1.0 R² Score (c) 5-Fold Cross-Validation Performance (Random Forest Baseline Estimator) M ean R² = 0.94 3±0.0 06 R² (RF baseline ) M ean RMSE = 0.059 5 R MSE (mmol g ⁻¹) Train (70%) Validation (15%) T est (15%) 0 200 400 600 800 1000 1200 Number of Samples 817 175 176 386 83 83 127 27 27 n=1330 (70 %) n=285 (15%) n=286 (15%) 70 / 15 / 15 % split Stratified by lithology (d) Stratified Train/V alidation/T est Splits (Lithology-Stratified StratifiedShuffleSplit) Lithology Clays Shales Coals 0 1 2 3 4 5 6 7 8 H₂ Uptake (mmol g⁻¹) 0.0 0.1 0.2 0.3 0.4 0.5 Kernel Density Estimate KS test (train vs test): D=0.051, p=0.555 Distributions consistent ✓ (e) T arget Distribution Across Splits (KDE — Stratification Quality) Train (n=1330) Validation (n=285) T est (n=286) Overall distribution 0.00 0.01 0.02 0.03 0.04 0.05 0.06 RMSE (mmol g⁻¹) Figure 5: Ensemble feature selection, bo otstrap stability , cross-validation performance, and stratied dataset preparation. Four methods (Pearson correlation, mutual information regression, Random Forest importance, F -statistic) were applied to the scaled feature matrix; nal selection used majority voting. (a) T op 20 features ranked by mean bo otstrap importance (absolute Pearson r , 1000 iterations), shown as horizontal bars with 95% CI error bars. Colours indicate category (thermodynamic, p ore structure, surface chemistry , interaction, kinetic, molecular sieving, classical model-derived), highlighting multi-domain predictive power . (b) Feature importance vs. bo otstrap stability scatter: mean b ootstrap importance ( x -axis) vs. 95% CI width ( y -axis, instability measure); point size reects ensemble vote count (1–4). Green quadrant marks high-importance, low-instability featur es preferred for PINN input. Dashe d lines show median thresholds. (c) Five-fold cross-validation performance of Random Forest baseline on selected features: R 2 (blue, le axis) and RMSE (mmol g − 1 , orange, right axis) per fold. Dashed lines indicate cross-fold means. (d) Lithology-stratie d train (70%), validation (15%), and test (15%) splits via StratifiedShuffleSplit . Stacked bars show sample counts per lithology; p ercentages conrm proportional representation across partitions. (e) Kernel density estimates of H 2 uptake for each split and overall dataset. T wo-sample K olmogorov–Smirnov test conrms statistically consistent target distributions between training and test splits. median imputation within lithology for me dium missingness (10–30%), and lithology-stratied me dian imputation for 71 features with high missingness ( > 30% ). The prevalence of high-missingness features reects the variable property suites r eported across the compiled literature [ 27 ], where characterization depth depends on individual resear ch objectives and analytical capabilities. Lithology-stratied imputa- tion for high-missingness features is essential for geological consistency , prev enting mineralogically implausible estimates that would corrupt property-uptake correlations. Dual-perspective outlier detection combined univariate IQR analysis with multivariate Isolation Forest classication. The elevated univariate outlier rate reects the multi-order-of-magnitude pr operty ranges characteristic of geological materials (e.g., surface areas spanning 0.01–273 m 2 /g), where heavy- tailed distributions naturally produce numerous univariate extremes repr esenting genuine geological variation rather than measurement errors. Samples agged by b oth methods simultaneously , exhibiting both individual parameter extremes and implausible multi-feature combinations, were excluded as likely experimental artifacts, predominantly corresponding to incompletely characterized samples 27 whose multiple imputed values generated feature combinations inconsistent with physical constraints. Samples agged by either method alone, but not b oth, underwent winsorization to the 1st and 99th p er- centiles, retaining rank-or der relationships while limiting gradient magnitudes during backpropagation. Following outlier treatment, the integrated dataset was reduced to 1,901 curated samples. Ensemble feature selection combining Pearson correlation ranking and random forest importance scores identied the 50 most informative features from the 62 engineered candidates through consensus voting (Fig. 5 a). This dual-method approach eciently captured both linear relationships and non- linear interactions while remaining computationally tractable given dataset size constraints. Sele cted features demonstrate strong enrichment for compositional parameters (clay weight percent, log vitrinite reectance, v olatile matter), structural descriptors (surface area, micropor e fraction, connement parameter), thermodynamic variables (temperature, pressure, reduced forms), and physically motivate d interactions (adsorption driving force, Henry coecient approximation), conrming that ensemble voting prioritized features encoding fundamental sorption physics over statistical artifacts. Bootstrap resampling with 1,000 iterations further quantie d feature importance stability (Fig. 5 b), distinguishing high-importance features with narrow condence intervals, suitable for dedicate d network pathways, from unstable lower-importance features handled through shar ed representations or excluded entirely . A Random Forest baseline trained on the selecte d feature set achieved consistent cross-validation performance across folds (Fig. 5 c), validating that the selected features supp ort generalizable prediction prior to PINN training. 4.4.3 Thermodynamic Parameter Extraction V an’t Ho analysis of multi-temperature sample groups extracted enthalpy , entropy , and Gibbs free energy parameters to characterize temp erature-dependent sorption thermodynamics. However , t quality was highly variable: mean R 2 of ln K versus 1 /T regression was 0.173 ± 0.294 (median 0.007), indicating that temperature-dependent e quilibrium constants do not consistently follow ideal V an’t Ho b ehavior across the sample population. Four compounding factors explain this outcome. First, two-temperature samples yield R 2 = 1 . 0 by denition, inating mean t quality without providing genuine thermo dynamic information. Second, concurrent pressure variations in some experiments violate the constant-pressure assumption underlying V an’t Ho analysis. Third, Langmuir model inadequacy for heterogeneous geological adsorb ents propagates artifactual temperature dependencies into extracted equilibrium constants. Fourth, logarithmic and reciprocal-temp erature transformations amplify measurement uncertainties, increasing appar ent scatter even for high-quality isotherms. Consequently , extracted thermodynamic parameters serve as approximate guidance for PINN constraint initialization rather than strictly enforced targets. Network training therefor e employs so thermodynamic penalty terms p enalizing large deviations from expected physisorption energetics while preserving exibility to learn sample-spe cic variations, as detailed in Appendix 6.5.2 . Importantly , multi-temperature samples still provide valuable training diversity by p opulating the thermal dimension of the feature space more densely than single-temperature datasets, enabling the network to learn empirical temperature-uptake trends that complement physics-based constraints wherever classical thermodynamic parameterizations prove unr eliable. 28 4.4.4 Dataset Partitioning and Summar y Statistics Stratied random splitting partitioned the 1,901 curated samples into training (1,330 samples, 70.0%), validation (285 samples, 15.0%), and test (286 samples, 15.0%) sets, with lithology proportions maintained across all partitions ( validation: 61.4% clay , 29.1% shale, 9.5% coal; test: 61.5% clay , 29.0% shale, 9.4% coal) (Fig. 5 d). Sample-level splitting ensured that all measurements from a given sample appeared exclusively in one partition, pre venting information leakage through which the network could exploit sample identity rather than learning genuine property-based relationships. T arget variable distributions conrm successful stratication (Fig. 5 e). Training set hy drogen uptake spans 0–1.30 mmol/g (mean 0.160 ± 0.251 mmol/g, median 0.044 mmol/g), the validation set spans 0–1.25 mmol/g (mean 0.155 ± 0.247 mmol/g, me dian 0.042 mmol/g), and the test set spans 0–1.09 mmol/g (mean 0.157 ± 0.250 mmol/g, median 0.043 mmol/g). Cross-partition dierences in means and standard deviations r emain below 3%, and the consistent right-skewed distributions conrm that high-uptake samples associated with high-surface-area clays and organic-rich shales are proportionally represented throughout, supporting fair and unbiase d model evaluation. Feature value distributions exhibit comparable balance , with mean values for all 50 selected features varying by less than 5% across splits. The curate d dataset satises all three fundamental requirements for successful PINN training. Multi- source integration pro vides comprehensive sample characterization combining isotherm measurements with material property proles, enabling the conditional network architecture to adapt predictions base d on sample characteristics. Physics-informed feature engine ering explicitly encodes thermodynamic principles, pore structure eects, and transport phenomena, reducing the network’s r epresentational burden from discov ering fundamental physics to rening corrections for non-ideal behavior . Rigorous preprocessing with adaptive imputation, outlier treatment, and cross-validated feature selection ensures data quality while guarding against overtting to training artifacts, supporting genuine predictive generalization to unseen geological materials. 4.5 Physics-Informed Neural Network Performance and V alidation 4.5.1 Lithology-Specic Performance The optimize d multi-scale PINN achieved R 2 = 0.9544, RMSE = 0.0484 mmol/g, and MAE = 0.0231 mmol/g on the strictly held-out test set, representing the str ongest performance among all evaluated models (Fig. 6 a). Mean bias error (MBE = − 0.0081 mmol/g, 0.5% of mean uptake) indicates negligible systematic bias, with conservative underprediction appropriate for engine ering applications where capacity over estimation poses greater operational risk than underestimation. The maximum absolute error (0.3816 mmol/g) arises from a single high-uptake coal sample at the 99.7th percentile of the uptake distribution; excluding this point, the 99th percentile error reduces to 0.226 mmol/g. Bo otstrap condence inter vals (10,000 resamples) for R 2 yielded 95% CI [0.948, 0.961], conrming that the reported performance is statistically robust rather than an artifact of a favorable data partition. Per-lithology decomposition rev eals dierential accuracy aligned with training set size, feature availability , and material complexity (T able 4 ; Fig. 6 b–d). Clay predictions achiev ed the highest accuracy (R 2 = 0.9657, Fig. 6 b), beneting from the largest training representation (64.5%), strong and w ell-characterized feature-uptake correlations (Se ction 4.3.1 ), 29 T able 4: Lithology-sp ecic PINN performance on the held-out test set. Lithology R 2 RMSE MAE Max Error MBE (mmol/g) (mmol/g) (mmol/g) (mmol/g) Clays 0.9657 0.0488 0.0249 0.3406 − 0.0022 Shales 0.8282 0.0325 0.0170 0.2244 − 0.0163 Coals 0.7666 0.0777 0.0297 0.3816 − 0.0218 0.0 0.1 0.2 0.3 0.4 0.5 0.6 0.7 0.8 Predicted H 2 uptake (mmol g −1 ) 0.0 0.1 0.2 0.3 0.4 0.5 0.6 0.7 0.8 Measured H 2 uptake (mmol g −1 ) (a) R 2 = 0.9544 95% CI [0.948, 0.961] RMSE = 0.0484 mmol g −1 MAE = 0.0231 mmol g −1 MBE = -0.0081 mmol g −1 Clays Shales Coals 0.0 0.1 0.2 0.3 0.4 0.5 0.6 0.7 0.8 Predicted H 2 uptake (mmol g −1 ) 0.0 0.1 0.2 0.3 0.4 0.5 0.6 0.7 0.8 Measured H 2 uptake (mmol g −1 ) (b) R 2 = 0.9657 RMSE = 0.0488 MAE = 0.0249 MBE = -0.0022 n = 185 Training share: 64.5% SW normality p = 0.08 Calibration: 75% Clays 0.0 0.2 0.4 0.6 0.8 Predicted H 2 uptake (mmol g −1 ) 0.0 0.2 0.4 0.6 0.8 Measured H 2 uptake (mmol g −1 ) (c) R 2 = 0.8282 RMSE = 0.0325 MAE = 0.0170 MBE = -0.0163 n = 36 High-TOC error: +47% Calibration gap: 19.3% ρ het = 0.48 Shales 0.0 0.1 0.2 0.3 0.4 0.5 0.6 Predicted H 2 uptake (mmol g −1 ) 0.0 0.1 0.2 0.3 0.4 0.5 0.6 Measured H 2 uptake (mmol g −1 ) (d) R 2 = 0.7666 RMSE = 0.0777 MAE = 0.0297 MBE = -0.0218 n = 65 Rank range: sub-bit.→anth. Ensemble stability R 2 [0.71, 0.83] Calibration: 92.6% Coals Figure 6: Prediction performance of the optimised multi-scale PINN on the held-out test set ( n = 286 ; clays n = 185 , shales n = 36 , coals n = 65 ), shown via parity plots of predicted vs. measured H 2 uptake. Overall metrics: R 2 = 0 . 9544 (95% bootstrap CI [0.948, 0.961], 10,000 resamples), RMSE = 0.0484 mmol g − 1 , MAE = 0.0231 mmol g − 1 , MBE = − 0 . 0081 mmol g − 1 (0.5% of mean uptake). Dashed diagonal indicates perfect agr eement; all panels use shared axis scaling. (a) Overall parity plot for all 286 test points, coloured by lithology . Annotation reports global R 2 , 95% CI, RMSE, MAE, and MBE. (b) Parity plot for clays ( R 2 = 0 . 9657 , RMSE = 0.0488 mmol g − 1 ). Highest accuracy reects the largest training representation, surface-area-dominated mechanisms, and near- normal residuals (Shapiro- Wilk p = 0 . 08 ). (c) Parity plot for shales ( R 2 = 0 . 8282 , RMSE = 0.0325 mmol g − 1 ). Larger errors in high- TOC samples ( > 3 wt%) and heteroscedasticity ( ρ = 0 . 48 ) indicate unresolved multi-scale heterogeneity . (d) Parity plot for coals ( R 2 = 0 . 7666 , RMSE = 0.0777 mmol g − 1 ). Ensemble stabilisation and physics constraints yield 92.6% calibration coverage despite the smallest training set and the widest rank range. and relatively homogeneous phyllosilicate sorption mechanisms. Near-normal residuals (Shapiro- Wilk p = 0 . 08 ) and adequate calibration coverage (75%) supp ort condent hydrogen sorption capacity estimations. Shale predictions (R 2 = 0.8282, Fig. 6 c) explain 82.8% of variance with minimal bias (MBE = − 0.0163 mmol/g), with residual unexplained variance concentrating in high- TOC samples ( > 3 wt%), whose 30 prediction errors are 47% larger than the typical sha le MAE. This points to multi-scale compositional heterogeneity that bulk characterization metrics inade quately resolve. The 19.3% calibration under- coverage r einforces that standard pr operty measurements leave a portion of shale sorption b ehavior intrinsically unpredictable without sub-sample-scale structural information. Coal predictions (R 2 = 0.7666, Fig. 6 d) represent the most challenging scenario: the smallest training set spanning a wide rank range (sub-bituminous to anthracite), creating sparse coverage between rank categories and necessitating interpolation over large featur e-space distances. Despite this, the model maintains excellent calibration (92.6% coverage), ensemble stability (single-member R 2 range [0.71, 0.83] stabilizing to 0.7666 aer aggregation), and physically consistent predictions, demonstrating that architectural ensemble learning combined with physics constraints can extract meaningful patterns under data-limited conditions when rank-base d features exhibit a strong physical correlation with sorption capacity . 4.5.2 Physics Constraint Satisfaction and Residual Diagnostics Physics constraint validation conrmed strong thermodynamic adherence across the test set (Fig. 8 a). The Soplus output activation enforced strict non-negativity (0.0% negative predictions). Upper bound violations aected only 1.4% of samples (four predictions marginally excee ding lithology-specic q max by 2 to 5%), and monotonicity was satised in 98.6% of cases, with violations conned to the low-pressure regime ( < 10 bar) wher e experimental scatter legitimately reects non-equilibrium conditions rather than equilibrium isotherms. Saturation consistency reached 87.3%, with high-pressure predictions falling within 70 to 100% of q max as intended by the so physics p enalty design. T o quantify the contribution of physics-informed training, an unconstrained baseline (identical architecture, trained without physics losses) was evaluated under identical conditions. The unconstrained mo del produced 8.4% negative predictions, 12.6% upper b ound violations, and 15.8% monotonicity violations, demonstrating 6 to 10 × violation reduction attributable to the physics loss terms. The intentionally so constraint design permits minor deviations when data contradict idealized physics assumptions, balancing physical consistency against prediction accuracy rather than forcing thermodynamic compliance at the cost of t quality . Residual analysis conrmed minimal systematic bias (mean = − 0.0081 mmol/g, std = 0.0518 mmol/g) (Fig. 7 ). The Shapiro- Wilk test rejecte d Gaussianity (W = 0.952, p < 0 . 001 , Fig. 7 c,d), with right-skewed residuals (skewness = 0.73, excess kurtosis = 1.42) attributable to the target distribution’s rare high- uptake tail rather than mo del misspe cication. Percentile analysis conrme d robust p erformance throughout the distribution (Fig. 7 b): median absolute error 0.0089 mmol/g, 90th percentile 0.0534 mmol/g, and 95th percentile 0.0935 mmol/g, indicating that 95% of predictions fall within 0.094 mmol/g, which is well within the tolerances of practical storage capacity assessments with typical safety factors of 1.5 to 2.0 × . Positive heteroscedasticity (Spearman ρ = 0 . 32 , p < 0 . 001 ; Breusch-Pagan LM = 48.3, p < 0 . 001 , Fig. 7 a) reects intrinsically greater absolute uncertainty at higher uptake values, with a mo derate variance ratio of 3.2 × across prediction quintiles. Lithology-stratied analysis revealed weak heteroscedasticity in clays ( ρ = 0 . 18 ), strong heteroscedasticity in shales ( ρ = 0 . 48 ), and non- signicant heteroscedasticity in coals ( ρ = 0 . 12 ), consistent with the lithology-spe cic complexity patterns identied in Section 4.5.1 . 31 0.0 0.1 0.2 0.3 0.4 0.5 0.6 0.7 0.8 Predicted H 2 uptake (mmol g −1 ) −0.25 −0.20 −0.15 −0.10 −0.05 0.00 0.05 0.10 0.15 Residual (mmol g −1 ) (a) Spearman ρ (global) = 0.32 Clays: ρ = 0.18 Shales: ρ = 0.48 Coals: ρ = 0.12 Breusch-Pagan LM = 48.3 ( p < 0.001 ) Clays Shales Coals 95th percentile band Clays Shales Coals 0.00 0.05 0.10 0.15 0.20 0.25 |Residual| (mmol g −1 ) (b) Median |e| = 0.0089 90th pct = 0.0534 95th pct = 0.0935 −0.25 −0.20 −0.15 −0.10 −0.05 0.00 0.05 0.10 0.15 Residual (mmol g −1 ) 0 2 4 6 8 Probability density (c) Skewness = -0.22 Excess kurtosis = 1.24 Shapiro-Wilk p = 0.0137 (right skew from high-uptake tail, not model misspecification) Observed Normal reference Mean = -0.0045 −3 −2 −1 0 1 2 3 Theoretical quantiles −0.25 −0.20 −0.15 −0.10 −0.05 0.00 0.05 0.10 0.15 Sample quantiles (mmol g −1 ) (d) Shapiro-Wilk W = 0.952 p < 0.001 : non-Gaussian Right-tail deviation from high-uptake coal samples Residuals Theoretical normal Figure 7: Residual diagnostics of the multi-scale PINN on the held-out test set, characterising error structure , distributions, and lithology-spe cic heteroscedasticity . Global residuals show mean − 0 . 0081 mmol g − 1 , SD 0 . 0518 mmol g − 1 ; 95% of pr edictions lie within ± 0 . 094 mmol g − 1 . (a) Residuals vs. predicted uptake, coloured by lithology . Global heteroscedasticity ( ρ = 0 . 32 , Breusch-Pagan p < 0 . 001 ); strongest in shales ( ρ = 0 . 48 ), weakest in clays ( ρ = 0 . 18 ) and coals ( ρ = 0 . 12 ). Shaded band marks ± 95th percentile error . ( b) Absolute error distribu- tions by lithology . Reference lines: global median (0.0089), 90th (0.0534), and 95th (0.0935) mmol g − 1 . Broader coal spread reects rank variability and data limitation. (c) Residual frequency histogram with tted Gaussian overlay . Mo dest skewness ( − 0.22) and excess kurtosis (1.24) driven by rare high-uptake extremes; maximum absolute error 0.3816 mmol g − 1 (single outlier ). (d) Normal Q-Q plot of residuals. Upper-tail deviation matches observed skew; bulk residuals appr oximate normality , with Shapiro- Wilk rejection ( p < 0 . 001 ) attributable to tail behaviour . 4.5.3 Hyperparameter Optimization and Training D ynamics Systematic hyperparameter optimization across 30+ experiments (Appendix 6.6.2 ) identied congura- tions that critically determine b oth prediction accuracy and physics constraint satisfaction. Dropout rate 0.10, identied as optimal through cross-validated evaluation across 15 independent random seeds (mean test R 2 = 0.9467 ± 0.0033, Fig. 9 c), substantially departs from conventional recommendations of 0.5 for fully connecte d networks, reecting that physics-informed ar chitectures with moderate capacity require lower regularization to preserve the representational power necessary for capturing heterogeneous sorption mechanisms. Performance exhibits sharp sensitivity near this optimum: increasing dropout to 0.12 degraded overall R 2 by 0.7% and coal predictions by 22% (Fig. 9 b), conrming that the optimal rate sits near the critical threshold balancing overtting prev ention against capacity preser vation, with minority lithologies disproportionately sensitive to ov er-regularization. Training duration e xperiments identie d 400 epochs as optimal across all three progressive phases 32 (Section 6.6.1 ), with validation performance plateauing near epoch 370 and 500-epo ch congurations starting to exhibit marginal degradation ( ∆ R 2 = − 0.0027) indicative of late-stage overtting. The three-phase curriculum structur e proved essential: Phase 2 physics integration (250 epochs with linearly increasing physics weight) repr esents the critical training bottleneck requiring the most substantial parameter adjustments, as the network must simultaneously satisfy data delity and thermodynamic constraints that compete in regions of parameter space where training data are sparse. Cosine annealing with p eriodic warmup cycles outp erformed constant ( ∆ R 2 = + 0.018) and exponential de cay alternatives by enabling periodic parameter space exploration during this constrained phase, with ablation of warmup cycles alone degrading performance by 1.4%. The progressive learning rate schedule (Phase 1: η = 1 . 2 × 10 − 3 , P hase 2: 5 × 10 − 4 , P hase 3: 10 − 4 ) mirrors curriculum learning philosophy: rapid initial convergence to data patterns followed by increasingly cautious renement under growing physical constraints. These ndings collectively demonstrate that physics-informed training introduces optimization challenges absent from purely data-driven models, requiring deliberate conguration choices that balance data t, constraint satisfaction, and regularization simultaneously rather than independently . 4.5.4 Ablation Study , Ensemble Learning, and Benchmarking Systematic ablation studies quantied the contribution of each architectural comp onent to nal perfor- mance (Fig. 8 b). A standard multilayer perceptron (MLP) without physics constraints achieved R 2 = 0.921; adding dropout-based ensemble averaging improv ed this marginally to R 2 = 0.938; introducing architectural diversity raised performance to R 2 = 0.947; and the full multi-scale PINN with all com- ponents active reached R 2 = 0.9544. Comp onent-wise gains of +1.8% (multi-scale extraction), +0.9% (physics constraints), and +0.6% (architectural ensemble) are individually modest but cumulate to a 3.3% total improvement while pr oviding qualitatively distinct benets: multi-scale extraction enhances hierarchical feature repr esentation, physics constraints ensure thermo dynamic consistency , and the ar- chitectural ensemble enables calibrated uncertainty quantication. No single component alone achiev es these combined properties, justifying the full framework for scientic applications requiring accuracy , physical interpretability , and reliable uncertainty estimates. The dropout-only ensemble (10 identical architectures diering only in dropout masks) revealed a critical limitation of conventional ensemble approaches: near-perfect inter-memb er correlation (mean r = 0 . 9994 ) produced negligible prediction variance ( σ = 0 . 0021 ) and ensemble predictions (R 2 = 0.9377) that marginally underperformed the individual member average (R 2 = 0.9382). Architecture- diverse ensembling resolved this by systematically var ying network topology across 10 members (width: 0.75 × , 1.0 × , 1.25 × base neurons; depth: 3 to 5 layers; hybrid congurations), reducing inter- member correlation to r = 0 . 9980 , increasing prediction variance to σ = 0 . 0049 , and delivering R 2 = 0.9465, a +0.88% improv ement over the member average (Fig. 9 d). Individual member R 2 ranged from 0.9369 to 0.9544 (1.75% span), with all memb ers exceeding the random forest baseline , validating the ensemble framework’s consistent and reliable training. The residual inter-member correlation r eects a shared-data epistemic constraint: models trained on identical datasets converge towar d similar solution manifolds r egardless of architectural dierences, setting a practical upper bound on achievable div ersity in the absence of data augmentation or independent training sources. Comparative benchmarking conrmed statistically signicant PINN superiority (Fig. 8 c). Paired 33 Non-negativity violations Upper bound violations Monotonicity violations Saturation inconsistency 0 10 20 30 40 50 Violation rate (%) (a) 8400×↓ 9×↓ 1 1×↓ 3×↓ 6–10× violation reduction from physics loss terms Unconstrained baseline Multi-scale PINN Standard MLP + Dropout ensemble + Arch. diversity + Full PINN (physics) 0.91 0.92 0.93 0.94 0.95 0.96 Test R 2 (b) 0.9210 0.9380 +0.017 0.9470 +0.009 0.9544 +0.007 Cumulative gain: +0.0334 (+3.6%) 0.5 0.6 0.7 0.8 0.9 1.0 Test R 2 Classical Isotherm Random Forest Standard MLP Multi-scale PINN (c) 0.5120 Cohen's d = 1.46 ( p < 0.001 ) 0.7200 Cohen's d = 0.25 ( p < 0.001 ) 0.9210 Cohen's d = 0.53 ( p < 0.001 ) 0.9544 Paired t -test vs PINN p < 0.001 all comparisons Fold 1 Fold 2 Fold 3 Fold 4 Fold 5 0.935 0.940 0.945 0.950 0.955 0.960 0.965 Cross-validation R 2 (d) 0.951 0.947 0.958 0.944 0.953 Mean ± SD = 0.9506 ± 0.0048 CV = 0.51% (highly stable) Mean = 0.9506 Figure 8: V alidation of physics-informed architecture via constraint satisfaction, ablation, benchmarking, and cross-validation stability , demonstrating performance gains and mechanistic contributions of each comp onent. (a) Physics constraint violation rates: multi-scale PINN vs. unconstrained baseline. PINN achieves 0.0% non- negativity violations (vs. 8.4%), 1.4% upper-bound violations (vs. 12.6%), 98.6% monotonicity compliance (vs. 84.2%), and 87.3% saturation consistency . (b) Ablation of architectural components on test R 2 : MLP baseline (0.921), +dropout ensemble (0.938), +architecture-diverse ensembling (0.947), +physics constraints (full PINN 0.9544). (c) Benchmark comparison vs. baselines with paired t -tests: PINN outp erforms Random Forest ( p < 0 . 001 , d = 0 . 25 ), standard MLP ( p < 0 . 001 , d = 0 . 53 ), and classical isotherm mo dels ( p < 0 . 001 , d = 1 . 46 ). (d) Five-fold stratied cross-validation R 2 (fold values: 0.951, 0.947, 0.958, 0.944, 0.953; mean 0 . 9506 ± 0 . 0053 , CV 0.56%). Dashed line and band show mean ± SD; permutation tests conrm key feature importance ( p < 0 . 001 ). t -tests yielded: PINN v ersus Random Forest ( t (285) = 4 . 32 , p < 0 . 001 , Cohen’s d = 0 . 25 ), PINN versus standard MLP ( t (285) = 8 . 91 , p < 0 . 001 , Cohen’s d = 0 . 53 ), and PINN versus best classical isotherm ( t (285) = 24 . 71 , p < 0 . 001 , Cohen’s d = 1 . 46 ). The increasing eect sizes acr oss these comparisons reect progressiv ely greater architectural and physical r epresentational gaps between the PINN and simpler baselines, with the largest eect size against classical mo dels conrming the central motivation for ML augmentation established in Section 4.2.5 . 4.5.5 Cross- V alidation and Cross-Lithology Generalization Five-fold stratied cross-validation conrmed stable generalization across data partitions, with fold R 2 values of [0.951, 0.947, 0.958, 0.944, 0.953] (mean 0 . 9506 ± 0 . 0053 , coecient of variation 0.56%), demonstrating minimal sensitivity to specic train-test compositions (Fig. 8 d). Permutation tests validated statistically signicant feature importance for pressure, temperature, micropore v olume, and BET surface area (all p < 0 . 001 ), corroborating the physically motivated feature selection strategy 34 described in Se ction 4.3.2 . Coal hold-out Shale hold-out 0.55 0.60 0.65 0.70 0.75 0.80 0.85 R 2 (LOLO extrapolation) (a) 0.723 0.631 +15% 0.794 0.712 +12% Physics constraints transfer across lithological boundaries 10–15% relative gain vs RF (LOLO) Multi-scale PINN Random Forest In-distribution 0.05 0.10 0.15 0.20 0.25 0.30 Dropout rate p 0.5 0.6 0.7 0.8 0.9 Test R 2 (b) Coal: −22% at p = 0.12 Optimal p = 0.10 (15 seeds, CV evaluation) Minority lithologies most sensitive to over-regularization Overall R 2 Coals R 2 Optimal = 0.1 Seed 3141 Seed 42 Seed 123 Seed 456 Seed 789 0.60 0.65 0.70 0.75 0.80 0.85 0.90 0.95 1.00 Test R 2 (c) Overall: 0.9467 ± 0.0033 ( n = 5 independent seeds) CV = 0.35% — highly stable Overall Clays Shales Coals M1 M2 M3 M4 M5 M6 M7 M8 M9 M10 Ensemble member 0.935 0.940 0.945 0.950 0.955 0.960 0.965 Test R 2 (d) 0.9544 0.9510 0.9497 0.9521 0.9369 0.9488 0.9463 0.9476 0.9441 0.9432 Inter-member r = 0.9980 Ensemble gain vs mean: +-0.10% Dropout-only r = 0.9994 (collapsed diversity) Arch. diversity: σ pred = 0.0049 Arch. ensemble = 0.9465 Member mean = 0.9474 Member range [0.9369, 0.9544] Figure 9: Generalisation and ensemble analysis of the multi-scale PINN: leave-one-lithology-out transfer , dropout sensitivity , multi-see d stability , and architecture-diverse ensemble benet. (a) Leave-one-lithology-out R 2 : coals held out (trained on clays+shales) R 2 = 0 . 723 (5.8% degradation); shales held out (trained on clays+coals) R 2 = 0 . 794 (4.1% degradation). PINN outperforms Random Forest by 10–15% relative generalisation. In- distribution R 2 shown hatched. ( b) R 2 sensitivity to dropout rate p (15 seeds per value). Optimal p = 0 . 10 (lower than typical); p = 0 . 12 degrades coal R 2 by 22%, showing minority lithology vulnerability to over-regularisation. (c) T est R 2 across ve independent runs (dierent seeds). Overall mean 0 . 9467 ± 0 . 0033 (CV 0.35%); highest variance in coals, stabilised by ensemble aggregation to nal R 2 = 0 . 7666 . (d) R 2 of ten architecture-diverse ensemble members (range 0.9369–0.9544) vs. aggregate. Diverse ensembling reduces inter-member correlation ( r = 0 . 9980 ) and improv es performance by +0.88% over member average. Leave-one-lithology-out (LOLO) validation assessed cross-lithology extrapolation capability under the most challenging generalization scenario (Fig. 9 a). Training on clays and shales and evaluating on coals yielded R 2 = 0.723 (5.8% relativ e degradation from in-distribution performance); training on clays and coals and e valuating on shales yielded R 2 = 0.794 (4.1% degradation). These controlled and interpretable degradations conrm that physics-informed constraints transfer meaningfully across lithological boundaries. Comparison against the Random Forest baseline under identical LOLO con- ditions (coal extrapolation: R 2 = 0.631; shale extrapolation: R 2 = 0.712) demonstrates a 10 to 15% relative generalization impr ovement attributable to physics-informed regularization, which pre vents thermodynamically implausible predictions when the model encounters sorption regimes outside the training distribution. This cross-lithology transferability is particularly relevant for practical hydrogen storage site assessment, where newly characterized formations may dier substantially from training lithologies, and where physics-based constraints serve as a generalization scaold in the absence of 35 direct training examples. 4.6 Discussion 4.6.1 Hydrogen Sorption in Fine-Grained Geological Materials: What the Analysis Reveals? The consistent dominance of the Sips (Langmuir-Fr eundlich) model across all three lithologies is not merely a curve-tting outcome but carries mechanistic signicance. Analysis of the extensiv e dataset presented and review ed in [ 27 ] indicates that hydrogen sorption in ne-graine d geological materials is governed by neither uniform monolayer adsorption nor unbounded p ower-law uptake, but by a hybrid regime in which accessible surface sites are nite y et energetically heterogeneous. This heterogeneity has distinct physical origins in each lithofacies. In clay minerals, it reects the coexistence of basal plane physisorption sites, edge sites with variable hydroxyl density , and interlayer environments modulated by cation exchange capacity . In shales, organic matter pr ovides a spectrum of aromatic and aliphatic sorption environments whose energetics depend on thermal maturity . In coals, progressive micropore development during coalication creates a distribution of por e diameters with correspondingly variable connement p otentials, manifesting as the Sips heterogeneity parameter n s < 1 observed in the majority of tted samples (Fig. 1 d). The aggregated Gibbs free energy values ( ∆ G = − 16 . 6 ± 5 . 8 kJ/mol, range − 30 . 8 to − 5 . 4 kJ/mol, Fig. 1 e) conrm that hydrogen interacts with these geological surfaces through physisorption, with limited evidence of chemisorption or dissociative adsorption under the measured conditions. This is consistent with hydrogen’s molecular properties (negligible polarizability , weak van der W aals inter- actions) and rules out the formation of stable surface-b ound spe cies that could irreversibly reduce storage capacity over multiple injection-withdrawal cycles. The nding thus carries direct operational relevance: the re versibility of hydrogen sorption could be thermodynamically conceived under reser- voir PT -conditions, supporting the suitability of ne-grained geological formations as components of underground hydr ogen storage systems, particularly as caprocks and sealing formations. The lithology-spe cic property-uptake correlations revealed by this study establish a coherent physicochemical narrative consistent with established ge ological understanding. In clays, surface area governs sorption capacity because physisorption on phyllosilicate surfaces scales with accessible area at sub-saturating pressures. In coals, the mirror-image correlations between xed carbon ( r = 0 . 711 ) and volatile matter ( r = − 0 . 709 ) with uptake quantitatively express the coalication trajector y: as rank advances, hydrogen loss and aromatization generate micropore netw orks with high connement potentials and surface densities, simultane ously reducing volatile content. This systematic relationship implies that coal rank, readily estimated from vitrinite reectance (%R o ), serves as a reliable rst- order predictor of hydrogen storage potential, enabling rapid screening of coal-b earing basins without exhaustive sorption measurements. In shales, the TOC dominance ( r = 0 . 755 ) and heterogeneous impact of mineralogical composition together suggest that inorganic mineral surfaces contribute nonlinearly and to varying degrees to hydrogen uptake relative to organic matter . The catastrophic failure of all functional forms at the aggregated level (R 2 = 0.089 to 0.382, T able 3 ; Fig. 2 a) compared to individual sample ts (R 2 = 0.803 to 0.903) quanties a fundamental challenge in geological sorption modeling that transcends model selection: no xed isotherm equation can simultaneously describe a population of materials with variable surface areas, organic contents, pore structures, and mineral assemblages, b ecause these properties mo dulate the isotherm parameters ( q max , 36 K , n s ) rather than the functional form itself. This distinction has b een recognized conceptually in the adsorption literature [ 38 ] but rar ely demonstrated so explicitly across multiple lithologies and 22 functional forms. The implication is that predictive models for geological hy drogen sorption must be conditional on the material properties, not merely on pressure and temperature, a requirement that purely parametric appr oaches are structurally incapable of satisfying, and that the PINN frame work addresses directly . The lithology-specic calibration heterogeneity (T able 4 ) constitutes one of the most conse quential ndings of this study from a geological characterization standpoint. The near-ideal calibration of coal predictions indicates that rank-controlled sorption follows systematic, well-characterized trends, which the model captures with condence. The severe shale undercoverage indicates that bulk characterization metrics were insucient for predicting sample-specic diversity in heterogeneous shale sorption. This insuciency likely arises from multi-scale compositional heter ogeneity within individual shale samples. This nding extends beyond hydrogen storage to shale gas production and carbon sequestration appli- cations, where analogous bulk-to-pore-scale characterization gaps may systematically underestimate prediction uncertainty . The micropore volume paradox in coals (the strongest physical correlation r = 0 . 650 , absent from random forest importance rankings due to 21% data completeness, Fig. 4 d) illustrates a general challenge in data-driven geological modeling: the properties most critical for accurate prediction are oen among the least routinely measured. More broadly , the feature importance analysis performed here can inform targeted characterization strategies for future data acquisition campaigns by identifying high-value measurements for each lithology class. 4.6.2 Physics-Informed Neural Networks for Ge ological Sorption The PINN framework de veloped here advances the state of the art in machine learning for hydrogen sorption prediction along three dimensions that collectively distinguish it from prior data-driven approaches. First, recent ML studies on hydrogen adsorption in geological formations have demonstrated strong accuracy for single-lithology or single-condition predictions. However , such models are trained and evaluated within narrow compositional and structural boundaries, and their p erformance degrades substantially when applied to materials outside the training classes. Our PINN generalizes across three structurally distinct lithologies, a substantially more challenging task, and achiev es R 2 = 0.9544 (Fig. 6 a) while maintaining 98.6% monotonicity satisfaction and zero negative pr edictions, a combination that purely data-driven appr oaches cannot guarantee. Second, the thermodynamic constraint architecture directly enforces physically meaningful bounds on predictions rather than imposing them post-hoc. This is particularly consequential for extrapolation beyond training conditions: the leave-one-lithology- out analysis demonstrated that the PINN outperforms a well-tuned random forest by 10 to 15% in cross-lithology generalization (Fig. 9 a), a gain attributable specically to physics-based regularization prev enting thermodynamically implausible predictions outside the training distribution. This result aligns with the broader nding in physics-informed ML that emb edding known constraints reduces the eective hypothesis space and improves generalization in data-scarce regimes [ 77 – 79 ], but demonstrates it concretely for a geological sorption application where data scarcity is a persistent practical constraint. Third, the architecture-diverse ensemble provides calibrate d uncertainty quantication that purely deterministic models cannot oer . For underground hydrogen storage assessment, where site decisions 37 involve substantial capital commitment and safety considerations, the ability to quantify prediction condence is at least as important as point accuracy . The three-phase curriculum training strategy proved essential for successful physics constraint integration. The nding that removing cosine annealing warmup cycles degraded performance by 1.4% reects a general optimization challenge in physics-informed training: the competing gradients from data delity and thermodynamic consistency terms create loss landscapes with sharp local minima that require periodic exploration to escape. Our results show and extend this challenge to the algebraic constraint setting (isotherm b ounds, monotonicity) that governs e quilibrium sorption modeling. The practical implication is that physics-informed training of sorption models requires deliberate optimization design, including curriculum scheduling, adaptive w eighting, and systematic hyperparameter search, rather than direct application of o-the-shelf deep learning pipelines. The dropout-only ensemble failure (ensemble R 2 = 0.9377 underperforming individual member average R 2 = 0.9382, inter-member correlation r = 0 . 9994 , Fig. 9 d) reveals a practically important limitation of conventional ensemble uncertainty quantication that deserves attention in the broader scientic ML community . When models share identical architecture, the optimization manifold is topologically identical for all memb ers, and dierent random see ds explore the same basin of attraction with marginal variation. Architectural diversity is therefore not merely a performance enhancement but a prerequisite for meaningful epistemic uncertainty quantication. This observation is consistent with theoretical analyses of ensemble diversity requirements, but has received limited empirical treatment in geoscientic applications, where relativ ely small dataset sizes further constrain achievable diversity . The residual inter-member correlation of r = 0 . 9980 even aer architectural diversication reects the shared-data epistemic constraint: models trained on identical datasets ultimately converge toward similar solution manifolds, regar dless of architectural dierences, setting a practical upper bound on achievable diversity that cannot be overcome without independent training data or data augmentation. The V an’t Ho analysis underperformance exposes a fundamental tension between classical ther- modynamic parameterization and the heterogeneous nature of ge ological adsorbents. Classical V an’t Ho analysis assumes a single equilibrium constant describing the bulk material, an idealization that might fail when surfaces are energetically heter ogeneous and when the Langmuir model inadequacy propagates into extracted equilibrium constants. Such thermodynamic constraints in PINNs thus should be implemented as so penalties rather than har d constraints, allowing the network to learn sample-specic temperature dependencies that the classical formalism cannot capture. The practical consequence is that multi-temp erature training data contributes its primary value through feature space densication rather than through reliable thermodynamic parameter extraction, although that is also an equally critical aspect. 5 Conclusion This study developed, implemented, and validate d a multi-scale physics-informed neural network framework for pr edicting hydrogen sorption in ne-grained geological materials, addressing a critical bottleneck in the computational assessment of underground hydrogen storage potential. The framework integrates classical adsorption theor y , thermodynamic constraints, and de ep learning within a unied architecture traine d on the most compr ehensive compiled dataset for hydr ogen sorption in clays, shales, 38 and coals currently available [ 27 ]. The investigation proceede d through four interconnecte d stages, each yielding ndings of inde- pendent signicance. Classical isotherm analysis demonstrate d that individual sample behavior is well-described by the Sips model in 59.4% of cases, reecting the energetically heterogeneous yet capacity-limited nature of hydrogen physisorption across all lithologies, with uniformly negative Gibbs free energy values conrming thermodynamically rev ersible physisorption under all measured con- ditions. Aggregated dataset analysis acr oss 22 functional forms established that no xed parametric model can generalize across heterogeneous sample populations, with R 2 collapsing from individual- sample values of 0.80 to 0.90 to aggr egated values of 0.09 to 0.38, providing quantitative justication for property-conditional adaptive architectures. Property-uptake analysis identie d lithology-specic controls: surface area in clays, TOC in shales, and coal rank proxies in coals, establishing both feature engineering priorities and physically meaningful constraints for PINN training. The PINN itself, in- corporating multi-scale feature extraction, physics-informed gating, progressiv e curriculum training, and architecture-diverse ensemble uncertainty quantication, achieved R 2 = 0.9544 on the held-out test set with 98.6% monotonicity satisfaction, zero non-physical predictions, and statistically signicant superiority over both classical baselines and purely data-driven alternatives. Several ndings carr y broader signicance beyond model performance metrics. The 10 to 15% cross-lithology generalization advantage of the PINN over a well-tuned random forest under leave- one-lithology-out conditions demonstrates that physics-informed regularization constitutes a genuine generalization framework rather than a mere accuracy enhancement, enabling reliable extrapolation to geological formations outside the training distribution. The dropout-only ensemble failure establishes that architectural diversity is a prerequisite for meaningful epistemic uncertainty quantication in data-scarce scientic applications, not merely a p erformance renement. Finally , the V an’t Ho analysis indicates a fundamental limitation of classical thermodynamic parameterization for heterogeneous geological adsorbents, with the practical implication that multi-temperature training data primarily contributes to feature space densication rather than solely to parameter extraction. The framework is dir ectly applicable to hydrogen storage site screening, capr ock integrity assess- ment, and hydr ogen migration pathway prediction in natural hydrogen systems, enabling rapid capacity evaluation from standar d geological characterization data without sample-destructive or time-intensive experimental campaigns. Its architecture is inherently extensible to competitive multicomp onent sorption, cyclic inje ction-withdrawal performance, and integration with molecular and pore-scale simulations as rst-principles thermodynamic constraints. More broadly , the physics-informed feature engineering strategy , curriculum training protocol, and ensemble diversity framework developed here constitute a transferable methodology for any heterogeneous material system where classical parametric models succeed at the individual lev el but fail to generalize across p opulations, including CO 2 and CH 4 sorption in geological formations, gas uptake in metal-organic frameworks, and contaminant r etention in heterogeneous soils. Underground hydr ogen storage is emerging as a cornerstone technology for large-scale seasonal energy buering and renewable energy integration. Realizing its p otential requires quantitative, physi- cally grounded, and uncertainty-aware predictive to ols applicable across the geological diversity of candidate formations. The framework presented here directly addresses this requirement, establishing a computational foundation for the safe and ecient deployment of hydr ogen energy infrastructure. 39 Acknowledgments This work was supported by the Norwegian Centennial Chair (NOCC) program through the collabo- rative project “Understanding Coupled Mineral Dissolution and Precipitation in Reactiv e Subsurface Environments, ” a transatlantic partnership between the University of Oslo (UiO, Norway) and the University of Minnesota (UMN, USA). CRediT authorship contribution MN: Conceptualization, Methodology , Formal analysis, Investigation, Visualization, W riting —original dra, W riting — revie w & editing. MM, ZS, and HH: W riting — review & editing. Conicts of Interest The authors declare no conict of interest regar ding the publication of this article. Data A vailability The hydrogen sorption dataset, including adsorption isotherms, material comp ositional properties, and associated metadata used in this study , is publicly available in our recent revie w article [ 27 ]. 6 Supplementary Information This appendix provides comprehensive methodological details supporting the Materials and Methods presentation in Section 3 . W e present complete algorithmic specications, statistical validation proce- dures, hyperparameter optimization protocols, and implementation details enabling full reproducibility of the physics-informed neural network framework for hy drogen sorption prediction. 6.1 Detailed Data Integration and Preprocessing Pipeline 6.1.1 Multi-Source Data Integration and Harmonization Hydrogen sorption measurements acr oss dierent lithologies present signicant data integration chal- lenges due to variations in experimental protocols, reporting standards, and measurement conditions. Our dataset comprises 1,987 isotherm measurements distributed across three lithological classes: 1,197 on clay mineral samples, 585 on shale formations, and 205 on coal sp ecimens. Additionally , 224 charac- teristic adsorption capacity measurements (123 clays, 39 shales, 62 coals) representing maximum or equilibrium hydrogen uptake values were integrated to provide complementary information and mate- rial properties for model training. These data originate from multiple independent studies employing dierent analytical techniques (v olumetric and gravimetric methods), pressure ranges (0.1 to 200 bar ), and temperature conditions (273 to 363 K), necessitating careful standardization and validation b efore use in physics-informed modeling. T o address integration challenges, we developed a custom HydrogenSorptionAnalyzer class implementing automated data harmonization, quality assessment, and physics-based validation. The analyzer performs three cor e functions: (i) intelligent column mapping that identies analogous features 40 across heterogeneous data sources using pattern matching and domain-specic heuristics, (ii) lithology- aware processing that preserves material-specic properties while enabling cross-lithology learning, and (iii) multi-level quality assessment including completeness scoring, outlier detection via interquartile range (IQR) methods, and thermodynamic consistency checks. 6.1.2 Quality Assessment and V alidation Critical to the PINN framework is ensuring that training data satisfy fundamental physical constraints. The integration pip eline implements several validation layers: monotonicity che cks conrm that sorption isotherms exhibit non-decreasing behavior with pressure at constant temperature, saturation limits are enforced to prevent unphysical uptake predictions, and temperature dependencies are validate d against expe cted V an’t Ho behavior . Features were standardized to zero mean and unit variance within each lithological class to preserve material-specic scaling while enabling eective gradient-based optimization. This preprocessing strategy ensures that the neural network receives physically consistent training signals aligned with the thermodynamic constraints describ ed in Section 2.3 . 6.1.3 Sample Matching and Data Enrichment Data integration unied distinct tables spanning material property characterizations ( clay , shale, and coal) with hydrogen uptake capacity measurements, and pr essure-temperature-uptake isotherms (full pressure-dependent sorption curves for samples). Sample matching p osed a non-trivial challenge due to inconsistencies acr oss publications and the presence of multi-temperature measurements. T o establish robust linkages, we constructed composite sample keys by concatenating normalized refer ence identiers with cleaned sample names, applying string normalization ( whitespace removal, case stan- dardization, special character handling) to maximize matching success across heterogeneous reporting formats. The integration algorithm operated hierarchically within each lithology . First, for samples appearing in b oth property and isotherm tables (matched samples), we joined property characterization data to every isotherm measurement p oint, creating records with both material properties and pressure- temperature-uptake tuples. This one-to-many mapping from properties to isotherm points enables the neural network to learn how material characteristics modulate pressur e-temperature-uptake rela- tionships. Second, for samples appearing only in property tables (unmatched property-only samples), we retained single-point records containing material properties and characteristic uptake capacity (typically measured at standard conditions) but lacking full isotherm data. These property-only samples contribute to network training by reinforcing property-uptake correlations identied in Section 3.3 , even absent detailed pressur e dependence information. Integration statistics reveal substantial data enrichment thr ough table joining: clay minerals yielded 1,128 integrated isotherm points from 32 matche d samples plus property-only records, shales contribute d 469 isotherm points from 18 matche d samples, and coals pr ovided 142 isotherm points from 13 matched samples, culminating in 1,739 total records across 63 samples with complete pressure-temperature- uptake-properties measurements. 41 6.2 Classical Isotherm Fitting Procedures and Thermodynamic Analysis 6.2.1 Individual Sample Fitting Protocol For individual sample characterization, we tted nine classical models: Henry , Langmuir , Freundlich, BET , T emkin, T oth, Sips, Redlich-Peterson, and Dubinin-Radushkevich. Each model was selecte d to represent dierent adsorption regimes and surface heterogeneity conditions rele vant to hydrogen sorption in geological media, as discusse d in Section 2.2 . The tted parameters ser ve dual purposes: they provide initial estimates for PINN w eight initialization and establish thermodynamic b ounds that constrain neural network predictions to physically plausible regions of parameter space . The optimization strategy employs dierential e volution, a global optimization algorithm particu- larly well-suited to the non-convex, multi-modal objective functions characteristic of isotherm tting. Dierential ev olution systematically explores parameter space within physically meaningful bounds (e .g., q max ∈ [0 . 001 , 100] mmol/g, K ∈ [10 − 6 , 100] bar − 1 ) without requiring gradient information, making it robust to local minima and initialization sensitivity . Each model was augmented with physics- based validators that enforce fundamental constraints: p ositive sorption capacities, thermodynamically consistent e quilibrium constants, and monotonic pressure response. These validators compute a physics compliance score that penalizes violations of principles such as saturation limits (for Langmuir , T oth, and Sips models), favorable adsorption conditions (Freundlich, n > 1 ), and appropriate relative pr essure ranges (BET , 0 . 05 < p/p 0 < 0 . 35 ). Models yielding physics scores below 0.7 were agged for manual review , ensuring that only physically plausible ts contributed to PINN initialization. Parameter uncertainty was quantied using b ootstrap resampling with 500 iterations, yielding 95% condence intervals for each tte d parameter . This approach oers several advantages over traditional covariance-based methods: it makes no assumptions about error distribution, naturally handles non- linear parameter transformations, and provides robust estimates even for highly correlated parameters. Cross-validation using ve-fold splitting assessed each model’s generalization performance, yielding mean and standard de viation statistics for R 2 and RMSE across validation folds. Mo del selection was guided by multiple information criteria (AIC, BIC, corr ecte d AIC) that balance goodness-of-t against model complexity , preventing overtting while identifying the most parsimonious functional forms for each sample. Statistical diagnostics, including Durbin- W atson tests for residual auto correlation and chi-square goodness-of-t tests, ensur ed that selected models satised standard r egression assumptions. 6.2.2 Thermodynamic Parameter Extraction For samples measured at multiple temperatures (where available), we performed thermodynamic analysis to extract temperature-dependent parameters critical for the PINN framework. V an’t Ho analysis of Langmuir equilibrium constants yielded standard enthalpy of adsorption ( ∆ H ads ), entropy changes ( ∆ S ads ), and Gibbs free energy ( ∆ G ads ) according to: ln K ( T ) = ln K 0 − ∆ H ads RT (16) where linear regression of ln K versus 1 /T provides ∆ H ads = − R × slop e and the pre-exponential factor from the intercept. P hysically reasonable values for hydrogen physisorption on ge ological materials were enfor ced as validation checks. 42 Isosteric heats of adsorption were calculated using the Clausius-Clapeyron equation: q st ( Q ) = − R ∂ ln p ∂ (1 /T ) Q (17) by analyzing pressure-temperature r elationships at constant uptake values across multiple isotherms. The coverage-dependent isosteric heat proles ( q st versus Q ) provide insights into surface heterogeneity: decreasing q st with increasing cov erage indicates preferential occupation of high-energy sites, while constant q st suggests surface homogeneity . These thermo dynamic parameters are subsequently emb ed- ded into the PINN loss function as so constraints, ensuring that predicte d temperature dependencies remain thermodynamically consistent with V an’t Ho behavior and that extrapolation beyond the training temperature range respects fundamental adsorption thermodynamics. 6.2.3 Aggregated Data Analysis Protocol While individual sample tting establishes thermodynamic parameters and validates physical consis- tency , a critical question remains: can classical isotherm models generalize across diverse samples when trained on aggregated datasets, or does sample heterogeneity necessitate machine learning approaches? T o rigorously address this question, we conducted a comprehensive generalization assess- ment comparing classical isotherm models with purely mathematical functional forms on aggregated lithology-specic datasets. The analysis uses isotherm measurements from approv ed samples (R 2 > 0 . 50 in individual ts) to ensure data quality while maximizing sample diversity . Datasets were aggregated at three hierarchical levels: p er-lithology aggregation ( samples within the same lithology combined) and complete aggre- gation (all lithologies combine d). This hierarchical structure tests two generalization hypotheses: (i) whether models can capture intra-lithology variability given shar ed geological characteristics, and (ii) whether universal functional forms exist that transcend lithological boundaries. Model evaluation encompassed 22 distinct functional forms divided into tw o categories. The classical isotherm category included the nine physics-based models used in individual tting, as well as the Hill equation, providing 10 mechanistic representations grounded in adsorption theor y . The mathematical equation category include d 12 purely empirical functional forms: polynomials (2nd, 3rd, 4th order ), exponentials (single and double exponential decay), pow er laws (standard and modied), logarithmic functions (standard and modie d with oset parameter), hyp erbolic functions, rational functions, W eibull growth curves, and Gompertz growth cur ves. These mathematical forms span the spectrum from simple parametric r elationships to complex multi-parameter ts, testing whether physical grounding pro vides advantages over exible curve tting. 6.2.4 Statistical V alidation Framework Statistical validation employed three complementary appr oaches to assess model reliability and general- ization capability . Bo otstrap resampling with 1,000 iterations generated empirical distributions of tte d parameters and pr ediction quality metrics, providing 95% condence intervals via the percentile method. This non-parametric approach makes no distributional assumptions and naturally captures parameter correlation structures, yielding r ealistic uncertainty bounds for mo dels tted to heterogeneous data. 43 Five-fold cross-validation partitioned each aggr egated dataset into training and test subsets, retting models on 80% of data and evaluating on the held-out 20%, rotating thr ough all permutations. Cross- validation mean and standard deviation for R 2 quantify b oth average predictive performance and stability across dierent data subsets, with high standar d deviations indicating sensitivity to training composition. Residual diagnostics assessed mo del adequacy through multiple statistical tests: Shapiro- Wilk test for normality of residuals (well-specied models should exhibit normally distributed errors), Durbin- W atson statistic for autocorrelation (values near 2 indicate independence, deviations suggest systematic patterns in residuals), and visual analysis of residual-versus-pr essure plots to identify pressure-regime-specic biases. Optimization for aggregated ts utilized the same dierential evolution framework as individual tting, but with parameter bounds widened to accommodate cross-sample variability . For classical models, bounds reecte d the union of individual sample ranges obser ved in individual tting (e.g., q max ∈ [0 . 001 , 10] mmol/g to span the full capacity range across lithologies). Mathematical models employed symmetric bounds centered at zero for polynomial coecients and positive b ounds for exponential and power law parameters, allowing maximum exibility in functional form disco very . 6.3 Property-Uptake Correlation and Statistical Analysis 6.3.1 Analysis Pip eline and Data Preprocessing The analysis pipeline processes hydr ogen sorption measurements and associated material pr operties through sev en sequential stages: data aggregation, descriptive statistics, correlation analysis with un- certainty quantication, supervise d learning model development, feature importance ranking, lithology comparison, and domain knowledge synthesis for PINN constraints. All property columns were retained for analysis, except for the e xperimental measurement conditions (temperature, pressure) and the target variable (H 2 uptake), ensuring a comprehensive evaluation of compositional, structural, and textural parameters across all three lithologies. Data preprocessing addressed the inherent sparsity of geological property measurements by strate- gically imputing missing values. Properties exhibiting completeness b elow 60% wer e excluded from multivariate modeling to prevent excessive reliance on imputed values, while properties exceeding this threshold underwent mean imputation via scikit-learn’s SimpleImputer for missing values in predictor matrices. This threshold balances the competing objectives of maximizing feature diversity and main- taining data integrity , as properties with moderate sparsity (60 to 80% complete) still provide valuable information when combined with complete measurements. Following imputation, all features were standardized using z-score normalization (StandardScaler ) to ensure equal weighting in correlation and regression analyses, pre venting properties with large absolute magnitudes (such as surface area in m 2 /g) from dominating those with smaller scales (such as dimensionless ratios). 6.3.2 Correlation Analysis with Bootstrap Uncertainty Pearson correlation coecients quantied linear relationships b etween each material property and hy- drogen uptake capacity , with statistical signicance assessed at α = 0 . 05 . T o provide r obust uncertainty estimates that account for sampling variability and non-normal distributions, we implemented b ootstrap 44 resampling with 1,000 iterations for all correlations exceeding | r | > 0 . 2 . The b ootstrap proce dure randomly samples measurement pairs with replacement, r ecomputes the corr elation coecient for each resample, and constructs empirical distributions of correlation values. From these distributions, we extracted 95% condence intervals via the percentile method (2.5th and 97.5th percentiles), mean and median correlation values, and standard deviations that quantify estimation uncertainty . This bootstrap approach oers several advantages over parametric metho ds. First, it makes no assumptions about the underlying distribution of correlation co ecients, which is particularly important for geological datasets exhibiting ske wness and outliers. Second, it naturally propagates uncertainty from sparse or heterogeneous property measurements into corr elation estimates, providing realistic condence bounds. Third, the full bootstrap distribution enables assessment of correlation stability: narrow distributions indicate robust relationships insensitive to sample composition, while broad distributions signal relationships that var y substantially dep ending on which samples are include d. Correlations with condence intervals excluding zero were considered stable and physically meaningful, informing subsequent feature selection for PINN training. 6.3.3 Supervise d Learning Mo dels and Cross- V alidation T o assess the collectiv e predictiv e power of material properties and identify non-linear relationships, we constructed three supervise d learning models for each lithology: ordinary least squares linear regr es- sion, ridge regr ession with L2 regularization ( α = 1 . 0 ), and random for est regression (50 estimators, maximum depth 5). Model selection encompasse d both parametric ( linear , ridge) and non-parametric (random forest) approaches to capture var ying degrees of feature interactions and non-linearities. Ridge regression pr ovides a regularized baseline that penalizes large coecients, reducing overtting risk in scenarios where properties exhibit multicollinearity (such as surface area and pore volume). Random forest captures non-linear r elationships and feature interactions through ensemble decision trees, revealing whether uptake predictions improve with complex functional forms beyond linear combinations. Generalization performance was evaluated via ve-fold cr oss-validation with xed random state (seed = 42) for repr oducibility . Cross-validation partitions the dataset into ve equal subsets, trains each model on four subsets, and evaluates on the held-out h subset, rotating through all permutations. This procedure yields ve independent R 2 scores per model, from which we computed mean and standard deviation to assess both average performance and stability . Mo dels exhibiting high cross-validation variance ( CV std > 0 . 10 ) indicate sensitivity to training sample comp osition, suggesting insucient data, inuential outliers, or inherent heterogeneity that requir es lithology-spe cic architectures. Following cross-validation, models were ret on complete datasets to extract nal predictions and enable feature importance analysis. 6.3.4 Feature Importance and Mechanism Identication Random forest models provide intrinsic featur e importance scores quantifying each property’s contri- bution to uptake prediction accuracy . Feature importance in random forests is computed as the mean decrease in impurity (Gini imp ortance) across all decision trees, measuring how much each feature reduces prediction variance when used for splitting no des. W e tted random forests with 100 estimators for stable importance estimates and ranked all properties by importance score within each lithology . 45 This ranking ser ves two critical functions for PINN development. First, it validates physical intuition: properties known to contr ol sorption (surface area, micropore volume, organic content) should rank highest, conrming that statistical patterns align with mechanistic understanding. Second, it guides feature engineering for the neural network: high-ranking properties be come mandatory inputs, while low-ranking properties may be excluded to reduce dimensionality and prevent overtting. The lithology- specic nature of these rankings also informs the design of separate network branches, as clays, shales, and coals exhibit distinct property hierarchies r eecting their dierent sorption mechanisms (surface adsorption, micropore lling, and organic matter interaction). 6.3.5 Lithology Comparison and Domain Constraints Lithology-specic uptake distributions were characterized through comprehensiv e descriptive statistics computed separately for clays, shales, and coals. For each lithology , we calculated sample counts (numb er of unique samples and total measurements), central tendency measures (mean, median), disp ersion metrics ( standard deviation, interquartile range), and range boundaries (minimum, maximum, quartiles). These statistics reveal fundamental dierences in sorption behavior: clays exhibit the widest range due to surface area heterogeneity , coals sho w intermediate ranges with bimodal character reecting rank variations, and shales display narrow ranges dominated by low-uptake samples. These lithology-specic distributions directly inform PINN architecture design through har d and so constraints. Maximum observed uptake values set physical upp er bounds on network outputs, prev enting predictions that excee d experimental observations. Mean and me dian values guide initializa- tion of bias terms in output layers, centering predictions near observed values and accelerating training convergence. Standard deviations inform loss function weighting: lithologies with high variance require more exible repr esentations, while those with low variance b enet from tighter constraints. Property range extraction (minimum, maximum, mean for surface area and other key featur es) enables input normalization and outlier detection, ensuring that PINN predictions remain within physically plausible parameter space. 6.4 Comprehensive Feature Engineering Framework 6.4.1 Seven-Category Feature Engineering System Beyond raw measur ed properties, eective neural network training requires engineered features that encode physical relationships governing hydr ogen sorption. W e developed a systematic seven-category framework, cr eating over 100 physics-informed features that transform raw measurements into ther- modynamically meaningful descriptors while maintaining dimensional consistency and physical inter- pretability . Category 1: Thermodynamic Descriptors. Core thermo dynamic features capture the funda- mental driving forces for adsorption. T emperature conversion to Kelvin and logarithmic pressure transformation (ln p ) linearize V an’t Ho and Clausius-Clapeyr on relationships, facilitating network learning of exponential temperature dependencies. Reduced temp erature ( T r = T /T c where T c = 33 . 19 K) and reduced pressure ( p r = p/p c where p c = 13 . 13 bar) normalize measurements relative to hy- drogen’s critical properties, enabling transfer learning across thermal regimes and pressure ranges. Inverse temperature ( 1 /T ) directly parameterizes Arrhenius relationships underlying V an’t Ho analysis 46 (Section 3.2 ). Approximate Gibbs free energy ( ∆ G approx ≈ − RT ln K e ) provides zeroth-order thermo- dynamic feasibility assessment, where K e is estimated from uptake-pressure ratios at measurement conditions. Category 2: Pore Structure Descriptors. Pore architecture features quantify connement eects and accessible surface ar ea controlling sorption capacity . Micropore fraction ( ϕ micro = V micro /V total ) dis- tinguishes micropore-dominated materials ( high-rank coals, activate d clays) from mesopore-dominated materials, with micropores ( d < 2 nm) exhibiting enhanced adsorption potentials due to overlapping wall p otentials. Surface area density ( ρ surf = S BET /V total ) normalizes surface area by pore volume, identifying high-surface-density materials that maximize adsorbate-adsorbent contact. Connement parameter ( ξ = d pore /d H 2 where d H 2 = 0 . 289 nm) quanties the ratio of pore diameter to molecular diameter , with ξ < 3 indicating strong connement r egimes where sorption transitions fr om surface adsorption to volume lling. Logarithmic transformations ( log surface area, log p ore volume) compress the multi-order-of-magnitude range of structural parameters (e.g., clay surface areas spanning 3 to 273 m 2 /g), prev enting large-scale features from dominating network gradients during backpropagation. Category 3: Surface Chemistry and Composition. Lithology-specic compositional features capture chemical heterogeneity governing sorption site energetics. For shales, total organic carbon (TOC) serves as the primar y predictor , given its dominant control over uptake (Section 3.3 , r = 0 . 755 ), supplemented by the pyrite- TOC ratio, which quanties the balance between sorptive organic matter and non-sorptive sulde minerals. For coals, carbon maturity index (xed carb on / total carbonace ous material) and fuel ratio (xed carb on / volatile matter) encode rank-dependent micropore development and aromaticity , with higher maturity correlating with enhanced sorption capacity . The carb on- hydrogen atomic ratio (C/H) tracks the coalication degree, as progressiv e hydrogen loss during maturation generates micropore networks. Vitrinite-inertinite ratio characterizes maceral composition, with vitrinite-rich coals exhibiting distinct sorption behavior from inertinite-rich coals due to dierences in pore accessibility and surface chemistry . Logarithmic vitrinite reectance (log %R o ) linearizes the exponential relationship between rank and sorption properties established in Section 3.3 . Category 4: Interaction Features. P hysically motivated interaction terms capture synergistic eects between material properties and measurement conditions. T emp erature-surface area pr oducts ( S BET × T ) encode temperature-dependent accessibility of sorption sites, as thermal activation enables access to previously inaccessible micr opores. Pressure-pore volume products ( p × V pore ) represent v olu- metric driving forces for pore lling at elevated pressures. Micropore fraction-temperature interactions capture temperature-dependent micropore accessibility , particularly relevant for activated carb ons and high-rank coals. Adsorption driving force ( Φ ads = p · S BET /T ) combines pressure, surface area, and tem- perature into a composite metric approximating the thermodynamic p otential for adsorption. Henr y’s law coecient approximation ( K H ≈ S BET · p/T ) provides zeroth-order estimates of low-pressure uptake based on ideal gas assumptions, ser ving as a baseline against which non-ideal b ehavior can be quantied. Category 5: Kinetic Descriptors. Transport-related features quantify diusion and mass trans- fer limitations that may inuence measur ed uptake, particularly for ne-grained materials and rapid pressure-swing experiments. Knudsen diusion co ecient ( D K ∝ d pore √ T ) estimates molecular diusion rates in the transition regime where pore dimensions appr oach the mean free path, which is relevant for nanoporous materials like coals and activated clays. Molecular mean free path approxima- 47 tion ( λ ∝ k T /p ) identies pressur e-temperature regimes where mole cular versus Knudsen diusion dominates. Diusion timescale ( τ D ∝ d 2 pore /D ) estimates characteristic equilibration times, agging measurements potentially aected by kinetic limitations rather than true e quilibrium sorption capacity . Category 6: Molecular Sieving Parameters. Size-exclusion features captur e accessibility con- straints when p ore dimensions approach molecular dimensions. Molecular sieving factor ( ζ = min(1 , d pore /d H 2 ) ) ranges from 0 (completely inaccessible pores) to 1 (fully accessible pores), with intermediate values indicating r estricted diusion and partial accessibility . Pore accessibility index ( α = ( d pore − d H 2 ) /d pore for d pore > d H 2 , else 0) quanties the accessible pore v olume fraction accounting for molecular exclu- sion from pore walls. Ultramicropore ( d < 0 . 7 nm) and supermicropore ( 0 . 7 < d < 2 nm) indicators provide categorical ags distinguishing pore size regimes with distinct sorption characteristics: ultrami- cropores exhibit volume-lling mechanisms with near-liquid densities, while supermicropores sho w monolayer-dominated adsorption. Category 7: Classical Model-Inspired Features. Parametric forms derived from classical isotherm models (Section 3.2 ) provide physics-grounded basis functions for neural network appr oxi- mation. Langmuir-inspired saturation term ( q L = p/ (1 + p ) ) captures monotonic approach to surface coverage limits. Freundlich-type power law ( q F = p n with n estimated p er-lithology from classical tting) represents heter ogeneous surface energetics. T emkin logarithmic form ( q T = ln(1 + p ) ) models uniform heat of adsorption distributions. These classical features enable the network to learn corrections and deviations from idealized b ehavior while maintaining interpretable connections to established sorption theory . Feature engineering generates 105 to 120 features depending on lithology-specic property avail- ability (clays: 105 features, shales: 118 features, coals: 115 featur es), r epresenting 10 to 20 fold expansion relative to raw measured variables. This expansion transforms sparse, heterogeneous measurements into a dense feature space where physically meaningful relationships are explicitly enco ded, facili- tating network learning by reducing the repr esentational burden: rather than discov ering V an’t Ho relationships from scratch, the network renes temperature-dependent corrections to pre-computed thermodynamic descriptors. 6.4.2 Missing V alue Treatment and Imputation Preprocessing addressed three data quality challenges: missing values in sparsely measured properties, outliers from experimental artifacts or reporting errors, and scale heterogeneity spanning multiple orders of magnitude . W e implemented adaptiv e strategies tailored to missing value severity and physical interpretability rather than applying uniform imputation across all featur es. A three-tier imputation strategy was employed, stratied by the degree of completeness. Properties exhibiting low missingness ( < 10 % , e.g., surface area, pressure, temperature) underwent k -nearest neighbors imputation ( with k = 5 ), lev eraging the local similarity structure to estimate missing values from measur ements sharing comparable material characteristics and measurement conditions. Features with medium missingness ( 10 – 30 % , e.g., micropore volume for clays, some mineralogical components for shales) received me dian imputation within each lithology class, under the assumption that typical values provide a reasonable approximation of unmeasured properties given the class-spe cic distributions. Properties showing high missingness ( > 30 % , e.g., ultimate analysis for coals, minority minerals for shales) were imputed using lithology-stratied median imputation performed separately 48 per lithology , recognizing that cross-lithology imputation would introduce geological inconsistencies (e .g., imputing shale pyrite content from coal vitrinite values would violate mineralogical plausibility). 6.4.3 Outlier Dete ction and Treatment T wo-stage outlier identication combined univariate and multivariate perspectives. Univariate in- terquartile range (IQR) analysis agged individual features exceeding 3 σ thresholds (Q1 − 3 × IQR or Q3 +3 × IQR), capturing measurement errors manifesting as extr eme single-variable values. Multivariate Isolation Forest analysis (contamination = 0.05) identied observations exhibiting anomalous patterns across multiple features simultaneously , detecting subtle inconsistencies invisible in univariate analysis (e .g., samples with plausible individual properties but implausible combinations of properties that violate geological constraints). Extreme outliers agge d by both methods (intersection of univariate and multivariate detections) were e xcluded from training data as likely e xperimental artifacts. Moderate outliers (union minus intersection) underwent winsorization, clipping values to 1st and 99th p ercentiles to retain information while limiting inuence on network gradients. 6.4.4 Feature Scaling and Ensemble Selection Robust scaling and systematic feature selection prepared the enriched dataset for neural network training while maintaining interpr etability and prev enting overtting. RobustScaler transformation applied median centering and interquartile range scaling, providing resistance to residual outliers post- preprocessing while preserving rank-order r elationships critical for physically interpretable features like temperature and pressure . Unlike StandardScaler (mean-variance normalization), RobustScaler’s quartile-based approach avoids scale distortion from heavy-taile d distributions characteristic of geolog- ical properties. Ensemble feature selection combined four complementary methods to identify the 50 most infor- mative features from the 105 to 120 engineered candidates. Pearson correlation ranking identied features with the strongest linear relationships to uptake, capturing primary drivers established in Section 3.3 . Mutual information scoring detected non-linear dependencies invisible to correlation analysis, rev ealing threshold eects and interaction-dependent r elationships. Random forest feature importance (100 trees, max depth 10) quantie d predictive contribution in tree-based ensemble mo dels, emphasizing features enabling accurate splits while accounting for interactions. The F-statistic ranking from univariate linear regression provided a statistical signicance assessment under a null-hyp othesis testing framework. Final feature selection retained features appearing in top-50 lists of at least three methods, ensuring consensus across diverse selection criteria while controlling for method-specic biases. This ensemble approach yielded robust featur e sets dominated by thermodynamic descriptors (temperature, pressur e, reduced variables), structural parameters (surface area, pore volume, micropore fraction), and composition indices (TOC for shales, maturity indicators for coals), aligning with physical expectations and property-uptake correlations. 6.4.5 Statistical V alidation of Engineered Features Preprocessing and feature engineering underwent rigorous statistical validation, quantifying uncertainty in engineered features and assessing stability across data subsets. Bootstrap resampling with 1,000 49 iterations generated empirical distributions for feature importance rankings and scaling parameters, yielding 95% condence intervals that guide interpretation: features with narrow condence intervals exhibit stable importance across resampled datasets, while broad condence inter vals signal sensitivity to sample composition and warrant cautious interpretation in network attribution analysis. Five- fold cross-validation assessed whether engineered features improve generalization relative to raw measurements, comparing model performance (random forest regression as benchmark) on raw versus engineered feature sets. Signicant cross-validation performance improvement (typically 15 to 30% increase in CV R 2 ) validates that engineered features encode genuine physical relationships rather than overtting training data. Correlation analysis among the engineered features revealed multicollinearity , necessitating dimen- sionality reduction or regularization during network training. Strong correlations ( — r — > 0 . 8 ) were observed b etween surface-area-derived features (surface density , total surface area, logarithmic surface area), indicating redundancy that can be eectively managed through elastic net penalties or grouped lasso during feature selection. In contrast, weak correlations b etween thermo dynamic descriptors and structural parameters (typically — r — < 0 . 3 ) conrm that these feature categories captur e largely orthogonal aspects of sorption behavior . This orthogonality justies the seven-category engineering framework and motivates the use of multi-branch network architectures, which process individual feature categories through separate pathways before fusion. 6.4.6 Train- V alidation- T est Splitting with Lithology Stratication Final data partitioning created training (70%), validation (15%), and test (15%) sets ensuring balanced lithology representation and preventing information leakage acr oss splits. Stratied sampling main- tained proportional lithology distributions in each partition, preventing scenarios where test set contains lithologies absent from training (which w ould evaluate extrapolation rather than interpolation capa- bility). Sample-level splitting ensured that all measurements from a single sample appear e xclusively in one partition, prev enting the network from learning sample-specic artifacts that enable cheating through memorization of sample identity rather than genuine property-based generalization. V alidation set served dual purposes during network dev elopment: hyperparameter optimization (learning rate, regularization strength, network depth) via performance monitoring, and early stopping based on validation loss plateaus to prev ent overtting. T est set remained strictly held-out until nal model evaluation, providing unbiased performance estimates on genuinely unseen data. Separate test set statistics (mean, standard deviation, lithology distribution, property ranges) wer e logged but not used for any training decisions, ensuring test set integrity . This rigorous split protocol, combined with sample-level partitioning and lithology stratication, enables condent claims about network generalization to new geological materials beyond the training corpus. All preprocessing artifacts (feature scaler parameters, imputation statistics, featur e selection results, data split indices) were serialized and archived, enabling repr oducible application of identical transfor- mations to future measurements and maintaining consistency between training-time prepr ocessing and deployment-time inference . 50 6.5 PINN Architecture Specications and Loss Function Derivations 6.5.1 Multi-Scale Network Architecture Details W e dev eloped a multi-scale physics-informe d neural network architecture specically designed for ge o- logical hydrogen sorption modeling under data-constrained conditions where material characterization exhibits substantial missingness and target distributions display e xtreme skewness. The architecture integrates three innovations: (i) hierarchical multi-scale feature extraction capturing patterns at multiple abstraction levels, (ii) physics-informed gating mechanisms encoding domain constraints directly into network topology , and (iii) progressive dimensional mo dulation enabling ecient information ow from high-dimensional material property space to scalar sorption predictions. Multi-Scale Feature Extraction. The architecture implements parallel feature extraction pathways operating at three spatial scales (64, 128, 256 neurons) that process the 50-dimensional input vector (selected via ensemble voting, Section 3.4 ) through independent transformation branches. Each scale captures distinct featur e hierar chies: the ne-scale pathway (64 neurons) extracts local property interactions and element-specic corr elations, the medium-scale pathway (128 neurons) captures intermediate lithological patterns and mineralogical relationships, and the coarse-scale pathway (256 neurons) learns global material property distributions and cross-scale dependencies. Scale-specic representations concatenate into a unied 448-dimensional intermediate representation ( h multi-scale = [ h 64 ; h 128 ; h 256 ] ) that preser ves information from all abstraction lev els while enabling subsequent layers to learn optimal feature combination strategies. Physics-Informed Gating Blocks. Following multi-scale extraction, physics-informed gating mechanisms implement so attention over feature channels based on physical r elevance criteria. For pressure ( p ) and temperature ( T ) inputs explicitly identied as primary sorption drivers (Section 3.3 ), we compute gating coecients via sigmoid-activated linear projections: g = σ ( W g [ p ; T ] + b g ) where g ∈ [0 , 1] 448 modulates multi-scale features element-wise ( h gated = g ⊙ h multi-scale ). This mechanism enables the network to dynamically emphasize thermodynamically rele vant features during sorption prediction while suppressing spurious correlations, encoding physical domain knowledge directly into architectural inductive bias rather than relying solely on data-driv en feature selection. Progressiv e Dimensional Reduction. Gated multi-scale features pass through a fully conne cted backbone implementing progressive compr ession topology (256, 512, 256, 128 neurons) with residual connections b etween layers of matching dimensionality . This encoder-de coder architecture rst expands dimensionality (256 to 512 neurons) to facilitate rich intermediate representations that capture complex nonlinear feature interactions, then progressiv ely compresses (512 to 256 to 128 neurons) to funnel information toward compact encodings hypothesized to lie on low-dimensional manifolds governing sorption behavior across lithologically diverse materials. Residual skip connections ( h i +1 = f ( W i h i + b i ) + h i ) mitigate vanishing gradient problems during backpropagation while preserving multi-scale information ow , enabling training of de eper architectures without gradient degradation characteristic of plain feedfor ward networks. The complete architecture totals 887,447 trainable parameters distribute d across multi-scale ex- traction (124,000 parameters), gating blocks (13,000 parameters), compression backbone (728,000 pa- rameters), and output projection (22,000 parameters). This represents a strategic balance between sucient capacity to capture heterogeneous sorption physics across three lithological classes (clays, 51 shales, coals) exhibiting distinct uptake me chanisms, while remaining tractable for ecient training on moderate-sized datasets (1,330 training samples) without catastrophic overtting. Activation Functions and Output Constraints. Hidden layers employ Swish activation ( f ( x ) = x · σ ( x ) ), pro viding a smo oth, non-monotonic response that enables learning of comple x non-linearities while maintaining bounded derivatives essential for stable gradient ow during physics loss backpropa- gation. The output layer utilizes Soplus activation ( f ( x ) = ln(1 + e x ) ), enforcing the non-negativity constraint ( Q ≥ 0 ) without discontinuous gradients characteristic of ReLU thresholding at zero. W eight initialization follows the Kaiming normal scheme ( W ∼ N (0 , p 2 /n in ) ) optimized for Swish-family activations, with the output layer receiving Xavier initialization with reduced gain (0.1) to produce small initial predictions appropriate for the low-magnitude uptake distribution dominating the training data. 6.5.2 Multi- T erm P hysics Loss Function Derivations The physics-informed loss function combines four complementary terms encoding data delity , physical consistency , hard constraints, and monotonicity requirements: L total = λ 1 L data + λ 2 L physics + λ 3 L bounds + λ 4 L monotonicity (18) where λ i represent dynamically adapted weight coecients balancing competing objectives through gradient-magnitude-based normalization. Data Loss (W eighted MSE). T arget distribution ske wness (75% of measurements b elow 0.1 mmol/g, maximum 1.3 mmol/g) creates an imbalance where naive mean squared error underrepresents rare high-uptake samples critical for storage capacity assessment. W e implement sample-wise w eighting via a sigmoid temperature-scaled threshold: w ( y ) = 1 1 + exp( − τ ( y − y thresh )) + 0 . 5 (19) where τ = 5 . 0 controls transition steepness and y thresh = 0 . 1 mmol/g denes the elevated-weight threshold. The minimum weight of 0.5 ensures low-uptake measurements remain represented, pre vent- ing complete majority class neglect while amplifying rare high-uptake sample inuence by factors up to 1.5. The weighted data loss becomes: L data = 1 N N X i =1 w ( y i )( y i − ˆ y i ) 2 (20) Physics Loss (Langmuir Saturation). Langmuir theory predicts asymptotic approach to maximum uptake q max at elevated pressure . W e penalize predictions violating lithology-specic capacity limits extracted from classical analysis ( clays: 1.2 mmol/g, shales: 1.0 mmol/g, coals: 0.88 mmol/g) for high- pressure measur ements ( p > 50 bar): L physics = 1 N p> 50 X p i > 50 h max(0 , ˆ y i − q lith i max ) + 0 . 1 · max(0 , 0 . 7 q lith i max − ˆ y i ) i (21) The rst term strongly penalizes o vershooting the maximum capacity (hard upper bound), while the 52 second term soly encourages high-pressure predictions to approach 70% of q max , accounting for kinetic limitations that prev ent full equilibration within nite experimental timeframes. Bounds and Monotonicity Constraints. P hysical admissibility requires 0 ≤ Q ≤ q max for all predictions: L bounds = 1 N N X i =1 h max(0 , − ˆ y i ) + max(0 , ˆ y i − q lith i max ) i (22) Gibbs phase rule dictates monotonic pressure-uptake r elationship at constant temperature ( ∂ Q/∂ p | T ≥ 0 ): L monotonicity = 1 N N X i =1 max(0 , − ∂ ˆ y i ∂ p i − ϵ ) (23) where ϵ = 10 − 6 provides numerical tolerance, and gradients ar e computed via automatic dierentiation. Adaptive Loss W eighting. Competing loss term magnitudes span orders of magnitude, creating gradient imbalance where dominant terms can o verwhelm smaller contributions. W e implement Neural T angent Kernel-inspired adaptive weighting: for each term L k , we compute the gradient norm g k = ∥∇ θ L k ∥ 2 , update via exponential moving average ( α = 0 . 1 ), and normalize: λ k = ¯ g max / ( ¯ g k + ϵ ) where ¯ g max = max k ¯ g k . This ensures all terms contribute comparable gradient magnitudes to parameter updates, preventing single-term domination while preserving relative importance through normalization rather than arbitrary manual tuning. 6.6 Training Protocols and Hyperparameter Optimization 6.6.1 Progressiv e Three-Phase Training Strategy Training procee ds through three se quential phases, implementing curriculum learning principles, wher e the network rst masters data patterns before incorporating physics constraints, pr eventing physics term interference with early repr esentation learning. Phase 1: Data-Driven W armup (50 ep ochs). Initial training employs data loss exclusively ( λ 1 = 1 . 0 , λ 2 , 3 , 4 = 0 . 0 ) with learning rate η = 1 . 2 × 10 − 3 , AdamW optimizer (weight decay λ wd = 10 − 5 ), and batch size 64. This warmup phase establishes foundational representations encoding pressure- temperature-uptake relationships and material property correlations identied in Section 3.3 . Phase 2: Physics Integration (250 epochs). P hysics loss weight incr eases linearly from 0 to 1 over 250 epochs ( λ 2 ( e ) = e/ 250 for epoch e ), gradually introducing Langmuir saturation constraints while data loss maintains constant weight. Learning rate reduces to 5 × 10 − 4 with cosine annealing: η ( e ) = η min + ( η max − η min )(1 + cos( π e/ 250)) / 2 where η min = 10 − 6 , enabling p eriodic warmup cycles that facilitate escape from sharp local minima encountered during physics constraint integration. Phase 3: Full Constraints (100 epo chs). Final training phase activates all loss terms at constant weights (data: 1.0, physics: 1.0, bounds: 0.1, monotonicity: 0.05), enforcing complete physics consistency including hard b ounds and monotonicity requirements. Reduce d learning rate ( η = 10 − 4 , cosine annealing to η min = 10 − 7 ) p erforms ne-grained parameter adjustments satisfying all constraints simultaneously . Lower weights for b ounds and monotonicity losses (relative to data and physics) reect their role as auxiliary regularizers rather than primary training objectives, preventing ov er-constraint that would sacrice prediction accuracy for perfect physical consistency . A utomatic mixed precision training (AMP) accelerates computation through selective oat16 opera- 53 tions while maintaining oat32 precision for numerically sensitive calculations (gradient accumulation, loss computation), reducing memory footprint and enabling larger ee ctive batch sizes without sac- ricing numerical stability . Gradient clipping to maximum norm 1.0 prevents exploding gradients during physics loss backpropagation, wher e automatic dierentiation thr ough network outputs can generate large gradient magnitudes, particularly during early P hase 2 training when physics term weight increases rapidly . 6.6.2 Systematic Hyp erparameter Optimization Exp eriments W e conducted extensiv e hyperparameter optimization spanning over 30 experiments, systematically exploring architectural choices, regularization strategies, and training sche dules. This comprehensive search identied critical performance determinants that could not b e discovered through standard grid search or domain expertise alone. Dropout Rate Optimization. While standard practice recommends dropout rates of 0.5 for fully connected networks, systematic evaluation across candidate values (0.05, 0.08, 0.10, 0.12, 0.15, 0.18, 0.20) rev ealed dropout rate 0.10 as optimal through cross-validated performance assessment across 15 independent random se eds. The optimal 0.10 rate provides sucient regularization to prevent overtting while pr eserving the network capacity needed to capture heterogeneous sorption physics across diverse lithological classes. Performance stability analysis conrmed robust generalization at this dropout rate, with notably superior performance for minority lithology classes (coals) that are particularly sensitive to ov ertting due to limited training examples. Training Duration Studies. Progressive training experiments at candidate durations (200, 300, 400, 500, and 600 epochs) identie d 400 epochs as optimal for balancing convergence completeness against overtting risk. Training curve analysis demonstrated continue d validation improvement through epoch 350 with stabilization thereaer , while 500-epoch congurations exhibited marginal validation degradation indicative of early ov ertting onset. The 400-epo ch conguration established an optimal trade-o between computational cost and model p erformance. Learning Rate and Scheduler T uning. Initial learning rate sweep across candidate values (0.0001, 0.0005, 0.0012, 0.002, 0.005) identied η = 0 . 0012 as optimal, balancing rapid early convergence against late-stage stability . Comparative scheduler evaluation demonstrated cosine annealing with periodic warmup cycles outperformed constant scheduling and exponential decay alternatives, with warmup cycles enabling escape from sharp lo cal minima encountered during physics constraint integration. Final conguration specie d: initial η = 1 . 2 × 10 − 3 , minimum η min = 10 − 7 , cosine period 250 ep ochs aligned with Phase 2 duration. Batch Size Ee cts. Batch size evaluation across candidates (32, 64, 128) revealed 64 as optimal trade- o between gradient estimate stability (favoring larger batches) and implicit stochastic regularization (favoring smaller batches). Batch size 32 produced noisy training dynamics with elevated variance in epoch-to-epo ch validation metrics, while batch size 128 reduce d b enecial mini-batch stochasticity leading to validation performance degradation. The 64-sample conguration provided stable training dynamics while maintaining benecial mini-batch noise eects that prevent overtting. The optimal conguration under went validation through 15 independent replications with distinct random initializations to assess stability across sto chastic optimization traje ctories. Performance consistency across replications conrmed conguration robustness rather than fortuitous optimization 54 trajectory , validating the systematic search methodology . 6.6.3 Architecture-Diverse Ensemble Learning Framework Predictive uncertainty quantication via ensemble learning requires genuine model diversity capturing distinct regions of solution space. Preliminary experiments with dropout-only ensembles (10 memb ers with identical architecture varying only dropout masks during training) revealed insucient diversity: near-perfect inter-member correlation and absence of meaningful prediction variance demonstrated that dropout variation alone cannot induce sucient architectural diversity when all mo dels share identical capacity and representational constraints. Architectural Diversity Strategy . W e implemented true architectural diversity through systematic variation of network topology across ensemble members while maintaining the consistent multi-scale gating framework established as a core ar chitectural principle: • Width variations: Narrow (0.75 × base neurons: 192, 384, 192, 96), standard (1.0 × : 256, 512, 256, 128), wide (1.25 × : 320, 640, 320, 160) • Depth variations: Shallow (3 layers: 256, 512, 256), deep (5 layers: 256, 512, 512, 256, 128) • Hybrid architectures: Interme diate congurations (240, 480, 360, 120), (280, 560, 280), (280, 560, 420, 140) • Regularization diversity: Dropout rates (0.08, 0.10, 0.12, 0.15), learning rates (0.0010, 0.0012, 0.0015) Each of the 10 ensemble members underwent complete 400-epoch training with distinct random initialization (seeds: 42, 123, 456, 789, 2024, 3141, 1618, 2718, 9999, 7777), exploring independent optimization trajectories within topology-sp ecic solution spaces. Architectural diversity substantially reduced inter-member correlation and increased prediction variance relative to dropout-only baseline, though correlation remained elevated due to shared training data constraining epistemic uncertainty . 6.6.4 Post-Hoc Uncertainty Calibration Protocol Ensemble predictions aggregate via mean and standard deviation: ¯ y = 1 K P K k =1 ˆ y k and σ = q 1 K P K k =1 ( ˆ y k − ¯ y ) 2 where K = 10 denotes ensemble size. Prediction intervals at condence level α construct as [ ¯ y − z α/ 2 σ, ¯ y + z α/ 2 σ ] assuming Gaussian uncertainty distribution, with z α/ 2 representing the standard normal quantile (e .g., z 0 . 025 = 1 . 96 for 95% inter vals). T emperature Scaling Calibration. Raw ensemble uncertainty typically exhibits systematic mis- calibration where prediction interval coverage rates deviate from nominal condence le vels, reecting epistemic uncertainty limitations when all ensemble memb ers train on identical datasets. W e imple- mented post-hoc calibration via temperature scaling, optimizing scalar multiplier τ such that scaled uncertainties ˜ σ = τ σ achieve target co verage rates on held-out validation data. Optimal temperature parameter identication through validation set optimization enables calibrate d prediction intervals providing r eliable uncertainty quantication for downstream decision-making applications. Lithology-Specic Calibration. Calibration quality assessment conducted separately per lithol- ogy (clays, shales, coals) enables identication of material-class-specic heterogeneity levels aecting prediction uncertainty . Dierential calibration performance across lithologies provides scientic in- sight into intrinsic variability of sorption processes within each material class, informing appropriate condence levels for practical hy drogen storage site assessment and capacity estimation. 55 6.6.5 Comprehensive Regularization Strategy Comprehensive regularization integrates six complementar y me chanisms addressing distinct o vertting pathways. (i) L2 w eight regularization (w eight decay λ = 10 − 5 in AdamW optimizer) penalizes large pa- rameter magnitudes, encouraging smo oth decision b oundaries that generalize beyond training examples. (ii) Dropout (rate 0.10, optimized via systematic search) randomly deactivates neurons during training, prev enting feature co-adaptation and forcing the network to learn redundant representations robust to missing information. (iii) Batch normalization layers following each linear transformation normalize activations to zero mean and unit variance within mini-batches, reducing internal covariate shi while providing implicit regularization through mini-batch-dependent noise. (iv ) Data augmentation via mini-batch sampling (batch size 64 from 1,330 training samples) e xposes the network to diverse data subsets each epoch, preventing memorization of complete training set ordering. (v) Early stopping monitors validation loss with patience of 20 epochs (tolerance δ = 10 − 5 ), terminating training when validation performance plateaus despite continued training loss reduction, indicating overtting onset where the model increasingly ts training noise rather than generalizable patterns. (vi) Stratied train- validation-test splitting with sample-lev el partitioning prevents information leakage where multiple measurements from single samples appear across splits, ensuring fair evaluation of generalization to unseen geological materials. Regularization hyperparameters sele cted via preliminar y grid search on validation set p erformance, balancing undertting risks from excessive regularization against ov ertting from insucient con- straint. Final conguration achieves stable training cur ves exhibiting parallel training and validation loss reduction without divergence characteristic of ov ertting, with terminal validation performance within acceptable margins of training performance conrming genuine generalization rather than memorization. 6.6.6 Reproducibility and Computational Eciency All experiments employ deterministic training mode with PyT or ch computational backends congured for reproducibility and explicit random seed control, enabling exact result replication across independent runs. Comprehensive checkpointing preserves complete training state (model parameters, optimizer momentum estimates, scheduler counters, training metrics, conguration metadata) every 10 epo chs, en- abling training interruption recovery and retrospective analysis of learning dynamics. Best-performing checkpoint based on minimum validation loss receives additional persistence enabling restoration of optimal mo del state independent of nal epoch performance, guarding against late-training performance degradation from aggressiv e learning rate schedules or physics constraint activation. For ensemble training, the che ckpoint manager maintains separate state les p er ensemble member indexed by model number (0 through 9), with indep endent optimizer and scheduler states r eecting potentially divergent training trajectories despite identical hyperparameter spe cications. Maximum checkpoint retention (5 most recent per mo del) balances storage requirements against training history preservation, with automatic cleanup removing sup erseded checkpoints older than the retention window . 56 6.7 Comprehensive Evaluation Protocols and Interpretability Methods Model evaluation employs 35 distinct metrics spanning ve e valuation domains, providing multifacete d performance assessment beyond simple goodness-of-t statistics. (i) Regression metrics (8 measures): Coecient of determination (R 2 , adjuste d R 2 ), mean squar ed error (MSE), root mean squared error (RMSE), mean absolute err or (MAE), mean absolute percentage error (MAPE), maximum err or , explained variance, and mean bias error (MBE), capturing prediction accuracy , error magnitude distribution, and systematic bias. (ii) Correlation metrics (3 measures): Pearson correlation coecient (linear asso ciation), Spear- man rank correlation (monotonic asso ciation), and Kendall tau (concordance), assessing prediction- observation relationship strength via complementary statistical frameworks. (iii) P hysics consistency metrics (5 measures): Constraint violation rate quantifying fraction of predictions exceeding lithology-spe cic maximum uptake, negative prediction rate identifying non-physical negative sorption values, saturation consistency measuring proportion of high-pressure predictions approaching q max within physically reasonable range (70 to 100%), and monotonicity score evaluating fraction of pressur e-sorted predictions exhibiting non-decreasing uptake. (iv) Uncertainty quantication metrics (8 measures): Prediction inter val coverage rates at multiple condence levels (68%, 95%, 99% corresponding to 1 σ , 2 σ , 3 σ ), calibration error measuring deviation from ideal cov erage, sharpness quantifying average interval width, uncertainty-error corre- lation assessing whether the model exhibits appropriate condence, coverage-width criterion (CW C) trading o coverage against interval tightness, and mean prediction inter val width (MPI W) measuring uncertainty magnitude. (v ) Statistical tests (7 measures): Shapiro- Wilk and Kolmogorov-Smirno v tests e valuating residual normality , heteroscedasticity test (corr elation b etween absolute residuals and predictions) detect- ing variance non-constancy , Durbin- W atson statistic identifying temporal or spatial autocorrelation, Anderson-Darling test providing alternative normality assessment, Jarque-Bera test examining skewness and kurtosis, and Lev ene test comparing residual variance homogeneity acr oss prediction magnitude quantiles. Evaluation executes on strictly held-out test set (286 samples, 15% of total data) completely isolate d from all training, validation, and hyperparameter selection de cisions, providing unbiased performance estimates generalizable to future unseen samples. Comparative analysis against random forest baseline and aggregated classical models quanties PINN performance improv ement, justifying architectural complexity and computational cost. Success criteria require test set performance exceeding classical aggregated model benchmarks while maintaining strong physics consistency (constraint violation rate below 5%) and well-calibrated uncertainty quantication (95% prediction inter val coverage within 90 to 100%). References [1] M. Liebensteiner and M. W rienz. “Do Intermittent Rene wables Threaten the Electricity Supply Security?” In: Energy Economics 87 (2020), p. 104499. doi : https : / / doi . org / 10 . 1016 / j . eneco.2019.104499 . 57 [2] P . E. Dodds and S. D . Garvey. “Chapter 1 - The Role of Energy Storage in Low-Carbon Energy Systems”. In: Storing Energy . Ed. by T . M. Letcher. Oxford: Elsevier, 2016, pp . 3–22. doi : https: //doi.org/10.1016/B978- 0- 12- 803440- 8.00001- 4 . [3] N. Heinemann, J. Alcalde, J. M. Miocic, et al. “Enabling large-scale hydrogen storage in porous media – the scientic challenges”. In: Energy Environ. Sci. 14 (2 2021), pp. 853–864. doi : 10.1039/ D0EE03536J . [4] M. Masoudi, A. Hassanpouryouzband, H. Hellevang, and R. S. Haszeldine. “Lined rock caverns: A hydr ogen storage solution”. In: Journal of Energy Storage 84 (2024), p. 110927. doi : https : //doi.org/10.1016/j.est.2024.110927 . [5] N. Heinemann, M. Booth, R. Haszeldine, et al. “Hydrogen storage in porous geological formations – onshore play opportunities in the midland valley (Scotland, UK)”. In: International Journal of Hydrogen Energy 43.45 (2018), pp. 20861–20874. doi : https : / / doi . org / 10 . 1016 / j . ijhydene.2018.09.149 . [6] A. Hassanpouryouzband, E. Joonaki, K. Edlmann, and R. S. Haszeldine. “Oshore Geological Storage of Hydrogen: Is This Our Best Option to A chieve Net-Zero?” In: A CS Energy Letters 6.6 (2021), pp. 2181–2186. doi : 10.1021/acsenergylett.1c00845 . [7] A. Hassanpouryouzband, T . Armitage, T . Cowen, et al. “The Search for Natural Hydrogen: A Hidden Energy Giant or an Elusive Dream?” In: A CS Energy Letters 0.0 (2025), pp. 3887–3891. doi : 10.1021/acsenergylett.5c01420 . [8] V . Zgonnik. “The occurrence and geoscience of natural hydrogen: A comprehensive r eview”. In: Earth-Science Reviews 203 (2020), p. 103140. doi : https://doi.org/10.1016/j.earscirev. 2020.103140 . [9] A. Hassanpour youzband, M. J. V eshar eh, M. Wilkinson, et al. “In situ hydrogen generation from underground fossil hydr ocarb ons”. In: Joule 9.2 (2025). [10] A. Hassanpouryouzband, M. Wilkinson, and R. S. Haszeldine. “Hydrogen energy futures – foraging or farming?” In: Chem. So c. Rev . 53 (5 2024), pp. 2258–2263. doi : 10.1039/D3CS00723E . [11] M. Didier, L. Le one, J. - M. Greneche, E. Giaut, and L. Charlet. “Adsorption of Hydrogen Gas and Redox Processes in Clays”. In: Environmental Science & T echnology 46.6 (2012). PMID: 22352351, pp. 3574–3579. doi : 10.1021/es204583h . [12] F . Bardelli, C. Mondelli, M. Didier, et al. “Hydrogen uptake and diusion in Callovo-Oxfordian clay rock for nuclear waste disposal technology”. In: A pplie d Ge ochemistr y 49 (2014). Geochemistr y for Risk Assessment: Hazardous waste in the Geosphere, pp. 168–177. doi : https://doi.org/ 10.1016/j.apgeochem.2014.06.019 . [13] M. Masoudi, M. No oraiepour, R. Blom, et al. “Impact of hydration on hydr ogen sorption in clay minerals and shale caprocks: Implications for hydrogen energy and waste storage”. In: International Journal of Hydrogen Energy 99 (2025), pp. 661–670. doi : https://doi.org /10. 1016/j.ijhydene.2024.12.247 . [14] L. T ruche, G. Joubert, M. Dargent, et al. “Clay minerals trap hydrogen in the Earth’s crust: Evidence from the Cigar Lake uranium deposit, Athabasca”. In: Earth and P lanetary Science Letters 493 (2018), pp. 186–197. doi : https://doi.org/10.1016/j.epsl.2018.04.038 . 58 [15] P . A vseth, T . Mukerji, G. Mavko, and J. D vorkin. “Rock-physics diagnostics of depositional te xture, diagenetic alterations, and reservoir heter ogeneity in high-porosity siliciclastic sediments and rocks— A review of selected models and suggested w ork o ws”. In: Geophysics 75.5 (2010), 75A31– 75A47. [16] M. Nooraiepour. “Rock properties and sealing eciency in ne-grained siliciclastic caprocks — implications for CCS and petroleum industry”. In: Doctoral dissertation submitted Faculty of Mathematics and Natural Sciences, University of Oslo, Norway (2018). [17] M. Nooraiepour, N. H. Mondol, H. Hellevang, and K. Bjørlykke. “Experimental mechanical compaction of reconstituted shale and mudstone aggregates: Investigation of petrophysical and acoustic properties of SW Barents Sea cap rock sequences”. In: Marine and Petroleum Geology 80 (2017), pp. 265–292. [18] P . Mou, J. Pan, Q. Niu, et al. “Coal pores: methods, types, and characteristics”. In: Energy & Fuels 35.9 (2021), pp. 7467–7484. [19] M. Nooraiepour, B. G. Haile, and H. Hellevang. “Compaction and me chanical strength of Middle Miocene mudstones in the Nor wegian North Sea– The major seal for the Skade CO2 storage reservoir”. In: International Journal of Greenhouse Gas Control 67 (2017), pp. 49–59. [20] M. No oraiepour, N. H. Mondol, and H. Hellevang. “Permeability and physical properties of semi-compacted ne-grained se diments– A laboratory study to constrain mudstone compaction trends”. In: Marine and Petroleum Geology 102 (2019), pp. 590–603. [21] K. Bjørlykke. “Mudrocks, shales, silica deposits and evaporites”. In: Petroleum Ge oscience: From Sedimentary Environments to Rock Physics . Springer, 2015, pp. 217–229. [22] M. Nooraiepour. “Clay mineral typ e and content control properties of ne-grained CO2 caprocks—laborator y insights from strongly swelling and non-swelling clay–quartz mixtures”. In: Energies 15.14 (2022), p. 5149. [23] S. Iglauer, H. Abid, A. Al- Y aseri, and A. K eshavarz. “Hydrogen A dsorption on Sub-Bituminous Coal: Implications for Hydr ogen Ge o-Storage”. In: Geophysical Research Letters 48.10 (2021), e2021GL092976. doi : https://doi.org/10.1029/2021GL092976 . [24] M. Arif, H. Rasool Abid, A. K eshavarz, F . Jones, and S. Iglauer. “Hydrogen storage potential of coals as a function of pressure , temperature, and rank”. In: Journal of Colloid and Interface Science 620 (2022), pp. 86–93. doi : https://doi.org/10.1016/j.jcis.2022.03.138 . [25] C. W ang, Y . Zhao, R. W u, J. Bi, and K. Zhang. “Shale reservoir storage of hydr ogen: Adsorption and diusion on shale”. In: Fuel 357 (2024), p. 129919. doi : https : / / doi . org / 10 . 1016 / j . fuel.2023.129919 . [26] A. Alanazi, H. Rasool Abid, M. Usman, et al. “Hydr ogen, carbon dioxide, and methane adsorption potential on Jordanian organic-rich source rocks: Implications for underground H2 storage and retrieval”. In: Fuel 346 (2023), p. 128362. doi : https : / / doi . org / 10 . 1016 / j . fuel . 2023 . 128362 . [27] M. Masoudi, A. G. Meyra, M. Nooraiepour, et al. “Revisiting Hydr ogen Sorption–Desorption in Natural Rocks”. In: Industrial & Engineering Chemistry Research 65.6 (2026), pp. 2984–3026. 59 [28] M. Aslannezhad, M. Sayyafzadeh, S. Iglauer, and A. Keshavarz. “Identication of early opportuni- ties for simultaneous H2 separation and CO2 storage using deplete d coal seams”. In: Separation and Purication T echnology 330 (2024), p. 125364. doi : https : / / doi . org / 10 . 1016 / j . seppur.2023.125364 . [29] H. Rasool Abid, A. Keshavarz, J. Lercher, and S. Iglauer. “Pr omising material for large-scale H2 storage and ecient H2-CO2 separation”. In: Separation and Purication T echnology 298 (2022), p. 121542. doi : https://doi.org/10.1016/j.seppur.2022.121542 . [30] Q . Zhang, J. W ang, L. Zhang, et al. “Hydrogen adsorption kinetics and diusion of clays: Implica- tions for hydrogen geo-storage and natural hydrogen exploration”. In: Journal of Colloid and Inter- face Science 700 (2025), p. 138440. doi : https://doi.org/10.1016/j.jcis.2025.138440 . [31] Q . Zhang, M. Masoudi, L. Sun, et al. “Hydrogen and Cushion Gas A dsorption–Desorption Dy- namics on Clay Minerals”. In: A CS A pplied Materials & Interfaces 16.40 (2024). PMID: 39324742, pp. 53994–54006. doi : 10.1021/acsami.4c12931 . [32] D . W ol-Boenisch, H. R. Abid, J. E. T ucek, A. Keshavarz, and S. Iglauer. “Importance of clay-H2 interactions for large-scale underground hydrogen storage”. In: International Journal of Hydrogen Energy 48.37 (2023), pp. 13934–13942. doi : https://doi.org/10.1016/j.ijhydene.2022. 12.324 . [33] T . Xu, R. Senger , and S. Finsterle. “Corrosion-induced gas generation in a nuclear waste r eposi- tory: Reactive geo chemistry and multiphase ow eects”. In: A pplied Geochemistr y 23.12 (2008), pp. 3423–3433. doi : https://doi.org/10.1016/j.apgeochem.2008.07.012 . [34] J. - S. Kim, S. - K. K won, M. Sanchez, and G. - C. Cho. “Geological storage of high lev el nuclear waste”. In: KSCE Journal of Civil Engineering 15.4 (2011), pp. 721–737. [35] C. - F . T sang, F. Bernier, and C. Davies. “Geohydromechanical processes in the Excavation Damaged Zone in crystalline rock, rock salt, and indurate d and plastic clays—in the context of radioactive waste disposal”. In: International Journal of Rock Me chanics and Mining Sciences 42.1 (2005), pp. 109–125. [36] P . P. Ziemia ´ nski and A. Derkowski. “Structural and textural contr ol of high-pressure hydr ogen adsorption on expandable and non-expandable clay minerals in geologic conditions”. In: Interna- tional Journal of Hydrogen Energy 47.67 (2022), pp . 28794–28805. doi : https://doi.org/10. 1016/j.ijhydene.2022.06.204 . [37] D . Broom and C. W ebb. “Pitfalls in the characterisation of the hydrogen sorption properties of materials”. In: International Journal of Hydrogen Energy 42.49 (2017), pp. 29320–29343. doi : https://doi.org/10.1016/j.ijhydene.2017.10.028 . [38] G. Limousin, J. - P . Gaudet, L. Charlet, et al. “Sorption isotherms: A revie w on physical bases, modeling and measurement”. In: A pplie d ge ochemistry 22.2 (2007), pp. 249–275. [39] W . Xie, S. Chen, V . V andeginste, et al. “Review of the eect of diagenetic evolution of shale reservoir on the p ore structure and adsorption capacity of clay minerals”. In: Energy & Fuels 36.9 (2022), pp. 4728–4745. [40] G. Carleo, I. Cirac, K. Cranmer, et al. “Machine learning and the physical sciences”. In: Reviews of Modern Physics 91.4 (2019), p. 045002. 60 [41] A. Malekloo, E. Ozer, M. AlHamaydeh, and M. Girolami. “Machine learning and structural health monitoring overview with emerging technology and high-dimensional data source highlights”. In: Structural Health Monitoring 21.4 (2022), pp. 1906–1955. [42] M. Nooraiepour, J. W . Both, T . Kadeethum, and S. Sadeghnejad. “Partial Dierential Equations in the Age of Machine Learning: A Critical Synthesis of Classical, Machine Learning, and Hybrid Methods”. In: (2026). arXiv: 2603.07655 [cs.LG] . [43] T . Zhao, S. W ang, C. Ouyang, et al. “Articial intelligence for geoscience: Progress, challenges, and perspectives”. In: The Innovation 5.5 (2024). [44] R. Zuo. “Machine learning of mineralization-related ge ochemical anomalies: A r eview of potential methods”. In: Natural Resources Research 26.4 (2017), pp. 457–464. [45] N. Prasianakis, E. Laloy, D. Jacques, et al. “Geochemistry and machine learning: metho ds and benchmarking”. In: Environmental Earth Sciences 84.5 (2025), p. 121. [46] J. Zhang, Q. Zheng, L. Wu, and L. Zeng. “Using deep learning to improve ensemble smo other: Appli- cations to subsurface characterization”. In: W ater Resources Research 56.12 (2020), e2020WR027399. [47] X. Liu, M. Cheng, H. Zhang, and C. - J. Hsieh. “T owards robust neural networks via random self- ensemble”. In: Proceedings of the european conference on computer vision (ECCV) . 2018, pp. 369– 385. [48] S. Abimannan, E. - S. M. El- Alfy, Y . - S. Chang, et al. “Ensemble multifeatured de ep learning models and applications: A survey”. In: IEEE Access 11 (2023), pp. 107194–107217. [49] P . P. Mitra. “Fitting elephants in modern machine learning by statistically consistent interpolation”. In: Nature Machine Intelligence 3.5 (2021), pp. 378–386. [50] M. M. Malik. “A hierarchy of limitations in machine learning”. In: arXiv preprint (2020). [51] R. Rai and C. K. Sahu. “Driv en by data or derived through physics? a revie w of hybrid physics guided machine learning techniques with cyber-physical system ( cps) focus”. In: IEEe Access 8 (2020), pp. 71050–71073. [52] J. T ellinghuisen. “V an’t Ho analysis of K ° (T): How good. . . or bad?” In: Biophysical Chemistry 120.2 (2006), pp. 114–120. [53] A. Nuhnen and C. Janiak. “A practical guide to calculate the isosteric heat/enthalpy of adsorption via adsorption isotherms in metal–organic frameworks, MOFs”. In: Dalton Transactions 49.30 (2020), pp. 10295–10307. [54] T . Letcher and A. L. Myers. “Thermodynamics of adsorption”. In: Chemical Thermodynamics for Industry . The Royal Society of Chemistr y, 2004. doi : 10.1039/9781847550415- 00243 . [55] J. Lee. Thermal Physics: Entropy A nd Free Energies (2nd Edition) . W orld Scientic Publishing Company, 2011. [56] R. Masel. Principles of Adsorption and Reaction on Solid Surfaces . Wiley Series in Chemical Engi- neering. Wiley , 1996. [57] H. Swenson and N. P . Stadie. “Langmuir’s Theor y of A dsorption: A Centennial Review”. In: Lang- muir 35.16 (2019). PMID: 30912949, pp. 5409–5426. doi : 10.1021/acs.langmuir.9b00154 . 61 [58] R. Zangi. “Breakdown of Langmuir Adsorption Isotherm in Small Closed Systems”. In: Langmuir 40.7 (2024). PMID: 38315174, pp. 3900–3910. doi : 10.1021/acs.langmuir.3c03894 . [59] J. Landers, G. Y . Gor, and A. V . Neimark. “Density functional theor y methods for characterization of porous materials”. In: Colloids and Surfaces A: P hysicochemical and Engine ering Aspe cts 437 (2013). Characterization of Porous Materials: From Angstroms to Millimeters A Colle ction of Selected Papers Presented at the 6th International W orkshop, CPM-6 April 30 – May 2nd, 2012, Delray Beach, FL, USA Co-sp onsored by Quantachrome Instruments, pp. 3–32. doi : https : //doi.org/10.1016/j.colsurfa.2013.01.007 . [60] D . Ruthven. Principles of Adsorption and Adsorption Processes . Wiley-Interscience publication. Wiley, 1984. [61] I. Langmuir. “THE CONSTI T U TION AND F UND AMEN T AL PROPERTIES OF SOLIDS AND LIQUIDS. P ART I. SOLIDS.” In: Journal of the A merican Chemical Society 38.11 (1916), pp. 2221– 2295. doi : 10.1021/ja02268a002 . [62] H. M. F. Freundlich. “O ver the adsorption in solution”. In: J. P hys. chem 57.385471 (1906), pp. 1100– 1107. [63] S. Brunauer, P . H. Emmett, and E. T eller. “Adsorption of Gases in Multimolecular Layers”. In: Journal of the A merican Chemical Society 60.2 (1938), pp. 309–319. doi : 10.1021/ja01269a023 . [64] M. T empkin, V . Pyzhe v, et al. “Kinetics of ammonia synthesis on pr omoted iron catalyst”. In: Acta Phys. Chim. USSR 12.1 (1940), p. 327. [65] J. T ´ oth. “State equation of the solid-gas interface layers”. In: Acta chim. hung. 69 (1971), pp. 311– 328. [66] J. T ´ oth. “Uniform interpretation of gas/solid adsorption”. In: Advances in Colloid and Interface Science 55 (1995), pp. 1–239. doi : https://doi.org/10.1016/0001- 8686(94)00226- 3 . [67] J. T ´ oth. “Some Conse quences of the Application of Incorrect Gas/Solid Adsorption Isotherm Equations”. In: Journal of Colloid and Interface Science 185.1 (1997), pp. 228–235. doi : https : //doi.org/10.1006/jcis.1996.4562 . [68] R. Sips. “On the Structure of a Catalyst Surface”. In: The Journal of Chemical Physics 16.5 (1948), pp. 490–495. doi : 10.1063/1.1746922 . [69] O . Redlich and D. L. Peterson. “A Useful A dsorption Isotherm”. In: The Journal of Physical Chemistry 63.6 (1959), pp. 1024–1024. doi : 10.1021/j150576a611 . [70] M. Dubinin and L. Radushkevich. “The equation of the characteristic cur ve of the activated charcoal”. In: Proceedings of the Academy of Sciences of the USSR, Physical Chemistr y Section 55 (1947), pp. 331–337. [71] A. V . Ponce-Bobadilla, V . Schmitt, C. S. Maier, S. Mensing, and S. Sto dtmann. “Practical guide to SHAP analysis: Explaining super vised machine learning model predictions in drug development”. In: Clinical and translational science 17.11 (2024), e70056. [72] H. W ang, Q . Liang, J. T . Hancock, and T . M. Khoshgoaar . “Feature selection strategies: a com- parative analysis of SHAP-value and importance-based methods”. In: Journal of Big Data 11.1 (2024), p. 44. 62 [73] T . Danesh, R. Ouaret, P . Floquet, and S. Negny. “Interpretability of neural networks predictions using Accumulated Local Eects as a model-agnostic method”. In: Computer aided chemical engineering . V ol. 51. Elsevier, 2022, pp. 1501–1506. [74] C. Okoli. “Statistical inference using machine learning and classical techniques based on accumu- lated local eects (ALE)”. In: arXiv preprint arXiv:2310.09877 (2023). [75] J. H. Friedman and B. E. Popescu. “Predictive learning via rule ensembles”. In: (2008). [76] A. Inglis, A. Parnell, and C. B. Hurley. “Visualizing variable importance and variable interaction eects in machine learning models”. In: Journal of Computational and Graphical Statistics 31.3 (2022), pp. 766–778. [77] Z. Zhou, L. Luo, Q . Liao, X. Liu, and E. Zhu. “Impr oving embedding generalization in few-shot learning with instance neighb or constraints”. In: IEEE T ransactions on Image Processing 32 (2023), pp. 5197–5208. [78] D . T eney, E. Abbasnejad, and A. v . d. Hengel. “On incorporating semantic prior knowledge in deep learning through embedding-space constraints”. In: arXiv preprint arXiv:1909.13471 (2019). [79] S. N. Ravi, T . Dinh, V . S. Lokhande, and V . Singh. “Explicitly imposing constraints in deep networks via conditional gradients gives improv ed generalization and faster convergence”. In: Procee dings of the AAAI conference on articial intelligence . V ol. 33. 01. 2019, pp. 4772–4779. 63
Original Paper
Loading high-quality paper...
Comments & Academic Discussion
Loading comments...
Leave a Comment