Design-Based Inference for the AUC with Complex Survey Data
Complex survey data are usually collected following complex sampling designs. Accounting for the sampling design is essential to obtain unbiased estimates and valid inferences when analyzing complex survey data. The area under the receiver operating …
Authors: Amaia Iparragirre, Thomas Lumley, Irantzu Barrio
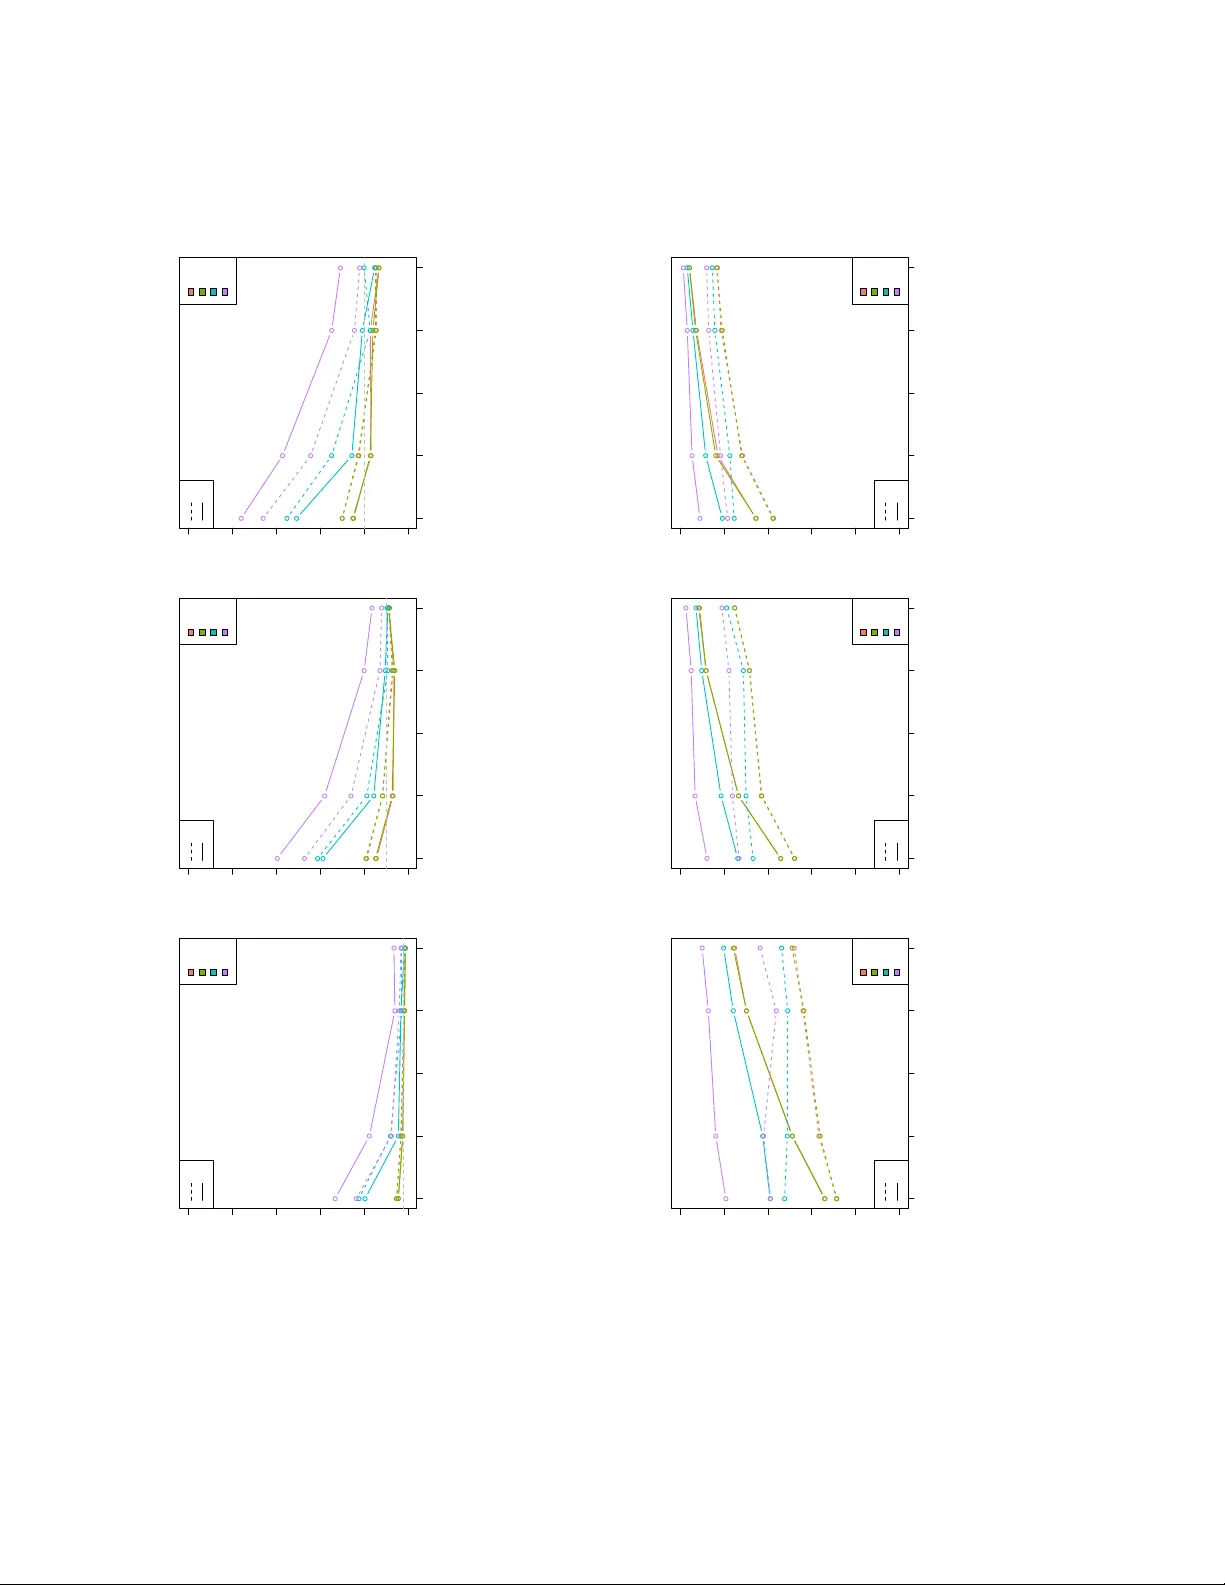
Design-Based Inference for the A UC with Complex Surv ey Data Amaia Iparragirre ∗ 1 , Thomas Lumley 2 , Iran tzu Barrio 3 , 4 1 Departamen to de M ´ eto dos Cuan titativos. Universidad del P a ´ ıs V asco UPV/EHU 2 Departmen t of Statistics. Universit y of Auckland. 3 Departamen to de Matem´ aticas. Universidad del P a ´ ıs V asco UPV/EHU 4 BCAM - Basque Cen ter for Applied Mathematics Abstract Complex surv ey data are usually collected follo wing complex sampling de- signs. Accounting for the sampling design is essential to obtain unbiased esti- mates and v alid inference when analyzing complex surv ey data. The area under the receiv er op erating c haracteristic curve (A UC) is routinely used to assess the discriminative ability of predictiv e mo dels for binary outcomes. Ho w ever, v alid inference for the AUC under complex sampling designs remains challeng- ing. Although b o otstrap techniques are widely applied under simple random sampling for v ariance estimation in this framew ork, traditional implementa- tions do not accoun t for complex designs. In this work, we prop ose a design-based framew ork for AUC inference. In particular, replicate weigh ts metho ds are used to construct confidence inter- v als and h yp othesis test. The p erformance of replicate w eights metho ds and the traditional non-design-based b o otstrap for this purp ose has b een analized through an extensive sim ulation study . Design-based methods ac hieve cov er- age probabilities close to nominal lev els and appropriate rejection rates under the null h yp othesis. In contrast, the traditional non-design-based b o otstrap metho d tends to underestimate the v ariance, leading to undercov erage and inflated rejection rates. Differences b et ween metho ds decrease as the n umber of selected clusters p er stratum increases. ∗ Corresp onding author: E-mail: amaia.iparragirre@eh u.eus, Address: Departamen to de M ´ eto dos Cuantitativ os. Univ ersidad del Pa ´ ıs V asco UPV/EHU. 1 An application to data from the National Health and Nutrition Exami- nation Surv ey (NHANES) illustrates the practical relev ance of the prop osed framew ork. The metho ds hav e b een incorp orated into the svyROC R pack age. Keyw ords: complex surv ey data, AUC, design-based inference, replicate w eights 1 In tro duction Complex sampling designs are widely implemented in epidemiological and p opulation- based health studies. Notable examples include the National Health and Nutrition Examination Survey (NHANES), the Beha vioral Risk F actor Surv eillance System (BRFSS), the Europ ean Health Interview Survey (EHIS), and the Demographic and Health Surv eys (DHS), all of whic h pro vide critical p opulation-level health data across multiple countries. These surveys t ypically rely on stratification and cluster- ing strategies, often implemented in one or m ultiple stages, to impro v e representa- tiv eness and data collection efficiency in large-scale p opulation studies ( Kaier , 1895 ; Kalton , 1983 ). How ev er, applying those sampling techniques for data collection also in tro duces complexities in the subsequent statistical analysis of the surv ey data, as traditional metho ds, whic h do not account for the survey design, can lead to biased estimates and inv alid inferences ( Lumley and Scott , 2017 ; Skinner et al. , 1989 ). In clinical and epidemiological studies, predictiv e mo dels for binary outcomes are commonly fitted, and their discriminative p erformance is subsequen tly assessed ( Ak- ter et al. , 2025 ; W ang et al. , 2022 ; Zhang et al. , 2017 ). A standard summary measure of this discriminativ e p erformance is the area under the receiver operating character- istic (R OC) curv e (A UC), whic h quan tifies the model’s abilit y to distinguish b et ween individuals with and without the ev ent of interest. Inference for the A UC is well es- tablished under simple random sampling, for which b o otstrap techniques are widely implemen ted ( Liu et al. , 2006 ; Noma et al. , 2021 ; Robin et al. , 2011 ; W u et al. , 2016 ). Ho wev er, traditional implementations do not accoun t for complex sampling schemes. As an alternativ e, in the con text of complex survey data, replicate weigh ts meth- o ds are widely used to generate partially indep enden t samples mimmicking the com- plex sampling structure follow ed to collect the original sample ( Heeringa et al. , 2017 ; Iparragirre et al. , 2023 ; W olter , 2007 ). In a previous w ork, replicate weigh ts metho ds w ere used to estimate the v ariance of an A UC estimator ( Y ao et al. , 2015 ). In this w ork, we go a step further b y prop osing and ev aluating the p erformance of repli- cate w eigh t metho ds for constructing confidence interv als and conducting hypothesis tests. In particular, design-based approac hes such as the Rescaling Bo otstrap and Jac kknife Rep eated Replication hav e b een considered, alongside the con v en tional 2 (non-design-based) b o otstrap. Using these metho ds, we construct confidence inter- v als for the AUC and p erform h yp othesis tests comparing tw o A UCs, considering b oth indep endent comparisons (the same mo del across differen t samples) and paired comparisons (different mo dels within the same sample). The b ehaviour of these approac hes is assessed through an extensiv e sim ulation study . The rest of the pap er is organized as follo ws. In Section 2 , we presen t the pro- p osed metho dology for A UC estimation and the construction of confidence in terv als and hypothesis tests under complex sampling designs. Section 3 describ es an exten- siv e simulation study ev aluating the p erformance of the prop osed approac hes under v arious scenarios (additional scenarios and results are pro vided as Supplementary Material). Section 4 presents an application of the proposed metho dology to data from the NHANES survey . Finally , Section 5 concludes with a discussion and prac- tical recommendations. 2 Metho ds This section describ es the metho dology prop osed for the design-based inference of the A UC. Specifically , in Section 2.1 , the logistic regression model and the estimation of its co efficients is describ ed along with the A UC estimation of the mo del, in the con text of complex survey data. Section 2.2 describ es the metho ds prop osed in this w ork for v ariance estimation of the weigh ted A UC estimator. Finally , the prop osal to define of confidence interv als and h yp othesis tests is detailed in Section 2.3 . 2.1 Logistic regression and A UC estimation with complex surv ey data Let X X X = (1 , X 1 , . . . , X q ) T denote the v ector of cov ariates, including an intercept, and Y the dichotomous resp onse v ariable (with Y = 1 indicating the ev en t of in terest and Y = 0 the non-ev en t). The finite p opulation of interest, denoted by U , consists of N units with observ ed cov ariates x x x i and resp onse v alues y i , for all i ∈ U . The logistic regression mo del is defined through the lo git transformation as in eq. ( 1 ), l og it [ p ( x x x i )] = ln p ( x x x i ) 1 − p ( x x x i ) = x x x T i β β β , ∀ i ∈ U, (1) where β β β = ( β 0 , β 1 , . . . , β q ) T denotes the vector of regression coefficients and p ( x x x i ) = P ( Y = 1 | x x x i ). The lik eliho o d function in eq. ( 2 ) is maximized to compute the v ector 3 of regression co efficien ts β β β , L ( β β β ) = Y i ∈ U p ( x x x i ) y i [1 − p ( x x x i )] 1 − y i . (2) Let us denote as β β β pop the v ector of p opulation co efficients obtained based on the maximization of the log-likelihoo d, and as p pop i = p pop ( x x x i ) the corresp onding proba- bilities of even t, ∀ i ∈ U . The discrimination abilit y of this p opulation mo del can b e determined as in eq. ( 3 ): AU C pop = 1 N 0 N 1 X i 0 ∈ U Y =0 X i 1 ∈ U Y =1 [ I ( p pop i 0 < p pop i 1 ) + 0 . 5 I ( p pop i 0 = p pop i 1 )] , (3) where U Y =0 and U Y =1 are the subsets of the finite p opulation U formed b y the units without ( Y = 0) and with ( Y = 1) the even t of in terest, resp ectively , N 0 and N 1 denote the num b er of units in U Y =0 and U Y =1 , and I ( · ) is the indicator function. Ho wev er, in practice, the whole finite p opulation will not b e a v ailable for fitting the mo del, and regression co efficients and the corresp onding AUC need to b e esti- mated based on a sample S . Let us supp ose that a sample S is obtained following a complex sampling design, and the corresp onding sampling weigh ts ( w i ) are av ailable ∀ i ∈ S , together with the co v ariates ( x x x i ) and the outcome ( y i ). The pseudo-likelihoo d function in eq. ( 4 ) is commonly used for design-based estimation of β β β under complex sampling ( Binder , 1983 ): P L ( β β β ) = Y i ∈ S p ( x x x i ) y i w i [1 − p ( x x x i )] (1 − y i ) w i . (4) Let us denote as ˆ β β β the v ector of regression co efficien ts estimated based on eq. ( 4 ), and as ˆ p i = ˆ p ( x x x i ) the corresp onding estimated probabilities of even t, ∀ i ∈ S . An AUC estimator that incorp orates the sampling weigh ts ( [ AU C w ) as defined in eq. ( 5 ) has b een prop osed in the literature ( Iparragirre et al. , 2023 ) to estimate the discrimination abilit y of logistic regression models in the con text of complex survey data based on S . Let S Y =0 and S Y =1 b e the subsets of S formed by units without ( Y = 0) and with ( Y = 1) the even t of in terest, resp ectiv ely . Then, [ AU C w = P i 0 ∈ S Y =0 P i 1 ∈ S Y =1 w i 0 w i 1 [ I ( ˆ p i 0 < ˆ p i 1 ) + 0 . 5 I ( ˆ p i 0 = ˆ p i 1 )] P i 0 ∈ S Y =0 P i 1 ∈ S Y =1 w i 0 w i 1 , (5) pro vides a design-consistent p oint estimate of AU C pop . While [ AU C w pro vides a p oint estimate of the p opulation A UC, v alid statistical inference requires appropriate estimation of its v ariability under the complex sam- pling design. 4 2.2 V ariance estimation of the w eigh ted AUC estimator The estimator of the A UC defined in eq. ( 5 ) is a nonlinear function of the estimated probabilities of ev ent and the survey w eights, and its v ariability is affected by the implemen ted complex sampling design. Consequen tly , deriving an analytical expres- sion for its v ariance is not straigh tforward, motiv ating the use of replicate w eights (design-based resampling metho ds) for v ariance estimation and inference ( Heeringa et al. , 2017 ; W olter , 2007 ). In this work, we consider sp ecific forms of Jackknife Re- p eated Replication (Section 2.2.1 ) and Bo otstrap methods (Section 2.2.2 ) to create partially indep endent subsets of the original sample S while preserving the sampling design. These subsets are then used to estimate the v ariance of the A UC. In order to set the notation, let S ( h,j ) ⊂ S denote the j th primary sampling unit (PSU, i.e., units sampled in the first stage of the sampling) from stratum h , ∀ j ∈ { 1 , . . . , a h } and ∀ h ∈ { 1 , . . . , H } , where a h indicates the total num b er of selected PSUs in stratum h . In particular, note that, S = H [ h =1 a h [ j =1 S ( h,j ) . (6) In addition, let S ( h ) = ∪ a h j =1 S ( h,j ) denote the subset of the sample S corresp onding to stratum h, ∀ h ∈ { 1 , . . . , H } , b eing H the total num b er of strata. 2.2.1 Jac kknife Rep eated Replication In the Jac kknife Rep eated Replication metho d ( Heeringa et al. , 2017 ; W olter , 2007 ) (JKn, hereinafter), new sets are created b y systematically leaving out one PSU at a time, so that eac h PSU, S ( h,j ) , is excluded once, ∀ h ∈ { 1 , . . . , H } , ∀ j ∈ { 1 , . . . , a h } . The sampling weigh ts are then adjusted so that the remaining units in each set prop erly represent the entire finite p opulation U . In particular, let us suppose that PSU S ( h,j ) is remov ed from the original set to form the new set. The new set will b e denoted as S − ( h,j ) = S − S ( h,j ) , ∀ h ∈ { 1 , . . . , H } , ∀ j ∈ { 1 , . . . , a h } . Then, the corresp onding replicate w eights are defined as in eq. ( 7 ): w − ( h,j ) i = 0 , if i ∈ S ( h,j ) , w i · a h a h − 1 , if i ∈ S ( h ) but i / ∈ S ( h,j ) , w i , if i / ∈ S ( h ) , ∀ i ∈ S. (7) In this wa y , a total of a = P H h =1 a h new sets are defined. 5 The A UC is computed in each set S − ( h,j ) b y following eq. ( 5 ) and using the replicate w eights defined in eq. ( 7 ), as sho wn in eq. ( 8 ): [ AU C − ( h,j ) w = P i 0 ∈ S − ( h,j ) Y =0 P i 1 ∈ S − ( h,j ) Y =1 w − ( h,j ) i 0 w − ( h,j ) i 1 [ I ( ˆ p i 0 < ˆ p i 1 ) + 0 . 5 I ( ˆ p i 0 = ˆ p i 1 )] P i 0 ∈ S − ( h,j ) Y =0 P i 1 ∈ S − ( h,j ) Y =1 w − ( h,j ) i 0 w − ( h,j ) i 1 . (8) Finally , the v ariance of [ AU C w is estimated using eq. ( 9 ) ( W olter , 2007 ; Y ao et al. , 2015 ): d v ar J K n ( [ AU C w ) = H X h =1 a h − 1 a h a h X j =1 ( [ AU C − ( h,j ) w − [ AU C w ) 2 . (9) 2.2.2 Bo otstrap Based on b o otstrap metho ds, v ariance is estimated by generating B resamples of the original sample ( S ( b ) , ∀ b ∈ { 1 , . . . , B } ) drawn with replacemen t. In this work, we consider three v ariants of the b o otstrap: tw o design-based versions of the Rescaling Bo otstrap that account for the surv ey design when generating the resamples, and the traditional (non-design-based) b o otstrap. These approac hes are describ ed in detail b elo w. In the Rescaling Bo otstrap ( Rao and W u , 1988 ) (RB, hereinafter), the resampling is p erformed b y randomly selecting a h − 1 PSUs with replacement from eac h stratum h , ∀ h ∈ { 1 , . . . , H } , to generate each b o otstrap sample S RB ( b ) , b ∈ { 1 , . . . , B } . The sampling w eights are then recalculated as indicated in eq. ( 10 ): w RB ( b ) i = w i · a h a h − 1 · k ( b ) ( h,j ) , ∀ i ∈ S ( h,j ) , ∀ h ∈ { 1 , . . . , H } , ∀ j ∈ { 1 , . . . , a h } . (10) where k ( b ) ( h,j ) denotes the num b er of times PSU S ( h,j ) is selected to form the resample S RB ( b ) (note that k ( b ) ( h,j ) ≥ 0, and k ( b ) ( h,j ) = 0 if the PSU is not selected in that resample). Similarly , another b o otstrap v arian t (RBn, hereinafter) selects a h PSUs from eac h stratum ( Can ty and Da vison , 1999 ) h ∈ { 1 , . . . , H } , rather than a h − 1 as in RB. In this case, the replicate weigh ts corresponding to the resample S RB n ( b ) , ∀ b ∈ { 1 , . . . , B } are recalculated as in eq. ( 11 ): w RB n ( b ) i = w i · k ( b ) ( h,j ) , ∀ i ∈ S ( h,j ) , ∀ h ∈ { 1 , . . . , H } , ∀ j ∈ { 1 , . . . , a h } . (11) In addition to the design-based methods, we consider the traditional b o otstrap ( Efron , 1979 ; Robin et al. , 2011 ) (trB), whic h do es not account for the complex 6 sampling design during resampling. In this approach, n units are randomly sampled with replacement from S to form each b o otstrap sample S trB ( b ) , ignoring the stra- tum and/or the cluster to whic h each unit b elongs. T o main tain consistency with the notation used in RB and RBn, the sampling weigh ts considered in S trB ( b ) are expressed as in eq. ( 12 ), w trB ( b ) i = w i · k ( b ) i , ∀ i ∈ S. (12) where k ( b ) i indicates the n umber of times that unit i ∈ S is selected in b o otstrap resample S trB ( b ) , ∀ b ∈ { 1 , . . . , B } . In an y of the b o otstrap metho ds defined ab ov e (denoted generically as boot ∈ { RB , RB n, trB } for ease of notation), the AUC of the model is computed in eac h re- sample S boot ( b ) , as defined in eq. ( 13 ), ∀ boot ∈ { R B , RB n, tr B } and ∀ b ∈ { 1 , . . . , B } : [ AU C boot ( b ) w = P i 0 ∈ S boot ( b ) Y =0 P i 1 ∈ S boot ( b ) Y =1 w boot ( b ) i 0 w boot ( b ) i 1 [ I ( ˆ p i 0 < ˆ p i 1 ) + 0 . 5 I ( ˆ p i 0 = ˆ p i 1 )] P i 0 ∈ S boot ( b ) Y =0 P i 1 ∈ S boot ( b ) Y =1 w boot ( b ) i 0 w boot ( b ) i 1 , (13) where S boot ( b ) Y =0 and S boot ( b ) Y =1 are the subset of S boot ( b ) formed by the units without and with the even t of in terest, resp ectiv ely . The v ariance of [ AU C w is then estimated as in eq. ( 14 ) ( W olter , 2007 ), ∀ boot ∈ { RB , RB n, trB } : d v ar boot ( [ AU C w ) = 1 B − 1 B X b =1 [ AU C boot ( b ) w − [ AU C boot ( b ) w 2 , (14) where, [ AU C boot ( b ) w = 1 B B X b =1 [ AU C boot ( b ) w . (15) 2.3 Confidence in terv als and h yp othesis testing In this section, the construction of confidence interv als and hypothesis tests is defined. In particular, the definition of confidence in terv als (CIs) is provided in Section 2.3.1 and the h yp othesis tests are detailed in Section 2.3.2 . W e denote the confidence level b y 1 − α (i.e., 100 · (1 − α )% CIs) and the significance lev el for hypothesis tests by α . 7 2.3.1 Confidence interv als for the A UC This section describ es the construction of confidence in terv als for the AUC using the JKn and b o otstrap (RB, RBn, and trB) metho ds. • JKn: F or the JKn metho d, the confidence in terv als are defined as sho wn in eq. ( 16 ): I 1 − α AU C, J K n = [ AU C w ± z α/ 2 q d v ar J K n ( [ AU C w ) , (16) where d v ar J K n ( [ AU C w ) is given in eq. ( 9 ), [ AU C w is the p oin t estimate defined in eq. ( 5 ), and z α/ 2 denotes the upper α/ 2 critical v alue of the standard normal distribution, i.e., the v alue suc h that P ( Z ≥ z α/ 2 ) = α/ 2 for Z ∼ N (0 , 1). • Bo otstrap (RB, RBn, trB): Similarly , for an y of the b o otstrap metho ds ( ∀ boot ∈ { RB , RB n, trB } ), the confidence interv als can be defined as sho wn in eq. ( 17 ): I 1 − α AU C, boot = [ AU C w ± z α/ 2 q d v ar boot ( [ AU C w ) , (17) where d v ar boot ( [ AU C w ) is giv en in eq. ( 14 ), [ AU C w is the p oin t estimate de- fined in eq. ( 5 ), and z α/ 2 denotes the upp er α / 2 critical v alue of the stan- dard normal distribution as indicated ab ov e. Another widely implemented w ay to define confidence in terv als for an y of the b o otstrap metho ds ( ∀ boot ∈ { RB , RB n, trB } ), is using the quantiles of the empirical distribution of the b o otstrap A UC estimates ( Efron , 1981 ; Robin et al. , 2011 ) as sho wn in eq. ( 18 ), I 1 − α AU C, boot = θ α/ 2 , θ 1 − α/ 2 , (18) where θ α/ 2 and θ 1 − α/ 2 denote the α / 2 and 1 − α/ 2 quan tiles of the empirical distribution of the B b o otstrap A UC estimates defined in eq. ( 13 ). 2.3.2 Hyp othesis T esting for the comparison of t w o A UCs Let AU C pop (1) and AU C pop (2) denote t wo population AUCs, and define their difference as in eq. ( 19 ): D pop = AU C pop (1) − AU C pop (2) . (19) The h yp othesis test of interest is giv en in eq. ( 20 ): H 0 : D pop = 0 , H 1 : D pop = 0 . (20) 8 Let [ AU C w (1) and [ AU C w (2) b e the corresp onding p oin t estimates of the p opulation A UCs computed as in eq. ( 5 ). The estimator of D pop is defined in eq. ( 21 ), b D = [ AU C w (1) − [ AU C w (2) . (21) T o test the nul l h yp othesis, w e consider the W ald-type statistic defined in eq. ( 22 ): Z = b D − D pop q d v ar ( b D ) , (22) whic h, under the n ull h yp othesis, is assumed to b e asymptotically standard normal N (0 , 1) (note also that under H 0 , D pop = 0). Ho wev er, the v ariance estimation of b D dep ends on whether the t w o AUCs are indep enden t or paired. In addition, as detailed ab o ve, the v ariance can b e estimated b y means of an y of the metho ds previously describ ed ( ∀ m ∈ { J K n, R B , RB n, tr B } ). This pro cess, for all the metho ds m considered, is described below, for indep enden t A UCs in eq. ( 24 ) and for paired A UCs in eq. ( 29 ). Let z m denote the v alue of the test statistic obtained based on metho d m , ∀ m ∈ { J K n, RB , R B n, tr B } , for the comparison of either indep endent or paired A UCs. Once z m is computed, the corresp onding tw o-sided p-v alue is obtained as in eq. ( 23 ): p = 2 P ( Z > | z m | ) , Z ∼ N (0 , 1) . (23) The n ull hypothesis is rejected at significance lev el α if p < α . Belo w, we detail the pro cess for computing the test statistic for the comparison of b oth indep enden t and paired AUCs. (a) Statistic v alue ( z m ) for t wo indep enden t A UCs Let S (1) and S (2) b e t wo indep enden t samples. A mo del is fitted separately to eac h sample follo wing eq. ( 4 ), yielding the estimated co efficient vectors ˆ β β β (1) and ˆ β β β (2) , and the corresp onding AUC estimates [ AU C w (1) and [ AU C w (2) , computed as in eq. ( 5 ). Since the t w o samples are indep endent, the co v ariance betw een the tw o A UC esti- mators is null. Consequently , for an y metho d m ∈ { J K n, R B , RB n, tr B } , the test statistic is computed as in eq. ( 24 ): z m = b D q d v ar m ( b D ) = b D q d v ar m ( [ AU C w (1) ) + d v ar m ( [ AU C w (2) ) , (24) 9 where, the d v ar m ( [ AU C w (1) ) and d v ar m ( [ AU C w (2) ) are computed using the metho ds describ ed in eq. ( 9 ) for m = J K n and in eq. ( 14 ) for the b o otstrap approaches, ∀ m ∈ { RB , RB n, trB } . (b) Statistic v alue ( z m ) for t wo paired A UCs Let S b e a sample with observ ations on the resp onse v ariable Y and cov ariates X X X . Let X X X (1) and X X X (2) b e t wo subsets of X X X used to fit tw o differen t mo dels, for which co efficien ts ˆ β β β (1) and ˆ β β β (2) are estimated, yielding estimated probabilities ˆ p (1) i and ˆ p (2) i , ∀ i ∈ S , and corresp onding w eigh ted AUCs, [ AU C w (1) and [ AU C w (2) , following eq. ( 5 ). Since b oth AUCs are estimated from the same sample, they are correlated. There- fore, the v ariance of b D is estimated by computing AUC differences across replicates and assessing their v ariability , as detailed b elow. • JKn: F or eac h replicate set S − ( h,j ) describ ed in Section 2.2.1 , A UCs [ AU C − ( h,j ) w (1) and [ AU C − ( h,j ) w (2) are computed from the corresp onding probabilities. The differ- ence for each replicate is given in eq. ( 25 ): b D − ( h,j ) = [ AU C − ( h,j ) w (1) − [ AU C − ( h,j ) w (2) , ∀ h ∈ { 1 , . . . , H } , ∀ j ∈ { 1 , . . . , a h } . (25) The v ariance of b D is then estimated as in eq. ( 26 ): d v ar J K n ( b D ) = H X h =1 a h − 1 a h a h X j =1 ( b D − ( h,j ) − b D ) 2 . (26) • Bo otstrap (RB, RBn, trB): F or eac h resample S boot ( b ) describ ed in Section 2.2.2 , A UCs [ AU C boot ( b ) w (1) and [ AU C boot ( b ) w (2) are computed ∀ boot ∈ { RB , R B n, tr B } , and their difference is calculated as in eq. ( 27 ): b D boot ( b ) = [ AU C boot ( b ) w (1) − [ AU C boot ( b ) w (2) , ∀ b ∈ { 1 , . . . , B } . (27) The v ariance of b D is estimated as in eq. ( 28 ): d v ar boot ( b D ) = 1 B − 1 B X b =1 ( b D boot ( b ) − b D boot ( b ) ) 2 , where b D boot ( b ) = 1 B B X b =1 b D boot ( b ) . (28) 10 Finally , the test statistic for eac h metho d is calculated as in eq. ( 29 ): z m = b D q d v ar m ( b D ) , ∀ m ∈ { J K n, RB , RB n, tr B } , (29) where d v ar m ( b D ) is calculated as in eq. ( 26 ) for m = J K n and as in eq. ( 28 ), ∀ m ∈ { RB , RB n, trB } . 3 Sim ulation study An extensive simulation study has b een conducted to ev aluate the p erformance of the JKn and the different b o otstrap metho ds for the construction of confidence in terv als and hypothesis testing for the AUC in the context of complex survey data. Section 3.1 describ es the data generation pro cess and the considered scenarios. Section 3.2 summarizes the main results. Finally , in Section 3.3 further scenarios for a broader comparison of paired AUCs are analyzed and discussed. 3.1 Data generation and scenarios This section describ es the data generation pro cess follow ed in the simulation study and the considered scenarios. Dep ending on whether the ob jectiv e is to define a con- fidence in terv al or to conduct a hypothesis test for the comparison o f t w o indep enden t or paired A UCs, differen t n umbers of p opulations are generated and different types of mo dels are fitted. In all cases, the generated p opulations are subsequently sampled according to a complex sampling design. Below, we describ e b oth the p opulation generation pro cess under the differen t scenarios in Section 3.1.1 and the sampling design used to obtain the samples in Section 3.1.2 . 3.1.1 Finite p opulation generation The finite populations w ere generated as follo ws. A probability of even t or prev alence of P ( Y = 1) = 0 . 5 w as predefined. Each p opulation consists of N = 100 000 units, with information on cov ariates ( X X X , 4 v ariables) and design v ariables ( Z Z Z , 6 v ariables), generated conditionally on Y from a m ultiv ariate normal distribution as in eq. ( 30 ) (for ease of notation, let X X X ∗ denote the combined vector of cov ariates and design v ariables, i.e., X X X ∗ = ( X X X , Z Z Z )): X X X ∗ | Y = 0 ∼ N ( µ µ µ Y =0 , Σ Y =0 ) , and X X X ∗ | Y = 1 ∼ N ( µ µ µ Y =1 , Σ Y =1 ) . (30) 11 The v ariance-cov ariance matrices w ere defined as in eq. ( 31 ), Σ Y =0 = Σ Y =1 = (1 − γ ) · I 10 × 10 + γ · J 10 × 10 , (31) where γ = 0 . 15, I 10 × 10 is the 10 × 10 iden tity matrix, and J 10 × 10 is a matrix of ones of the same dimension. The mean vector for the non-even t group µ µ µ Y =0 w as set to zero, whereas µ µ µ Y =1 v aries across scenarios as detailed in T able 1 . Under the assumptions indicated ab o ve, the logistic regression mo del is correctly sp ecified and the v ector of regression coefficients β β β ∗ = ( β β β X , β β β Z ) is kno wn ( Iparragirre et al. , 2019 ). The finite p opulation w as then generated according to the follo wing steps: P1 F or i = 1 , . . . , N/ 2 generate x x x ∗ i ∼ N ( µ µ µ Y =0 , Σ Y =0 ) and for i = N / 2 + 1 , . . . , N x x x ∗ i ∼ N ( µ µ µ Y =1 , Σ Y =1 ). P2 Compute the probability of ev en t p ( x x x ∗ i ) for each unit using β β β ∗ . P3 Generate the binary resp onse y i ∼ Bernoulli[ p ( x x x ∗ i )], independently for each unit. P4 Define the survey design in the p opulation: (a) The co efficien ts asso ciated with the design v ariables, β β β Z , were deriv ed from the full co efficient vector β β β ∗ . (b) Sort the data by z z z i β β β Z for all i = 1 , . . . , N . (c) Define H = 5 strata by partitioning the p opulation in to equal-sized sets. (d) Within eac h stratum h , define A h = 20 clusters of equal size, yielding a total of A = 100 clusters with N h,j ∗ = 1 000 units p er cluster, for h = 1 , . . . , H and j ∗ = 1 , . . . , A h . After generating the finite p opulation U , the mo del w as fitted follo wing eq. ( 2 ) to the whole p opulation using only the co v ariates X X X (excluding the design v ariables Z Z Z ). The resulting AUC was computed follo wing eq. ( 3 ) and tak en as the finite p opulation A UC, denoted by AU C pop in T able 1 . F or eac h simulation scenario, a different num b er of finite p opulations and fitted mo dels w ere considered dep ending on the inferential ob jectiv e. Sp ecifically , one p op- ulation and one mo del w ere used for confidence interv al estimation; tw o p opulations and one mo del for h yp othesis testing of indep enden t A UCs; and one p opulation with t wo different mo dels for paired AUC comparisons. These settings, together with the corresp onding p opulation A UC v alues, are summarized in T able 1 . 12 T able 1: Summary of the scenarios considered in the simulation study . F or each scenario, the t yp e of analysis (confidence in terv al, CI; h yp othesis test, HT), the num b er of finite p opulations generated, the mean vector µ µ µ T Y =1 of the co v ariates for units with Y = 1, the co v ariates considered in the mo del, and the corresp onding p opulation A UC are rep orted. Scenario Con trast Population µ µ µ T Y =1 Co v ariates AU C pop 1 CI (1) (0 . 7 , 0 . 7 , 0 . 7 , 0 . 7 , 0 . 7 , 0 . 7 , 0 . 7 , 0 . 7 , 0 . 7 , 0 . 7) X 1 , X 2 , X 3 , X 4 0.7951 2 HT (1) (0 . 7 , 0 . 7 , 0 . 7 , 0 . 7 , 0 . 7 , 0 . 7 , 0 . 7 , 0 . 7 , 0 . 7 , 0 . 7) X 1 , X 2 , X 3 , X 4 0.7951 indep enden t ∗ (2) (0 . 7 , 0 . 7 , 0 . 7 , 0 . 7 , 0 . 7 , 0 . 7 , 0 . 7 , 0 . 7 , 0 . 7 , 0 . 7) X 1 , X 2 , X 3 , X 4 0.7941 3 HT (1) (0 . 7 , 0 . 7 , 0 . 7 , 0 . 7 , 0 . 7 , 0 . 7 , 0 . 7 , 0 . 7 , 0 . 7 , 0 . 7) X 1 , X 2 , X 3 , X 4 0.7951 indep enden t (2) (0 . 7 , 0 . 7 , 0 . 7 , 1 . 2 , 0 . 7 , 0 . 7 , 0 . 7 , 0 . 7 , 0 . 7 , 0 . 7) X 1 , X 2 , X 3 , X 4 0.8474 4 HT (1) (0 . 7 , 0 . 7 , 0 . 7 , 0 . 7 , 0 . 7 , 0 . 7 , 0 . 7 , 0 . 7 , 0 . 7 , 0 . 7) X 1 , X 2 , X 3 0.7755 paired X 1 , X 2 , X 4 0.7743 5 HT (1) (0 . 7 , 0 . 7 , 0 . 9 , 1 . 1 , 0 . 7 , 0 . 7 , 0 . 7 , 0 . 7 , 0 . 7 , 0 . 7) X 1 , X 2 , X 3 0.7991 paired X 1 , X 2 , X 4 0.8237 ∗ Differen t seeds hav e b een used to generate tw o different finite p opulations. 13 3.1.2 Sampling design and weigh ts The sampling of the generated finite p opulations w as carried out follo wing a tw o- stage stratified cluster sampling design: in the first stage, a h clusters w ere selected from each stratum h ∈ { 1 , . . . , H } , and in the second stage, n h,j units were sampled within eac h selected cluster j ∈ { 1 , . . . , a h } . Tw o different sample sizes were considered, and four differen t n umbers of clusters p er stratum w ere ev aluated. This allow ed us to study the effect of increasing the sample size as well as the effect of increasing the num b er of clusters while keeping the total sample size approximately constan t. T able 2 summarizes the n umber of clusters selected p er stratum ( a h ∈ { 2 , 4 , 8 , 10 } ) and the corresp onding num b er of sampled units in eac h scenario. In particular, the smallest sample sizes ( n 1 ) resulted in 1 680–1 740 units, while the second setting doubled these sizes ( n 2 ). Sampling w eights for eac h unit w ere calculated according to the standard form ula for t wo-stage stratified cluster designs, as sho wn in eq. ( 32 ): w i = A h a h · N h,j n h,j , ∀ i ∈ S ( h,j ) , ∀ h ∈ { 1 , . . . , H } , ∀ j ∈ { 1 , . . . , a h } . (32) In each scenario, eac h finite p opulation was sampled R times according to the complex sampling design described ab ov e. F or ev ery sample S r , ∀ r = 1 , . . . , R , the corresp onding mo del or mo dels (dep ending on the scenario, as indicated in T able 1 ) w ere fitted to the sampled data by maximizing the pseudo-lik eliho o d function in eq. ( 4 ), the estimated co efficien ts ˆ β β β r w ere obtained and the corresp onding [ AU C r w v alues w ere obtained following eq. ( 5 ). Subsequen tly , the v ariance estimators de- scrib ed in Section 2.2 w ere applied to construct confidence in terv als for the A UC or to compute the test statistic v alue for hypothesis testing as indicated in Section 2.3 , dep ending on the analysis considered. A graphical summary of this sim ulation pro- cess is pro vided in Figure 1 (confidence interv als) and Figure 2 (h yp othesis tests). It should b e noted that, in Scenario 2, t wo p opulations w ere generated (as indicated in T able 1 ) to ensure consistency across all scenarios inv olving the comparison of indep enden t AUCs. Ho wev er, in this particular case, an equiv alent setup could b e obtained by generating a single p opulation and dra wing t wo indep endent samples from it. The sim ulation study was based on R = 500 runs, with B = 1 000 b o otstrap replicates implemented within eac h run and significance levels α ∈ { 0 . 01 , 0 . 05 , 0 . 1 } considered for b oth confidence interv al construction and hypothesis testing. Confi- dence in terv al performance was ev aluated through estimated cov erage probabilities, defined as the prop ortion of simulation runs in whic h the p opulation AUC ( AU C pop ) 14 w as contained within the estimated in terv al as shown in eq. ( 33 ): c 1 − α m = 1 R R X r =1 I ( AU C pop ∈ I 1 − α,r AU C,m ) , ∀ m ∈ { J K n, RB , RB n, tr B } . (33) F or h yp othesis testing, p erformance wa s assessed through rejection rates, computed as the prop ortion of runs in which the null h yp othesis w as rejected at level α as defined in eq. ( 34 ): r r α m = 1 R R X r =1 I ( p r m < α ) , ∀ m ∈ { J K n, RB , R B n, tr B } , (34) where p r m indicates the p-v alue corresp onding to the statistic v alue z r m ∀ r ∈ { 1 , . . . , R } , calculated as in eq. ( 23 ). Figure 1: Graphical summary of the sim ulation set-up for confidence interv als. 15 Figure 2: Graphical summary of the sim ulation set-up for hypothesis tests. The left figure illustrates the pro cess follo w ed for the comparison of tw o indep endent AUCs, while the right figure depicts the paired A UC comparison. 16 T able 2: Summary of the sampling sc hemes used in the sim ulation study . F or each num b er of clusters p er stratum a h ∈ { 2 , 4 , 8 , 10 } , the num b er of units sampled within eac h cluster ( ∀ j ∈ { 1 , . . . , a h } ) is rep orted for the t wo different o v erall sample sizes considered. a h Sample size ( n 1 ) Sample size ( n 2 ) 2 n (1) 1 ,j = 300; n (1) 2 ,j = 100; n (1) 3 ,j = 50; n (1) 4 ,j = 100; n (1) 5 ,j = 300 n (2) 1 ,j = 600; n (2) 2 ,j = 200; n (2) 3 ,j = 100; n (2) 4 ,j = 200; n (2) 5 ,j = 600 4 n (1) 1 ,j = 150; n (1) 2 ,j = 50; n (1) 3 ,j = 25; n (1) 4 ,j = 50; n (1) 5 ,j = 150 n (2) 1 ,j = 300; n (2) 2 ,j = 100; n (2) 3 ,j = 50; n (2) 4 ,j = 100; n (2) 5 ,j = 300 8 n (1) 1 ,j = 75; n (1) 2 ,j = 25; n (1) 3 ,j = 10; n (1) 4 ,j = 25; n (1) 5 ,j = 75 n (2) 1 ,j = 150; n (2) 2 ,j = 50; n (2) 3 ,j = 20; n (2) 4 ,j = 50; n (2) 5 ,j = 150 10 n (1) 1 ,j = 60; n (1) 2 ,j = 20; n (1) 3 ,j = 10; n (1) 4 ,j = 20; n (1) 5 ,j = 60 n (2) 1 ,j = 120; n (2) 2 ,j = 40; n (2) 3 ,j = 20; n (2) 4 ,j = 40; n (2) 5 ,j = 120 17 3.2 Results Figures 3 – 9 presen t a summary of the results of the simulation study for all the meth- o ds and scenarios under consideration. F or each scenario described in T able 1 , the plots displa y the cov erage probabilities of the confidence in terv als (eq. ( 33 ), Figure 3 ) and the rejection rates of the t wo-sided hypothesis tests (eq. ( 34 ), Figures 5 , 6 , 7 , and 8 ). Results are rep orted for significance lev els α ∈ { 0 . 01 , 0 . 05 , 0 . 1 } (confidence lev els 99%, 95%, and 90%, resp ectively), for different n umbers of clusters selected p er stratum ( a h ∈ { 2 , 4 , 8 , 10 } ) and for t wo distinct total sample sizes ( n 1 and n 2 ) as indicated in T able 2 . Additionally , the estimated densit y functions of the square ro ot of the v ariance estimators (i.e., the estimated standard errors) obtained with eac h metho d in Scenarios 1 and 4 are sho wn in Figures 4 and 9 , allo wing a direct com- parison of the distributional b eha viour of the metho ds for v ariance estimation across sampling settings (to av oid redundancy and for space considerations, estimated stan- dard errors corresp onding to Scenarios 2, 3 and 5 are presented as Supplemen tary Information). T o main tain consistency across the implemen ted metho ds, confidence in terv als were constructed using the normal approximation as in eq. ( 17 ). How ev er, results obtained using the percentile b o otstrap metho d in eq. ( 18 ) are provided as Supplemen tary Material. Giv en the large num b er of results, we first summarize the main findings and then examine eac h scenario in greater detail. Overall, JKn and RB provide consistently satisfactory (and almost iden tical) results across all considered scenarios, b oth in terms of co v erage probabilities and rejection rates with results close to nominal levels. Although RBn accounts for the sampling design, its p erformance is not appropriate, in particular, when only a small n um b er of clusters p er stratum are selected, with lo wer estimated standard errors leading to lo w er co verage probabilities and inflated rejection rates. The behaviour of trB v aries depending on the scenario, but in general terms, it do es not ensure reliable results across differen t scenarios except in the setting of the comparison of t w o paired AUCs. In the follo wing lines, results are discussed for each scenario, jointly examining the cov erage probabilities and rejection rates along with the distributional b ehaviour of the corresp onding v ariance estimators. In Scenario 1, the JKn and RB metho ds ac hieve the closest co verage probabili- ties to the nominal lev els (Figure 3 ). Below them, RBn co v erage lies b et w een the higher-p erforming JKn and RB metho ds, and the low er-p erforming trB metho d. All metho ds get closer to the nominal lev els and con v erge tow ard similar results as the n umber of clusters selected p er stratum a h increases. Regarding the total sample size, JKn, RB, and RBn slightly improv e their p erformance with larger samples, whereas trB p erforms worse as the sample size increases. These patterns are also reflected in the distributions of the estimated standard errors sho wn in Figure 4 . 18 The trB method pro duces the smallest v ariance estimates (ev en smaller for larger sample sizes) leading to narrow er confidence in terv als and lo wer cov erage, follo w ed b y RBn, and with RB and JKn yielding almost iden tical distributions with the largest estimated v ariances. Increasing the n umber of clusters p er stratum reduces the dif- ferences b etw een the metho ds, leading to more similar distributions of the estimated standard errors across approaches. In Scenario 2, the p erformance of the metho ds in h yp othesis testing for the com- parison of indep endent A UCs is ev aluated. Although the p oint estimates of the p opulation AUCs differ sligh tly as sho wn in T able 1 (0.7951 vs. 0.7941), this v aria- tion arises solely from the random generation of the p opulations using differen t seeds. All other parameters and co v ariate distributions were held constan t (see T able 1 ), ensuring that the underlying discriminativ e ability of the mo dels is effectiv ely iden- tical. Th us, in this scenario we assume that the null h yp othesis is effectiv ely true. Ov erall, the conclusions are similar to those seen for the confidence in terv als, b oth in terms of rejection rate (Figure 5 ) and in the distributional b eha viour of the esti- mated standard errors (Figure S2 presen ted as Supplementary Material). Under the assumption that the n ull h yp othesis is satisfied, the rejection rates of the t wo-sided h yp othesis tests are exp ected to b e close to the nominal significance lev els. This is indeed observ ed for the JKn and RB metho ds, whic h pro duce rejection rates very close to the nominal α v alues. In contrast, rejection rates corresp onding to RBn and trB tend to exceed the nominal levels, particularly for smaller n um b ers of clusters p er stratum, and, in the case of trB, also for larger sample sizes, as noted previously in Scenario 1 for confidence interv als. In Scenario 3, w e analyze the p erformance of the metho ds for hypothesis testing of indep enden t A UCs when the p opulation AUCs are considerably different (0.7951 vs. 0.8474), so that the n ull h yp othesis do es not hold. In this setting, the rejection rate reflects the statistical p o wer of the test, i.e., its abilit y to correctly reject the n ull hypothesis (Figure 6 ). As exp ected from previous observ ations, the highest p o w er is achiev ed with trB and RBn, whic h tend to pro duce smaller standard error estimates leading to higher rejection rates. F or all metho ds, an increase in the total sample size leads to a substantial gain in p o wer. Additionally , selecting a larger n umber of clusters p er stratum also improv es the p ow er of the test, particularly for the design-based RB and JKn metho ds. T o analyze the effect of increasing the difference betw een the p opulation A UCs, an additional scenario has been included as Supplemen tary Information, sho wing that the statistical p ow er of the test increases accordingly (see Scenario 8 in Section S3 and Figure S6 provided as Supplemen tary Information). In Scenario 4, regarding the p erformance of the metho ds on h yp othesis testing for 19 the comparison of t wo paired A UCs, w e can assume that the null hypothesis holds and the minor differences in the finite p opulation A UCs are negligible (0.7755 vs. 0.7743), as the co v ariates included in b oth mo dels were generated to yield identical discriminativ e abilit y (see T able 1 ). In this case, the results differ slightly from those observ ed in previous scenarios. The trB metho d is the one that comes closest to the nominal significance lev els, with v alues nearer than those obtained with RB and JKn (see Figure 7 ). RBn is the metho d that differs the most from the nominal v alues with considerably higher rejection rates. The standard error estimates obtained with the replicate w eight metho ds (JKn, RB and RBn) are generally smaller than those obtained by trB, particularly when a small num b er of clusters p er stratum are selected (see Figure 9 ). As the n umber of clusters p er stratum increases, all metho ds tend to b eha ve very similarly , as also observed in previous scenarios. In Scenario 5, the p erformance of the metho ds is ev aluated for hypothesis testing for the comparison of t wo paired A UCs. In this scenario, the p opulation AUCs differ (0.7991 vs. 0.8237), so the null h yp othesis do es not hold. Similar to Scenario 4, the smallest standard errors estimated with RBn, making this metho d the one with the highest p ow er (Figure 8 ). F or JKn, RB, and trB, the observ ed p ow er is v ery similar across metho ds. Increasing the sample size substan tially improv es the p ow er of the tests for all metho ds, whereas in this scenario no noticeable improv emen t in p ow er is observ ed with an increasing n umber of clusters p er stratum. As also observ ed in the comparison of indep enden t AUCs, statistical p ow er increases with larger differences in p opulation A UCs (see Supplementary Information). In summary , Scenarios 4 and 5, corresp onding to the comparison of paired AUCs, are the only settings in whic h trB has sho wn go o d performance, outp erforming the replicate-w eight metho ds. T o examine whether this b ehaviour is alw ays observ ed when comparing paired AUCs or whether it is sp ecific to the data-generating setting considered, w e designed an additional scenario, whic h is describ ed in Section 3.3 . 3.3 Extended scenarios for the comparison of t w o paired A UCs In this section, w e presen t another setting for the comparison of t wo paried AUCs. The idea b ehind this additional scenario is the following. In previous scenarios, v ariables X 3 and X 4 w ere generated with the same v ariance–cov ariance structure with resp ect to the remaining v ariables (see eq. ( 31 )). As a consequence, including X 3 in one mo del and X 4 in the other in Scenarios 4 and 5 introduces essentially the same design-effect in b oth A UC estimates. When computing the difference b et ween the paired AUCs, this common design-effect ma y b e canceled. This could explain 20 2 4 6 8 10 0.6 0.7 0.8 0.9 1.0 Scenario 1 (CI) − alpha = 0.01 ah Coverage JKn RB RBn trB n1 n2 2 4 6 8 10 0.6 0.7 0.8 0.9 1.0 Scenario 1 (CI) − alpha = 0.05 ah Coverage JKn RB RBn trB n1 n2 2 4 6 8 10 0.6 0.7 0.8 0.9 1.0 Scenario 1 (CI) − alpha = 0.1 ah Coverage JKn RB RBn trB n1 n2 Figure 3: Scenario 1 (confidence interv als). Co verage probabilities for nominal significance levels α ∈ { 0 . 01 , 0 . 05 , 0 . 1 } (from left to right). Results are shown for differen t num b ers of clusters selected p er stratum ( a h ∈ { 2 , 4 , 8 , 10 } ) and for tw o total sample sizes ( n 1 and n 2 ). The gra y horizontal line represen ts the nominal co verage level (1 − α ). 0 300 600 900 0.00 0.01 0.02 0.03 0.04 se density JKn RB RBn trB Scenario 1 ; ah = 2 ; n = n1 0 300 600 900 0.00 0.01 0.02 0.03 0.04 se density JKn RB RBn trB Scenario 1 ; ah = 4 ; n = n1 0 300 600 900 0.00 0.01 0.02 0.03 0.04 se density JKn RB RBn trB Scenario 1 ; ah = 8 ; n = n1 0 300 600 900 0.00 0.01 0.02 0.03 0.04 se density JKn RB RBn trB Scenario 1 ; ah = 10 ; n = n1 0 300 600 900 0.00 0.01 0.02 0.03 0.04 se density JKn RB RBn trB Scenario 1 ; ah = 2 ; n = n2 0 300 600 900 0.00 0.01 0.02 0.03 0.04 se density JKn RB RBn trB Scenario 1 ; ah = 4 ; n = n2 0 300 600 900 0.00 0.01 0.02 0.03 0.04 se density JKn RB RBn trB Scenario 1 ; ah = 8 ; n = n2 0 300 600 900 0.00 0.01 0.02 0.03 0.04 se density JKn RB RBn trB Scenario 1 ; ah = 10 ; n = n2 Figure 4: Scenario 1 (confidence in terv als). Estimated densit y functions of the standard errors for all metho ds. Columns corresp ond to differen t num b ers of clusters selected p er stratum ( a h ∈ { 2 , 4 , 8 , 10 } , from left to right), and ro ws corresp ond to the tw o total sample sizes considered ( n 1 top, n 2 b ottom). 21 2 4 6 8 10 0.0 0.1 0.2 0.3 0.4 0.5 Scenario 2 (HT independent) − alpha = 0.01 ah Rejection rate JKn RB RBn trB n1 n2 2 4 6 8 10 0.0 0.1 0.2 0.3 0.4 0.5 Scenario 2 (HT independent) − alpha = 0.05 ah Rejection rate JKn RB RBn trB n1 n2 2 4 6 8 10 0.0 0.1 0.2 0.3 0.4 0.5 Scenario 2 (HT independent) − alpha = 0.1 ah Rejection rate JKn RB RBn trB n1 n2 Figure 5: Scenario 2 (h yp othesis test for indep enden t AUCs under H 0 ). Rejection rates for nominal signif- icance levels α ∈ { 0 . 01 , 0 . 05 , 0 . 1 } (from left to right, indicated with the gra y horizon tal line). Results are sho wn for differen t num b ers of clusters selected p er stratum ( a h ∈ { 2 , 4 , 8 , 10 } ) and for t wo total sample sizes ( n 1 and n 2 ). 2 4 6 8 10 0.0 0.2 0.4 0.6 0.8 1.0 Scenario 3 (HT independent) − alpha = 0.01 ah Rejection rate JKn RB RBn trB n1 n2 2 4 6 8 10 0.0 0.2 0.4 0.6 0.8 1.0 Scenario 3 (HT independent) − alpha = 0.05 ah Rejection rate JKn RB RBn trB n1 n2 2 4 6 8 10 0.0 0.2 0.4 0.6 0.8 1.0 Scenario 3 (HT independent) − alpha = 0.1 ah Rejection rate JKn RB RBn trB n1 n2 Figure 6: Scenario 3 (h yp othesis test for indep enden t AUCs under H 1 ). Rejection rates for nominal signif- icance levels α ∈ { 0 . 01 , 0 . 05 , 0 . 1 } (from left to righ t). Results are shown for differen t n um b ers of clusters selected p er stratum ( a h ∈ { 2 , 4 , 8 , 10 } ) and for tw o total sample sizes ( n 1 and n 2 ). 22 2 4 6 8 10 0.0 0.1 0.2 0.3 0.4 0.5 Scenario 4 (HT paired) − alpha = 0.01 ah Rejection rate JKn RB RBn trB n1 n2 2 4 6 8 10 0.0 0.1 0.2 0.3 0.4 0.5 Scenario 4 (HT paired) − alpha = 0.05 ah Rejection rate JKn RB RBn trB n1 n2 2 4 6 8 10 0.0 0.1 0.2 0.3 0.4 0.5 Scenario 4 (HT paired) − alpha = 0.1 ah Rejection rate JKn RB RBn trB n1 n2 Figure 7: Scenario 4 (h yp othesis test for paired AUCs under H 0 ). Rejection rates for nominal significance lev els α ∈ { 0 . 01 , 0 . 05 , 0 . 1 } (from left to right, indicated with the gray horizontal line). Results are shown for differen t num b ers of clusters selected p er stratum ( a h ∈ { 2 , 4 , 8 , 10 } ) and for tw o total sample sizes ( n 1 and n 2 ). 2 4 6 8 10 0.0 0.2 0.4 0.6 0.8 1.0 Scenario 5 (HT paired) − alpha = 0.01 ah Rejection rate JKn RB RBn trB n1 n2 2 4 6 8 10 0.0 0.2 0.4 0.6 0.8 1.0 Scenario 5 (HT paired) − alpha = 0.05 ah Rejection rate JKn RB RBn trB n1 n2 2 4 6 8 10 0.0 0.2 0.4 0.6 0.8 1.0 Scenario 5 (HT paired) − alpha = 0.1 ah Rejection rate JKn RB RBn trB n1 n2 Figure 8: Scenario 5 (h yp othesis test for paired AUCs under H 1 ). Rejection rates for nominal significance lev els α ∈ { 0 . 01 , 0 . 05 , 0 . 1 } (from left to right). Results are sho wn for differen t n umbers of clusters selected p er stratum ( a h ∈ { 2 , 4 , 8 , 10 } ) and for tw o total sample sizes ( n 1 and n 2 ). 23 0 200 400 600 0.00 0.01 0.02 se density JKn RB RBn trB Scenario 4 ; ah = 2 ; n = n1 0 200 400 600 0.00 0.01 0.02 se density JKn RB RBn trB Scenario 4 ; ah = 4 ; n = n1 0 200 400 600 0.00 0.01 0.02 se density JKn RB RBn trB Scenario 4 ; ah = 8 ; n = n1 0 200 400 600 0.00 0.01 0.02 se density JKn RB RBn trB Scenario 4 ; ah = 10 ; n = n1 0 200 400 600 0.00 0.01 0.02 se density JKn RB RBn trB Scenario 4 ; ah = 2 ; n = n2 0 200 400 600 0.00 0.01 0.02 se density JKn RB RBn trB Scenario 4 ; ah = 4 ; n = n2 0 200 400 600 0.00 0.01 0.02 se density JKn RB RBn trB Scenario 4 ; ah = 8 ; n = n2 0 200 400 600 0.00 0.01 0.02 se density JKn RB RBn trB Scenario 4 ; ah = 10 ; n = n2 Figure 9: Scenario 4 (h yp othesis test for paired A UCs under H 0 ). Estimated densit y functions of the standard errors for all metho ds. Columns corresp ond to different num b ers of clusters selected p er stratum ( a h ∈ { 2 , 4 , 8 , 10 } , from left to righ t), and ro ws corresp ond to the t wo total sample sizes considered ( n 1 top, n 2 b ottom). 24 wh y trB, although b eing a non-design-based method, tends to produce rejection rates closer to the nominal level. T o analyze whether this phenomenon explains the b ehaviour observed in Scenar- ios 4 and 5, we mo dified the v ariance-cov ariance matrix so that the relationships of X 3 and X 4 with the remaining v ariables differ. In this wa y , the comparison of paired A UCs no longer remov es the full impact of the sampling design. Sp ecifically , the v ariance–cov ariance matrix previously defined in eq. ( 31 ) was mo dified so that the co v ariances b et ween X 3 and the remaining v ariables w ere set to 0.5, except for X 4 , with whic h the cov ariance w as set to 0. In addition, X 4 w as defined to b e uncor- related with all the other v ariables. T o construct tw o distinct scenarios (one with equal p opulation A UCs and one with differen t p opulation A UCs) the mean vectors previously defined in T able 1 w ere mo dified as indicated in T able 3 . T able 3: Summary of t w o more scenarios considered in the simulation study for the comparison of paired AUCs. F or each scenario, the mean v ector µ µ µ T Y =1 of the co v ariates for units with Y = 1, the co v ariates considered in the mo del, and the corresp onding p opulation A UC are rep orted. Scenario Con trast P opulation µ µ µ T Y =1 Co v ariates AU C pop 6 HT (1) (0 . 7 , 0 . 7 , 1 , 0 . 5 , 0 . 7 , 0 . 7 , 0 . 7 , 0 . 7 , 0 . 7 , 0 . 7) X 1 , X 2 , X 3 0.7735 paired X 1 , X 2 , X 4 0.7732 7 HT (1) (0 . 7 , 0 . 7 , 1 , 0 . 2 , 0 . 7 , 0 . 7 , 0 . 7 , 0 . 7 , 0 . 7 , 0 . 7) X 1 , X 2 , X 3 0.7735 paired X 1 , X 2 , X 4 0.7493 Figures 10 and 11 depict the results in terms of rejection rates for Scenarios 6 and 7, resp ectiv ely . The estimated standard errors for Scenario 6 are sho wn in Figure 12 (similar distributions w ere obtained for Scenario 7 and are display ed in Figure S5 pro vided as Supplementary Information). The results show that, in these scenarios, trB pro duces smaller v ariance estimates than JKn and RB, which translates in to larger rejection rates that deviate more from the nominal significance levels. These results are similar to those obtained in Scenarios 2 and 3 (see Figures 5 and 6 ). Th us, w e conclude that the p erformance of trB is scenario-dependent and may not b e reliable, ev en in the context of paired AUC comparisons. 4 Application In this section, the metho dology prop osed and ev aluated in the previous sections is applied to a real surv ey data. It should b e emphasized that the purp ose of this 25 2 4 6 8 10 0.0 0.1 0.2 0.3 0.4 0.5 Scenario 6 (HT paired) − alpha = 0.01 ah Rejection rate JKn RB RBn trB n1 n2 2 4 6 8 10 0.0 0.1 0.2 0.3 0.4 0.5 Scenario 6 (HT paired) − alpha = 0.05 ah Rejection rate JKn RB RBn trB n1 n2 2 4 6 8 10 0.0 0.1 0.2 0.3 0.4 0.5 Scenario 6 (HT paired) − alpha = 0.1 ah Rejection rate JKn RB RBn trB n1 n2 Figure 10: Scenario 6 (h yp othesis test for paired AUCs under H 0 ). Estimated densit y functions of the standard errors for all metho ds. Columns corresp ond to differen t n umbers of clusters selected p er stratum ( a h ∈ { 2 , 4 , 8 , 10 } , from left to right), and rows corresp ond to the tw o total sample sizes considered ( n 1 top, n 2 b ottom). 2 4 6 8 10 0.0 0.2 0.4 0.6 0.8 1.0 Scenario 7 (HT paired) − alpha = 0.01 ah Rejection rate JKn RB RBn trB n1 n2 2 4 6 8 10 0.0 0.2 0.4 0.6 0.8 1.0 Scenario 7 (HT paired) − alpha = 0.05 ah Rejection rate JKn RB RBn trB n1 n2 2 4 6 8 10 0.0 0.2 0.4 0.6 0.8 1.0 Scenario 7 (HT paired) − alpha = 0.1 ah Rejection rate JKn RB RBn trB n1 n2 Figure 11: Scenario 7 (h yp othesis test for paired A UCs under H 1 ). Rejection rates for nominal significance lev els α ∈ { 0 . 01 , 0 . 05 , 0 . 1 } (from left to right). Results are sho wn for differen t n umbers of clusters selected p er stratum ( a h ∈ { 2 , 4 , 8 , 10 } ) and for tw o total sample sizes ( n 1 and n 2 ). 26 0 200 400 600 800 0.00 0.01 0.02 se density JKn RB RBn trB Scenario 6 ; ah = 2 ; n = n1 0 200 400 600 800 0.00 0.01 0.02 se density JKn RB RBn trB Scenario 6 ; ah = 4 ; n = n1 0 200 400 600 800 0.00 0.01 0.02 se density JKn RB RBn trB Scenario 6 ; ah = 8 ; n = n1 0 200 400 600 800 0.00 0.01 0.02 se density JKn RB RBn trB Scenario 6 ; ah = 10 ; n = n1 0 200 400 600 800 0.00 0.01 0.02 se density JKn RB RBn trB Scenario 6 ; ah = 2 ; n = n2 0 200 400 600 800 0.00 0.01 0.02 se density JKn RB RBn trB Scenario 6 ; ah = 4 ; n = n2 0 200 400 600 800 0.00 0.01 0.02 se density JKn RB RBn trB Scenario 6 ; ah = 8 ; n = n2 0 200 400 600 800 0.00 0.01 0.02 se density JKn RB RBn trB Scenario 6 ; ah = 10 ; n = n2 Figure 12: Scenario 6 (h yp othesis test for paired AUCs under H 0 ). Estimated densit y functions of the estimated standard errors for all metho ds. Columns corresp ond to different num b ers of clusters selected p er stratum ( a h ∈ { 2 , 4 , 8 , 10 } , from left to righ t), and ro ws corresp ond to the t wo total sample sizes considered ( n 1 top, n 2 b ottom). 27 application is purely illustrativ e. The analysis was restricted to complete cases for simplicit y and comparability across mo dels. No attempt w as made to address miss- ing data through more adv anced techniques, since the primary goal is not to draw epidemiological conclusions but the illustration of the prop osed methodology using real survey data. Similarly , w e hav e not carried out an y formal mo del selection pro cedure, although all included co v ariates are statistically significant ( α = 0 . 05). Consequen tly , the conclusions drawn from this application are not in tended to hav e clinical implications; rather, the fo cus is exclusively on the statistical b eha viour of the prop osed metho ds and on AUC inference under complex sampling designs. Data from the National Health and Nutrition Examination Survey (NHANES) w as considered. NHANES is a national surv ey that measures the health and n utrition of adults and children in the United States which includes health exams, lab oratory tests and dietary in terviews for participants of all ages. This surv ey is conducted on a contin uous basis and data are released in tw o-year cycles. It emplo ys a complex and m ultistage sampling design inv olving stratification and clustering. In particular, data from the 2021–2023 NHANES cycle (August 2021 to August 2023) was considered for the analysis (dataset (1), hereinafter). This dataset includes 11 933 sampled individuals, distributed across 15 strata with tw o primary sampling units p er stratum. Diab etes status (dic hotomous) was used as the resp onse v ariable, and age, gender, educational level, p o vert y income ratio (PIR), and b o dy mass index (BMI) w ere included as cov ariates. The analysis w as restricted to complete cases resulting in a final sample of 5 002 individuals. F or the comparison of indep endent A UCs, data from the 2011–2012 NHANES cycle w as additionally considered (dataset (2), hereinafter). This dataset con tains 9 756 individuals, distributed across 14 strata with t wo or three primary sampling units p er stratum. After restricting to complete cases for the selected v ariables, the final sample size is 4 699 individuals. Prev alence is 0.119 in dataset (1) and 0.093 in dataset (2). T able 4 summarizes the co v ariates included in the five mo dels considered in this application (M1–M5). Sp ecifically , one analysis was conducted for confidence in- terv al estimation (mo del M1, using dataset (1)), tw o analyses were p erformed for the comparison of paired A UCs (comparing mo dels M2–M3 and mo dels M4–M5, b oth based on dataset (1)), and one analysis w as carried out for the comparison of indep enden t A UCs (fitting mo del M1 separately in datasets (1) and (2)). The cor- resp onding results are presen ted in T able 5 . 95% confidence interv als are defined for all the metho ds considered (JKn, RB, RBn and trB) and hypothesis tests are inter- preted with significance level α = 0 . 05. The complex sampling design w as considered throughout the whole analysis. The results show that the estimated confidence interv als are very similar across all 28 metho ds, with the only noticeable difference b eing that RBn yields a slightly narro wer in terv al than the remaining approac hes. Regarding the first paired AUC comparison (mo dels M2 and M3, with point estimates 0 .798 and 0.802, respectively), RBn rejects the null h yp othesis of equal A UCs at the 5% significance level, whereas the other metho ds do not. It is also worth noting that the largest estimated standard error is obtained using trB. These findings are consistent with those observ ed in Scenarios 4 and 5 of the sim ulation study . F or the second paired A UC comparison (mo dels M4 and M5, with p oint estimates 0.709 and 0.760, resp ectiv ely), all metho ds reject the n ull h yp othesis of equal A UCs. In this case, the largest estimated standard errors are obtained using RB and JKn, in line with the b ehaviour observed in Scenarios 6 and 7. Finally , for the comparison of indep enden t A UCs (mo del M1 fitted in dataset (1), with estimated AUC 0.804, and in dataset (2), with estimated A UC 0.828), RB and JKn again pro duce the largest estimated standard errors and therefore the largest p-v alues. RBn yields smaller v ariance estimates, while trB pro vides in termediate results. These findings are comparable to those observ ed in Scenarios 2 and 3. Ov erall, the results from the NHANES application are consistent with the patterns previously iden tified in the simulation study . T able 4: Co v ariates included in eac h of the five mo dels considered in the analysis conducted using the NHANES data. Co v ariates M1 M2 M3 M4 M5 Age ✓ ✓ ✓ ✓ Gender ✓ ✓ ✓ ✓ ✓ Education lev el ✓ ✓ ✓ ✓ PIR ✓ ✓ ✓ ✓ BMI ✓ ✓ ✓ ✓ 29 T able 5: Summary of all analyses conducted using the NHANES data and their corresp onding numerical results. CI HT paired HT paired HT indep Dataset (1) (1) (1) (1) (1) (1) (2) Mo del(s) M1 M2 M3 M4 M5 M1 M1 [ AU C w 0.804 0.798 0.802 0.709 0.760 0.804 0.828 95% CI se z m p-v alue se z m p-v alue se z m p-v alue JKn (0 . 786 , 0 . 822) 0.002 -1.455 0.146 0.017 -2.953 0.003 0.017 -1.422 0.155 RB (0 . 786 , 0 . 823) 0.002 -1.483 0.138 0.017 -2.971 0.003 0.017 -1.418 0.156 RBn (0 . 791 , 0 . 817) 0.002 -2.130 0.033 0.012 -4.198 < 0 . 001 0.013 -1.892 0.058 trB (0 . 785 , 0 . 824) 0.004 -0.993 0.321 0.014 -3.599 < 0 . 001 0.014 -1.644 0.100 30 5 Conclusions This article in tro duces a design-based framework for inference on the AUC in com- plex surv ey data. The prop osed methodology can b e used to construct confidence in terv als and to p erform h yp othesis tests when comparing indep endent or paired A UCs. Sp ecifically , it relies on replicate w eigh ts metho ds to estimate the v ariance of the weigh ted AUC estimator. An extensiv e sim ulation study was conducted, high- ligh ting the imp ortance of prop erly accounting for the sampling design, particularly when the num b er of PSUs p er stratum is limited. Among the metho ds considered, JKn and RB sho w ed the b est ov erall p erfor- mance, p erforming well across all scenarios considered. The v ariance estimates ob- tained with these tw o metho ds w ere almost identical, with the only noticeable differ- ence b etw een b oth methods b eing computational cost. In the sim ulation study and the NHANES application analyzed in this work, JKn w as considerably faster than the b o otstrap approach. Nev ertheless, it should b e noted that the computational cost of JKn increases with the num b er of PSUs, so in settings with a large n umber of PSUs the b o otstrap may b ecome more computationally efficien t. The results also show that b oth the num b er of PSUs and the o v erall sample size hav e a consisten t impact on inference qualit y . In general, increasing the num- b er of PSUs per stratum and the total sample size leads to improv ed co v erage and higher statistical p ow er across all metho ds. Con versely , when the n umber of PSUs is limited, differences b etw een metho ds b ecome more pronounced and the impact of v ariance underestimation when the sampling design is not prop erly tak en into accoun t b ecomes more evident. The practical relev ance of the prop osed metho dology is illustrated through its application to the NHANES survey . The empirical results are consisten t with the patterns observ ed in the sim ulation study . Although the purp ose of this application is purely illustrative rather than clinical, it demonstrates that the prop osed framework p erforms as exp ected under real surv ey conditions and can b e readily implemen ted in widely used p opulation-based health studies. The prop osed framework can also b e extended to other AUC estimators, suc h as the one based on pairwise sampling w eights considering join t inclusion probabil- ities ( Y ao et al. , 2015 ). Although the impact of missing data was not sp ecifically in vestigated in this w ork, ev aluating how differen t missing data strategies interact with design-based A UC inference is an interesting topic to ev aluate in future re- searc h ( Martins et al. , 2025 ). In addition, other concepts related to the A UC, suc h as the co v ariate adjustments ( In´ acio and Rodr ´ ıguez- ´ Alv arez , 2022 ; Janes and P ep e , 2008 ), are also intended as topics for future researc h. 31 All the co de implemen ted in the simulation study and the NHANES application are publicly av ailable on GitHub 1 , ensuring transparency and repro ducibilit y . F ur- thermore, the metho ds prop osed in this work ha ve b een incorp orated in to the svyROC R pac k age, facilitating their practical implementation in real survey data. T ogether, these resources provide a robust and accessible framew ork for design-based AUC inference in complex survey settings. F unding This work w as supp orted by the Univ ersit y of the Basque Country through POS- TUPV24/58 and EHU-N25/19, b y a grant from the Departmen t of Science, Uni- v ersity and Inno v ation from the Basque Gov ernment to the MA THMODE Group (IT1866-26), b y the Spanish Ministry of Science and Innov ation through BCAM Sev ero Oc hoa accreditation [CEX2021–001142-S / MICIN / AEI /10.13039/501100011033], through the pro ject PID2024-156800OB-I00 funded by Agencia Estatal de Inv es- tigaci´ on and acronym “ST ARHS”, and through RED2024-153680-T (BIOST A T- NET) funded by MICIU/AEI /10.13039/501100011033; b y the Basque Gov ernmen t through the BERC 2022-2025 program, and b y the Instituto de Salud Carlos I I I (ISCI I I) through the pro ject RD24/0005/0020 (Red de Inv estigaci´ on en Cronicidad, A tenci´ on Primaria y Prev enci´ on y Promo ci´ on de la Salud). Conflict of in terest The authors declare no p otential conflict of in terests. References Akter, S. B., S. Akter, R. Hasan, M. M. Hasan, D. Eisenberg, R. Azim, J. F. F er- nandez, and T. S. Pias (2025). Optimizing stabilit y of heart disease prediction across imbalanced learning with interpretable gro w net work. Computer Metho ds and Pr o gr ams in Biome dicine 265 , 108702. Binder, D. A. (1983). On the v ariances of asymptotically normal estimators from complex surv eys. International Statistic al R eview 51 (3), 279–292. 1 https://github.com/aiparragirre/design- based- AUC- inference/tree/main 32 Can ty , A. J. and A. C. Davison (1999). Resampling-based v ariance estimation for lab our force surv eys. Journal of the R oyal Statistic al So ciety: Series D (The Statistician) 48 (3), 379–391. Efron, B. (1979). Bo otstrap metho ds: Another lo ok at the jackknife. The Annals of Statistics 7 (1), 1–26. Efron, B. (1981). Nonparametric standard errors and confidence interv als. Canadian Journal of Statistics 9 (2), 139–158. Heeringa, S. G., B. T. W est, and P . A. Berglund (2017). Applie d Survey Data A nalysis . Bo ca Raton, FL: Chapman and Hall/CR C. In´ acio, V. and M. X. Ro dr ´ ıguez- ´ Alv arez (2022). The cov ariate-adjusted ro c curv e: The concept and its imp ortance, review of inferential metho ds, and a new ba yesian estimator. Statistic al Scienc e 37 (4), 541–561. Iparragirre, A., I. Barrio, and I. Arostegui (2023). Estimation of the ro c curve and the area under it with complex survey data. Stat 12 (1), e635. Iparragirre, A., I. Barrio, and M. X. Ro dr ´ ıguez- ´ Alv arez (2019). On the optimism correction of the area under the receiver op erating c haracteristic curv e in logistic prediction mo dels. SOR T - Statistics and Op er ations R ese ar ch T r ansactions 43 (1), 145–162. Iparragirre, A., T. Lumley , I. Barrio, and I. Arostegui (2023). V ariable selection with lasso regression for complex survey data. Stat 12 (1), e578. Janes, H. and M. S. Pepe (2008). Adjusting for co v ariates in studies of diagnostic, screening, or prognostic mark ers: An old concept in a new setting. A meric an Journal of Epidemiolo gy 168 (1), 89–97. Kaier, A. (1895). Observ ations et exp eriences concernant des d´ enombremen ts repre- sen tatives. Bul letin of the International Statistic al Institute 9 , 176–183. Kalton, G. (1983). Intr o duction to Survey Sampling . Thousand Oaks, CA: Sage. Liu, J. P ., M. C. Ma, C. Y. W u, and J. Y. T ai (2006). T est of equiv alence and non-inferiorit y for diagnostic accuracy based on the paired areas under ro c curv es. Statistics in Me dicine 25 (7), 1219–1238. Lumley , T. and A. Scott (2017). Fitting regression mo dels to survey data. Statistic al Scienc e 32 (2), 265–278. 33 Martins, S. R., M. d. C. Iglesias-P´ erez, and J. de U ˜ na-Alv arez (2025, 1). Optimism correction of the area under the ro c curve, with missing data. SOR T 49 , 179–212. Noma, H., Y. Matsushima, and R. Ishii (2021). Confidence interv al for the auc of sroc curv e and some related metho ds using bo otstrap for meta-analysis of diagnostic accuracy studies. Communic ations in Statistics Case Studies Data A nalysis and Applic ations 7 (3), 344–358. Rao, J. N. K. and C. F. J. W u (1988). Resampling inference with complex surv ey data. Journal of the Americ an Statistic al Asso ciation 83 (401), 231–241. Robin, X., N. T urck, A. Hainard, N. Tib erti, F. Lisacek, J.-C. Sanc hez, and M. M ¨ uller (2011). pro c: an op en-source pac k age for r and s+ to analyze and compare ro c curv es. BMC Bioinformatics 12 (1), 77. Skinner, C. J., D. Holt, and T. M. F. Smith (1989). Analysis of Complex Surveys . New Y ork: John Wiley & Sons. W ang, D., S. Jia, S. Y an, and Y. Jia (2022). Dev elopment and v alidation using nhanes data of a predictive mo del for depression risk in m yocardial infarction surviv ors. Heliyon 8 (1), e08853. W olter, K. (2007). Intr o duction to V arianc e Estimation (2nd e d.) . New Y ork: Springer-V erlag. W u, J. C., A. F. Martin, and R. N. Kac k er (2016). V alidation of nonparametric tw o- sample b o otstrap in ro c analysis on large datasets. Communic ations in Statistics: Simulation and Computation 45 (5), 1689–1703. Y ao, W., Z. Li, and B. I. Graubard (2015). Estimation of ro c curv e with complex surv ey data. Statistics in Me dicine 34 (8), 1293–1303. Zhang, Z., C. Gillespie, B. Bowman, and Q. Y ang (2017). Prediction of atheroscle- rotic cardiov ascular disease mortality in a nationally representativ e cohort using a set of risk factors from p o oled cohort risk equations. PLOS ONE 12 (4), e0175822. 34
Original Paper
Loading high-quality paper...
Comments & Academic Discussion
Loading comments...
Leave a Comment