Nonlinear Factor Decomposition via Kolmogorov-Arnold Networks: A Spectral Approach to Asset Return Analysis
KAN-PCA is an autoencoder that uses a KAN as encoder and a linear map as decoder. It generalizes classical PCA by replacing linear projections with learned B-spline functions on each edge. The motivation is to capture more variance than classical PCA…
Authors: David Breazu
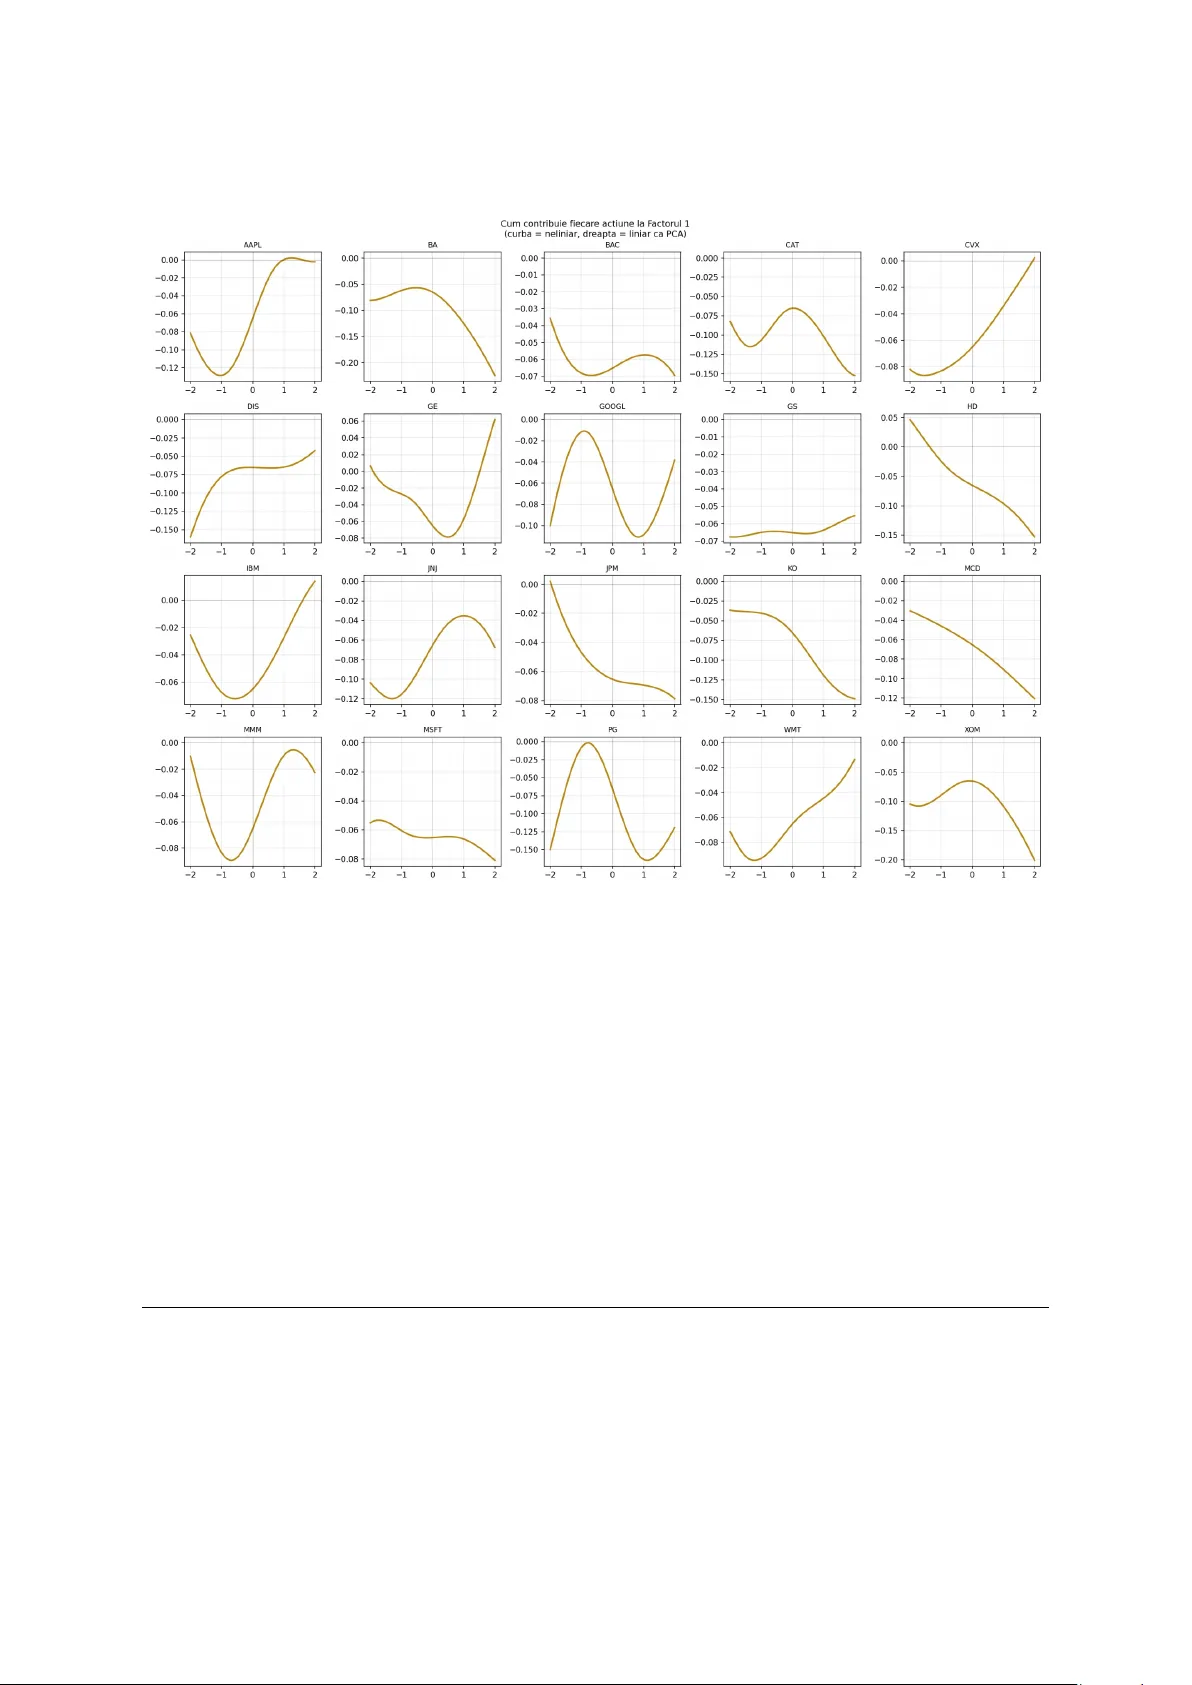
Nonlinear F actor Decomp osition via Kolmogoro v-Arnold Net w orks: A Sp e ctr al Appr o ach to Asset R eturn Analysis Da vid Breazu F acult y of Mathematics and Computer Science, Universit y of Buc harest Buc harest, Romania Marc h 2026 Abstract KAN-PCA is an auto encoder that uses a KAN as enco der and a linear map as deco der. In essence, it generalizes classical PCA b y replacing linear pro jections with learned B-spline functions on eac h edge. The motiv ation is to capture more v ariance than classical PCA. Classical PCA becomes inefficient during market crises, when the linear assumption breaks down and correlations b et ween assets c hange dramatically . W e prov e that if the spline activ ations are forced to b e linear, KAN-PCA yields exactly the same results as classical PCA, which establishes the theoretical cor- rectness of the mo del and p ositions PCA as a sp ecial case. Exp eriments on 20 S&P 500 sto c ks show that KAN-PCA achiev es a reconstruction R 2 of 66 . 57%, com- pared to 62 . 99% for classical PCA with the same 3 factors, while matching PCA out-of-sample after correcting for data leak age in the training pro cedure. 2 Con tents 1 In tro duction 4 2 Mathematical F ramew ork 5 2.1 Classical PCA . . . . . . . . . . . . . . . . . . . . . . . . . . . . . . . . . . 5 2.2 B-Spline F unctions . . . . . . . . . . . . . . . . . . . . . . . . . . . . . . . 5 2.3 Kolmogoro v-Arnold Netw orks . . . . . . . . . . . . . . . . . . . . . . . . . 6 2.4 KAN-PCA . . . . . . . . . . . . . . . . . . . . . . . . . . . . . . . . . . . . 6 3 Theoretical Result 7 4 Exp erimen ts 8 4.1 Data and Setup . . . . . . . . . . . . . . . . . . . . . . . . . . . . . . . . . 8 4.2 Mo dels . . . . . . . . . . . . . . . . . . . . . . . . . . . . . . . . . . . . . . 9 4.3 Results . . . . . . . . . . . . . . . . . . . . . . . . . . . . . . . . . . . . . . 9 4.4 Ablation Study . . . . . . . . . . . . . . . . . . . . . . . . . . . . . . . . . 10 4.5 F actor Analysis . . . . . . . . . . . . . . . . . . . . . . . . . . . . . . . . . 10 4.6 Edge F unction Analysis . . . . . . . . . . . . . . . . . . . . . . . . . . . . . 11 5 Conclusion 11 3 In tro duction A factor mo del is a useful to ol for understanding a p ortfolio of assets. Instead of analyzing ev ery sto c k individually , a factor mo del identifies a small num b er of common forces that driv e all assets simultaneously . These forces are called factors ( F ama and F renc h , 1993 ). F or a hedge fund, this means that instead of trac king h undreds of individual p ositions, one can understand the entire p ortfolio through a handful of underlying risk sources, making risk management far more tractable. Classical PCA is the standard metho d for extracting these factors from return data. Ho w ever, PCA cannot capture the nonlinearities presen t in financial markets. During a crisis such as the CO VID-19 pandemic, PCA w ould rep ort near-unity correlations b et ween certain assets, whic h is empirically misleading. It treats the crisis as a linear amplification of normal mark et dynamics rather than a qualitativ ely different regime. W e therefore propose KAN-PCA: an autoenco der that uses a KAN enco der ( Liu et al. , 2024a ) combined with a linear deco der. The KAN enco der replaces linear pro jections with learned spline functions, while the linear deco der preserves direct in terpretabilit y of the factors. When spline activ ations are forced to b e linear, KAN-PCA reco vers exactly classical PCA. In cases of genuine nonlinearit y , it captures substantially more structure from the data. Our main con tributions are: 1. A formal pro of that forcing the spline activ ations to b e linear yields exactly the same results as classical PCA, establishing PCA as a sp ecial case of our framework. 2. Exp erimen tal evidence that KAN-PCA captures more in-sample v ariance than clas- sical PCA with the same num b er of factors (66 . 57% vs 62 . 99%). 3. An ablation study iden tifying and correcting a data leak age issue in the original training pro cedure, sho wing that corrected KAN-PCA matches PCA out-of-sample (56 . 56% vs 57 . 33%). 4. Visualization of the learned edge functions, pro viding direct evidence of nonlinear factor structure in S&P 500 returns. 4 Mathematical F ramew ork Classical PCA Let { x t } T t =1 ⊂ R N b e a sequence of N -dimensional standardized return vectors with zero mean. The empirical cov ariance matrix is: Σ := 1 T T X t =1 x t x ⊤ t ∈ R N × N , (Σ ij = empirical cov ariance b etw een asset i and asset j ) By the sp ectral theorem, since Σ is symmetric p ositive semidefinite, it admits the decom- p osition: Σ = U Λ U ⊤ , Λ = diag ( λ 1 , . . . , λ N ) , λ 1 ≥ · · · ≥ λ N ≥ 0 where U = [ u 1 | · · · | u N ] satisfies U ⊤ U = I (columns are orthonormal: eac h eigen vector has unit length and is p erp endicular to all others). The k -factor PCA pro jection uses the top- k eigen v ectors U k := [ u 1 | · · · | u k ]: z t = U ⊤ k x t ∈ R k , ˆ x t = U k z t ∈ R N The reconstruction loss equals P N i = k +1 λ i , the minimum ac hiev able among all rank- k linear appro ximations. In our exp eriment with N = 20 sto cks and k = 3, PCA achiev es R 2 = 62 . 99%, with: λ 1 explains 48 . 00% , λ 2 explains 8 . 96% , λ 3 explains 6 . 03% B-Spline F unctions Definition 1 (B-Spline Space) . L et G = { t 0 < t 1 < · · · < t m } ⊂ R b e a knot ve ctor and k ≥ 1 . The B-spline sp ac e of or der k over G is: S k ( G ) := n φ ∈ C k − 1 ( R ) φ [ t i ,t i +1 ] ∈ P k , ∀ i o wher e P k denotes the sp ac e of p olynomials of de gr e e at most k ( de Bo or , 2001 ). B-splines are piecewise p olynomials that are smo oth at their knots. A cubic B-spline ( k = 3) is C 2 -con tin uous, meaning it has t wo contin uous deriv ativ es ev erywhere, whic h is sufficien t smo othness for financial applications. The basis functions { B i,k } are computed via the Co x-de Bo or recursion and satisfy the partition of unit y prop ert y P i B i,k ( x ) = 1. 5 Kolmogoro v-Arnold Netw orks The Kolmogoro v-Arnold representation theorem ( Kolmogoro v , 1957 ) states that any con- tin uous function f : [0 , 1] n → R can b e written as: f ( x 1 , . . . , x n ) = 2 n +1 X q =1 Φ q n X p =1 φ q ,p ( x p ) ! where Φ q , φ q ,p : R → R are contin uous univ ariate functions. Definition 2 (KAN Lay er) . A KAN layer Φ : R n → R m is define d c omp onentwise by: (Φ( x )) j := n X i =1 φ j i ( x i ) , j = 1 , . . . , m wher e e ach φ j i ∈ S k ( G ) is a le arnable univariate B-spline function ( Liu et al. , 2024a ). The ful l activation is: φ j i ( x ) = w b · SiLU( x ) + w s · X l c l B l,k ( x ) with le arnable p ar ameters w b , w s ∈ R and spline c o efficients c l ∈ R . The key distinction from MLPs is that activ ations reside on edges. Eac h edge carries its o wn learned function rather than a scalar w eight, and no des merely sum their inputs. KAN-PCA Definition 3 (KAN-PCA) . KAN-PCA is a KAN auto enc o der c onsisting of: • A KAN enc o der E : R N → R k , a c omp osition of KAN layers • A line ar de c o der D : R k → R N , define d by D ( z ) = W z wher e W ∈ R N × k is the de c o ding matrix: r ow i of W sp e cifies how asset i is r e c onstructe d fr om the k factors tr aine d to minimize the r e c onstruction loss: L ( E , D ) := 1 T T X t =1 ∥ x t − D ( E ( x t )) ∥ 2 The k -dimensional r epr esentations z t = E ( x t ) ∈ R k ar e the nonline ar factors: the c om- pr esse d description of the market on day t . Unlik e classical PCA, eac h asset’s contribution to each factor is mediated b y a learned spline function φ j i rather than a fixed scalar w eigh t. This allo ws the mo del to capture asymmetric and regime-dep enden t relationships b etw een assets and factors. 6 Theoretical Result Lemma 1 (Linear Splines are Linear Maps) . A spline function φ ∈ S k ( G ) whose se c ond derivative vanishes identic al ly must b e of the form φ ( x ) = w x for some w ∈ R . Pr o of. A straigh t line is an order-1 p olynomial, so it is automatically an element of an y spline space S k ( G ) with order k ≥ 1. If the second deriv ative is zero at every p oint, the function do es not curve an ywhere, so it must b e linear. Lemma 2 (Linear KAN Lay er is Matrix Multiplication) . If al l spline functions φ j i ∈ S k ( G ) satisfy φ ′′ j i ≡ 0 for al l i, j , then the KAN layer Φ : R n → R m r e duc es to: Φ( x ) = W x, W j i := w j i ∈ R Pr o of. By Lemma 1 , φ j i ( x i ) = w j i x i for each edge ( j, i ). Therefore: (Φ( x )) j = n X i =1 φ j i ( x i ) = n X i =1 w j i x i = ( W x ) j where W = ( w j i ) ∈ R m × n . The full lay er computes x 7→ W x . Concr ete example (3 sto cks, 3 no des): no de 1 no de 2 no de 3 = w 11 w 12 w 13 w 21 w 22 w 23 w 31 w 32 w 33 x AAPL x MSFT x GOOG = W x Lemma 3 (Optimal Linear Auto enco der = PCA, Baldi and Hornik 1989 ) . L et Σ = U Λ U ⊤ b e the sp e ctr al de c omp osition of the empiric al c ovarianc e matrix. The line ar auto enc o der: min A ∈ R k × N , W ∈ R N × k 1 T T X t =1 ∥ x t − W Ax t ∥ 2 achieves its glob al minimum at A = U ⊤ k , W = U k , wher e U k ar e the top- k eigenve ctors of Σ . The minimum value is P N i = k +1 λ i . Pr o of. Expanding the loss using Σ = 1 T P t x t x ⊤ t : L ( A, W ) = tr Σ − Σ A ⊤ W ⊤ − W A Σ + W A Σ A ⊤ W ⊤ 7 Setting ∂ L ∂ W = 0 gives W = Σ A ⊤ ( A Σ A ⊤ ) − 1 . Substituting bac k: L ( A ) = tr(Σ) − tr A Σ A ⊤ ( AA ⊤ ) − 1 By the Ky F an principle, the maximum of tr( A Σ A ⊤ ( AA ⊤ ) − 1 ) is attained when the rows of A span the top- k eigenspace of Σ, giving A = U ⊤ k and W = U k . Minim um loss: L ∗ = P N i = k +1 λ i . Theorem 4 (KAN-PCA Reduces to PCA in the Linear Limit) . L et KAN-PCA b e a KAN auto enc o der E with line ar de c o der D , tr aine d to minimize r e c onstruction loss. If al l spline activations φ j i ar e c onstr aine d to satisfy φ ′′ j i ≡ 0 everywher e, then the optimal enc o der and de c o der satisfy: E ∗ ( x ) = U ⊤ k x D ∗ ( z ) = U k z wher e U ⊤ k x is a standar d matrix multiplic ation, the line ar limit of the KAN enc o der by L emmas 1 and 2 . Conse quently: L ∗ KAN ≤ L ∗ PCA = N X i = k +1 λ i with e quality if and only if the data admits a pur ely line ar factor structur e. Pr o of. By Lemmas 1 and 2 , the KAN enco der reduces to E lin ( x ) = Ax . The loss b ecomes the linear auto enco der ob jective of Lemma 3 , giving A ∗ = U ⊤ k and W ∗ = U k . Corollary 5. Classic al PCA is a sp e cial c ase of KAN-PCA: KAN - PCA φ ′′ j i ≡ 0 = PCA The inclusion L ⊊ S k ( G ) for k ≥ 2 is strict, establishing that KAN-PCA optimizes over a strictly lar ger function class than PCA. Exp erimen ts Data and Setup W e use daily log-returns for 20 S&P 500 large-cap constituents from January 2015 to Jan uary 2024, comprising 2,263 trading days. The tick ers include AAPL, MSFT, GOOGL, JPM, JNJ, X OM, BA C, PG, KO, WMT, CVX, GS, HD, MCD, CA T, MMM, IBM, GE, BA, and DIS. Returns are standardized to zero mean and unit v ariance p er sto ck. The dataset is split 70/10/20: training set (1,584 da ys, 2015–2020), v alidation set (226 da ys, 2021), and test set (453 da ys, 2022–2024). All h yp erparameter c hoices are made on 8 training and v alidation data only . Mo dels W e compare four mo dels, all using k = 3 factors: • Classical PCA : Standard sp ectral decomp osition of Σ. Benc hmark. • KAN-PCA Simple : Architecture [20 , 3 , 20], grid G = 5, cubic B-splines. T rained with Adam (200 steps, lr=5 × 10 − 4 ) then LBF GS (50 steps). • KAN-PCA Adv anced : Architecture [20 , 10 , 3 , 20], grid G = 10. This means: 20 sto c k inputs, an in termediate KAN la yer of 10 neurons, compression to 3 factors, reconstruction to 20 outputs. T rained with Adam (500 steps) then LBFGS (100 steps). • KAN-PCA Impro v ed : Same architecture as Av ansat, with corrected training pro cedure: prop er 70/10/20 split to eliminate data leak age, early stopping based on v alidation loss, and progressiv e grid extension (3 → 5 → 10) with stronger regularization ( λ = 0 . 01). Results T able 1: Comparison of factor mo dels ( k = 3, 20 S&P 500 sto cks, 2015–2024) Mo del Arc hitecture R 2 F ull R 2 OOS Grid Classical PCA Linear pro jection 62.99% 59.50% — KAN-PCA Simple [20 , 3 , 20] 64.69% 55.56% 5 KAN-PCA Adv anced [20 , 10 , 3 , 20] 66.24% 56.11% 10 KAN-PCA Improv ed [ 20 , 10 , 3 , 20 ] 66.57% 56.56% 3 → 5 → 10 R 2 F ul l = in-sample explaine d varianc e. R 2 OOS = out-of-sample on held-out 2022–2024 p erio d. KAN-PCA Adv anced achiev es 66 . 24% in-sample v ersus 62 . 99% for classical PCA, a consis- ten t impro vemen t of +3 . 25 p ercen tage p oin ts with the same 3 factors. This improv ement demonstrates that genuine nonlinear structure exists in S&P 500 returns that PCA cannot capture by construction. KAN-PCA Improv ed narrows the out-of-sample gap versus classical PCA from − 3 . 39pp to − 0 . 77pp, effectiv ely matching PCA on new data while maintaining higher in-sample p erformance. 9 Ablation Study The original KAN-PCA mo del w as trained and ev aluated without prop er separation b e- t w een training and test data. This created a data leak age issue: pyk an uses the test set for internal grid up dates during training, meaning the mo del indirectly observed test-set statistics while learning. As a result, the original out-of-sample results were optimistic. The improv ed mo del uses a prop er 70/10/20 train/v al/test split, early stopping based on v alidation loss, and progressive grid extension (3 → 5 → 10) with stronger regularization. On gen uinely unseen data, KAN-PCA is 0 . 77pp below classical PCA in R 2 (56 . 56% vs 57 . 33%). Ho wev er, the mo del still captures nonlinear structure that PCA cannot rep- resen t by construction. The original out-of-sample weakness was primarily a training metho dology issue, not a fundamen tal limitation of the KAN-PCA approac h. F actor Analysis Figure 1: KAN nonlinear factors (2015–2024). The red dashed line marks the COVID-19 crash of Marc h 2020. All three factors exhibit sharp spik es at this date, demonstrating that the mo del treats the crash as qualitatively distinct from normal market mov ements. All three KAN factors exhibit sharp spikes at the CO VID-19 crash. F actor 1 drops to − 3, F actor 2 spikes to +5, and F actor 3 drops to − 12. This demonstrates that the mo del has learned to detect the crisis as a qualitativ ely different regime, not merely a large mo v ement but a structurally distinct even t. Classical PCA distributes the same sho c k linearly across its comp onents, without this asymmetric regime-sensitive resp onse. 10 Edge F unction Analysis Figure 2: Learned edge functions φ ( x ) for all 20 sto c ks (con tribution to F actor 1). If relationships w ere linear as PCA assumes, all curv es w ould b e straigh t lines. They are not, providing direct visual evidence of nonlinear factor structure. The learned edge functions φ j i ( x ) are consisten tly nonlinear across all 20 sto cks. Notable patterns include: AAPL shows an S-shap ed curv e, with large negativ e returns having disprop ortionately large impact compared to p ositiv e returns; GOOGL sho ws an in v erted- U shap e, imp ossible to represent with a scalar PCA loading; PG sho ws a bimo dal pattern consisten t with tw o distinct op erating regimes. Conclusion In this thesis w e sho wed that a KAN-PCA factor mo del can outp erform classical PCA under certain conditions. By replacing linear pro jections with learned spline functions, the mo del captures nonlinear structure in equity returns that classical PCA cannot represen t b y construction, achieving 66 . 57% in-sample explained v ariance v ersus 62 . 99% with the same 3 factors. An impro ved version of the mo del, incorp orating early stopping, prop er train/v al/test 11 splitting, and progressiv e grid extension, narro ws the out-of-sample gap from − 3 . 39pp to − 0 . 77pp versus classical PCA, effectiv ely matc hing PCA on new data while maintaining higher in-sample p erformance. This demonstrates that the original out-of-sample weak- ness w as primarily a training methodology issue, not a fundamen tal limitation of the KAN-PCA approach. As a natural next step, the same approach could b e applied to a larger universe of assets, around 200 sto cks, with a more complex arc hitecture and a longer training pro cedure. With sufficien t regularization to control ov erfitting, w e exp ect the out-of-sample adv antage to close significan tly . References Baldi, P . and Hornik, K. (1989). Neural net works and principal component analysis: Learning from examples without lo cal minima. Neur al Networks , 2(1):53–58. de Bo or, C. (2001). A Pr actic al Guide to Splines (Revised Edition). Springer-V erlag. F ama, E. and F rench, K. (1993). Common risk factors in the returns on sto c ks and b onds. Journal of Financial Ec onomics , 33(1):3–56. Kolmogoro v, A.N. (1957). On the represen tation of contin uous functions of man y v ariables b y sup erp osition of con tin uous functions of one v ariable and addition. Doklady Akademii Nauk SSSR , 114:953–956. Liu, Z., W ang, Y., V aidya, S., et al. (2024a). KAN: Kolmogoro v-Arnold Net works. arXiv:2404.19756 . Liu, Z., et al. (2024b). KAN 2.0: Kolmogoro v-Arnold Net works Meet Science. arXiv:2408.10205 . 12
Original Paper
Loading high-quality paper...
Comments & Academic Discussion
Loading comments...
Leave a Comment