Concentration And Distribution of Container Flows In Mauritania's Maritime System (2019-2022)
Small, trade-dependent economies often exhibit limited maritime connectivity, yet empirical evidence on the structural configuration of their container systems remains limited. This study analyzes route concentration and node distributions in Maurita…
Authors: Mohamed Bouka, Moulaye Abdel Kader Ould Moulaye Ismail
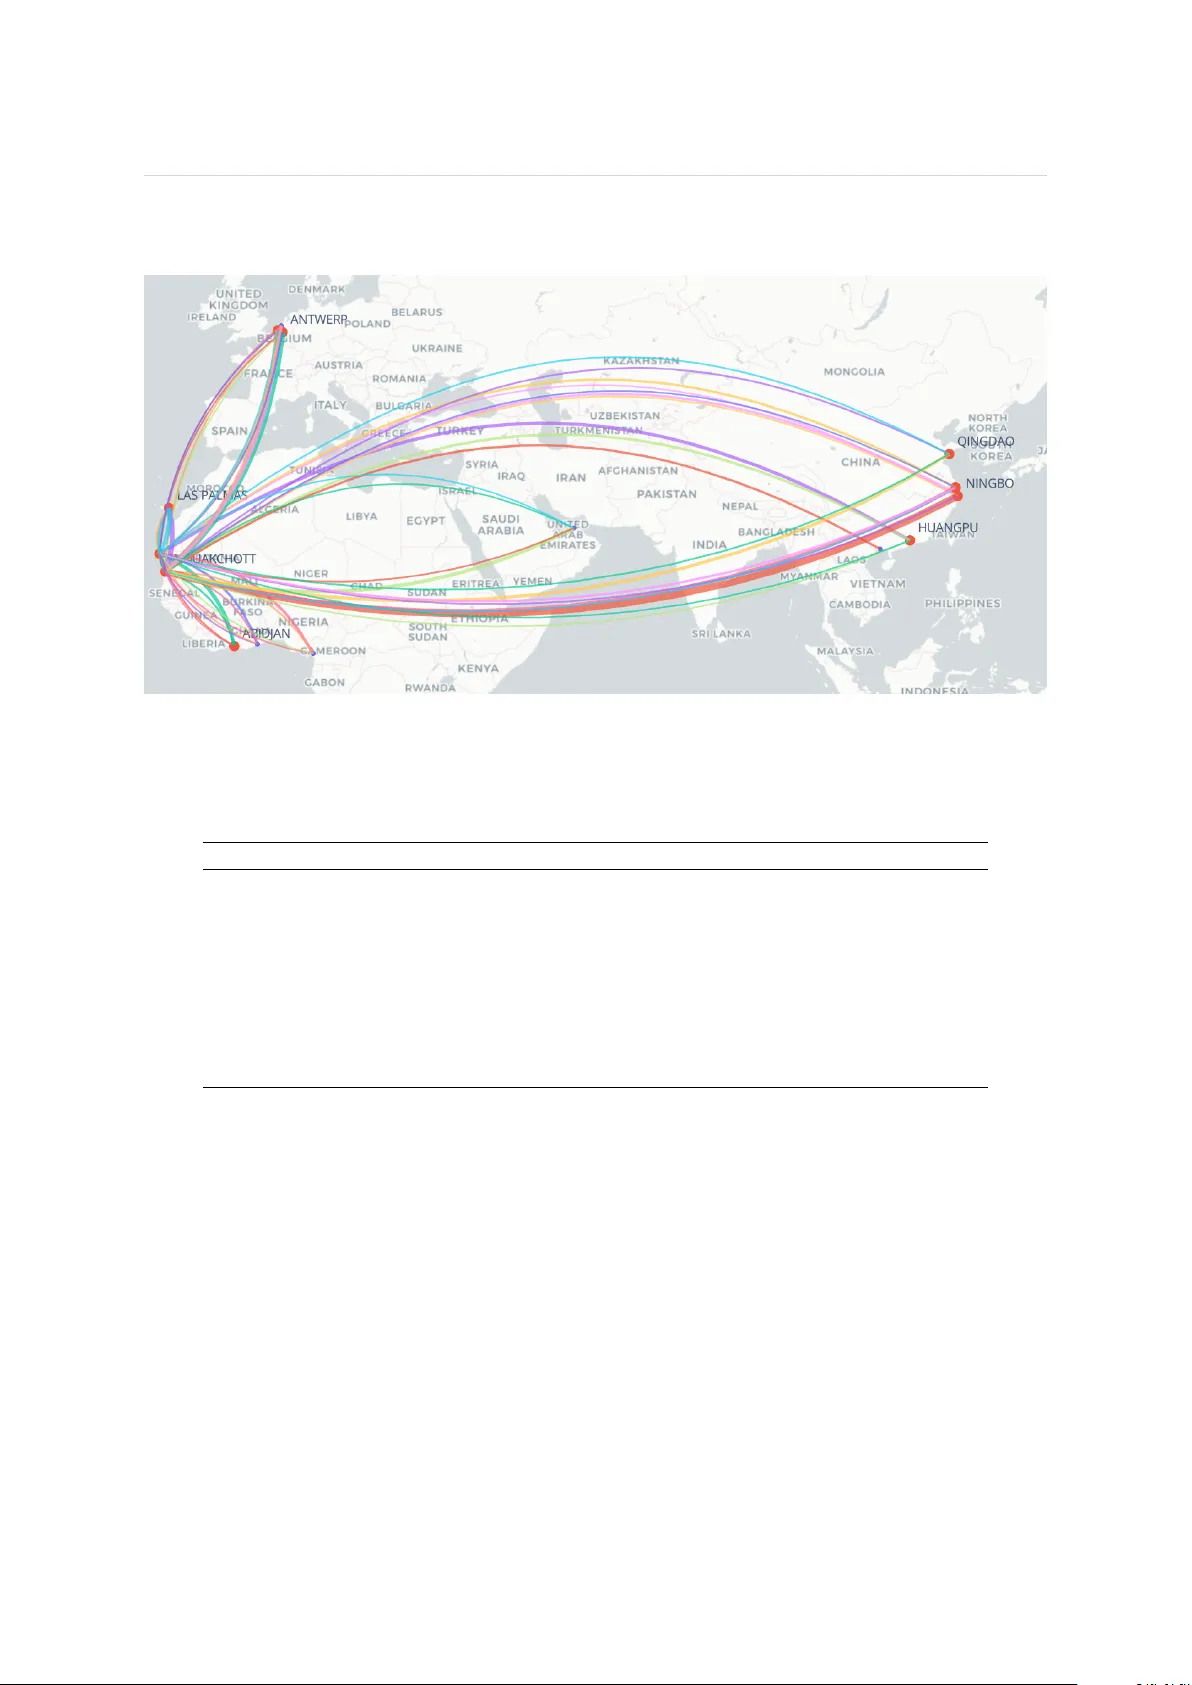
Concentration and Distribution of Container Flo w s in Mauri- tania ’s Maritime Sy stem (2019–2022) Mohamed Bouka 1 * , Moula y e Abdel Kader Ould Moula y e Ismail 1 1 Researc h U nit of Go vernance of Institutions, F aculty of Economics and Management, U niversity of N ouakchott, Nouakc hott, 5026, Maur itania * Corresponding author: mohamedbouka50@gmail.com Abstract Small, trade-dependent economies often e xhibit limited mar itime connectivity , yet empirical e vidence on the structural configuration of their container sy stems remains limited. This study anal yzes route concentration and node distributions in Maur itania ’ s mar itime container sys tem during 2019–2022 using shipment-lev el data measured in f or ty -foot eq uivalent units (FFE). Routes, origin nodes, destination nodes, and industries are represented as FFE-w eighted probability distributions, and concentration and diver gence metr ics are used to assess structural proper ties. The results sho w strong cor r idor concentration across the se ven obser v ed routes ( HHI = 0 . 296 ), with the top three accounting f or appro ximatel y 84% of total FFE. N ode structures differ by direction: impor ts are associated with a highly concentrated set of destination nodes ( HHI = 0 . 848 ), while e xpor ts originate from only two origin nodes ( HHI = 0 . 567 ) and are distributed across a larg e number of destinations ( HHI = 0 . 053 ). Industry distributions are more concentrated f or exports ( HHI = 0 . 352 ) than f or impor ts ( HHI = 0 . 096 ), with frozen fish and seaf ood accounting f or more than 53% of e xpor t v olume. T emporal anal ysis sho ws that route concentration remains stable o v er time ( HHI ≈ 0 . 293 – 0 . 303 ), while node distributions e xhibit measurable variation, par ticularl y f or e xpor t destinations (JSD ≈ 0 . 395 ) and import or igins (JSD ≈ 0 . 250 ). Ke yw ords: mar itime container transpor t, route concentration, port dependency , trade logis tics vulnerabil- ity , str uctural asymmetry , W est Afr ica 1 Introduction Maritime transport underpins contemporary international trade, with containerization forming its dominant logistics architecture. S tandardized containers, scheduled liner ser vices, and por t network integration ha ve reshaped the spatial org anization of trade b y linking national economies to global shipping sys tems through structured ser vice cor r idors. Within this sys tem, the distribution of container flow s across routes and por ts is not neutral; it reflects the configuration of mar itime ser vice netw orks, cargo v olumes, industrial composition, and logistical connectivity cons traints [ 1 – 3 ]. For small, trade-dependent economies, the structural org anization of container flow s is par ticularl y significant. Limited cargo v olumes ma y restr ict the a vailability of direct liner services, increase reliance on transshipment hubs, and concentrate flo ws along a nar row set of mar itime cor r idors. Such s tr uctural characteristics influence routing fle xibility , e xposure to ser vice disruptions, and the deg ree of logistical 2 div ersification av ailable to domestic industries. U nderstanding how container ized trade is distributed across routes, por ts, and sectors is theref ore essential f or assessing the configuration of mar itime logistics sy stems in lo w-v olume trade environments [ 4 – 6 ]. The practical relev ance of such structural dependencies has been underscored by recent geopolitical disruptions affecting the Red Sea cor r idor . Since late 2023, secur ity threats hav e led some car r iers operating Asia–W est Africa ser vices to reroute via the Cape of Good Hope, with implications f or transit times and freight costs along cor r idors used b y lo w-v olume trading economies [ 4 ]. This conte xt fur ther motiv ates the empir ical characterization of cor r idor concentration in constrained maritime sys tems. While the literature on mar itime logistics has e xtensiv ely e xamined hub concentration, port competition, netw ork centrality , and operational efficiency in ma jor trading economies, comparativ ely less attention has been dev oted to the str uctural configuration of container flo ws in smaller de veloping conte xts. Empirical e vidence remains limited regarding ho w route concentration, por t reliance, and sectoral specialization interact within container systems characterized by relativ ely modest volumes and constrained ser vice por tf olios. This gap is particularl y relev ant f or coastal economies in W est Africa, where mar itime gate wa ys serve as primar y trade interfaces y et sy stematic quantitativ e analy ses remain scarce. Mauritania offers a per tinent case f or such an inv estigation. The org anization of its international merchandise trade is closely link ed to its mar itime gate wa ys, particularl y the Port of Nouakc hott, which functions as a central interface f or the country’ s impor ted goods and its integ ration into global shipping netw orks. Container ized flo ws connect f oreign por ts of loading with domestic dischar ge points through scheduled liner ser vices, as reflected in mar itime connectivity and por t throughput indicators. These flo ws reflect the interaction betw een e xter nal liner ser vice structures, the composition of e xpor t activities, and domestic import demand patter ns. Examining whether Mauritania’ s container netw ork is diversified or concentrated, theref ore, provides insight into the structural characteristics of its mar itime logistics configuration while remaining within the scope of observable transport system data [ 7 , 8 ]. This study conducts a structural analy sis of mar itime container flo ws in Maur itania o ver the per iod 2019–2022 using detailed mo vement data measured in FFE. The anal ysis focuses on three inter related structural dimensions: route concentration, por t dependency , and industr y specialization. In addition, it ev aluates differences betw een impor t and e xpor t configurations and ex amines temporal stability in netw ork structure across the study period. The main objectiv e of this researc h is to analyze the str uctural configuration of maritime container flo ws in Mauritania dur ing 2019–2022. This objective is operationalized through the f ollo wing research ques tions: 1. R oute Concentration: What is the degree of mar itime route concentration in Maur itania ’ s container - ized trade? 2. P ort Dependency: T o what e xtent do container flo ws rel y on a limited set of f oreign ports of loading? 3. Industry Specialization: Ho w are containerized flow s distributed across industrial sectors, and does the e xpor t structure e xhibit concentration patter ns distinct from imports? 4. Import–Export Structural Asymmetry : Are there sy stematic differences in route usage and container structure betw een impor ts and exports? 5. T emporal Structural Stability : Does the configuration of the mar itime container netw ork remain 3 stable o ver time, or does it e xhibit measurable structural shifts dur ing 2019–2022? This study provides empir ical evidence on the configuration of container -based maritime logistics in a small-v olume trade en vironment. The findings offer a structured assessment of concentration, dependency , and distributional patter ns within Maur itania ’ s container netw ork, while also illustrating an anal ytical approach applicable to comparable mar itime conte xts. The remainder of the paper is org anized as f ollo ws. Section 2 re view s the related w ork. Section 3 presents the analytical framew ork and the concentration, div erg ence, and stability measures used in the study . Section 5 pro vides an e xplorator y descr iption of the shipment-le vel dataset and its distributional proper ties. Section 6 repor ts the empirical results and discussion. Section 7 concludes with limitations and directions f or fur ther research. 2 R elated W ork Maritime container transpor t is a central component of contemporary inter national trade, linking production and consumption sys tems through structured shipping cor ridors and por t gate wa ys. Over the past tw o decades, the global container shipping system has e v olv ed into a highly interconnected netw ork characterized by unev en connectivity and concentration patterns, alliance-dr iven ser vice structures, and asymmetric trade flow s. While e xtensiv e research has e xamined the topology , connectivity , and resilience of the global mar itime netw ork, comparativel y less attention has been dev oted to the structural configuration of container flo ws in smaller , trade-dependent economies. Existing studies predominantly f ocus on larg e-scale global or regional systems, emphasizing netw ork centrality , hub dominance, alliance structures, and the propagation of disruption. These approaches pro vide v aluable insights into the architecture of the global shipping sys tem but often abstract from the distributional structure of flo ws within individual national sy stems, particularl y those with modest trade v olumes and constrained service por tf olios. In such conte xts, structural concentration and gate wa y dependency ma y hav e dispropor tionate implications f or trade exposure and logis tical vulnerability . The literature rele vant to this study can be or ganized into f our inter related strands: (i) maritime network structure and topology , (ii) concentration and gate wa y dominance, (iii) connectivity and trade dependency , and (iv) vulnerability and resilience in shipping netw orks. T og ether , these strands pro vide the conceptual f oundation f or analyzing route concentration and por t dependency as measurable structural proper ties of container sy stems. 2.1 Maritime Netw ork Structure and T opology The modeling of maritime container sy stems as comple x networks has shifted empir ical anal ysis from descriptive port-sys tem frame works tow ard f or mal topological character ization. V essel-mov ement-based reconstructions of the global liner shipping netw ork indicate persistent hierarchical org anization and structural stability o v er time. Ducr uet and Notteboom [ 9 ] show that, despite traffic g ro wth and hub repositioning betw een 1996 and 2006, the relativ e configuration of dominant por ts remains structurally robust when e valuated through degree and betw eenness centrality . S tr uctural polar ization persists ev en as individual nodal rankings adjust. Subsequent researc h formalizes these proper ties within netw ork science. X u et al. [ 10 ] construct a Global Liner Shipping Netw ork of 977 por ts connected by 16,680 links and repor t an av erag e shortest path length of 2.671 and a clustering coefficient of 0.713, consistent with small-w orld topology . Global efficiency reaches 82.7% of the full y connected benchmark, while wir ing cost accounts for only 1.5%, indicating a configuration that combines high integration with low spatial redundancy . Community 4 detection identifies sev en upper -lev el modules, and a g ate wa y–hub s tr uctural core emerges as the pr incipal integrativ e mechanism across geographicall y compact clusters. Directed representations fur ther rev eal asymmetr ic connectivity patter ns. Kang et al. [ 11 ] construct a 2021 directed GLSN including 564 por ts and 2,971 directed links. In-degree and out-degree distributions f ollo w po wer -law behavior with 𝑅 2 > 0 . 96 , indicating a hea vy -tailed hierarch y . Accessibility measures integrating betweenness, transit impedance, and PLSCI values position a limited group of Asian and European hubs at the upper end of the distribution, reflecting concentration in global accessibility . W eighted longitudinal reconstructions capture structural ev olution o ver time. Jarumaneeroj et al. [ 12 ] anal yze quar terl y snapshots betw een 2011 and 2017 using the Container Port Connectivity Inde x and modularity-based community detection. Connectivity remains strongl y ske wed to ward East Asian por ts, while trading communities reorg anize in response to macroeconomic adjustments such as the 2016 Panama Canal e xpansion. Netw ork restructur ing occurs through the reallocation of w eighted links rather than through ma jor topological fragmentation. Netw ork responses to ex ogenous shocks further illustrate hierarchical differentiation. Using AIS-based v essel mo vements, Guer rero et al. [ 13 ] document a measurable contraction in weighted connectivity betw een 2019 and 2020, accompanied b y regionally differentiated concentration effects. Larg e hubs and densel y interconnected nodes maintain relativel y higher resilience than smaller br idge or transshipment por ts, indicating that hierarchical position conditions facilitate shock absor ption. Commodity -lay er coupling introduces an additional structural dimension. Ducr uet [ 14 ] models mar itime transpor t as a multigraph composed of commodity-specific la y ers and sho ws that higher -traffic por ts tend to e xhibit greater commodity diversity . T raffic allocation across la yers remains unev en and is associated with the nodal hierarchy , reinf orcing the coe xistence of specialization and diversification within the broader maritime str ucture. 2.2 Concentration, V ulnerability , and Netw ork Disruption Maritime transpor tation systems are increasingl y ex amined through the lens of sy stemic vulnerability , where disr uption r isk ar ises not onl y from isolated node f ailures but also from structural interdependencies embedded in the netw ork. Calatayud et al. [ 15 ] conceptualize vulnerability as a function of multiple x configuration, modeling more than 80 liner shipping networks and simulating targ eted attacks on se v en strategic nodes in the Americas. Their findings indicate that the exposure of freight flow s varies depending on a countr y’ s structural position within o v erlapping ser vice la yers. The remo val of high-centrality nodes results in dispropor tionate connectivity losses, sugg esting that structural dependencies amplify sys temic fragility . Empirical evidence from v essel tracking fur ther refines this understanding. Using AIS data across 141 disruption ev ents affecting 74 por ts and 27 natural disasters, V erschuur et al. [ 16 ] repor t a median disruption duration of six day s and a 95th percentile of 22.2 day s. All obser v ed ev ents in vol ve simultaneous multi-por t impacts rather than isolated closures. Disr uption duration scales with hazard intensity : an additional 1.0 m storm surg e or 10 m/s wind speed is associated with appro ximately tw o additional da ys of do wntime. Short-ter m substitution betw een por ts is rarely observed, sugg esting that logistical concentration constrains adaptiv e rerouting capacity . Production recapture rather than spatial diversion emerg es as the dominant adjustment mec hanism. Comparativ e shock anal ysis rev eals differentiated resilience patterns. N otteboom et al. [ 17 ] contrast the 5 2008–2009 financial cr isis with CO VID-19, showing that while the financial crisis unf olded sequentiall y across leading indicators, container v olumes, and trade flo ws, CO VID-19 triggered synchronized contractions across operational and financial indicators. R ecov er y dynamics differ , with CO VID-19 sho wing fas ter shor t-ter m rebounds through adaptiv e strategies such as blank sailings, slow s teaming, and alliance coordination. These findings sugges t that resilience is partly endogenous to indus tr y structure and strategic coordination, in addition to netw ork topology . Climate-related vulnerability introduces an additional structural dimension. Poo and Y ang [ 18 ] combine centrality anal ysis with climate disr uption indicators to model route optimization under projected port do wntime scenar ios. Their framew ork distinguishes betw een regional vulnerability linked to nodal centrality and local vulnerability linked to exposure to e xtreme weather . P or ts occup ying structurally central positions ma y ex er t dispropor tionate systemic effects e v en when local hazard lev els are moderate. Larg e-scale geopolitical shocks pro vide fur ther e vidence of str uctural adaptation. Cong et al. [ 19 ] construct global maritime netw orks from AIS trajectory data f or 20-day windo ws bef ore and after the R ussia–Ukraine conflict. N etwork connectivity increases by 27.2%, netw ork scale b y 36.6%, density by 32.4%, and calculated resilience b y 18.6% f ollowing the conflict. Despite localized declines in Black Sea activity , the global network e xhibits topological e xpansion and improv ed robustness under simulated random attacks, while targeted disr uptions continue to generate significant perf or mance degradation. A cross these studies, vulnerability is ex amined through multiple anal ytical lenses, including multiple x node remo val, empirical do wntime measurement, sys tem-lev el shock compar ison, climate-induced disr uption simulation, and geopolitical per turbation anal ysis. Mar itime networks are g enerally characterized by hierarchical concentration and hea vy -tailed connectivity , and disruption effects are conditioned by nodal centrality and inter -la yer interactions. Adaptiv e responses operate within constraints imposed b y exis ting concentration patterns. 2.3 Flow Concentration and Distributional Metrics Be y ond topological connectivity and disr uption modeling, an impor tant strand of the literature e valuates maritime systems using market concentration and flow -allocation metrics. In liner shipping, industr y concentration is commonly assessed using the Herfindahl–Hirschman Index (HHI) and concentration ratios (CR 𝑘 ). Merk and T eodoro [ 20 ] demonstrate that traditional HHI calculations may underes timate effectiv e concentration when car r ier consor tia are taken into account. For instance, on the N or ther n Europe–North America corr idor , the conv entional HHI was around 1500, whereas the modified HHI (MHHI), accounting f or interlink ed consor tia, approaches or ex ceeds the 2500 threshold typically associated with high concentration. Haralambides [ 21 ] discusses the prog ressiv e consolidation of liner shipping into three global alliances, highlighting increasing capital concentration and coordinated capacity management. The coe xistence of larg e v essel deployment and alliance coordination implies that ser vice supply and corr idor dominance are shaped b y coordinated capacity allocation rather than atomistic competition. At the por t-sy stem lev el, concentration dynamics e xhibit spatial variability . Notteboom [ 22 ] show s that, although the European container por t sy stem e xper ienced phases of deconcentration between 1985 and 2008, container handling remained s tr ucturally more concentrated than other cargo segments. The coe xistence of multi-port gate wa y regions and persistent cargo concentration suggests that competitive interaction does not necessarily eliminate dominance patterns. 6 Empirical applications of HHI to regional por t sy stems fur ther illustrate distributional asymmetr ies. Nguy en et al. [ 23 ] calculate HHI values f or Southeast Asian container por ts and report a score of appro ximately 0.57 in 2017, indicating high concentration despite emerging competitiv e dynamics. Their results sho w that market-share redis tr ibution does not necessar ily lead to low er concentration lev els. In non-linear conte xts, Lee et al. [ 24 ] emplo y HHI, location quotients, and shift-share analy sis to identify deconcentration trends in Korean bulk por ts dr iv en b y cargo reallocation. Concentration indices are theref ore capable of captur ing both dominance and structural rebalancing processes. Connectivity metr ics also capture concentration effects indirectly . F ugazza and Hoffmann [ 25 ] show that the absence of a direct maritime connection is associated with e xpor t reductions between 42% and 55%, and that each additional transshipment is link ed to roughly a 40% decline in bilateral e xpor t value. These findings indicate that the distribution of service connections across cor r idors materially affects trade performance. A cross these studies, HHI, concentration ratios, and related distributional indicators are used to quantify dominance, competitiv e structure, and allocation asymmetr y . Unlik e purely topological measures, these indices e xplicitly model the dis tr ibution of capacity or traffic shares across nodes or routes. The literature on mar itime systems theref ore spans three anal ytical domains: topological structure, disruption resilience, and market concentration. While netw ork science captures integ ration and modularity , and resilience s tudies model shock propag ation, concentration metr ics quantify ho w traffic or capacity is distributed across cor ridors and nodes. These approaches are conceptually related but anal ytically distinct. Connectivity does not necessar il y imply dispersion, and resilience does not preclude structural dominance. The coe xistence of small-w orld integration with hea vy-tailed capacity allocation sugg ests that flow concentration can be inter preted as a distinct structural dimension within mar itime sy stems. T aken tog ether , exis ting research sugg ests that maritime container sys tems are hierarchicall y organized, dynamicall y adaptiv e, and frequently concentrated in terms of capacity and traffic allocation. T opological indicators rev eal integration patter ns, resilience analy ses highlight sys temic sensitivities, and concentration metrics quantify dominance structures. These anal ytical traditions provide the conceptual f oundation f or e xamining ho w container flow s are distributed across routes and nodes within bounded mar itime sys tems. 3 Anal ytical Frame w ork This study represents the mar itime container sy stem as a set of FFE-w eighted categor ical distributions defined ov er routes, or igin nodes, destination nodes, and industrial sectors. This representation treats container flo ws as dis tr ibutions of v olume across discrete categor ies, allo wing str uctural properties such as concentration, dispersion, and asymmetry to be quantified in a consistent manner . All metr ics are computed within a unified probabilistic framew ork, in which total FFE volumes are normalized into share distributions that sum to one. This normalization enables the application of concentration and div erg ence measures defined on probability distributions. Let 𝑟 inde x individual shipment records, and let 𝑖 ∈ { 1 , . . . , 𝑛 } denote a category inde x (e.g., a route, port, or industry), where 𝑛 is the total number of categories. The total FFE mass associated with category 𝑖 is defined as 𝑤 𝑖 = 𝑟 ∈ 𝑖 FFE 𝑟 , (1) 7 where 𝑤 𝑖 represents the total container v olume assigned to category 𝑖 . The cor responding share is defined as 𝑠 𝑖 = 𝑤 𝑖 Í 𝑛 𝑗 = 1 𝑤 𝑗 , 𝑛 𝑖 = 1 𝑠 𝑖 = 1 , (2) where 𝑠 𝑖 represents the proportion of total FFE associated with category 𝑖 . The v ector s = ( 𝑠 1 , . . . , 𝑠 𝑛 ) theref ore describes the dis tr ibution of container flo ws across categories, while w = ( 𝑤 1 , . . . , 𝑤 𝑛 ) represents absolute v olumes. All subsequent measures are defined primar ily as functions of the share v ector s , and, where required, of the cor responding mass v ector w or its ordered f or m. 3.1 Concentration Structure R esearch Questions 1 , 2 , and 3 require quantifying how container flo ws are distributed across categor ies. This subsection introduces complementary measures that capture different aspects of concentration and dispersion. 3.1.1 Herfindahl–Hirschman Inde x The Her findahl–Hirschman Inde x provides a summary measure of how s trongly flo ws are concentrated in a small number of categories. HHI = 𝑛 𝑖 = 1 𝑠 2 𝑖 . (3) The HHI [ 26 , 27 ] increases as larg er shares are assigned to a smaller number of categories. Higher v alues indicate strong er concentration, meaning that a limited set of routes, por ts, or industries accounts f or most of the total container v olume. Low er values indicate a more e ven distr ibution across categories. 3.1.2 Concentration Ratios Concentration ratios pro vide a direct wa y to assess the contribution of the larges t categor ies. Let 𝑠 ( 1 ) ≥ 𝑠 ( 2 ) ≥ · · · ≥ 𝑠 ( 𝑛 ) denote shares sor ted in descending order . The 𝑘 -concentration ratio is defined as CR 𝑘 = 𝑘 𝑖 = 1 𝑠 ( 𝑖 ) . (4) This measure represents the cumulativ e share of the 𝑘 larg est categories. For e xample, CR 3 captures the share accounted f or b y the three larg est routes or por ts, making it useful f or identifying dominance b y a small subset of categories. 3.1.3 Shannon Entrop y While HHI emphasizes dominance, entrop y captures the extent to which flo ws are spread across categor ies. 8 𝐻 ( s ) = − 𝑛 𝑖 = 1 𝑠 𝑖 ln 𝑠 𝑖 , (5) with normalized form [ 28 ] 𝐻 norm = 𝐻 ( s ) ln ( 𝑛 ) . (6) Entrop y increases as the distribution becomes more e ven across categories. In this context, higher entrop y indicates div ersification, whereas low er entrop y indicates concentration. This measure complements HHI b y providing an alter nativ e perspective on the same dis tr ibution. 3.1.4 Gini Coefficient The Gini coefficient captures inequality in the dis tr ibution of v olumes across categor ies. Let 𝑤 ( 1 ) ≤ · · · ≤ 𝑤 ( 𝑛 ) denote ordered categor y totals, and let 𝐶 𝑖 = Í 𝑖 𝑗 = 1 𝑤 ( 𝑗 ) denote cumulativ e v olumes. The Gini coefficient is computed as [ 29 , 30 ] 𝐺 = 𝑛 + 1 − 2 Í 𝑛 𝑖 = 1 𝐶 𝑖 𝐶 𝑛 𝑛 . (7) Higher v alues of 𝐺 indicate greater inequality , meaning that a small number of categories account for a larg e share of total v olume, while many categories contr ibute onl y marginall y . 3.2 Directional Structural Asymmetry R esearch Question 4 e xamines whether impor t and e xpor t flo ws e xhibit different distributional structures. This requires comparing tw o distr ibutions defined o v er the same set of categor ies. 3.2.1 Jensen–Shannon Distance The Jensen–Shannon distance pro vides a symmetr ic measure of div ergence between tw o distributions. Let p and q denote impor t and e xpor t share v ectors. Define m = p + q 2 . (8) The Jensen–Shannon distance is defined as [ 31 – 33 ] JSD ( p , q ) = 1 2 𝐷 KL ( p ∥ m ) + 1 2 𝐷 KL ( q ∥ m ) . (9) This measure tak es v alues between zero and one. V alues close to zero indicate similar distributions, while larg er values indicate g reater structural differences betw een impor t and export configurations. 9 3.2.2 Rank Association In addition to distributional differences, it is useful to assess whether the relative ordering of categor ies is preserved. Spearman’ s 𝜌 [ 34 ] and Kendall’ s 𝜏 [ 35 ] are computed on aligned share vectors. These statistics measure the degree to which categories retain their relative ranking across impor ts and exports. 3.3 Industry Directional Orientation T o assess whether specific industries are more e xpor t-or iented or impor t-or iented, a relativ e measure is required. 𝑅 𝑖 = ln 𝑠 e xpor t 𝑖 + 𝜀 𝑠 import 𝑖 + 𝜀 ! , (10) where 𝑠 e xpor t 𝑖 and 𝑠 import 𝑖 denote the share of industry 𝑖 in e xpor ts and impor ts, respectivel y , and 𝜀 > 0 pre vents division b y zero. P ositive v alues indicate e xpor t or ientation, while negativ e values indicate impor t orientation. 3.4 T emporal Structural Stability R esearch Question 5 e xamines ho w the str ucture of container flo ws e v olv es ov er time. For each y ear 𝑡 , distributions s 𝑡 are cons tr ucted. Structural chang e is measured relativ e to a base y ear 𝑡 0 as Drift 𝑡 = JSD ( s 𝑡 0 , s 𝑡 ) . (11) This measure captures chang es in the distribution of flo ws across categories independently of total volume chang es. Spear man correlations between adjacent y ears are also used to assess the persistence of categor y rankings o v er time. 4 Data Collection and Structure This study is based on shipment-le vel customs records cov er ing the period 2019–2022. The data w ere obtained from the Mauritanian Customs A dministration in spreadsheet f or mat and consist of two direction-specific datasets (impor ts and e xpor ts). Each observation corresponds to a declared container ized shipment measured in FFE, which serv es as the quantitativ e basis f or all subsequent analy sis. T o ensure analytical consistency , the ra w datasets were harmonized into a unified structure. Column names w ere standardized across import and e xpor t files to allo w consistent inter pretation of variables. Onl y records containing all required analytical fields w ere retained. T e xtual variables were nor malized by tr imming whitespace and con verting v alues to uppercase. Empty and null-like entr ies were treated as missing values. The v ar iables Y ear and FFE were con v er ted to numer ic f or mat. Records with missing required fields or in v alid numer ical v alues were remov ed. Zero-volume observations w ere e xcluded, and no imputation or dis tr ibutional smoothing procedures w ere applied. Full-ro w duplicate obser v ations were not remo ved, as no unique shipment identifier is av ailable to distinguish tr ue duplicates from valid repeated records. All observations are retained to preser v e the structure of the or iginal dataset. 10 For analytical consistency , or igin and destination nodes were defined symmetr icall y across trade directions. For impor ts, the port of loading and port of discharg e were mapped to Origin_Node and Destination_N ode , respectiv ely . For e xpor ts, the export loading por t and place of delivery were mapped in an analogous manner . The cleaned datasets w ere then concatenated into a unified shipment-lev el dataset. Each shipment is associated with a mar itime service cor r idor classification recorded in customs documen- tation. These route codes correspond to predefined liner shipping cor ridor categor ies, summar ized in T able 1 . T able 1. Mar itime service route classification R oute Service Descr iption W1 Europe – W est Africa W2 Middle East – W est Africa W3 Asia – W est Africa (via Suez Canal) W4 Americas – W est Afr ica W5 South/East Africa – W est Africa X6 Intra- Afr ica / Shor t Sea Figure 1 provides a schematic representation of these route categories. The figure illustrates the geographic orientation of the route tax onomy and does not represent observ ed flow s. Figure 1. Schematic representation of the main mar itime route classes. Further more, Figure 2 presents the most activ e observed cor ridors in the dataset, complementing the route classification with an empirical visualization. It is important to highlights that a small number of obser vations are labeled as “UNKN O WN” in the route field (six records totaling 5.5 FFE). In addition, tw o impor t obser v ations (totaling 1.5 FFE) repor t T angier 11 Med as the por t of discharg e while Maur itania is recorded as the delivery countr y . These cases represent a negligible share of total v olume and are retained without modification. Figure 2. Most active impor t and e xpor t cor r idors (2019–2022). T able 2 summar izes the core variables used in the analy sis. T able 2. Core v ar iables and definitions V ar iable Definition Y ear Calendar y ear (2019–2022) Direction IMPOR T or EXPOR T R oute Maritime cor r idor classification Origin_Node P or t of loading Destination_N ode P or t of discharg e or deliv er y FFE Shipment v olume (weight variable) Industry Sector classification Commodity Declared commodity All data preparation and computations were conducted in Python using pandas , NumPy , SciPy , and visualization using matplotlib and seaborn. 5 Exploratory Data Analy sis The dataset contains 105,686 shipment-le vel obser vations co vering the period 2019–2022. Eac h record represents a containerized mo vement measured in FFE. The variables describe shipment timing, trade direction, maritime route classification, or igin and destination nodes, industrial categor y , and shipment v olume. Directional composition is unev en, where 92,146 obser v ations cor respond to impor ts and 13,540 to e xpor ts. These counts represent shipment frequency and do not reflect v olumetr ic shares. 12 5.1 Distributional Properties of Shipment V olumes T able 3 repor ts descr iptiv e statis tics of shipment-lev el FFE. The median shipment size equals 1 FFE, while the maximum reaches 184 FFE. The mean (2.24) ex ceeds the median, and the standard de viation (4.59) reflects dispersion in shipment sizes. Most obser v ations are concentrated at low v alues, with fe wer high-v olume shipments. T able 3. Shipment-Lev el FFE Distribution Statis tic V alue Count 105,686 Mean 2.23997 Std. Dev . 4.59360 Minimum 0.0868 Median (50%) 1.0000 75th P ercentile 2.0000 Maximum 184.0000 Figure 3 presents the dis tr ibution of shipment sizes on a logarithmic frequency scale. The distribution is highl y sk ew ed to ward lo w FFE values, with a larg e concentration of obser vations at or near one container . As FFE increases, the frequency declines rapidly across sev eral orders of magnitude, indicating that high-v olume shipments occur infrequentl y relativ e to the bulk of observations. The visible upper tail e xtends to values abo v e 100 FFE, confir ming the presence of a limited number of high-volume shipments within the dataset. Figure 3. Distribution of FFE per Shipment (Log Frequency Scale) 5.2 T emporal Flo w Dynamics T able 4 repor ts annual total FFE b y direction. Impor t v olumes increase from 41,678.5 FFE in 2019 to 46,778.5 FFE in 2021, f ollow ed b y a decrease to 45,215.5 FFE in 2022. Expor t v olumes decrease from 16,741.0 FFE in 2019 to 12,919.5 FFE in 2022. The magnitude of impor t flo ws ex ceeds export flo ws in all y ears, with impor ts consistentl y representing the dominant share of total v olume. 13 T able 4. Annual T otal FFE b y Direction Y ear Expor t Impor t 2019 16,741.0 41,678.5 2020 14,579.5 44,700.0 2021 14,121.0 46,778.5 2022 12,919.5 45,215.5 Figure 4 sho ws these patter ns. Impor t flo ws f ollow a rising trend betw een 2019 and 2021 and then decline slightl y , while e xpor t flo ws decrease more gradually ov er the entire per iod. The gap betw een impor t and e xpor t v olumes remains substantial and persistent across all y ears. Figure 4. Annual Container Flo w Dynamics (FFE) 5.3 Route Concentration Patterns T able 5 repor ts total FFE and shares by maritime route. The tw o larg est routes (W3 and W1) account for 38.16% and 35.77% of total FFE, respectiv ely . Combined, they represent appro ximately 73.9% of total v olume. The third-larg est route (W5) contributes 10.24%, increasing the cumulativ e share of the three leading routes to appro ximately 84.2%. The remaining routes individually account f or less than 10% of total FFE. T able 5. T op Mar itime R outes R oute T otal FFE Share W3 90,349.0 0.3816 W1 84,678.0 0.3577 W5 24,248.0 0.1024 W2 22,576.0 0.0954 W4 10,776.5 0.0455 X6 4,100.5 0.0173 UNKNO WN 5.5 0.0000 As e xplained in pre vious section, the categor y labeled “UNKN O WN” cor responds to six observations totaling 5.5 FFE and represents a negligible share of total v olume. 14 5.4 Industrial Composition T able 6 summar izes the distribution of flo ws across industr ial categor ies. The larg est categor y (Agr iculture and Fores tr y) accounts f or 17.1% of total FFE, f ollo wed b y “Industry not classified” (14.7%) and frozen fish and seaf ood (13.2%). The remaining categories contr ibute smaller shares, each belo w 11% of total v olume. T able 6. T op Industr ial Categor ies Industry T otal FFE Share Agriculture & Fores tr y 40,502.5 0.1711 Industry not classified 34,742.0 0.1468 Frozen Fish & Seaf ood 31,228.0 0.1319 Food & Bev erage 25,256.5 0.1067 Finished Manuf actur ing 15,739.5 0.0665 The descr iptiv e results sho w that shipment sizes are concentrated at low FFE v alues, total flo ws are dominated b y impor ts, route distributions are concentrated in a small number of cor r idors, and industrial activity is distributed across sev eral categor ies with varying shares. 6 R esults and Discussion This section answ ers the research questions by characterizing concentration, dependency , specialization, directional asymmetr y , and temporal stability in containerized mar itime sys tem described by the dataset. The focus here is on structural metr ics (concentration indices, div erg ence measures, and stability diagnostics) and on their interpretation in relation to netw ork dependency and diversification. 6.1 RQ1: R oute Concentration R oute concentration is e valuated using complementary concentration and inequality measures, including the HHI, concentration ratios (CR3, CR5), the Gini coefficient, and nor malized entropy . Container flow s are distributed across sev en route categor ies, but the allocation of v olume is unev en. T able 7. Route concentration metr ics (o v erall, imports, e xpor ts). Scope 𝑛 routes T otal FFE HHI CR3 CR5 Gini All 7 236,733.5 0.2956 0.8418 0.9827 0.5379 Impor ts 7 178,372.5 0.3255 0.8999 0.9807 0.5861 Expor ts 6 58,361.0 0.3445 0.9840 0.9998 0.5540 As sho wn in T able 7 for the combined sy stem, the HHI equals 0.296, indicating a moderate-to-high lev el of concentration. The three larg est routes account for 84.2% of total FFE (CR3 = 0.842), while the fiv e larg est routes account for more than 98% (CR5 = 0.983). The Gini coefficient (0.538) and normalized entrop y (0.722) jointly reflect a distribution in which most v olume is allocated to a limited number of routes, while the remaining categories contr ibute marginal shares. Directional results e xhibit differences in the structure of concentration. For impor ts, concentration is higher than in the aggregate sy stem (HHI = 0.325; CR3 = 0.900), indicating that a larg e share of impor t v olume is allocated to a small subset of routes. For e xpor ts, the HHI (0.345) is of similar magnitude, but 15 concentration ratios are subs tantially higher (CR3 = 0.984; CR5 ≈ 1), reflecting the smaller number of route categories and the allocation of nearl y all export v olume to the leading cor r idors. The relationship betw een HHI and concentration ratios differs across directions. While HHI captures the o v erall distr ibution of shares, concentration ratios reflect the cumulativ e dominance of the larg est routes. In the e xpor t case, the high CR values combined with a moderate HHI reflect both strong dominance of leading routes and the influence of a limited number of categories. T able 8. Route shares (all directions). R oute FFE Share W3 90,349.0 0.3816 W1 84,678.0 0.3577 W5 24,248.0 0.1024 W2 22,576.0 0.0954 W4 10,776.5 0.0455 X6 4,100.5 0.0173 UNKNO WN 5.5 0.0000 From the T able 8 the two larg est routes (W3 and W1) account for 38.2% and 35.8% of total FFE, respectiv ely . Combined, they account for approximatel y 73.9% of the total v olume. The addition of the third-larg est route (W5) increases the cumulative share of the three leading routes to 84.2%, consistent with the repor ted CR3 v alue. The categor y labeled “UNKNO WN” cor responds to six obser vations totaling 5.5 FFE and represents a negligible share of total v olume. Its inclusion does not affect the concentration measures. 6.2 RQ2: Node Dependency (Origin vs Destination) Node dependency is e xamined separately for (i) origin nodes (por ts of loading) and (ii) destination nodes (por ts of dischar ge), because each dimension represents a different str uctural role in the netw ork. A sy stem may contain many categor ies while still displa ying concentration if a limited subset of nodes accounts f or a larg e share of total v olume. As repor ted in T able 9 , or igin nodes are numerous ( 𝑛 = 609 ), while concentration remains lo w (HHI = 0.0539; CR3 = 0.3248). This indicates that flo ws are distributed across a broad set of or igin nodes. Ho we v er , the Gini coefficient is v er y high (0.9207), which sho ws that this distr ibution is highl y unequal: a limited g roup of or igins contr ibutes a substantial share of total volume, whereas man y other or igins account f or only marginal shares. The nor malized entrop y value (0.6033) is consistent with this patter n. T able 9. Or igin-node dependency metrics (o verall, imports, e xpor ts). Scope 𝑛 or igins T otal FFE HHI CR3 CR5 Gini All 609 236,733.5 0.0539 0.3248 0.4395 0.9207 Impor ts 609 178,372.5 0.0338 0.2548 0.3475 0.9013 Expor ts 2 58,361.0 0.5672 1.0000 1.0000 0.1833 The directional results in T able 10 rev eal a clear structural contrast. Impor t flo ws are spread across a larg e 16 number of or igin nodes, which e xplains the low concentration v alues. By contrast, e xpor t flo ws originate from onl y two nodes, and this limited number of categories mechanicall y produces high concentration ratios. Ov erall, the origin-node distribution is characterized by a small number of high-v olume por ts f ollo wed b y a long tail of low er -v olume nodes. T able 10. T op or igin nodes (all directions). Origin node FFE Share NOU ADHIBOU 39,997.5 0.1690 NOU AK CHOTT 18,600.5 0.0786 NINGB O 18,291.0 0.0773 LAS P ALMAS 13,752.0 0.0581 ANTWERP 13,414.5 0.0567 JEBEL ALI 9,362.0 0.0395 VLISSINGEN 7,158.0 0.0302 SHANGHAI 5,126.5 0.0217 R OTTERD AM 4,624.5 0.0195 QINGD A O 4,053.5 0.0171 Destination nodes displa y a different configuration. Although the number of categor ies remains relativel y larg e ( 𝑛 = 282 ), concentration is substantiall y higher (HHI = 0.4845; CR3 = 0.7844), indicating that a larg e share of total v olume is directed tow ard a limited number of destination nodes. T able 11. Destination-node dependency metrics (o v erall, imports, e xpor ts). Scope 𝑛 destinations T otal FFE HHI CR3 CR5 Gini All 282 236,733.5 0.4845 0.7844 0.8373 0.9664 Impor ts 3 178,372.5 0.8477 1.0000 1.0000 0.6113 Expor ts 281 58,361.0 0.0533 0.3394 0.4382 0.8896 T w o obser v ations, totaling 1.5 FFE, record T angier Med as the por t of discharg e while Mauritania is listed as the delivery country . Because these cases represent a negligible share of total v olume, they are retained without modification. The directional breakdo wn fur ther sho ws that imports are concentrated in a v er y small number of destination nodes, whereas e xpor ts are distributed across a much broader set of f oreign destinations and theref ore exhibit low er concentration. 17 T able 12. T op destination nodes (all directions). Destination node FFE Share NOU AK CHOTT 163,564.5 0.6909 NOU ADHIBOU 14,838.5 0.0627 HU ANGPU 7,279.5 0.0308 ABID J AN 6,479.5 0.0274 LAS P ALMAS 6,050.0 0.0256 DOU ALA 3,325.5 0.0140 TEMA 2,441.0 0.0103 SHANGHAI 2,432.0 0.0103 JIAXING 2,223.5 0.0094 SHID A O 1,702.0 0.0072 T aken together , the compar ison betw een or igin and destination str uctures points to a clear directional asymmetry: or igin nodes are more dispersed in terms of categories, whereas destination nodes are more concentrated in terms of volume allocation. 6.3 RQ3: Industry Specialization Industry specialization is assessed by appl ying concentration measures to the distribution of flow s across industrial categories, with impor ts and e xpor ts ev aluated separately . The aggregate results, reported in T able 13 , provide a firs t ov er vie w of the str uctural differences betw een inbound and outbound flo ws. T able 13. Industry concentration metr ics (o verall, impor ts, exports). Scope 𝑛 industries T otal FFE HHI CR3 CR5 Gini All 35 236,733.5 0.0960 0.4498 0.6229 0.6996 Impor ts 35 178,372.5 0.0965 0.4610 0.6155 0.7010 Expor ts 21 58,361.0 0.3520 0.8592 0.9657 0.8555 At the aggregate lev el, industry concentration remains lo w (HHI = 0.0960), indicating that total flow s are distributed across a relativ ely broad set of categor ies. As sho wn in T able 13 , impor ts f ollo w an almost identical pattern (HHI = 0.0965; CR3 = 0.4610), which confirms a div ersified allocation of v olume across industries. Expor ts, ho w ev er , e xhibit a structurally different configuration. According to T able 13 , the e xpor t HHI increases to 0.3520, while the concentration ratios r ise shar pl y (CR3 = 0.8592; CR5 = 0.9657). This combination of high HHI and high concentration ratios indicates that e xpor t activity is concentrated within a limited subset of industries rather than being broadly dis tr ibuted. The Gini coefficient (0.8555) reinf orces this inter pretation b y confir ming a high degree of inequality across e xpor t categor ies. T aken tog ether, the contrast betw een impor ts and exports reflects differences in how volume is allocated across industry categor ies, rather than differences in the number of categories alone. A dditional insight is obtained b y ex amining the directional composition of flo ws, as reported in T able 14 . 18 T able 14. Selected industry shares (imports vs exports). Industry Impor t share Export share Frozen Fish & Seaf ood 0.0002 0.5345 Agriculture & Fores tr y 0.1593 0.2072 Metal in Secondary Form 0.0183 0.1175 Industry not classified 0.1634 0.0960 Food & Bev erage 0.1384 0.0098 The directional profile in T able 14 highlights a pronounced asymmetr y between impor ts and exports. Frozen Fish & Seaf ood alone accounts f or more than half of export v olume (53.45%), while contr ibuting onl y a negligible share of imports, indicating a strong specialization of e xpor t activity in this category . Metal in Secondary Form also sho ws a subs tantially higher share in exports relativ e to impor ts, fur ther suppor ting the presence of e xpor t-side concentration. In contras t, categories such as Food & Be v erage, machiner y , and manufactured goods e xhibit substantiall y higher shares in imports, indicating that inbound flo ws are more diversified in their indus tr ial composition. This div erg ence reinf orces the inter pretation der iv ed from the concentration metr ics. The category labeled “Industry not classified”, as sho wn in T able 14 , represents a non-negligible share in both directions. Because this category agg regates heterogeneous activities, it reflects a limitation in the source classification rather than a coherent industry g rouping. While concentration measures remain v alid f or the obser v ed distr ibution, the presence of this residual categor y introduces ambiguity in the inter pretation of the detailed industry structure. 6.4 RQ4: Import–Export Structural Asymmetry Structural differences betw een impor ts and e xpor ts are e valuated by comparing their distributions o ver routes, origin nodes, destination nodes, and industr ies using Jensen–Shannon dis tance (JSD) and rank cor relations. JSD is bounded betw een 0 and 1 (base 2), where higher values indicate greater div erg ence betw een distributions. The results, summar ized in T able 15 , pro vide a comparativ e view of asymmetr y across structural dimensions. R oute distributions exhibit a moderate le vel of div ergence (JSD = 0.4848), as repor ted in T able 15 . Rank cor relations are positiv e but not statisticall y significant (Spear man 𝜌 = 0 . 5714 , 𝑝 = 0 . 1802 ; Kendall 𝜏 = 0 . 5238 , 𝑝 = 0 . 1361 ), indicating that while some similar ity in ranking e xists, it is not s trong enough to establish a consistent order ing across directions. This sugges ts partial correspondence in route importance alongside differences in relativ e shares. In contrast, node distributions display the highest le vels of div ergence. As sho wn in T able 15 , origin-node distributions are nearl y maximally different (JSD = 0.9964), and destination-node distributions e xhibit a similarl y e xtreme lev el of diver gence (JSD = 0.9985). The associated rank cor relations are close to zero and not s tatistically significant f or both origin and destination nodes, indicating that node rankings are larg ely unrelated between imports and exports. This patter n reflects a structural separation in the sets of activ e nodes across directions. Industry distributions also exhibit subs tantial diver gence (JSD = 0.7511), although their structure differs from that of nodes. According to T able 15 , industr y shares sho w strong positiv e and s tatisticall y significant 19 rank cor relations (Spearman 𝜌 = 0 . 6610 , 𝑝 = 1 . 5 × 10 − 5 ; Kendall 𝜏 = 0 . 5186 , 𝑝 = 3 . 0 × 10 − 5 ). This indicates that, despite differences in relative shares, the ordering of industries remains broadly consis tent across impor ts and e xpor ts. T able 15. Directional asymmetry metrics (imports v s e xpor ts). Category JSD (base 2) Spearman 𝜌 ( 𝑝 ) Kendall 𝜏 ( 𝑝 ) R oute 0.4848 0.5714 (0.1802) 0.5238 (0.1361) Origin node 0.9964 0.0565 (0.1639) 0.0468 (0.1631) Destination node 0.9985 − 0 . 0417 (0.4857) − 0 . 0348 (0.4824) Industry 0.7511 0.6610 ( 1 . 5 × 10 − 5 ) 0.5186 ( 3 . 0 × 10 − 5 ) T aken tog ether, the results in T able 15 sho w that the magnitude of div ergence v aries sy stematically across structural dimensions. Node distributions e xhibit near -maximal div ergence, reflecting fundamentally different sets of activ e nodes across directions. Indus tr y distributions combine substantial div erg ence with strong rank association, indicating preser v ed ordering despite unequal shares. R oute distributions, by contrast, display lo wer div ergence and onl y partial correspondence, sugges ting a weak er f orm of s tr uctural similarity between imports and exports. 6.5 RQ5: T emporal Structural Stability T emporal stability is assessed b y trac king year ly concentration metr ics and b y measur ing distributional drift relative to a base y ear (2019) using JSD. The results are ev aluated across routes, origin nodes, destination nodes, and indus tr ies to identify differences in structural persistence o v er time. R oute concentration remains highl y stable ov er time, as shown in T able 16 . Annual HHI values vary within a nar ro w range, from 0.3034 in 2019 to 0.2953 in 2022, indicating minimal changes in the distribution of flo ws across routes despite small fluctuations in total v olume and the number of active routes. T able 16. Route concentration ov er time (all directions). Y ear HHI 𝑛 routes T otal FFE 2019 0.3034 7 58,419.5 2020 0.2936 7 59,279.5 2021 0.2948 7 60,899.5 2022 0.2953 6 58,135.0 Consistent with the concentration results, the cor responding JSD values remain lo w (0.076–0.095), confirming that route distr ibutions e xper ience onl y limited temporal dr ift relativ e to the base year . Origin-node distributions exhibit moderate temporal variation. As repor ted in T able 17 , HHI decreases from 0.0671 in 2019 to appro ximately 0.0502 in subsequent years, while the number of categories remains consistentl y high. 20 T able 17. Or igin-node concentration o ver time (all directions). Y ear HHI 𝑛 or igins T otal FFE 2019 0.0671 385 58,419.5 2020 0.0525 398 59,279.5 2021 0.0502 377 60,899.5 2022 0.0502 391 58,135.0 The decline in HHI indicates a shift tow ard a more dispersed allocation across or igin nodes. At the same time, distributional drift increases o ver time, with JSD r ising from 0 in 2019 to 0.250 in 2022. This increase is dr iv en primar ily b y impor t flow s (up to 0.283), whereas export or igin distr ibutions remain highl y stable (JSD ≈ 0.02–0.03). Destination-node distributions combine increasing concentration with measurable temporal dr ift. As sho wn in T able 18 , HHI r ises from 0.4321 in 2019 to appro ximately 0.5066 in 2022, while the number of categories declines from 183 to 149. T able 18. Destination-node concentration o ver time (all directions). Y ear HHI 𝑛 destinations T otal FFE 2019 0.4321 183 58,419.5 2020 0.4934 178 59,279.5 2021 0.5086 174 60,899.5 2022 0.5066 149 58,135.0 JSD v alues increase to 0.207 by 2022, indicating g ro wing div erg ence from the base-year distribution. This patter n differs by direction: import destinations remain highly stable (JSD below 0.02), whereas e xpor t destinations e xhibit substantiall y higher dr ift, reaching 0.395. Industry distributions display intermediate stability relativ e to routes and nodes. As repor ted in T able 19 , HHI remains within a nar ro w rang e (0.0932–0.1053), while the number of categor ies declines from 32 to 23 o v er the per iod. T able 19. Industry concentration ov er time (all directions). Y ear HHI 𝑛 industries T otal FFE 2019 0.1032 32 58,419.5 2020 0.0940 31 59,279.5 2021 0.0932 30 60,899.5 2022 0.1053 23 58,135.0 Despite the stability in concentration, JSD values remain within a moderate range (0.216–0.228), indicating persistent v ar iation in the relativ e shares of industries. This v ar iation is more pronounced for impor ts (up to 0.251) than f or e xpor ts (appro ximately 0.15–0.17). 21 T aken together , the results across T ables 16 – 19 indicate a clear hierarch y of temporal stability . Route distributions are the most stable, node distributions e xhibit greater v ar iation o v er time, and industr y distributions occup y an inter mediate position between these two e xtremes. 6.6 Synthesis The results pro vide a consistent s tr uctural character ization of Maur itania ’ s container ized maritime sy stem across routes, nodes, industries, and time, based on concentration and div erg ence measures. With respect to Research Question 1 , route distributions are concentrated, with HHI equal to 0.296 and the three larg est cor r idors accounting for appro ximately 84.2% of total FFE. This indicates that flo w allocation is org anized around a limited number of dominant routes, which f or m the primar y structural backbone of the system. For Researc h Question 2 , node structures differ markedl y between or igins and destinations. Or igin nodes are numerous ( 𝑛 = 609 ) and w eakly concentrated (HHI = 0.054), while destination nodes e xhibit substantiall y higher concentration (HHI = 0.485), with the majority of flow s allocated to a small number of nodes. Directional decomposition show s an in version: impor ts combine dispersed or igins with highly concentrated des tinations, whereas e xpor ts combine concentrated origins ( 𝑛 = 2 , CR3 = 1) with dispersed destinations ( 𝑛 = 281 ). R egarding R esearch Question 3 , industry distributions e xhibit clear directional differences. Import flow s are broadl y distr ibuted (HHI = 0.096), while e xpor t flo ws are strongl y concentrated (HHI = 0.352), with the three larg est indus tr ies accounting f or appro ximately 85.9% of e xpor t volume. This concentration is driven b y a small set of dominant categories, including frozen fish and seafood. For Researc h Question 4 , import and export distributions div erg e across all structural dimensions. Div erg ence is highest f or node distributions (JSD ≈ 0.996 for origins and 0.999 f or destinations), indicating near -complete separation of node structures. Industry distributions also show substantial div ergence (JSD = 0.751), while route distributions exhibit lo wer div ergence (JSD = 0.485) and par tial rank cor respondence. Finall y , with respect to Research Question 5 , temporal patter ns differ across dimensions. R oute distributions remain stable ov er time (HHI ≈ 0.29–0.30; JSD < 0 . 10 ), while node dis tr ibutions e xhibit higher v ar iation, particularl y f or or igin nodes (JSD up to 0.250) and export destinations (JSD up to 0.395). Industry distributions show intermediate behavior , with relativel y stable concentration and moderate dr ift (JSD ≈ 0.21–0.23). T aken tog ether, the results show that the system is organized around stable cor ridor-le vel concentration, combined with direction-specific node configurations and persistent structural asymmetr y between impor ts and e xpor ts. 7 Conclusion This study pro vides a distribution-based character ization of Maur itania ’ s mar itime container sys tem ov er 2019–2022 using shipment-le vel FFE data. By representing routes, nodes, and industries as categor ical suppor ts of FFE-w eighted distributions, the anal ysis quantifies concentration, dependency , directional asymmetry , and temporal stability within a unified frame w ork. The results show that container flo ws are concentrated across a limited number of maritime cor ridors, with an o verall HHI of 0.296 and the three larg est routes accounting f or approximatel y 84% of total FFE. This concentration defines the primar y allocation structure of the system and remains stable o v er time. 22 Node structures differ sy stematicall y across directions. Origin nodes are numerous and w eakly concentrated (HHI = 0.054), while destination nodes e xhibit substantiall y higher concentration (HHI = 0.485), with the ma jor ity of flo ws allocated to a small number of nodes. Directional patter ns sho w an inv ersion: impor ts combine dispersed or igins with highly concentrated destinations, whereas e xpor ts combine concentrated origins with dispersed destinations. Industry distributions also differ betw een impor ts and e xpor ts. Impor t flo ws are broadl y distributed (HHI = 0.096), while e xpor t flo ws are strongl y concentrated (HHI = 0.352), with more than half of e xpor t v olume concentrated in a single categor y (frozen fish and seaf ood). Comparisons betw een impor t and e xpor t distributions confirm structural asymmetry across all dimensions. Div erg ence is most pronounced f or node distr ibutions (JSD ≈ 1), f ollo wed by indus tr ies (JSD = 0.751), while route distributions e xhibit low er diver gence (JSD = 0.485). These results indicate that asymmetr y arises pr imar ily from differences in node composition rather than from complete separation of cor r idor structures. T emporal analy sis indicates that concentration patter ns remain s table at the corr idor lev el (HHI ≈ 0.29–0.30; JSD < 0 . 10 ), while node distr ibutions par ticularl y e xpor t destinations (JSD up to 0.395) and import or igins e xhibit measurable variation o v er time. This sugges ts that structural chang e occurs primar ily through reconfiguration of node-le v el connections. The analy sis is subject to sev eral limitations. Firs t, the results are distributional and do not identify causal mechanisms or operational performance characteristics. Second, the presence of an “Industr y not classified” categor y reflects aggregation in sectoral coding, which may affect the measurement of specialization. Third, concentration measures depend on the categor ical resolution of routes, nodes, and industries as defined in the dataset. Future work may extend the anal ysis by refining categor y definitions, disaggregating residual industr y clas- sifications, and integrating external indicators of connectivity to conte xtualize the obser v ed distr ibutional patterns. Data A v ailability The shipment-le vel dataset used in this study contains propr ietar y cus toms inf or mation and is not publicl y a vailable. Researc hers ma y inquire about data access by contacting the cor responding author or the Mauritanian Customs Adminis tration, subject to applicable author ization and confidentiality requirements. Declarations Funding Not applicable. Conflicts of Interest The authors declare that there is no conflict of interest. Consent f or Publication All authors hav e revie w ed and appro v ed the final v ersion of the manuscr ipt and ha ve pro vided consent f or its publication. 23 Ethics Appro val Not applicable. R efer ences [1] Shu Guo, Jing Lu, and Y afeng Qin. “Anal ysis of the coupled spatial and temporal dev elopment characteristics of global liner shipping connectivity dr iv en b y trade”. In: Ocean & Coastal Manag ement 251 (2024), p. 107071. [2] A chilleas T santis, John Mangan, and R ober to P alacin. “T rade shoc ks and direct shipping connections: causal insights into network adaptability and supply chain resilience”. In: WMU Jour nal of Maritime Affairs (2026), pp. 1–33. [3] Alaattin Durmaz and Abdullah A çık. “Deter mining Growth Dr iv ers in Container Shipping: A Causality Analy sis Between Container Throughput and Liner Shipping Connectivity”. In: Acta Natur a et Scientia 5.2 (2024), pp. 136–149. [4] U nited Nations T rade and Dev elopment (UNCT AD). Review of Maritime T r anspor t 2024: Navig at- ing Maritime Chokepoints . Sty lus Publishing, LLC, 2024. [5] Mengqiao X u, Yifan Zhu, Kaishuo Liu, and Adolf KY Ng. “Assessing resilience of global liner shipping netw ork to tropical cy clones”. In: T r anspor tation Resear c h P art D: T ransport and Envir onment 131 (2024), p. 104189. [6] Jasper V erschuur, Elco E K oks, and Jim W Hall. “Systemic risks from climate-related disr uptions at por ts”. In: Natur e climate c hang e 13.8 (2023), pp. 804–806. [7] Meridiam. Nouakc hott P or t – Mauritania . W eb page. Accessed 28 Feb 2026. Mer idiam, 2025. url : https://www.meridiam.com/assets/nouakchott- port- mauritania/ . [8] UNCT ADstat. Maritime Profile — Mauritania . W eb database. Accessed 28 Feb 2026. U nited N ations Conf erence on T rade and Dev elopment (UN CT AD), N ot pro vided. url : https : / / unctadstat.unctad.org/CountryProfile/MaritimeProfile/en- GB/478/index.html . [9] César Ducr uet and Theo Notteboom. “The w orldwide mar itime netw ork of container shipping: spatial structure and regional dynamics”. In: Global netw orks 12.3 (2012), pp. 395–423. [10] Mengqiao X u, Qian Pan, Alessandro Muscoloni, Hao xiang Xia, and Carlo Vittorio Cannistraci. “Modular gate wa y-ness connectivity and s tr uctural core organization in maritime network science”. In: Natur e communications 11.1 (2020), p. 2849. [11] Lu Kang, W enzhou W u, Hao Y u, and F enzhen Su. “Global container por t netw ork linkages and topology in 2021”. In: Sensors 22.15 (2022), p. 5889. [12] Pisit Jar umaneeroj, Jorg e Bar nett La wton, and Mor ten Svindland. “An ev olution of the Global Container Shipping Netw ork: por t connectivity and trading community structure (2011–2017) P . Jarumaneeroj et al.” In: Maritime Economics & Logistics 26.2 (2024), pp. 283–306. [13] Da vid Guer rero, Lucie Letrouit, and Carlos P ais-Montes. “The container transpor t system dur ing Co vid-19: An analy sis through the pr ism of comple x netw orks”. In: T ransport P olicy 115 (2022), pp. 113–125. [14] César Ducruet. “Netw ork div ersity and mar itime flo ws”. In: Journal of T ransport Geog raphy 30 (2013), pp. 77–88. [15] Agus tina Calatayud, John Mangan, and R ober to Palacin. “V ulnerability of inter national freight flo ws to shipping network disr uptions: A multiple x network perspective”. In: T ransportation Resear c h P art E: Logistics and T ransportation Review 108 (2017), pp. 195–208. 24 [16] Jasper V erschuur, EE K oks, and JW Hall. “Port disr uptions due to natural disasters: Insights into por t and logistics resilience”. In: T ransportation r esearc h part D: transport and envir onment 85 (2020), p. 102393. [17] Theo Notteboom, Thanos P allis, and Jean-Paul R odrigue. “Disruptions and resilience in global container shipping and por ts: the CO VID-19 pandemic versus the 2008–2009 financial crisis”. In: Maritime Economics & Logistics 23.2 (2021), p. 179. [18] Mark Ching-P ong Poo and Zaili Y ang. “Optimising the resilience of shipping netw orks to climate vulnerability”. In: Maritime P olicy & Manag ement 51.1 (2024), pp. 15–34. [19] Lin Cong, Hengcai Zhang, Peixiao W ang, Chen Chu, and Jinzi W ang. “Impact of the Russia– Ukraine conflict on global mar ine netw ork based on massive v essel trajectories”. In: Remot e Sensing 16.8 (2024), p. 1329. [20] Olaf Merk and Antonella T eodoro. “Alternative approaches to measuring concentration in liner shipping”. In: Maritime Economics & Logistics 24.4 (2022), pp. 723–746. [21] Hercules E Haralambides. “Gigantism in container shipping, por ts and global logistics: a time-lapse into the future”. In: Maritime Economics & Logistics 21.1 (2019), pp. 1–60. [22] Theo E Notteboom. “Concentration and the f or mation of multi-por t gate wa y regions in the European container por t sy stem: an update”. In: Journal of transport g eogr aphy 18.4 (2010), pp. 567–583. [23] Phong Nha Nguy en, Su-Han W oo, Anthon y Beresford, and Stephen P ettit. “Competition, market concentration, and relativ e efficiency of ma jor container por ts in Southeast Asia”. In: Jour nal of T ransport Geog raphy 83 (2020), p. 102653. [24] T aehwee Lee, Gi-tae Y eo, and Vinh V Thai. “Changing concentration ratios and geographical patterns of bulk por ts: the case of the Korean w est coast”. In: The Asian Journal of Shipping and Logistics 30.2 (2014), pp. 155–173. [25] Marco Fugazza and Jan Hoffmann. “Liner shipping connectivity as determinant of trade”. In: Journal of Shipping and trade 2.1 (2017), p. 1. [26] Or ris C Her findahl. Concentration in t he steel industry . Columbia university, 1997. [27] Alber t O Hirschman. National pow er and the structure of f oreign trade . V ol. 105. Univ of Calif or nia Press, 1980. [28] Claude Elw ood Shannon. “A mathematical theory of communication”. In: The Bell syst em tec hnical journal 27.3 (1948), pp. 379–423. [29] Cor rado W Gini. “V ariability and mutability , contr ibution to the study of s tatistical distributions and relations”. In: Studi Economico-Giuridici della R. U niv ersita de Cag liari (1912). [30] Amar ty a Sen. On economic inequality . Oxf ord univ ersity press, 1997. [31] Solomon Kullbac k and Richard A Leibler. “On inf ormation and sufficiency”. In: The annals of mathematical statis tics 22.1 (1951), pp. 79–86. [32] Jianhua Lin. “Diver gence measures based on the Shannon entrop y”. In: IEEE T ransactions on Inf or mation theory 37.1 (2002), pp. 145–151. [33] Johan Ludwig William V aldemar Jensen. “Sur les fonctions con v ex es et les inégalités entre les v aleurs moy ennes”. In: Acta mathematica 30.1 (1906), pp. 175–193. [34] Charles Spear man. “The proof and measurement of association between tw o things.” In: (1961). [35] Maurice G Kendall. “A ne w measure of rank cor relation”. In: Biome trik a 30.1-2 (1938), pp. 81–93.
Original Paper
Loading high-quality paper...
Comments & Academic Discussion
Loading comments...
Leave a Comment