Feature Selection for Fault Prediction in Distribution Systems
While conventional power system protection isolates faulty components only after a fault has occurred, fault prediction approaches try to detect faults before they can cause significant damage. Although initial studies have demonstrated successful pr…
Authors: Georg Kordowich, Julian Oelhaf, Siming Bayer
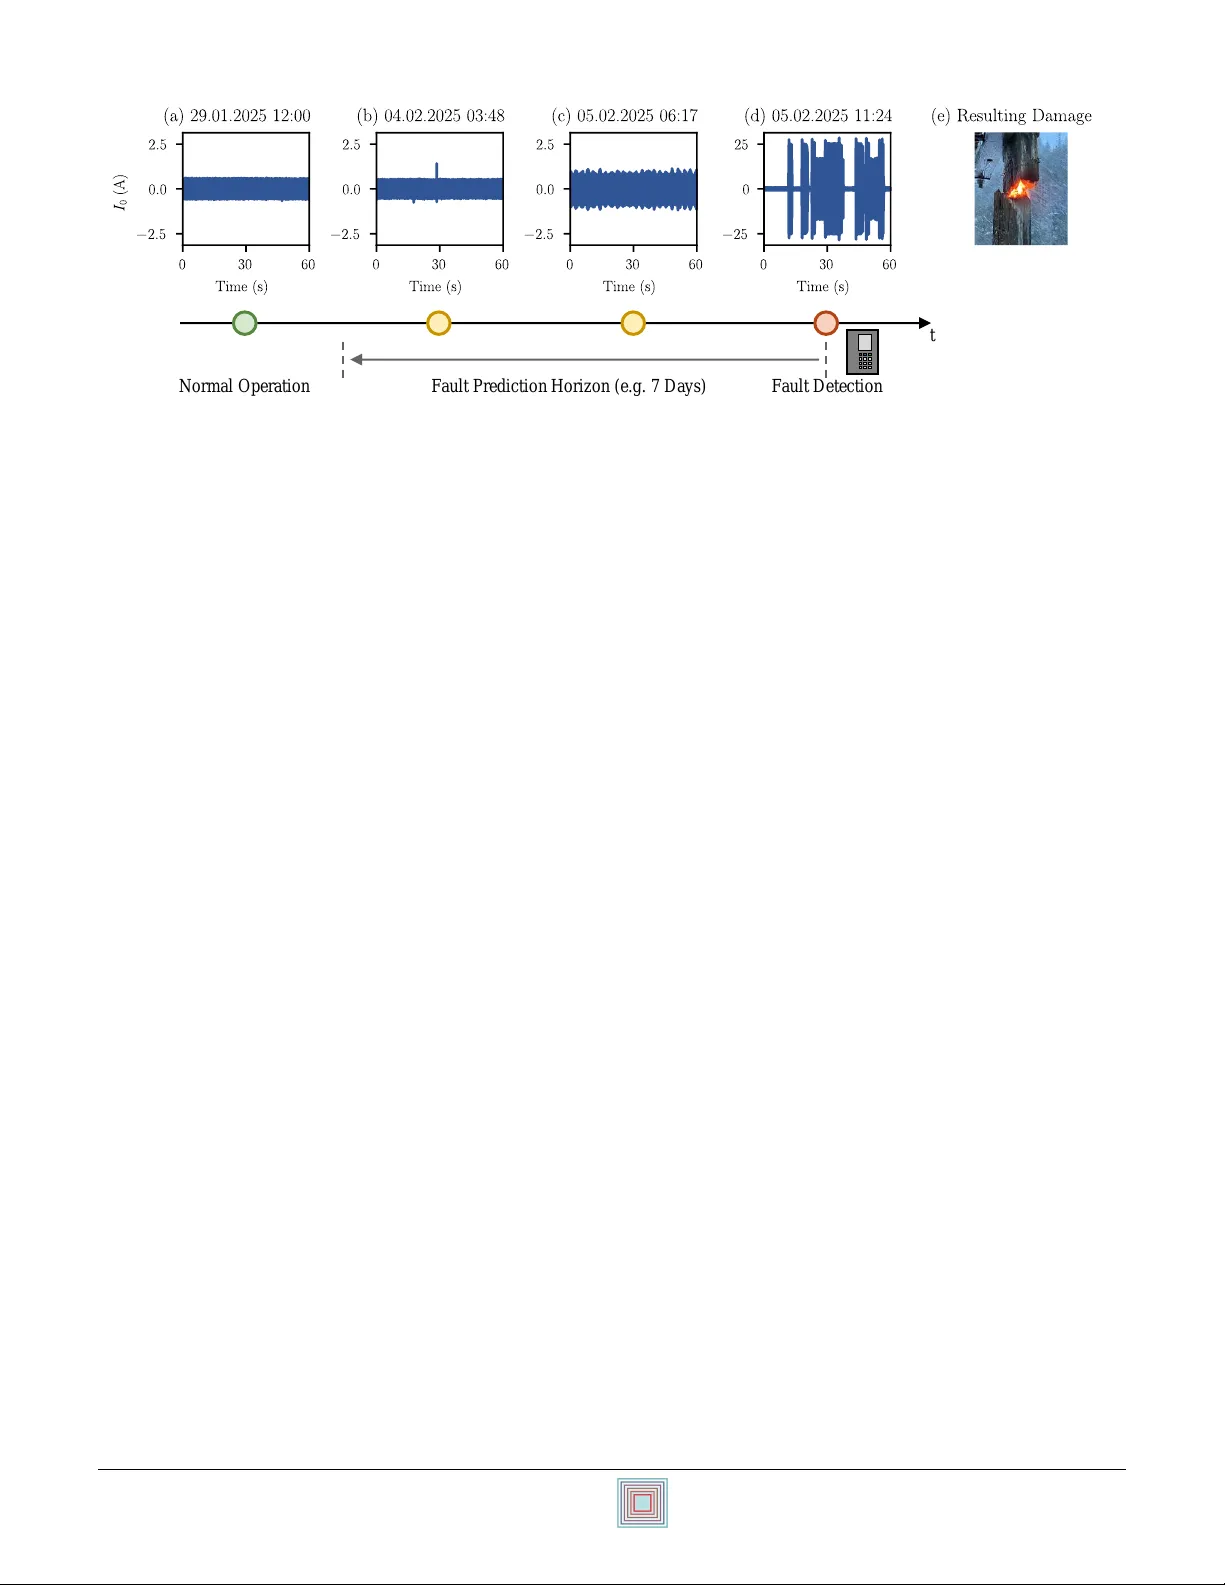
Feature Selection for F ault Prediction in Distrib ution Systems Georg K ordo wich ∗ , Julian Oelhaf ‡ , Siming Bayer ‡ , Andreas Maier ‡ , Matthias K ereit † , and Johann Jaeger ∗ ∗ Institute of Electrical Energy Systems, Friedrich-Alexander -Uni versit ¨ at Erlangen-N ¨ urnberg, Erlangen, Germany ‡ Pattern Recognition Lab, Friedrich-Alexander -Univ ersit ¨ at Erlangen-N ¨ urnberg, Erlangen, Germany † Siemens AG, Berlin, Germany georg.k ordowich@f au.de Abstract —While con ventional power system protection isolates faulty components only after a fault has occurr ed, fault pr ediction approaches try to detect faults bef ore they can cause significant damage. Although initial studies hav e demonstrated successful proofs of concept, development is hindered by scarce field data and ineffective featur e selection. T o address these limitations, this paper pr oposes a surrogate task that uses simulation data f or feature selection. This task exhibits a strong correlation (r = 0.92) with r eal-world fault pr ediction perf ormance. W e generate a lar ge dataset containing 20000 simulations with 34 ev ent classes and diverse grid configurations. From 1556 candidate featur es, we identify 374 optimal features. A case study on three substations demonstrates the effectiveness of the selected featur es, achieving an F1-score of 0.80 and outperforming baseline approaches that use frequency-domain and wavelet-based features. Index T erms —F ault prediction, feature extraction, machine learning, power system protection, smart grid I . I N T RO D U C T I O N A. F ault Pr ediction in P ower Systems Con ventional power system protection isolates faulty com- ponents only after a fault has occurred. This reactive ap- proach is suboptimal when precursor symptoms could enable proactiv e measures before fault de velopment causes significant destruction. Generally , these grid faults can be categorized into tw o groups: (i) unsystematic (unpredictable) faults and (ii) systematic (predictable) faults [1]. Unsystematic faults, caused by external influences such as exca vators, animals, or lightning, are inherently unpredictable. In contrast, systematic faults result from dev eloping physi- cal phenomena and can be predicted by analyzing electrical measurements. Examples include contaminated insulators that ev entually cause arc faults, degradation of cable insulation, or high-impedance faults caused by vegetation. Fault prediction (FP) aims to detect systematic faults be- fore the y cause significant damage by identifying precursor symptoms in voltage and current w av eforms. Due to the complexity of detecting subtle, v arying precursor symptoms and the limited immediate impact of misclassifications, recent research has focused on machine-learning approaches. ©2026. This manuscript version is made a vailable under the CC-BY -NC-ND 4.0 license https://creati vecommons.or g/licenses/by-nc-nd/4.0/ Submitted to the 24th Power Systems Computation Conference (PSCC 2026). Fig. 1 demonstrates the need for FP: In this case, a conduc- tor fell from an insulator onto a wooden pole, initially causing low-current arcing that e ventually led to ignition. Protection systems only detected this high-impedance fault after the pole was already b urning, ev en though precursor symptoms are observable more than 32 h earlier . The prediction horizon shown in Fig. 1 defines the temporal window during which a fault is considered ”imminent”. Ef fec- tiv e FP systems should predict high fault probabilities within, and lo w probabilities outside this horizon. FP approaches are trained by utilizing historical protection relay operations, defining the label as T rue , if measurements fall within the pre-fault prediction horizon and F alse , otherwise. The increasing data av ailability in smart grids facilitates these approaches [2]. This has prompted the IEEE PES W ork- ing Gr oup on P ower Quality and Data Analytics to call for further research on FP in a recent report [3]. B. Related Literatur e Recent re view papers by Dashti et al. [1], Imam et al. [4], and Haleem et al. [5], provide an ov ervie w of current trends in the literature. Five topics are loosely related to FP , namely partial discharge monitoring, predictive maintenance, power quality , e vent detection and incipient fault detection. Although a wide range of sensors could be used for FP , the high in vestment cost of deploying additional sensors presents a significant challenge [5]. Therefore, we focus on utilizing existing voltage and current measurements av ailable via IEC 61850 on the process bus. P artial dischar ge monitoring , re- quiring additional high frequency sensors, is therefore not considered in this work. One straightforward approach to pre vent outages is to employ pr edictive maintenance which uses lo w sample rate operational records to optimize long term maintenance sched- ules [6]. Howe v er , these approaches do not capture precursor symptoms in real-time measurements. FP is a more direct approach that exploits real-time sensor data to predict faults based on precursor symptoms. Although these anomalies are related to power quality phenomena, it is important to distin- guish FP as a separate task, as precursor symptoms of faults are not necessarily power quality concerns [3]. Event Detection approaches aim to detect anomalies in mea- surement data and subsequently try to classify the ev ent type. 24th Power Systems Computation Conference PSCC 2026 Limassol, Cyprus — June 8-12, 2026 Faul t D e te c tio n Faul t P re d ic tio n H o riz o n (e .g . 7 D a y s ) N o rm a l O p e ra tio n t Fig. 1: Zero-sequence current measurements from a 20 kV grid showing normal operation (a) and ex emplary pre-fault precursor symptoms (b-d). The fault was caused by a conductor falling onto a wooden pole, which then ignited (e). Previous literature includes approaches both on simulation and real-world data and a wide range of faults and operating events [7], [8]. One focus is the detection of high-impedance faults, as they are particularly difficult to detect with conv entional methods [9]–[11]. Howe ver , these approaches do not explicitly aim to relate these ev ents to subsequent faults. Therefore, Incipient fault detection (IFD) is the most closely related field to FP as its aim is to detect and classify early-stage anomalies and also map them to subsequent faults [12]. By classifying these early-stage anomalies, recent papers demon- strated IFD in cables [13], [14], ov erhead lines [15], [16], transformers [17], [18], or capacitors [19]. A disadvantage of IFD is its dependence on labeled training data: Each electric signature must be explicitly categorized into different classes (e.g., incipient fault , capacitor switching , inrush , etc.) [14]. Therefore, experts must either create highly detailed simula- tions co vering man y possible fault and operating scenarios, or manually re view and annotate large amounts of real-world field data. F ault pr ediction approaches a v oid the need for manual labeling by utilizing historical protection relay operations to directly estimate the probability of future faults without requir- ing intermediate classification of electrical signatures. Zhang et al. [20] and Skydt et al. [21] demonstrated the feasibility of such approaches on phasor-domain data. Li et al. [22] later showed that point-on-wav e measurements in combination with feature extraction are critical to improve the identification of precursor symptoms of faults. Balouji et al. [23] also stressed the importance of wa veform data and feature engineering. Chang and Li [24], [25] proposed a similar approach, that relies mainly on voltage wav eforms. While these approaches cannot predict unsystematic, inherently unpredictable faults, previously mentioned papers demonstrate their value in pre- venting outages and improving grid resiliency by predicting systematic, developing faults. C. Contribution Despite significant advancements in the field of fault predic- tion, se veral challenges remain. The scarcity of labeled field data is an obstacle because extensi ve experiments on limited data risks ov erfitting [5]. Additionally , despite the critical importance of feature extraction, as of now a div erse set of features is utilized by different studies and no comprehensiv e comparison or feature selection has been made [4]. The primary objective of this work is to advance FP in distribution systems. More specifically , we want to address the identified research gaps with the follo wing contributions: 1) Proposing and validating a surrogate task for FP on simulation data to av oid e xperiments on scarce field data. 2) A comprehensive feature selection for fault prediction. 3) A case study on real-world data from three substations to demonstrate the efficiency of the selected features. D. P aper Or ganization For this purpose, the paper is structured as follows: First, an ov erview of the FP pipeline is given in Sec. II. The creation of a simulation dataset we utilize for a surrogate task for feature selection is explained in Sec. III. After the feature selection and its results are discussed in Sec. IV, a case study on the real-world dataset is shown in Sec. V. Finally , the results are discussed in Sec. VI and a conclusion is drawn in Sec. VII. I I . O V E RV I E W O F A M AC H I N E L E A R N I N G B A S E D F AU L T P R E D I C T I O N P I P E L I N E The goal of FP is to improv e grid reliability by providing early warnings of developing faults before they can cause significant damage. For this purpose, we utilize the setup shown in Fig. 2, an adapted version from [23]–[25]. The data-processing pipeline for deployment and of fline training is largely identical. The main difference is offline training requiring feature selection and classifier training, while online prediction inv olves feature extraction and classifier inference. A. Data Aggr e gation V oltage and current measurements are digitized using exist- ing merging units and streamed on the process bus as sampled values as defined in IEC 61850-9-2. From the process b us, they are continuously recorded for online fault detection and 24th Power Systems Computation Conference PSCC 2026 Limassol, Cyprus — June 8-12, 2026 01001 Fe a t ur e E x t r a c t i o n Fe a t ur e S e lec t i o n C las si f i e r T r a i n i n g C las si f i e r Pr e dic t i o n W i n do w S e lec t i o n W i n do w S e lec t i o n M e r gi n g U n i t Pr o c e ss Bus (I E C 61 85 0 S a m p led V a l ues ) On l i n e D e p l o ym e n t O f f li n e T r a i n i n g C e n t r a l C o m p ut i n g & D a t a S t o r a ge Pl a t f o r m E x t e n si b le wi t h a d d i t i o n a l se n so rs D i ss o lve d Ga s A n a lys i s We a t her C o n dit i o n s … Fig. 2: Fault prediction pipeline during training (gray) and deployment (black). T raining is executed of fline on recorded data, while deployment processes data in real-time. The pipeline utilizes voltage and current measurements could also incorporate additional data from different sources. simultaneously stored in a database for offline training. For this study , this setup was implemented at three substations in different 22 kV distribution grids resulting in approximately 14 TB of 14 . 4 kHz measurements. Each discrete sample m in the dataset contains eight channels: three phase voltages, the zero-sequence voltage, three phase currents, and the zero- sequence current: m = h v a , v b , v c , v 0 , i a , i b , i c , i 0 i (1) The recorded measurements include diverse operating con- ditions and events as well as dif ferent fault types, for e xample three-phase, two-phase and single-line-to-ground faults. This study focuses on FP based on voltage and current measurements, but Fig. 2 shows that the pipeline can be extended using additional data sources from heterogenous sensors deployed in digital substations as described in [26]. B. W indow Selection As precursor symptoms of faults are typically intermittent, processing the entire data is both unnecessary and impractical. Therefore, prior approaches contain a pre-filtering step to differentiate between normal operation and anomalous win- dows [23]–[25]. Howe ver , such methods can require manual anomaly labeling for training [23] and risk excluding infor- mativ e precursor signals. In contrast, we simply identify the two most relev ant 500 ms windows per minute. While some of these windows will contain normal operation data that can slightly reduce the signal-to-noise ratio for the FP task, this approach eliminates manual labeling requirements and prev ents accidental filtering of precursor symptoms over extended periods of time. W e employ two methods to detect both continuous changes and short transients. For continuous changes, we adapt the approach of Oelhaf et al. [27] decomposing each channel into trend T , seasonal S , and residual e components. The most 0 1 2 3 4 5 Time (s) − 1 0 1 Amplitude (pu) Fig. 3: Identification of the most relev ant windo ws for an ex emplary signal, where the selected continuous window is marked in yellow and the transient windo w in red. relev ant 500 ms windo w is then selected by identifying the window with the maximum root mean square (RMS) of the normalized trend component, where normalization uses the mean µ c and standard deviation σ c of the trend T computed ov er one minute of data per channel c : X [ t ] = T [ t ] + S [ t ] + e [ t ] (2) W indo w Continuous = arg max w c ∈W RMS t ∈ w c T [ t ] − µ c σ c (3) W e detect transient peaks by selecting the window with the highest crest factor , adapting the threshold-based approach of Mousavi and Butler-Purry [13]: W indo w Transient = arg max w c ∈W max t ∈ w c | X [ t ] | RMS t ∈ w c ( X [ t ]) (4) This results in two windows of size (8 × 7200) , each containing eight channels with 500 ms of data. The window selection is visualized for an exemplary signal in Fig. 3. C. F eature Extraction Feature extraction has been identified as a critical step for FP in prior studies, making it the primary focus of this work. The main challenge for feature selection is the limited number of fault occurrences in real-world datasets, as extensi ve experiments directly on field data induces a high risk of overfitting. T o address this, we perform feature selection experiments using a surrogate task on simulation data. As a surrogate task we selected the classification of transient ev ents in power systems. This is based on the hypothesis that features, which are useful to dif ferentiate between different transient e vents are also useful to identify the subtle precursor symptoms of faults. Sec. IV details the feature selection methodology and validates this hypothesis, while Sec. III describes the simulation framework and ev ent scenarios. Crucially , simulation data is used exclusi vely for feature selection. The final FP classifier is trained solely on real- world data. This is beneficial as it av oids the risk of domain shift when using simulation data for training b ut deploying the model on real-world data. Here, domain shift refers to the differences between the source domain (simulation data) and the target domain (real-world data), which can lead to a significant amount of misclassifications and therefore render the ML model inaccurate. 24th Power Systems Computation Conference PSCC 2026 Limassol, Cyprus — June 8-12, 2026 C a b le2a C a b le2b C a b le1a C a b le1b O HL2a O HL2b OHL1 a OHL1 b 11 0 kV 20 kV I n rush LV I n r us h HV Lo a d S wi t c h AM Motor S t a r t O HL S wi t c h C a b le S wi t c h Ca p a c i t o r S wi t c h Fig. 4: Distribution grid model used for simulation data generation. Event b uses are dynamically connected to random network nodes during simulation. D. F ault Pr ediction Follo wing the feature extraction process described in Sec. IV, 374 features are extracted for each 500 ms window . T o give the subsequent classifier temporal context which captures the progression of precursor symptoms over time, we aggregate these features hourly using the minimum, maximum, mean, and standard deviation. This aggregation yields 1496 features per hour (374 features × 4 aggregations). The goal of FP is to estimate the probability of a fault occurring in the subsequent fault prediction horizon of a given window . Therefore, each hourly windo w is assigned a binary label y t ∈ { 0 , 1 } , where y t = 1 indicates a fault occurs within sev en days following the window , and y t = 0 denotes no fault within this period. This sev en-day prediction horizon is adopted from [23] and will be optimized in future work. For FP , we use a random forest classifier (RF), which has demonstrated robust performance and resilience to noise for similar classification tasks [22], [28], [29]. I I I . S I M U L A T I O N D A T A S E T T o address the scarcity of labeled field data for feature se- lection, we utilize the classification of v arious transient e vents as a surrogate task. For the surrogate task to be ef fectiv e, a wide variety of operating and fault scenarios must be included in the dataset to prevent overfitting on specific grids or e vents. Therefore, we utilize a custom simulation framework which is explained in detail in the following subsections. A. Grid Model Configuration The grid model, implemented in DIgSILENT’ s PowerF ac- tory [30], is loosely based on the European configuration T ABLE I: List of Simulated Events Event name Event description Inrush L V T rafo Inrush of a transformer connecting the 20 kV grid to a lower voltage le vel. Inrush HV T rafo Inrush of a transformer connecting the 20 kV grid to a higher voltage level. Load On Closing of a load-switch that connects a specified load to the network. Load Off Opening of a load-switch that disconnects the load from the network. Capacitor On Closing of a switch connecting a shunt capacitor . Capacitor Off Opening of a switch connecting a shunt capacitor . OHL On Energization of an OHL line segment. OHL Off De-Energization of an OHL line segment. Cable On Energization of a connected cable. Cable Off De-Energization of a connected cable. Motor Start Starting of an induction motor . 1PHG SHC Single-phase-to-ground short-circuit. 2PH SHC T wo-phase (line-line) short-circuit. 2PHG SHC T wo-phase-to-ground short-circuit. 3PH SHC Three-phase short-circuit. 1PHG HIF Single-phase high-impedance ground fault (HIF). Incipient Fault Single-phase incipient fault, characterized by high-impedances and self-e xtinguishing behavior . of the CIGRE medium-v oltage distribution network bench- mark system [31]. As sho wn in Fig. 4, the 22 kV netw ork consists of two overhead line (OHL) and two underground cable feeders, each supplying distributed loads. Switch states are randomized to generate di verse meshing configurations, increasing operational div ersity . Geometric conductor models are applied to OHLs to accurately represent phase asymmetries that induce zero-sequence voltages during normal operation. Cables are represented by standard symmetric models. This configuration ensures realistic representation of both radial and weakly meshed distribution grid. B. Event Simulation As IFD is the most closely related topic, we identified the 17 discrete event types listed in T ab . I from pre vious literature on IFD [14], [16], [32]. In each simulation one of the 17 ev ents is selected. These ev ents include all types of perma- nent faults with constant fault resistances up to 20 Ω (1PHG SHC, 2PH SHC, 2PHG SHC, 3PH SHC). Additionally , we simulate single-phase high-impedance faults with resistances up to 150 000 Ω as well as incipient faults characterized by self extinguishing behavior and arc characteristics, which are represented using Kizilcay’ s dynamic arc model [32], [33]. Additionally , we simulate various operating ev ents, which include energizing previously disconnected cables, o verhead lines, capacitors, loads, motors and transformers to higher and lower v oltage le vels. Additionally , all respective elements can be switched off after they hav e pre viously been connected to the grid. Switching e vents are simulated at any of the 20 kV buses, while faults occur at random locations along overhead lines or cables. C. P arameter Randomization T o pre vent overfitting to specific grids or ev ents, we sample relev ant parameters from uniform distributions. The selected 24th Power Systems Computation Conference PSCC 2026 Limassol, Cyprus — June 8-12, 2026 T ABLE II: Parameters used for Event Simulation Parameter T ypical range (unit) Source Load apparent po wer 0 . 05 MV A to 2 . 5 MV A [31] Load power factor ( cos ϕ ) 0 . 80 to 0 . 99 [31] Capacitor power rating 0 . 1 MV A to 2 . 0 MV A OHL conductor spacing 0 . 4 m to 2 . 0 m [31], [34] OHL tower height 8 m to 12 m [31], [34] OHL length 1 km to 25 km Cable length 0 . 5 km to 10 km T ransformer sat. reactance 1 . 0 pu to 2 . 0 pu [35] T ransformer sat. exponent 7 pu to 18 pu [36] T ransformer knee flux 1 . 05 pu to 1 . 25 pu [36] Petersen-coil tuning − 10 A to 10 A Direct-grounding resistance 0 . 1 Ω to 20 Ω Arc time constant ( τ ) 0 . 2 ms to 0 . 4 ms [32] Char . arc voltage ( u 0 ) 300 V to 4000 V [32] Char . arc resistance ( r 0 ) 0 . 010 Ω to 0 . 015 Ω [32] Short-circuit resistance 0 . 001 Ω to 20 Ω HIF resistance 20 Ω to 150 000 Ω [37] Incipient fault duration 0 . 002 s to 0 . 08 s [38] ranges for relev ant parameters are listed in T ab. II. Addition- ally , OHL conductors are randomly sampled from 12 types mentioned by Heuck et al. [39] and cables are randomly cho- sen from PowerF actory’ s 275 predefined 20 kV cable types. Parameters ranges for which no source could be found in literature are estimated. This approach is acceptable because slightly unrealistic parameters do not adversely af fect the surrogate task, as feature selection depends on relativ e signal characteristics rather than absolute parameter accuracy . Each parameter configuration is verified by executing a load flow . Non-con ver gent cases are discarded. D. Data Generation Pr ocess W e run 20000 electromagnetic transient simulations (EMT) using PowerFactory’ s Python API. Each simulation runs for 600 ms with a step size of 50 µ s . The initial 100 ms allows settling of initial transients, the final 500 ms are recorded. The recorded measurements are exported at a standard protection relay sampling rate of 4 kHz at two locations, namely at the beginning of OHL1a and Cable1a. These positions capture characteristics of transient ev ents both for cable dominated feeders and OHL-based feeders. Additional measurement lo- cations would likely result in redundant data. Each simulation result is labeled with the e vent type and the direction as downstream or upstream of the relay for classification in the surrogate task. Therefore, there are 34 distinct event classes in total. I V . F E A T U R E S E L E C T I O N W e utilize the library scikit-learn [40] for all subsequent experiments. Important hyperparameters are listed in T ab. A1 and T ab . A2 in the Appendix. A. Considered F eatur es As a starting point for the feature selection process, we iden- tified rele vant features from literature that are commonly used in the field of incipient fault detection and f ault prediction. T ABLE III: List of Features Description N F eat. x N Agg. N T ot. N Chann. Amplitudes of common harmonic components (1 st , 2 nd , 3 rd , 4 th , 5 th , 7 th , 11 th , and 13 th ) obtained by an FFT . 8x8 6 384 T otal harmonic distortion (THD) [32]. 1x8 6 48 Phase angle difference with respect to U a [23]. 1x8 6 48 Maximum, minimum, mean, standard deviation. 4x8 6 192 Ske wness, kurtosis, crest factor , form factor [41]. 4x8 6 192 Largest change between consecutiv e values. 1x8 6 48 Root mean square of the signal over one period [23]. 1x8 6 48 Magnitude of symmetric components of the signal ( U (0) , U (1) , U (2) , I (0) , I (1) , I (2) ). 1x6 6 36 Resistance and reactance [23]. 2x4 6 48 Activ e and reacti ve power [23]. 2x4 6 48 Autocorrelation, binned entropy , Fourier entropy , outlier ratio [42]. 4x8 32 Detail and approximate coef ficients of SWT [14]. 9x8 6 432 T otal 1556 W e implemented a subset of all identified features. Inclusion criteria require suf ficient documentation in the respectiv e paper and simplicity in implementation. An example for sufficient documentation is publishing explicit mathematical equations, while simplicity in implementation can be achie ved by us- ing existing open source libraries. Exclusion criteria are the necessity of pre-training (e.g., autoencoder-based features), excessi ve computational or implementation complexity . A summary of all selected features can be seen in T ab . III, where the column N F eat. x N Chann. gi ves the number of features times the channels for which the features are calcu- lated while the column N Agg. gi ves the number of aggregation functions applied to each feature. Most of these features are computed for each fundamental period indi vidually and are subsequently aggregated over the 500 ms window using stan- dard statistical measures, namely minimum, maximum, mean, standard deviation, skewness, and kurtosis. An exception are the detail and approximation coef ficients of the stationary wa velet transform (SWT) features implemented as described in [14]. These coefficients are calculated across the entire window and then aggregated using the pre viously mentioned statistical measures. The second exception are the features autocorrelation, binned entropy , and Fourier entropy , and the outlier ratio, which are computed directly for the complete window utilizing the library tsfr esh , which was developed for time series feature extraction [42]. Here, the outlier ratio measures the ratio of values which exceed 110% of the RMS value of the respectiv e channel. Most features are calculated for eight channels, namely the measured phase currents and voltages as well as the zero-sequence current and voltage. 24th Power Systems Computation Conference PSCC 2026 Limassol, Cyprus — June 8-12, 2026 0 . 0 0 . 2 0 . 4 0 . 6 0 . 8 1 . 0 Accuracy for Sim ulation T ask 0 . 0 0 . 2 0 . 4 0 . 6 0 . 8 1 . 0 F1 Score for Real-W orld T ask r = 0 . 92 Regression line Fig. 5: Performance of randomly selected sets of features on the simulation task and the real-world task. Exceptions are symmetrical component based features, which consist of six channels, as well as impedance and po wer based features which consist of four channels (one for each phase and one for the zero-sequence system). The features can be grouped into five categories: Frequency domain features (e.g., magnitude of harmonic components, THD, ...), basic statistic measures (e.g., maximum, minimum, ...), features commonly used in the context of power systems (e.g., RMS, resistance, reactance, ...), SWT based features as well as more adv anced features for which we utilized the time series library tsfr esh [42]. In total, this approach results in 1556 potential feature candidates. B. V alidation of Correlation between Surr ogate T ask and Real-W orld F ault Prediction T ask The usefulness of our approach critically depends on whether feature selection using simulation data translates to improv ed FP on real-world measurements. T o v alidate this, we ev aluated 1000 randomly selected feature subsets on both tasks independently using an RF classifier with five-fold cross-validation. Each subsets’ usefulness was judged by its accuracy on the simulation task, and its F1 score for the real-world FP task due to the class imbalance caused by the infrequent occurrence of faults. The results of this experiment can be seen in Fig. 5, which demonstrates a strong correlation ( r = 0 . 92 , p < 1 e − 10 ) between feature subset performance on the simulation-based surrogate task and real-world FP ef fectiv eness. This high Pearson correlation coefficient confirms that features opti- mized for the surrogate task ef fectiv ely identify precursor symptoms in field measurements. The near-linear relationship demonstrates that simulation-based feature selection accurately predicts real-world utility , eliminating the need for extensi ve experimentation on scarce field data. C. F eature Selection Pr ocess W e select a subset of the candidate features based on recur- siv e feature elimination with 5-fold cross-validation (RFE). 0 . 000 0 . 005 0 . 010 0 . 015 Importance Score W av. d8 ( I ( abc ) , skew.) arg ( I ( abc ) ) (std.) U (1) (skew.) Mean U ( abc ) (skew.) Mean I ( abc ) (skew.) U (1) (kurt.) W av. d4 ( U (0) , kurt.) I (2) (max.) arg ( U ( abc ) ) (mean) Mean U ( abc ) (skew.) W av. d8 ( I ( abc ) , skew.) W av. d7 ( I ( abc ) , skew.) I (2) (mean) W av. d3 ( U (0) , kurt.) I (1) (skew.) W av. d6 ( I ( abc ) , skew.) W av. d8 ( I ( abc ) , skew.) W av. d7 ( I ( abc ) , skew.) U (2) (max.) I (2) (std.) U (2) (mean) U (2) (std.) I (1) (std.) U (1) (std.) W av. d7 ( I ( abc ) , skew.) Fig. 6: Feature importance scores based on mean impurity decrease of the top 25 features. The signal type (e.g., I abc for one of the phase currents, U (0) for zero-sequence voltage) and the aggregation function are listed where applicable. For this purpose, we utilize scikit-learn’ s implementation, which is based on the process proposed by Guyon et al. [43]. During this process, the chosen RF classifier is trained and tested for each of the cross-v alidation splits. A score, namely the mean accurac y across all five folds is calculated and is recorded. Subsequently , RFE removes the least discriminativ e n features, determined by the RF’ s feature importance av- eraged across all five cross-validation splits. Here, n refers to the step size, which we chose to be one. This process is repeated recursiv ely until no features to remove are left. Finally , the optimal number of features is determined as the one yielding the highest mean accuracy across all fiv e cross-validation splits. Relev ant hyperparameters of the feature selection process are listed in the appendix. D. Selected F eatur es The feature selection process identified 374 features that optimize performance on the simulation task. Using more or fewer features resulted in degraded classification accuracy . As shown in Fig. 7, FFT -based frequency-domain features represent the largest share of selected features, while standard deviation is the most frequently applied aggregation function. While the feature selection process has no inherent mechanism to establish causation for the selected features, the prev alence of FFT -based features appears consistent with power system theory . Transient e vents, such as f aults with nonlinear arc char- acteristics or transformer inrush phenomena, induce responses 24th Power Systems Computation Conference PSCC 2026 Limassol, Cyprus — June 8-12, 2026 FFT Basic Stats. Po w er System Tsfresh W av elet 0 . 0 0 . 2 0 . 4 Share of F eatures F eature Types Min. Max. Mean Std. Skew. Kurt. 0 . 0 0 . 2 0 . 4 Share of F eatures Aggregation F unctions Fig. 7: Share of features and aggregation functions in the selected features. The results indicate that standard deviation as an aggregation function and frequency domain features are most useful for fault prediction. across different frequencies. FFT -based features can capture these higher order harmonics, supporting distinction between relev ant and irrelev ant ev ents. Similarly , the pre valence of standard deviation-based features is e xpected, as transient disturbances typically cause de viations from normal operating conditions, making it an effecti ve measure of signal variation. The impurity-based feature importance scores determined by the trained RF are shown in Fig. 6. Interestingly , six out of the top ten features are symmetrical component based, namely the maximum, mean and standard deviation of the negativ e sequence v oltage, as well as the standard deviation of positiv e sequence voltage, current and negati ve sequence current. The remaining top features consist of the skewness of stationary wa velet transform detail coefficients across phase currents. The relati vely consistent importance scores across three phase channels for equiv alent features (e.g., W av . d7 ( I abc , ske w .)) validates the approach, as significant disparities would suggest imbalances or artifacts in the dataset. The prominence of wa velet-based features aligns with pre- vious literature, while symmetrical component based features hav e received comparatively less attention in related studies. V . C A S E S T U DY The primary objective of the case study is to demonstrate that the previously identified feature set generalizes to FP performance. The utilized dataset, collected with the setup described in Sec. II-A, contains data from three substations in 22 kV distribution grids spanning 420 days (Station A), 153 days (Station B), and 116 days (Station C). A. T raining and T est Dataset Similar to pre vious studies, data scarcity is a significant challenge, especially due to the high variability of operational states over a year . Time series cross-validation is unsuitable in this context because most temporal splits would contain data from only one season, potentially leading to models that fail to capture annual operational patterns. Therefore, we implemented a station-based train-test split strategy that ensures representative seasonal cov erage. 0 . 00 0 . 25 0 . 50 0 . 75 1 . 00 F ault Probabilit y T arget Opt. FFT W av. 15 . 11 . 23 27 . 11 . 23 09 . 12 . 23 21 . 12 . 23 Timestamp Int. F ault 1PHG SHC Fig. 8: T wo ex emplary faults and the output of random forest classifiers for the optimal feature set (blue), FFT -based features (orange) and wa velet-based features (green). Station A, with its continuous year-long recording, captures the full range of seasonal and operational v ariability and forms the foundation of the training data. Stations B and C, containing shorter recordings, were each split into two equal parts. For training, we combined all data from Station A with the first half of Station B and tested on the second half. The same approach was applied to Station C. The RF classifier was trained using the optimal feature set containing 374 features. As baselines for comparison, we chose all wa velet-based and all FFT -based features (432 each), because these feature types were used in previous related studies and are comparable in feature count. The pre- processing includes the previously described steps of window selection, feature extraction and aggregation of the previously selected features. Additionally , data from each station are standardized individually by subtracting the mean and di viding by the standard deviation for each feature. B. Evaluation Faults are considered as distinct e vents if they are separated by at least 24 h . A fault is counted as correctly predicted (true positiv e) if the classifier outputs a probability above 0.5 for a 5 h mo ving av erage in the 3.5 days before a fault. Although the full observation window spans se ven days, predictions are only attributed to a fault if they fall within this shorter interval to ensure their relev ance. The prediction is counted as false positiv e if the classifier predicts a probability above 0.5 b ut no fault materializes within the subsequent ten days, to consider the variability of the underlying physical phenomena. C. Results T ab . IV shows that the optimal feature set selected during feature selection outperforms the two baselines both on each station individually and combined. While it performs better on Station B, the results on Station C are an impro vement over the baseline and in an acceptable range. 24th Power Systems Computation Conference PSCC 2026 Limassol, Cyprus — June 8-12, 2026 Opt. F eat. FFT F eat. W a v. F eat. 50 100 F ault Prediction Time (h) Fig. 9: Distribution of fault detection lead times in hours across Stations A, B, C, and the combined dataset. Fig. 8 visualizes two representativ e fault ev ents. W avelet- based features result in fault prediction performance with high variance. FFT -based features cause false positiv e predictions. In contrast, the optimal feature set is relati vely robust. An interesting pattern observed is a decrease in fault probability shortly before the actual fault occurrence. This pattern may be caused by the 5 h moving av erage smoothing effect and the labeling con v ention, which only labels the precursor symptoms as positi ve, b ut not the f ault e vent itself. Consequently , features measured shortly before faults may be more similar to the actual fault event, which is labeled as negativ e, than precursor symptoms observed up to seven days prior . As the practical usefulness of FP depends on how far in advance a fault can be anticipated, the distribution of hours between the first positiv e prediction and the actual fault is visualized in Fig. 9. The optimal feature set predicts faults with a mean lead time of 84 . 8 h compared to 54 . 4 h and 59 . 2 h for FFT -based and wa velet-based features respectively . D. Impact of Classifier and Prediction Horizon Both the classifier and the prediction horizon were chosen based on experiments from pre vious literature. While not the focus of this paper, we conducted a small number of initial experiments to analyze the sensiti vity of our results to these choices by repeating the previously mentioned case study with different classifiers and f ault prediction horizons. The achiev ed F1-scores aggre gated o ver Station B and C for different models and fault prediction horizons are presented in Fig. 10. W e chose a significantly simpler , linear model, namely a logistic regression fitted with stochastic gradient descent, and a more complex model, namely a multi-layer-perceptron (MLP). The results indicate that the simpler linear model cannot predict faults as effecti vely , while the MLP achiev es similar results as the RF classifier . Although feature selection T ABLE IV: Performance Metrics by Feature Set, Combined and Individually for Station B and C in Brackets Feature Set Precision Recall F1 Score Opt. Feat. 0.80 (1.00/0.67) 0.80 (0.80/0.80) 0.80 (0.89/0.73) FFT Feat. 0.75 (0.67/1.00) 0.60 (0.80/0.40) 0.67 (0.73/0.57) W avelet Feat. 0.71 (1.00/0.60) 0.50 (0.40/0.60) 0.59 (0.57/0.60) Fig. 10: Combined F1-Score of Station B and C for a logis- tic regression (Linear), random forest (RF), and multi-layer- perception (MLP) classifier as well as for different prediction horizons utilizing the chosen RF classifier and the optimal feature set. depends on the classifier , the features we selected appear relativ ely robust, while FFT- and wa velet-based features vary more across classifiers. The F1 score drops significantly if the f ault prediction horizon is too short b ut is less sensitiv e to longer fault prediction horizons. Overall, our initial experiments indicate agreement with previous literature concerning the chosen classifier and a prediction horizon of seven days. Nev ertheless, more comprehensi ve and rigorous experiments are necessary for a definitiv e conclusion. V I . D I S C U S S I O N A. Limitations While the case study demonstrates the effecti veness of the selected features, se veral limitations must be acknowledged. First, the classifier and the prediction horizon were chosen based on related studies and are not optimized in this paper . Second, feature selection was performed on a surrogate simulation task, a necessary compromise to mitigate ov erfitting risks on scarce field data. The strong correlation (r = 0.92) between simulation task performance and real-world FP ef fec- tiv eness v alidates this approach, though the imperfect correla- tion indicates that simulation-optimized features may not fully capture all nuances of real-w orld precursor symptoms. The strong correlation is likely to hold for different fault types and operating conditions, as the real-world dataset contains differ - ent fault types as well as data from different seasons. Ho we ver , as real-world experiments are currently limited to three substa- tions, there is a risk that real-world performance on different substations lacks behind the performance on simulation data. This risk increases if new substations differ significantly from the tested ones, for e xample when transitioning from resonance grounded to ef fectiv ely grounded grids. When abundant real- world data becomes av ailable, direct feature selection on field data can further improve FP performance. Scarce real-world fault data from three substations may also limit the case study’ s rob ustness. While the station-based 24th Power Systems Computation Conference PSCC 2026 Limassol, Cyprus — June 8-12, 2026 train-test split ensures seasonal coverage while avoiding data- leakage from train to test dataset, results may vary when additional substations are incorporated, potentially leading to improv ed or diminished performance. Future work will incorporate more data to assess the robustness of the findings. Additionally , not all faults exhibit detectable precursor symptoms, yet the current labeling approach treats all faults as predictable to eliminate manual labeling requirements. This limitation should be addressed by a labeling scheme that distinguishes between predictable and unpredictable faults. Finally , the FP pipeline currently only utilizes voltage and current measurements. It is likely that additional data sources like dissolved gas analysis for transformers, acoustic fingerprints or weather conditions could impro ve the predicti ve power of the classifiers. The integration of additional data sources should therefore be considered in further studies. Despite these limitations, the relative adv antage of the selected features o ver the baselines demonstrates the validity of the simulation-based feature selection methodology . V I I . C O N C L U S I O N This study addressed the challenges of data scarcity and a lack of systematic feature comparison for FP . W e implemented a simulation-based feature selection and demonstrated its effecti v e transfer to real-world applications using field data from three substations. W e identified 374 optimal features from an initial set of 1556 candidates, with w avelet-based and symmetrical component-based features proving most impor- tant for prediction performance. The successful simulation- to-real transfer indicates that insights from previous incipient fault detection studies, which mainly rely on simulation data, can be transferred to fault prediction approaches. A mean prediction lead time of 84 . 8 h was achiev ed in this study , meaning a fault can be predicted approximately 3.5 days in adv ance. This time span can be utilized to address issues in the grid before they lead to high current faults. This proactive fault management can reduce outage duration and improve grid reliability . The current dev elopment of IEC 61850-compliant smart grid infrastructure allo ws a simple integration of fault prediction approaches into existing hardware. A C K N O W L E D G M E N T This project was partially funded by the Deutsche Forschungsgemeinschaft (DFG, German Research Foundation) - Project number 535389056. A P P E N D I X : H Y P E R P A R A M E T E R S T ab . A1 and T ab . A2 list the hyperparameters for the classifiers, cross-v alidation, feature selection algorithm and ev aluation metrics. For hyperparameters not listed in the tables, scikit-learn default values were used. T ABLE A1: Hyperparameters used for feature selection Component Hyperparameter V alue RF Classifer n_estimators 100 random_state 42 n_jobs − 1 Cross-V alidation Type Stratified K-Fold for RFE n_splits 5 shuffle True random_state 42 RFE step 1 cv Defined above n_jobs − 1 scoring Accuracy T ABLE A2: Hyperparameters for correlation analysis between simulation task and real-world task on data from Station A Component Hyperparameter V alue RF Classifier for n_estimators 100 Simulation and random_state 42 Real-W orld T ask n_jobs − 1 Cross-V alidation for Type Stratified K-Fold Simulation T ask n_splits 5 shuffle True random_state 42 Cross-V alidation for Type T ime-Series Split Real-W orld T ask n_splits 5 shuffle False Evaluation Metrics scoring_sim Accuracy scoring_real F1-Score R E F E R E N C E S [1] R. Dashti, M. Daisy , H. Mirshekali, H. R. Shaker, and M. Hosseini Ali- abadi, “ A survey of fault prediction and location methods in electrical energy distribution networks, ” Measur ement , vol. 184, p. 109947, Nov . 2021, https://linkinghub.else vier .com/retrie ve/pii/S0263224121008824. [2] S. Rubio, S. Bogarra, M. Nunes, and X. Gomez, “Smart grid protection, automation and control: Challenges and opportunities, ” Applied Sci- ences , vol. 15, no. 6, p. 3186, Mar . 2025, https://www .mdpi.com/2076- 3417/15/6/3186. [3] Power Quality Data Analytics W orking Group, “Electric signatures of power equipment failures, ” IEEE, T echnical Report PES-TR73, Dec. 2019, 10.17023/2v0j-vp64. [4] F . Imam, P . Musilek, and M. Z. Reformat, “Parametric and non- parametric machine learning techniques for increasing power system reliability: A re view , ” Information , vol. 15, no. 1, p. 37, Jan. 2024, https://www .mdpi.com/2078-2489/15/1/37. [5] A. Haleem Medattil Ibrahim, S. K. Sadanandan, T . Ghaoud, V . Sub- ramaniam Rajkumar, and M. Sharma, “Incipient fault detection in power distribution networks: Revie w , analysis, challenges, and fu- ture directions, ” IEEE Access , v ol. 12, pp. 112 822–112 838, 2024, https://ieeexplore.ieee.or g/document/10636132/. [6] M. S. Alvarez-Alv arado, D. L. Donaldson, A. A. Recalde, H. H. Noriega, Z. A. Khan, W . V elasquez, and C. D. Rodr ´ ıguez-Gallegos, “Power system reliability and maintenance e volution: A critical re view and future perspectives, ” IEEE Access , vol. 10, pp. 51 922–51 950, 2022, https://ieeexplore.ieee.or g/document/9768823/. [7] A. J. W ilson, A. Riza Ekti, J. Follum, S. Biswas, C. Annali- cia, J.-Y . Joo, O. Aziz, and J. Lian, “The grid event signa- ture library: An open-access repository of power system measure- ment signatures, ” IEEE Access , vol. 12, pp. 76 207–76 218, 2024, https://ieeexplore.ieee.or g/document/10538319/. [8] O. Alaca, A. Riza Ekti, J.-Y . Joo, and N. Sten vig, “Event- type identification in po wer grids using a spectral correlation function-aided con volutional neural network, ” IEEE Open Access 24th Power Systems Computation Conference PSCC 2026 Limassol, Cyprus — June 8-12, 2026 Journal of P ower and Ener gy , vol. 11, pp. 653–664, 2024, https://ieeexplore.ieee.or g/document/10789217/. [9] N. Ehsani, F . Aminifar , and H. Mohsenian-Rad, “Con volutional autoencoder anomaly detection and classification based on distribution pmu measurements, ” IET Generation, T ransmission & Distribution , vol. 16, no. 14, pp. 2816–2828, Jul. 2022, https://ietresearch.onlinelibrary .wile y .com/doi/10.1049/gtd2.12424. [10] I. Baqui, I. Zamora, J. Maz ´ on, and G. Buigues, “High impedance fault detection methodology using wa velet transform and artificial neural networks, ” Electric P ower Systems Research , vol. 81, no. 7, pp. 1325–1333, 2011, https://www .sciencedirect.com/science/article/pii/S0378779611000344. [11] J. J. G. Ledesma, K. B. do Nascimento, L. R. de Araujo, and D. R. R. Penido, “ A two-level ann-based method using synchro- nized measurements to locate high-impedance fault in distribution sys- tems, ” Electric P ower Systems Resear ch , vol. 188, p. 106576, 2020, https://www .sciencedirect.com/science/article/pii/S0378779620303801. [12] Q. Li, H. Luo, H. Cheng, Y . Deng, W . Sun, W . Li, and Z. Liu, “Incipient fault detection in power distrib ution system: A time– frequency embedded deep-learning-based approach, ” IEEE T ransac- tions on Instrumentation and Measur ement , vol. 72, pp. 1–14, 2023, https://ieeexplore.ieee.or g/document/10056403/. [13] M. J. Mousavi and K. L. Butler-Purry, “ A nov el condition assess- ment system for underground distribution applications, ” IEEE T rans- actions on P ower Systems , vol. 24, no. 3, pp. 1115–1125, 2009, https://ieeexplore.ieee.or g/document/5484401. [14] H. Lu, W .-H. Zhang, Y . W ang, and X.-Y . Xiao, “Cable incipi- ent fault identification method using power disturbance waveform feature learning, ” IEEE Access , vol. 10, pp. 86 078–86 091, 2022, https://ieeexplore.ieee.or g/document/9858897. [15] P . R. N. Da Silva, H. A. Gabbar , P . V ieira Junior, and C. T . Da Costa Ju- nior , “ A new methodology for multiple incipient fault diagnosis in trans- mission lines using qta and na ¨ ıve bayes classifier, ” International Journal of Electrical P ower & Ener gy Systems , vol. 103, pp. 326–346, Dec. 2018, https://linkinghub .elsevier .com/retrieve/pii/S0142061518303314. [16] W . Li, E. Xiang, and K. W ang, “Incipient fault identifica- tion in power distribution systems based on siamese temporal graph, ” in 2021 P ower System and Green Ener gy Conference (PSGEC) . Shanghai, China: IEEE, Aug. 2021, pp. 789–794, https://ieeexplore.ieee.or g/document/9542281/. [17] K. Butler-Purry and M. Bagriyanik, “Identifying transformer in- cipient events for maintaining distribution system reliability , ” in 36th Annual Hawaii International Conference on System Sciences, 2003. Proceedings of the . Big Island, HI, USA: IEEE, 2003, http://ieeexplore.ieee.or g/document/1173874/. [18] S. Bhowmick and S. Nandi, “Online detection of an interturn winding fault in single-phase distrib ution transformers using a ter- minal measurement-based modeling technique, ” IEEE T ransactions on P ower Delivery , v ol. 30, no. 2, pp. 1007–1015, Apr. 2015, https://ieeexplore.ieee.or g/document/7057680/. [19] S. He, Y . Zhang, R. Zhu, and W . T ian, “Electric signature detection and analysis for power equipment failure monitoring in smart grid, ” IEEE T ransactions on Industrial Informatics , vol. 17, no. 6, pp. 3739–3750, Jun. 2021, https://ieee xplore.ieee.org/document/9169805/. [20] S. Zhang, Y . W ang, M. Liu, and Z. Bao, “Data-based line trip fault prediction in power systems using lstm networks and svm, ” IEEE Access , v ol. 6, pp. 7675–7686, 2018, http://ieeexplore.ieee.or g/document/8233109/. [21] M. R. Skydt, M. Bang, and H. R. Shaker, “ A probabilistic sequence classification approach for early fault prediction in distribution grids using long short-term memory neural networks, ” Measur ement , vol. 170, p. 108691, Jan. 2021, https://linkinghub .elsevier .com/retrieve/pii/S0263224120311994. [22] G.-Y . Li, W .-Y . Huang, and G. W . Chang, “ A data-driven frame- work for incipient fault detection in transmission systems: Imple- mentation and insights, ” in 2025 IEEE Industry Applications Society Annual Meeting (IAS) . T aipei, T aiwan: IEEE, Jun. 2025, pp. 1–7, https://ieeexplore.ieee.or g/document/11061483/. [23] E. Balouji, K. B ¨ ackstr ¨ om, V . Olsson, P . Hovila, H. Niv eri, A. K ulmala, and A. Salo, “Distrib ution network fault predic- tion utilising protection relay disturbance recordings and machine learning, ” IET Confer ence Proceedings , Jul. 2023, http://digital- library .theiet.or g/doi/10.1049/icp.2023.1220. [24] G. W . Chang, Y .-H. Hong, and G.-Y . Li, “ A hybrid intelligent approach for classification of incipient faults in transmission network, ” IEEE T ransactions on P ower Delivery , v ol. 34, no. 4, pp. 1785–1794, 2019, https://ieeexplore.ieee.or g/document/8744581. [25] G.-Y . Li and G. W . Chang, “ A multiple anomaly detection scheme and random forest algorithm for identifying the incipient faults in transmis- sion network, ” in 2022 IEEE P ower & Ener gy Society General Meeting (PESGM) , ser . IEEE Power and Energy Society General Meeting, vol. 2022-July , 2022, https://ieeexplore.ieee.org/document/9916991. [26] Q. Li, Y . Deng, X. Liu, W . Sun, W . Li, J. Li, and Z. Liu, “ Autonomous smart grid fault detection, ” IEEE Communications Standar ds Magazine , v ol. 7, no. 2, pp. 40–47, Jun. 2023, https://ieeexplore.ieee.or g/document/10043629/. [27] J. Oelhaf, G. K ordowich, A. Maier, J. Jager , and S. Bayer, “Un- supervised clustering for fault analysis in high-voltage power sys- tems using voltage and current signals (in press), ” in F ault and Disturbance Analysis Confer ence 2025 , Atlanta, Georgia, May 2025, http://arxiv .org/abs/2505.17763. [28] J. Oelhaf, G. K ordowich, C. Kim, P . A. Perez-T oro, A. Maier, J. Jager , and S. Bayer , “Impact of data sparsity on machine learning for fault de- tection in power system protection, ” in 33r d Eur opean Signal Processing Confer ence , Palermo, Italy , Sep. 2025, http://arxiv .org/abs/2505.15560. [29] P . K. Sahoo, S. Mishra, M. Das, and S. C. Swain, “Enhanced incipi- ent fault identification in underground distribution cable implementing random forest classifier, ” Microsystem T echnologies , vol. 31, no. 7, pp. 1763–1773, Jul. 2025, https://link.springer.com/10.1007/s00542- 024-05778-w . [30] DIgSILENT, “Po werfactory , ” https://www .digsilent.de, 2024. [31] “Benchmark systems for netw ork integration of renewable and dis- tributed energy resources, ” CIGR ´ E TF C6.04, Paris, T ech. Rep. 575, 2014. [32] W . Zhang, X. Xiao, K. Zhou, W . Xu, and Y . Jing, “Multicycle incipient fault detection and location for medium voltage underground cable, ” IEEE T ransactions on P ower Delivery , vol. 32, no. 3, pp. 1450–1459, Jun. 2017, http://ieee xplore.ieee.org/document/7587342/. [33] M. Kizilcay and T . Pniok, “Digital simulation of fault arcs in power systems, ” European T ransactions on Electrical P ower , v ol. 1, no. 1, pp. 55–60, 1991, https://onlinelibrary .wile y .com/doi/abs/10.1002/etep.4450010111. [34] R. Flosdorff and G. Hilg arth, Elektrische Energie verteilung . Wiesbaden: V ie weg+T eubner V erlag, 2000, http://link.springer .com/10.1007/978-3- 663-09906-2. [35] “Guidelines for representation of network elements when calculating transients, ” WG33, CIGRE, CIGRE T echnical Brochure, 1990. [36] DIgSILENT GmbH, “Powerf actory technical reference: T wo-winding transformer , ” 2024. [37] N. Elkalashy , M. Lehtonen, H. Darwish, M. Izzularab, and A.-m. T aalab, “Modeling and experimental verification of high impedance arcing fault in medium voltage networks, ” IEEE T r ansactions on Dielectrics and Electrical Insulation , v ol. 14, no. 2, pp. 375–383, Jan. 2007. [38] M. Jannati, B. V ahidi, and S. H. Hosseinian, “Incipient faults monitoring in underground medium voltage cables of distribu- tion systems based on a two-step strategy , ” IEEE T r ansactions on P ower Delivery , v ol. 34, no. 4, pp. 1647–1655, Aug. 2019, https://ieeexplore.ieee.or g/document/8716299/. [39] K. Heuck, K.-D. Dettmann, and D. Schulz, Elektrische Energiever - sor gung: Erzeugung, ¨ Ubertragung und V erteilung elektrischer Energie f ¨ ur Studium und Praxis . Wiesbaden: Springer Fachmedien Wiesbaden, 2013, https://link.springer .com/10.1007/978-3-8348-2174-4. [40] F . Pedregosa, G. V aroquaux, A. Gramfort, V . Michel, B. Thirion, O. Grisel, M. Blondel, P . Prettenhofer , R. W eiss, V . Dubour g et al. , “Scikit-learn: Machine learning in p ython, ” the J ournal of machine Learning resear ch , vol. 12, pp. 2825–2830, 2011. [41] F . W ang, P . Zhang, J. Li, Z. Li, M. Zhao, Y . Liang, G. Su, and X. Y ou, “Multi-feature based extreme learning machine identification model of incipient cable faults, ” F r ontiers in Energy Researc h , vol. 12, Apr . 2024, https://www .frontiersin.or g/articles/10.3389/fenrg.2024.1364528/full. [42] M. Christ, N. Braun, J. Neuffer , and A. W . Kempa-Liehr, “T ime series feature extraction on basis of scalable hypothesis tests (tsfresh – a python package), ” Neur ocomputing , vol. 307, pp. 72–77, Sep. 2018, https://linkinghub .elsevier .com/retrieve/pii/S0925231218304843. [43] I. Guyon, J. W eston, S. Barnhill, and V . V apnik, “Gene selection for cancer classification using support vector machines, ” Machine learning , vol. 46, no. 1, pp. 389–422, 2002. 24th Power Systems Computation Conference PSCC 2026 Limassol, Cyprus — June 8-12, 2026
Original Paper
Loading high-quality paper...
Comments & Academic Discussion
Loading comments...
Leave a Comment