Efficient compressive sensing for machinery vibration signals
Mechanical vibration monitoring often requires high sampling rates and generates large data volumes, posing challenges for storage, transmission, and power efficiency. Compressive Sensing (CS) offers a promising approach to overcome these constraints…
Authors: Imen Tounsi, Fadi Karkafi, Mohammed El Badaoui
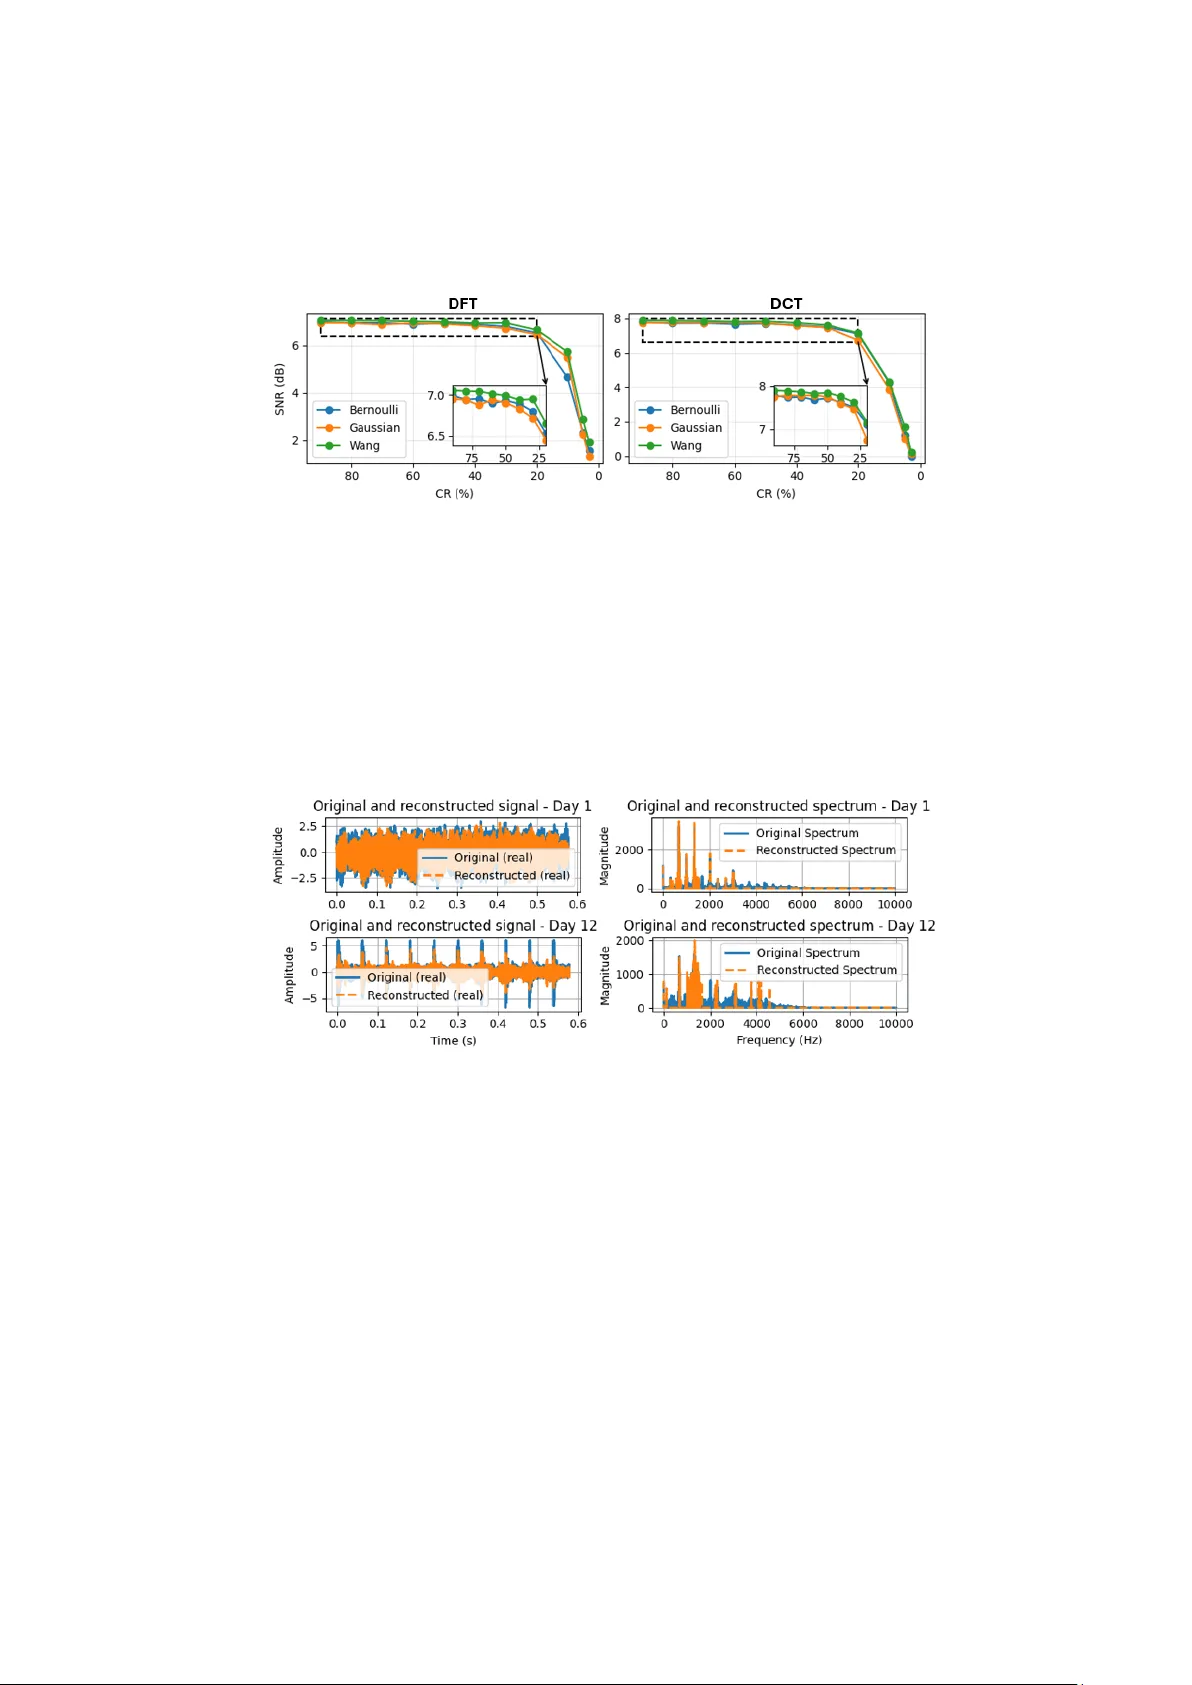
Efficient compressiv e sensing for machinery vibration signals Imen Tounsi 1 ,2 , Fadi Karkafi 1 , Mohamm ed El Badaoui 1,2 , François Guillet 2 1 Safran Tech, R ue des Jeunes Bois – Châteaufort 78 772 Magny – les – Hameaux, France 2 UJM- St -Eti enne, LASPI, UR3059, F-42023, S aint-Etienne, France Abstract . Mechanical vibration monitoring often requires high sampling r ates and generates larg e data volumes , posing ch allenges f or stor age, transmission, and power efficien cy. Compressive Sensing (CS) o ffers a prom ising ap proach to over- come these co nstraints b y exploiting signal sparsity to enable sub -Nyquist acquisi- tion and efficient reconstru ction. This study presents a comprehen sive comparative analysis of the key components of th e CS fr amework : sparse basis, m easurem ent matrix, and reconstruction algorithm for machinery vibration signals. In addition , a hardware -efficient measurement matrix, the Wang matrix, originally developed for image compression, is introduced and evalu ated fo r the first time in this contex t. Experimen tal assessment using the HUMS2023 and the CETIM gearbox d atasets demonstrates that this matr ix achiev es superior reconstruction quality, with h igher SNR, compared to conventional Gaussian and Bernoulli m atrices, esp ecially at high compression r atios. Keywords: Compressive sensing, Mechanical vibration, Measur ement matrix, Wang matrix, Vibration signal compr ession 1 Introduction Mechanical compon ents play a vital role in propulsion an d actuatio n systems, ensuring efficient po wer transmission, load management, and motion contro l [1]. Their reliability is critical, as failures can co mpromise safety, increase maintenance costs, an d disrupt missions [2]. Vibration analysis is a widely u sed technique for health monitoring [ 3], b ut extracting fault features remains challenging du e to high - frequency noise and large data volumes from high sampling rates and multiple sen- sors [4]. In many practical env ironments , such as aerospace applications , strict lim- itations o n bandwidth, storage, and power further h ighlight the need for efficient data comp ression to ensure reliable an d resource -efficien t condition monitor ing. 2 Imen Tounsi, Fadi Karkaf i, Mohammed El Badaoui, François Guillet Compressive sensing (CS) offers an effective solution to th e se ch allenges. By exploiting signal spar sity in appropriate transform domains, CS enables sub - Nyquist sam pling while p reserving key fault fea tures [5 ]. This red uces d ata red un- dancy and resou rce demands, mak ing it well -suited f or real-time applications. Re- search on CS for rotating machiner y has mainly focused on three com ponents: the sparse basis, measurement matrix, and reconstruction algorithm. Early studies used analytical bases such as the Discrete Cosine Transform (DCT), Discrete Fou rier Transform (DFT), and wavelets for th eir simplicity an d energy comp action (e. g., Wang et al., 2015 [6]; Bai et al., 2022 [7]). To enhance adaptability, Chen et al. (2014) [8] introduced K – Singular Value Decomposition (K-SVD) dictionary learn- ing, and Kid a and Sh inozaki (2019) [9] proposed the Order -Ratio Basis (O RB) to capture rotational period icity. Measurement matrices ar e often Gaussian or Ber- noulli due to th eir th eoretical guar antees under th e Restricted I somet ry Prop erty (RIP) (Wu et al., 2019, 2021 [10,1 1]), while Wang and Xia (2024) [2] developed a noise-robust ran dom convolution m atrix using a generative flow mo del. For recon- struction, greedy algorithms s uch as Orthogonal Match ing Pursuit (OMP) and Com- pressive Sampling Match ing Pursuit (CoSaMP) are popular for their eff iciency (Bai et al., 2022 ; Wu et al., 2019 [7,10]), whereas rec ent generative an d learning -based models, such as GLOW (Wang & Xia, 2024 [4]), achieve higher fidelity at the cost of greater comp utational co mplexity. Ov erall, prior studies demon strate the promise of CS for mechanical v ibration analysis but also expose key limitations. Most works assess only a single combinatio n of spar se basis, measurem ent matrix, and recon- struction algorithm, lacking systematic ev alua tion of their joint influence on perfor- mance. Moreover , many recent methods rely on dataset -specific or learned repre- sentations that may no t g eneralize acro ss mac hines or operatin g co nditions. Although Gaussian and Bernoulli matrices offer s trong theoretical guarantees, their computation al demands limit real-time or emb edded aerospace applicatio ns requir- ing hardware simplicity and energy efficiency [12]. Gaussian matrices employ ran- domly distributed real-v alued elements, requiring numerous multiplications and summations during m easurement acquisition. This incr eases comp utational com- plexity and power consumption and risks exceeding the dynamic range of the an a- log- to -digital converter (ADC) [12]. Bernoulli matrices, composed s olely of +1 and -1 entries, eliminate multiplications but still involve extensive summatio ns that can produce larg e measurement magn itudes. To address these limitations, a novel m easurement matrix, the W ang matrix [12], originally p roposed for image applicatio ns and op timized for hardware implemen- tation, is intro duced for the first time in thi s context. The r esults d emonstrate that this matrix not only e nhances hardware efficiency but also achieves superior recon- struction quality compared to co nventional Gaussian and Bernoulli random m eas- urement matrices. The proposed meth od is further evalu ated using two r eal-wor ld datasets from HUMS20 23 and CETIM gearb ox datasets, demo nstrating its rob ust- ness across differen t operating cond itions. Efficient compressive s ensing for machinery vibrat ion signals 3 2 Compressive sensing framework CS pro vides a powerfu l framework for efficient signal acquisition an d recon- struction. Unlike traditional Ny quist-b ased sampling, CS ex ploits the inherent spar- sity of signals in an appropriate transform d omain to recov er them accurately from a smaller number of measurements. Th is recovery is achieved through non linear optimization techniques. Fig . 1 provides a schem atic rep resentation of th e CS work- flow sh owing three key components: sparse representation , co mpressed sampling , and sign al reconstruction . Fig. 1 Schem atic diagram of the compressive sensing algorithm 2. 1 Sparsity and incoherence in com pressive sensing Sparsity refers to the property of a sign al whose representation in an appropri- ate basis contains o nly a few infor mative coefficients th at stand out significantly from the backgro und noise, while the remaining coefficien ts are negligib le or close to zero [5]. This mean s that the signal can be ex pressed with only non- zero coefficien ts, where , an d denotes the dimensionality of the origin al signal . I n a chosen basis , t he signal is said to be -spar se and can b e represented as: (1) denotes the sparse represen tation of the or iginal signal in the transfor m domain. CS reduces sampling req uirements by capturing a signal’ s key information via a designed measurement m atrix , where M is th e numb er of co mpressed measurements [5 ]. Then, the comp ressed mea surement vector can be expressed as follows: (2) To ensure efficient CS, the Wang matrix must exhibit low coherence with the sparsity basis. Th e coheren ce [13] between these two matrices is given b y: (3) where is the j-th ro w of and is the k- th column of . The compression r atio (CR) represents the p ercentage of measurements retain ed after compression an d is defined as: (4) 4 Imen Tounsi, Fadi Karkaf i, Mohammed El Badaoui, François Guillet 2. 2 Proposed m ethodology The Wang matrix, intr oduced in [12], is a hardware -efficient measuremen t ma- trix specifically designed to simplify the image acquisition process in CS. Un like Gaussian and Bernoulli matrices, which require extensive multiplications and sum- mations, the Wang matrix is co nstructed through a r andom subsampling o f the iden- tity matri x. In o ther words, a subset of the rows o f the ident ity matrix is r andomly selected without replacement, as shown in (5), ensuring that each measuremen t cor- responds to a unique elem ent of th e orig inal sign al. This structure means that each measurement directly ca ptures one elem ent of the inpu t without any lin ear combi- nation or additional computation. Consequently , it offers a simple and low-power implementation that is particu larly suitable for hardware -based CS systems. Then, th e CS reconstru ction process using the Wang matr ix follows the general optimization p roblem defined in ( 6) [5]. (6) The recovered signal is then obt ained as: . This work em ploys the Ortho g- onal Matchin g Pursuit (OMP) algo rithm due to its balan ce between accuracy and computation al cost, making it suitable for real -time vibration sign al analysis. The performance of the CS algorithm is then evaluated using the Signal- to -No ise Ratio (SNR), defined as follows: (7) Where is the i-th samp le point of th e original signal , and is the i-th sam ple point of th e reconstructed sig nal . 3 Experimenta l evaluation and results 3.1 Case Study 1: HUMS2023 Gearbox Dataset 3.1.1 Data descriptio n The v ibration data used in this study come from the HUMS2023 data ch allenge [14] b y the defence science and technology group, Australia. The dataset was rec- orded fr om the m ain r otor gearbox of a Bell Kio wa 20 6B-1 (OH-58) helicopter. The gearbox has two reduction stages (a spiral pinion/bev el gear stage and a planetary stage) with an inp ut spee d of 6000 RPM and an output s peed of 344 RPM. Vibratio n signals were collected fro m four accelerometers mou nted on the gearbox housing (5) Efficient compressive s ensing for machinery vibrat ion signals 5 and a once-per- revolution tachometer. The dataset includ es 526 fo ur -channel re- cordings representing the last seven days of testing und er 125% tor que (379 Nm). The input pin ion sp eed was 100 Hz, and the outp ut shaf t speed was 5.73 Hz. Key gear-mesh frequencies include 190 0 Hz for the inpu t pinion/bevel gear and 568 Hz for the planetar y-stage sun , planet, and ring gears. 3.1.2 Sparsity and incoherence analysis As a first step, the spar sity of the vibration signals was evaluated in different transform d omains: DCT, DFT , and Daub echies wavelets (Db2 and Db8). The spar- sity was quantified as the percentage of coefficients who se absolute values ar e lower than 1% of the maximum coe fficient magnitude in the corresponding transformed signal. Fig. 2 illustrates the sparsity values obtained for ea ch domain using the data from day 22. The DCT and DFT domains exhibit the highest sparsity (≈ 0 .99), while the wavelet d omains are less sparse, with Db8 p erforming better than Db 2. These results confirm that the DCT an d DFT are the most suitable cand idates for CS of gearbox vibration s, as they enable efficien t energy compaction. Fig. 2 Sparsity values of the vibratio n signal from day 22 in different transform domains (DCT, DF T, Db2, Db8). Following the sparsity analysis, the incoheren ce between the measur ement ma- trix and th e sp arse b asis was evaluated to assess their suitability for CS. Table 1 summarizes the coh erence values obtained for Gaussian, B ernoulli, and Wan g measurement m atrices in combination with the DCT and DFT domains. Table 1. Coherence values betwe en different measurement matrice s and sparse basis matrices. Parameters DCT DFT Gaussian 5.57 4.19 Bernoulli 5.52 4.15 Wang 1.41 1.00 As sho wn in the table , the Gaussian an d Bern oulli matrices exhibit r elatively high coherence with the DFT and DCT bases. In co ntrast, the Wan g matr ix ach ieves the lowest coh erence v alues (≈ 1.0 -1 .4) with these transform domains, indicating strong mutual independence. A compar ative p erformance analysis is conducted in the following section to furth er validate and co nfirm these pr eliminary observations. 6 Imen Tounsi, Fadi Karkaf i, Mohammed El Badaoui, François Guillet 3.1. 3 Comparative evaluation of m easurement mat rices To assess the impact of the measurement matrix o n reconstruction q uality, CS experimen ts were performed using DFT and DCT bases with the OMP algorithm . The three measurem ent matrices were compar ed in Fig . 3 by showing the var iation of SNR between the original and reconstructed signal s from day 22 across dif ferent CRs. Fig. 3 SNR vs. CR for a signa l from day 22 using OMP in DFT ( left) a nd DCT (right) do mains with three measurement matrices (Bernoulli, Gaussian, Wang) Among th e tested matrices, the Wang matrix consistently ach ieved sup erior re- construction performance. It provided h igher SNR values acro ss all CRs compared to the other matr ices. This indicates that it of fers a more effective sam pling struc- ture for preserv ing signal information during th e compression process. Fig . 4 co mpares the original and r econstructed signal s from day 22 (left), ob- tained using the DFT basis, Wang matrix, and OMP alg orithm at a CR of 3%, demonstrating the high reconstruction accuracy of the CS appro ach. It also com- pares the eff ectiveness of the RMS health ind icator on the original and recon- structed signal sets f rom day 22. As sho wn, the RMS valu es preserve the same overall trend, and the two peaks indicating the structure ch anges are clear ly re- tained in the reconstructed signals. Fig. 4 Com parison of original a nd reconstructed signal s from day 2 2 (left) and RMS values of each signal from day 22 (right), with the o riginal (blue) and reconstructed (o range) signals. An overall aver age SNR of 8.29 dB 0.31 dB, com puted across all channels and days, underscores the robustness and reliability of th e prop osed r econstruction approach under a very low CR. Efficient compressive s ensing for machinery vibrat ion signals 7 3.2 Case Study 2: CETIM Gea rbox Dataset 3.2.1 Data descriptio n The s econd set of experiments relies on the CETIM vibration dataset, which pro- vides measu rements acquired from a gea rbox subjected to a gradual degradation process. The dataset includes twelv e vibration signals, each correspo nding to a dis- tinct day of acquisition, th us capturing the evolution from a healthy to a fau lty o p- erating condition. The signals were sampled at 2 0 kHz over a duration of 3 seco nds per acquisition. Th e dominan t component in the vibration spectra is the gear mesh- ing frequ ency, which varies slig htly between 330 Hz an d 346 Hz depen ding on th e rotational speed . 3.2.2 Sparsity analysis The sparsity of the CETIM vibration signals was evaluated in the same transform domains: DCT, DFT, Db2 and Db 8. Fig . 5 presen ts th e sparsity results for the sig- nals acquired o n day 1 (healthy) and day 12 (faulty). Th e DC T and DFT domains exhibit the highest sparsity in both conditions, confirming their strong ability to compact sign al energy into a few dominan t coefficients. However, when the defect develops (day 12), sparsity in these d omains slightly decreases d ue to th e appear- ance of impulsive and broadba nd compon ents associated with th e fault. Fig. 5 Sparsity values of the vibratio n signal from day 1 (in blue) and day 12 (in red) in differ ent transform domains (DCT, DFT, Db2, Db8) . 3.2.3 Comparative evaluation of m easurement matrices To assess the effect of the measurem ent matr ix on rec onstruction quality , CS experimen ts were performed on the CETIM data using DFT and DCT bases with the OMP algor ithm. The th ree measu rement matrices were co mpared, and Fig . 6 shows the variation of SNR between the original and r econstructed signal s f rom day 1 ac ross d ifferent CRs. As observed , th e Wan g matrix consistently outper formed the other two measurement matrices , pro viding higher SNR valu es across all CRs. 8 Imen Tounsi, Fadi Karkaf i, Mohammed El Badaoui, François Guillet Fig. 6 SNR vs. CR for a signal f rom day 1 using OMP in DFT ( left) and DCT (right) do mains with three measurement matrices (Bernoulli, Gaussian, Wang) Fig . 7 illustrates the comp arison betwe en the original an d reconstructed vi bration signals fro m day s 1 and 12, obtained using the DFT basis, Wang matrix, and OMP algorithm at a CR of 10 % . The reconstructed waveforms closely follow the origi- nals, preservin g key temporal an d spectral fea tures. Notably , the reconstructed spec- trum exh ibits a thresholding -like behavior, which resu lts in the suppression o f minor noise components. This behavior can be in terpreted as the inheren t denoising effect of the CS p rocess. The averag e SNR across all reconstructed signals is 6.34 dB 0.29 dB, ind icating satisfactory reco nstruction performance. Fig. 7 Comparison of original and reco nstructed signals a nd spectra (Da y 1 and Day 12 ) Furthermor e, the k urtosis of each d aily sign al was computed for both the original and reconstru cted datasets. As shown in Fig. 8, the rec onstructed signals clo sely follow the same trend as the original set, dem onstrating strong consistency in sta- tistical beh avior. Notably, both datasets exhibit a sig nificant rise in k urtosis d uring the last two day s, clearly indicatin g the on set of a fau lt. This confir ms that kurto sis remains a reliab le indicato r of sign al ano malies ev en af ter C S recon struction using the same par ameters (DFT, Wang matrix, OMP, CR = 10%). Efficient compressive s ensing for machinery vibrat ion signals 9 Fig. 8 Kurtosis comparison betwee n original and reco nstructed signals across 12 day s 4 Conclusion This study presented a comprehensive evaluation of compressive sen sing (CS) techniques for mechanical v ibration signal acqu isition. Experiments con ducted o n the HUMS20 23 and CETIM g earbox d atasets showed that vibration signals are highly sparse in the DCT and DFT domains, enabling efficient CS-based acqu isi- tion. The Wang measurement matr ix, introduced for the first time in this context, consistently outp erformed conventional Gau ssian and Bernoulli matrices by deliv- ering higher SNR, especially at high CRs ac ross bo th datasets. In addition to its superior reconstruction accuracy, the matr ix’s hardware -friendly structure enables efficient real -time implementation, making it well -suited for embedded monitoring systems. Acknowledgements Imen Tounsi gratefully acknowledge s th e Eur opean Com mission for its supp ort of th e Marie Sklodowska Curie program through the Horizon Eu rope DN PATRON project (GA 1 01120172) References [1] Vardar M, Erdogan F, Yildirim N (2018) Recent developmen ts in aerospace gears and gearb ox designs. Int J Sci Techno l Res 4(10):145 – 154. [2] Nithin SK, Heman th K, Shamanth V, Mahale RS, Sharath PC, Patil A (2021) Importance of cond ition monitoring in m echanical domain. Mater Today Proc. doi:10.1016 /j.matpr.2021.08.299 . 10 Imen Tounsi, Fadi Karkaf i, Mohammed El Badaoui, François Guillet [3] Sait AS, Sharaf- Eldeen YI (2011) A review of gearbox cond ition monitoring based on vibratio n an alysis tech niques, diagnostics an d pr ognostics. In: Pro ulx T (ed) Rotating Machinery, Structural Health Monitor ing, Shock and Vib ration, Vol- ume 5. Conference Proceed ings of the Society for Ex perimental Mechan ics Series, Springer, New York. doi:10.1007/978 - 1-4419-9428-8_25 [4] Wang T, Xia T (2024) A gearb ox vibration sig nal compressed sensing method based on the improved GLOW f low model. Precis Mech Digit Fabr 1(4):201 – 215. doi:10.56578/p mdf010402 [5] Brunton SL, Ku tz JN (2019) Singular value decompo sition (SVD). In: Data - Driven Science & Engin eering: Machine Learning, Dynam ical Systems, an d Con- trol. Cambrid ge University Press, Cambridge. do i:10.1017/9781108380690 .002 [6] Wang Y, Xiang J, Mo Q, He S (2 015) Compressed sparse time – frequency fea- ture rep resentation v ia compressive sensing and its applications in fault diagnosis. Measurement 6 8:70 – 81. doi:10.1016/j.measurem ent.2015.02.046 [7] Bai H, Yan H, Zhan X, Wen L, Jia X (2022) Fau lt diagnosis metho d o f plan etary gearbox b ased on comp ressed sensing an d transfer learning. Electronics 1 1:1708. doi:10.3390 /electronics11111708 [8] Chen X, Du Z, Li J, Li X, Zhan g H (2014) Compressed sen sing based on dic- tionary learnin g for extracting impulse compon ents. Signal Process 9 6:94 – 109. doi:10.1016 /j.sigpro.2013.04.018 [9] Kato Y, Otaka M (2 025) Compr essed sensing of vibration signal f or fault d iag- nosis of bearings, gears, and prop ellers under speed variation conditions. Sensors 25:3167. doi:10 .3390/s25103167 [10] Wu Z, Zhang Q, Cheng L, Tan S (2019) A new method of two -stage planetary gearbox fault detection based on multi-sen sor information fusion. Appl Sci 9:5443. doi:10.3390 /app9245443 [11] Wu Z, Zhang Q, Ma Z, Lu J, Qin Z (2021) A new health condition detection method fo r planetary gears b ased on modified distributed comp ressed sensing and multiscale symbol dynamic entropy. Shock Vib 2021:6681894. doi:10.1155 /2021/6681894 [12] Wang Y, B ermak A, Boussaid F (20 10) FPGA imp lementation of comp ressive sampling for sensor network applicatio ns. In: Proc 2nd Asia Symposium on Quality Electronic Design (ASQED 20 10), IEEE, pp 5 – 10. doi:10.1109 /ASQED.2010.5540068 [13] Stanković L, Mandic D, Dak ović M, Kišil I (2019) An intuitive derivation of the coherence index relation in co mpressive sensing. ar Xiv preprint arXiv:1903.1113 6 [14] Peeters C, Wang W, Blunt D, Verstraeten T, Helsen J (2 023) Fatigue crack detection in planetary g ears: insights from the HUMS2023 Data Challenge. Pre- print available at SSRN:462347 2. doi:10.2139/ssrn.4623 472
Original Paper
Loading high-quality paper...
Comments & Academic Discussion
Loading comments...
Leave a Comment