Photogrammetry-Reconstructed 3D Head Meshes for Accessible Individual Head-Related Transfer Functions
Individual head-related transfer functions (HRTFs) are essential for accurate spatial audio binaural rendering but remain difficult to obtain due to measurement complexity. This study investigates whether photogrammetry-reconstructed (PR) head and ea…
Authors: Ludovic Pirard, Lorenzo Picinali, Katarina C. Poole
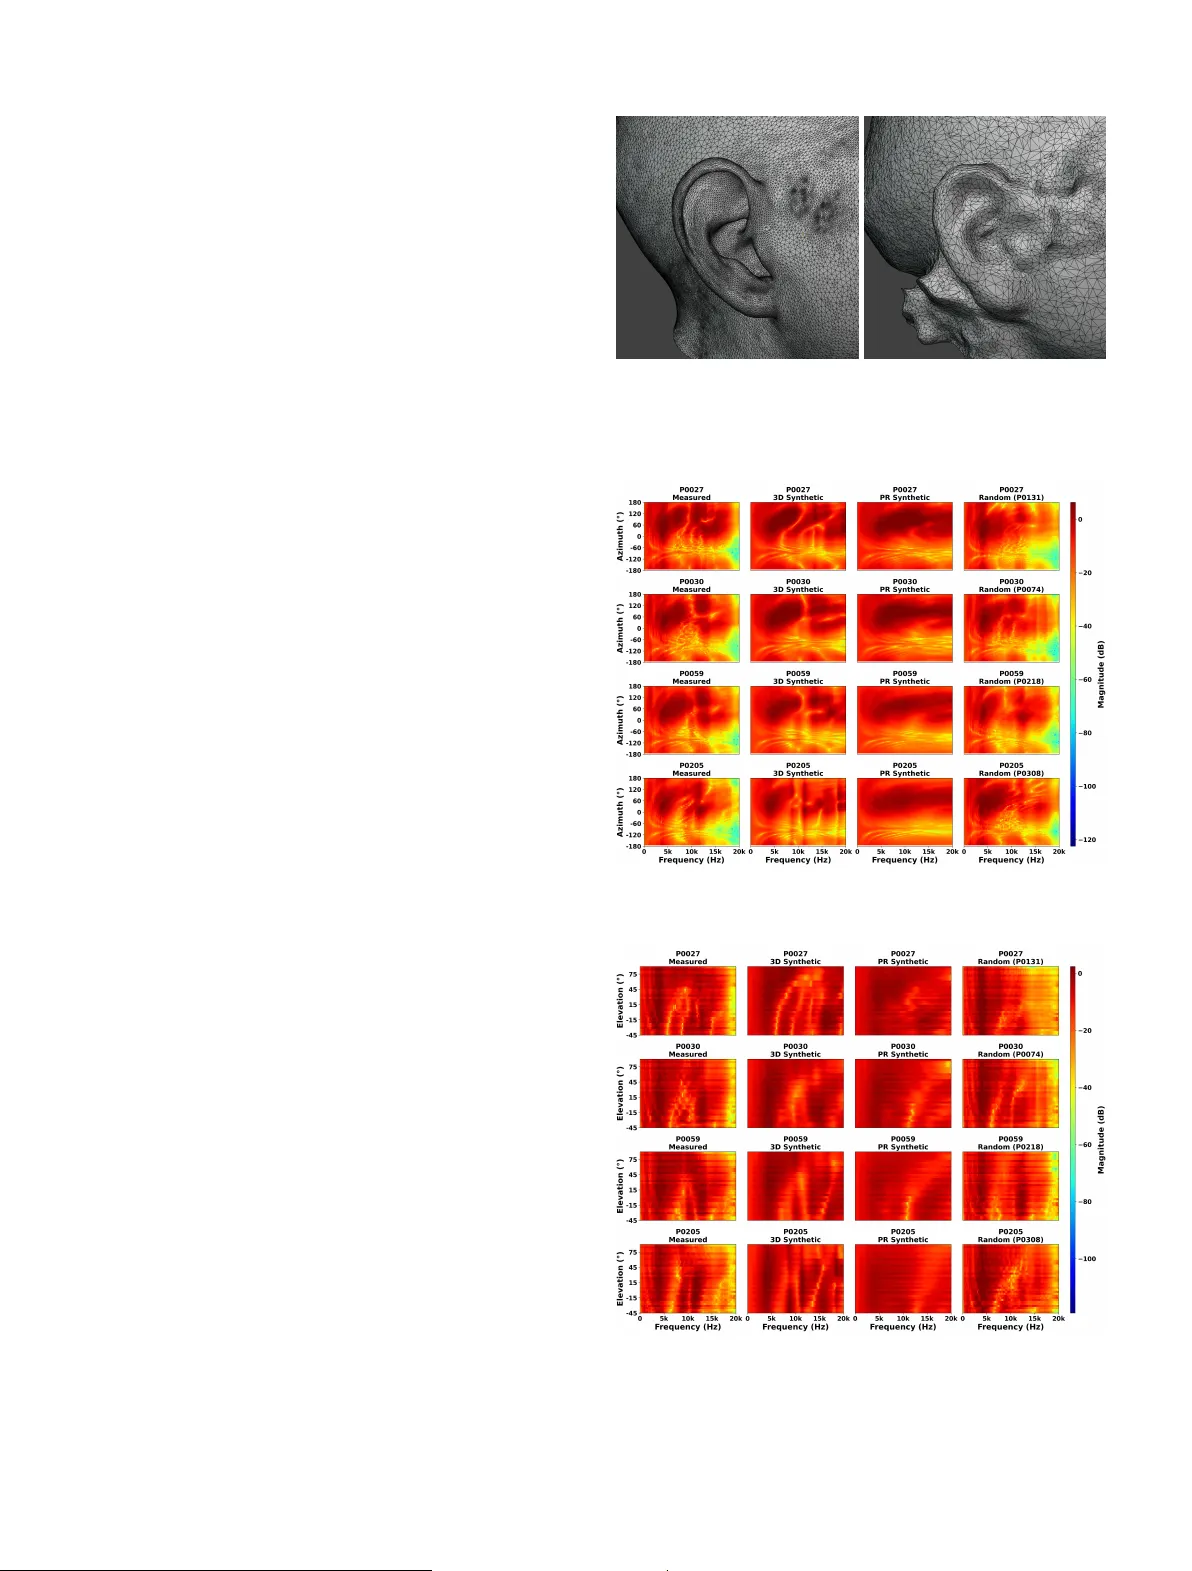
Submitted to A cta A custica T emplate pro vided by EDP Sciences Scientific Ar ticle Photogrammetry-Reconstructed 3D Head Meshes fo r A ccessible Individual Head-Related T ransfer F unctions Ludo vic Pirard 1 ⋆ , Lorenzo Picinali 1 , and Katarina C. Poole 1 1 Dyson Sc ho ol of Design Engineering, Imperial College London, United Kingdom Abstract – Individual head-related transfer functions (HR TF s) are essen tial for accurate spatial audio binaural rendering but remain difficult to obtain due to measurement complexit y . This study in vestigates whether photogrammetry-reconstructed (PR) head and ear meshes, acquired with consumer hardware, can pro vide a practically useful baseline for individual HR TF syn thesis. Using the SONICOM HR TF dataset, 72-image photogrammetry captures p er sub ject w ere processed with Apple’s Ob ject Capture API to generate PR meshes for 150 sub jects. Mesh2HR TF was used to compute PR syn thetic HR TF s, which w ere compared against measured HR TF s, high-resolution 3D scan-derived HR TF s, KEMAR, and random HR TF s through n umerical ev aluation, auditory models, and a b eha vioural sound localisation exp erimen t (N = 27). PR synthetic HR TF s preserv ed ITD cues but exhibited increased ILD and spectral errors. Auditory- mo del predictions and behavioural data sho w ed substan tially higher quadrant error rates, reduced elev ation accuracy , and greater front–bac k confusions than measured HR TF s, p erforming worse than random HR TF s on perceptual metrics. Current photogrammetry pipelines supp ort individual HR TF synthesis but are limited b y insufficient pinna morphology details and high-frequency sp ectral fidelit y needed for accurate individual HR TF s con taining monaural cues. Keyw ords. HR TF, Photogrammetry Reconstruction, Mesh2HR TF, Spatial audio, Binaural rendering 1. Introduction Spatial hearing, the ability to identify the direction of sounds in three-dimensional space, is crucial for ev- eryda y listening. It relies on acoustic cues generated by the in teraction of sound wa v es with the listener’s head, torso, and ears. Binaural cues, including interaural time differences (ITDs) and interaural level differences (ILDs), are particularly effectiv e for lateralisation in the horizon- tal plane [ 1 ]. Ho w ev er, accurate elev ation p erception and fron t–bac k discrimination additionally dep end on monau- ral sp ectral cues generated b y the complex geometry of the pinnae, head, and torso, which shap e the sound sp ec- trum in a direction-dependent manner [ 2 ]. Head-related transfer functions (HR TF s) describe these direction-dep enden t acoustic filtering properties, c haracterising how sound from a given location is trans- formed b efore reaching the en trance of the ear canal [ 3 ]. Generic HR TF s derived from a v erage human morphology , suc h as those measured using a KEMAR acoustic man- nequin [ 4 ], are widely used in consumer applications but often fail to repro duce individual sp ectral cues, leading to fron t–bac k confusions and impaired elev ation p erception [ 5 ]. Individual HR TF s are therefore fundamental for high- ⋆ Corresp onding author: l.pirard@imperial.ac.uk qualit y spatial audio, improving lo calisation accuracy and spatial release from masking [ 6 , 7 , 8 ]. T raditional acquisition of individual HR TF s requires anec hoic facilities, loudspeaker arra ys, in-ear mic ro- phones, and sp ecialist kno wledge [ 9 ]. Numerical synthe- sis from high-resolution 3D head and ear meshes using to ols such as Mesh2HR TF [ 10 ] offers a more accessible alternativ e, but access to laser scans or structured-light scanners remains limited due to cost and logistical con- strain ts [ 11 , 12 ]. Consequently , man y users still rely on generic or p oorly matched HR TF s, and scalable solutions for individual cues remain an open c hallenge. A wide range of HR TF individualisation strate- gies has been explored to reduce acquisition burden. An throp ometric approac hes relate ph ysical measure- men ts of the head and torso to HR TF c haracteristics and select or morph HR TF s from a database [ 13 ], but require precise measurements at defined landmarks, which can b e time-consuming and error-prone in practice. Image-based and mac hine-learning metho ds combine photographs of the ear and head with anthropometry [ 14 , 15 ], or attempt to extract geometric features directly from 3D meshes [ 16 , 17 ]. Whilst these approaches reduce explicit measure- men t effort, they still rely on con trolled acquisition con- ditions or sp ecialised scanning equipment, limiting their accessibilit y . 1 More recen tly , data-driven tec hniques ha v e sought to reconstruct full HR TF sets from sparse acoustic measure- men ts [ 18 , 19 , 20 ]. These metho ds can substantially re- duce measurement time but still require dedicated loud- sp eak er setups and recording sessions, and are therefore difficult to deploy at scale outside research en vironments. Ov erall, existing individualisation metho ds tend to trade off betw een accuracy , cost, and user effort, and none yet offers a widely deploy able path to individual HR TF s for the general public. Photogrammetry presents a more accessible alterna- tiv e for 3D head and ear capture, as it uses conv en tional cameras or smartphones to capture surface geometry from m ultiple ov erlapping images. Prior work has inv estigated photogrammetry-based HR TF s [ 11 , 21 , 22 ], but limited mesh resolution and insufficien t ear detail ha ve so far constrained performance, particularly at high frequen- cies where fine pinna morphology is critical [ 23 , 24 ]. It therefore remains unclear to what extent photogramme- try , implemented with curren t consumer hardw are and reconstruction pipelines, can provide a practically useful basis for individual HR TF syn thesis. In this study , head and ear meshes reconstructed us- ing photogrammetry data from the SONICOM dataset are used as input to Mesh2HR TF in order to synthe- sise individual HR TF s for 150 sub jects. The resulting photogrammetry-reconstructed (PR) syn thetic HR TF s are compared against acoustically measured HR TF s, HR TF s computed from high-resolution 3D scans [ 25 ], a measured KEMAR reference, and randomly selected mea- sured HR TF s within the SONICOM dataset. Ev aluation com bines n umerical metrics targeting key lo calisation cues (ITD, ILD, and log-sp ectral distortion for monaural cues), b eha vioural predictions from tw o auditory spatial p erception mo dels, and a virtual-reality sound localisa- tion exp erimen t. The aim of this w ork is not to introduce a new individualisation algorithm, but to assess whether photogrammetry-based reconstruction, with minimal sub ject input data and commo dit y hardware, can pro vide a practically useful starting p oin t for individual HR TF s. Sp ecifically , this study addresses three research questions. R Q1 - do PR synthetic HR TF s preserve the k ey n umerical c haracteristics of measured HR TF s, particularly in terau- ral time and lev el differences and monaural spectral cues to a similar exten t as 3D synthetic HR TF s computed from high-resolution scans? R Q2 - do any observ ed numeri- cal differences translate into predicted lo calisation per- formance differences when assessed using computational auditory mo dels? RQ3 - how do PR synthetic HR TF s p er- form in actual sound lo calisation tasks with human listen- ers compared to individual measured and randomly se- lected non-individual HR TF s? By addressing these ques- tions, the study delineates the current capabilities and limitations of this accessible approac h and iden tifies pri- orities for future impro v ements in reconstruction, pro cess- ing, and refinement. 2. Metho ds 2.1. Data A cquisition This study uses pre-existing photogrammetry data from the SONICOM HR TF dataset [ 3 ] to assess the feasi- bilit y of computing individual HR TF s from photographs. F or eac h of the 150 selected sub jects, 72 images had b een captured at 5 ◦ in terv als to ac hieve a full 360 ◦ represen ta- tion. The acquisition proto col in volv ed a custom app on an iPhone XS sending Op en Sound Control (OSC) mes- sages to con trol a motorised turntable whilst the iPhone captured photographs as the turn table rotated. The sub- ject w as seated on a c hair on top of the turntable, and the iPhone was p ositioned at head height using a trip o d, orthogonally aligned to the sub ject’s right side. The dis- tance b et w een the iPhone and the sub ject v aried b et w een sessions. The pre-existing photogrammetry data include high- resolution R GB photographs (2316 × 3088 pixels), depth maps, and iPhone inertial sensor data. All data were acquired using consumer hardw are (iPhone XS) with a custom 3D-printed mirror brac k et to utilise Apple’s T rueDepth tec hnology . This technology pro jects infrared dots and captures their reflections to create depth maps. The photographs are enco ded in the HEIC format, which stores the R GB image and corresponding depth map for eac h file. Figure 1 shows examples of photogrammetry data for one sub ject at differen t angles. Figure 1. Photogrammetry data example from the SONICOM dataset. 2.2. Photogrammetry Reconstruction Photogrammetry reconstruction (PR) transforms t w o-dimensional photographs into a three-dimensional mo del using structure-from-motion techniques. Common features across ov erlapping images are iden tified to com- pute camera p ositions and orientations, pro ducing a sparse p oin t cloud that is subsequently densified. F rom this de nse p oint cloud, a triangulated surface mesh is gen- erated. 2 Sev eral soft w are pack ages w ere ev aluated, including Realit y Capture, Agisoft Metashap e, Autodesk Recap Photo, Meshro om (Alice Vision), and Apple’s Ob ject Capture API. Most produced reconstructions of p oor qualit y , c haracterised by noise and artefacts in tw o key regions, the torso and the upper head, frequently result- ing in implausible geometry suc h as fragmented cranial structures and distorted torso shap es. An informal ev aluation of mesh fidelity , resolution, and ear morphology reveals that Apple’s Ob ject Capture API yields the most accurate and visually consistent re- sults. Reconstructions are free from ma jor artefacts, e x - hibit clean isolation of the sub ject from the background, and show correct geometry for b oth the torso and the upp er head. Based on these findings, Apple’s Ob ject Capture API is selected for implementation. A batch pro cessing pip eline is developed in Swift using Xco de, with 72 in- put images p er sub ject. The pip eline outputs a p olygonal surface mesh in STL format, representing sub ject geom- etry reconstructed from the SONICOM photogrammetry dataset. Eac h reconstructed mesh is paired with a cor- resp onding high-resolution reference scan acquired with an EXScan Pro from the SONICOM dataset. These ref- erence scans were pro cessed by Poole et al. (2025) [ 25 ], including scaling, rotation, b eheading, surface smo othing, and compatibility chec ks for Mesh2HR TF. 2.3. Mesh Pro cessing Before acoustic simulation, all meshes underw en t a pro cessing pip eline to ensure geometric consis- tency and n umerical robustness. The photogrammetry- reconstructed (PR) meshes were aligned to their cor- resp onding high-resolution reference scans (which are aligned to the frankfurt plane) using landmark-based reg- istration, follow ed b y iterative closest-p oin t refinement. Meshes w ere then “b eheaded” ab o v e the shoulders to re- mo v e the torso geometry whilst preserving the head and ears for HR TF synthesis. Residual artefacts, suc h as isolated components, self- in tersections, and non-manifold elements, were remov ed using a combination of automated filters and manual in- sp ection. Curv ature-adaptiv e mesh grading [ 26 ] was ap- plied to refine the mesh resolution in high-curv ature re- gions, suc h as the pinnae, whilst coarsening flatter areas (for example, cheeks and scalp). Finally , distinct mesh re- gions w ere lab elled for the skin, righ t ear canal, and left ear canal to facilitate material assignment and receiver placemen t in subsequent simulations. A minority of reconstructed meshes exhibited exces- siv e geometric complexit y due to prominent hair or facial hair, rendering p ost-processing impractical within com- putational constraints. Such cases were excluded from subsequen t HR TF syn thesis. 2.4. HR TF Syn thesis Mesh2HR TF is an op en-source pack age that computes listener-sp ecific HR TF s in the standardised SOF A format [ 27 ] numerically using a Burton–Miller b oundary element metho d coupled with a m ultilev el fast multipole metho d [ 10 ]. Mesh2HR TF was used to compute synthetic HR TF s from PR meshes follo wing the same configuration and metho dology used b y P oole et al. (2025) [ 25 ] to com- pute synthetic HR TF s from high-resolution 3D scans. The sim ulated frequency range was from 0 to 24 kHz in 150 Hz steps and acoustic propagation was solv ed using ML- FMM BEM solv er. Source and receiv er p ositions w ere matc hed to the SONICOM HR TF measuremen t setup to enable direct comparison with acoustically measured HR TF s. The HR TF syn thesis pro cess follow ed the guide- lines pro vided in the Mesh2HR TF do cumen tation to en- sure metho dological consistency across sub jects and con- ditions. Syn thetic HR TF s were p ost-processed through spatial alignmen t, temp oral windowing, level normalisation, and in teraural time-difference (ITD) remo v al. Source posi- tions w ere first aligned to match the synthetic, measured, and KEMAR reference HR TF s. Eac h head-related im- pulse resp onse (HRIR) w as then window ed to the length of the KEMAR no-ITD HR TF 1 using a 16-sample sine- squared fade-in and a 128-sample cosine-squared fade- out, preserving early energy while atten uating late re- flections. Broadband lev el w as normalised by scaling the HRIRs such that the mean ro ot-mean-square (RMS) lev el at the frontal direction ( 0 ◦ elev ation, 0 ◦ azim uth) matc hed the KEMAR reference, ensuring consistent loud- ness across HR TF s. ITDs were subsequen tly remo v ed b y estimating ear onsets using a threshold-based detector and time-shifting the HRIRs to equalise arriv al times, with a fixed 0 . 8 ms padding. Any wrapp ed samples re- sulting from the shift were zero ed. The n um b er of shifted samples was stored as metadata in the SOF A file in or- der to b e used later in a binaural renderer. The pro cessed HRIRs were stored in SOF A format [ 27 ] as window ed, no-ITD, level-normalised HR TF s. 2.5. Numerical Assessment Syn thetic HR TF s obtained from PR meshes were ev al- uated numerically against acoustically measured HR TF s, syn thetic HR TF s computed by P o ole et al. (2025) [ 25 ] from high-resolution 3D scans (3D synthetic), a measured KEMAR HR TF, and randomly selected measured HR TF s within the SONICOM dataset. The numerical ev aluation fo cused on three primary lo calisation cues: the interau- ral time difference (ITD), the interaural level difference (ILD), and monaural spectral cues. T o quan tify differ- ences in these monaural cues, the log-sp ectral distortion (LSD) metric [ 19 ] was applied, comparing the frequency sp ectra of different HR TF s at each source lo cation and for each ear. All numerical analyses were p erformed us- ing the Spatial Audio Metrics to olb o x (v ersion 0.1.2, K. C. Poole, AXD, Imp erial College London) [ 25 ]: h ttps: //gith ub.com/Katarina- P o ole/Spatial- Audio- Metrics . 1 "KEMAR_Knowl_EarSim_LargeEars_Windowed_NoITD_48kHz.sofa" 3 Descriptiv e statistics are rep orted as the median together with the interquartile range (25th–75th per- cen tile). F or each metric, data distributions are first assessed for normalit y; when the normalit y assump- tion holds, repeated-measures ANO V A is used, with T ukey’s honestly significant difference (HSD) p ost-hoc tests for pairwise comparisons. F or metrics with non- normal distributions, the F riedman test is used instead, follo w ed by pairwise Wilcoxon signed-rank tests with Holm correction for m ultiple comparisons. F or spatial and frequency-dep enden t analyses, cluster-based p erm u- tation testing is applied, with false discov ery rate (FDR; Benjamini–Ho c h berg) correction across clusters to iden- tify regions with significan t differences. 2.5.1. ITD and ILD In teraural time differences (ITDs) are ev aluated af- ter spatial alignment of each candidate HR TF with the measured HR TF by matc hing source directions. F or each matc hed direction, ITD is estimated from the left–right HRIR pair using a threshold-based metho d, yielding the in teraural arriv al-time difference in microseconds. The p er-direction ITD error is defined as the absolute dif- ference b et w een candidate and measured ITDs, and the sub ject-level ITD metric is the mean absolute ITD error across all directions. In teraural lev el differences (ILDs) are computed p er direction as the broadband energy ratio betw een righ t and left ear HRIRs in decib els, with a small constant ϵ to av oid taking the log of zero. The per-direction ILD error is the absolute difference b et ween candidate and measured ILDs, and the sub ject-level ILD metric is the mean absolute ILD error across directions: E L ( d ) = 1 N N X n =1 x 2 L [ n ; d ] , E R ( d ) = 1 N N X n =1 x 2 R [ n ; d ] , ILD • ( d ) = 10 log 10 E R ( d ) + ϵ E L ( d ) + ϵ , ε ILD ( d ) = ILD cond ( d ) − ILD meas ( d ) , ILD = 1 D D X d =1 ε ILD ( d ) [ dB ] . (1) Where: x L [ n ; d ] , x R [ n ; d ] are the left/right HRIR samples at direction d ; N is the HRIR length; E L , E R are the broadband energies; ϵ = 10 − 10 ; ILD • ( d ) is the ILD for either condition or measured HR TF ( • ∈ { cond , meas } ); ε ILD ( d ) is the absolute ILD error for direction d ; and D is the num ber of matched directions. 2.5.2. Log-Sp ectral Distortion and Spectral Analysis Log-sp ectral distortion (LSD) aims to quan tify monaural spectral fidelity . F or each ear and matched direction, the HRIR is transformed into a magnitude sp ectrum via a fast F ourier transform and compared to the corresp onding measured sp ectrum. The p er-direction, p er-ear LSD is computed as the ro ot-mean-square (RMS) difference of the tw o log-magnitude sp ectra across fre- quency , with a small stabilising constant ϵ to a void taking the logarithm of zero: LSD e ( d ) = v u u t 1 K K X k =1 " 20 log 10 | H cond ( e, d, f k ) | + ϵ − 20 log 10 | H meas ( e, d, f k ) | + ϵ # 2 , LSD = 1 2 D D X d =1 X e ∈{ L,R } LSD e ( d ) [ dB ] . (2) Where: H cond ( e, d, f k ) , H meas ( e, d, f k ) are the condition and measured HR TF magnitude at ear e , direction d , frequency bin f k ; e ∈ { L, R } denotes the ear; d is the matc hed direction; D is the n um b er of matc hed direc- tions; K is the num b er of frequency bins; ϵ = 10 − 10 ; and LSD e ( d ) is the RMS difference of log-magnitude sp ectra for ear e and direction d . 2.5.3. Spatial Distribution Analysis The spatial distribution of ITD, ILD, and LSD differ- ences across four comparisons, av eraged ov er 150 sub jects w as examined. F or eac h azim uth–elev ation p osition with 45 ° steps and eac h metric, a one-sample t-test was p er- formed across sub jects to test whether the signed mean cue difference b et ween HR TF s conditions and measured HR TF s differed from zero. P-v alues w ere corrected for m ultiple comparisons across p ositions using the FDR pro- cedure (p er condition and metric). This allo ws detailed examination of where these errors o ccur spatially and whic h locations sho w significant differences. 2.6. Mo del-Based Assessmen t Whilst n umerical ev aluation pro vides indications of the p erformance of HR TF s based on localisation cues, these metrics do not directly capture their p erceptual impact. Auditory mo dels allo w n umerical representation of how the human auditory system would interpret sp e- cific filters for different sound lo cations. Spherical sound- lo calisation models are designed to reflect how a human listener w ould respond to stimuli during a lo calisation test, thereby characterising the quality of spatialisation obtained using a giv en set of HR TF s. 2.6.1. Mo del Implemen tation T wo auditory models from the Auditory Mo delling T o olb o x (AMT) w ere employ ed to predict localisation p erformance: Baumgartner2014 [ 28 ], whic h compares in- ternal sound representations with a template to yield probabilistic predictions of p olar-angle responses, and Barumerli2023 [ 29 ], a Ba y esian mo del that p erforms opti- mal information processing of spatial cues. Both mo dels use directional transfer functions (DTF s) deriv ed from HR TF s as inputs, with eac h sub ject’s measured HR TF serving as the template. T arget HR TF s tested include the 4 measured HR TF, 3D syn thetic HR TF [ 25 ], PR synthetic HR TF, KEMAR HR TF, and a randomly selected mea- sured HR TF from the SONICOM dataset. Mo del parameters for baumgartner2014 were adopted from Lladó et al. (2025) [ 30 ], who show ed that a notc h-region spectral w eigh ting around 8 kHz best ac- coun ted for listener p erformance in a lo calisation task. The parameters corresp ond to the median of the individu- ally fitted v alues for the notch-region mo del v arian t across listeners. F or barumerli2023, parameters were taken from Daugin tis et al. (2023) [ 31 , 32 ] as the median v alues fit- ted across 16 sub jects in p erceptual lo calisation exp eri- men ts. The parameter sets for b oth mo dels are liste d in T able 1 . Model predictions are statistically compared us- ing rep eated measures ANO V A with T uk ey’s HSD p ost- ho c tests for pairwise comparisons. T able 1. Auditory mo del parameters. Mo del P arameter V alue Baumgartner2014 Sensitivit y ( γ ) 3.87 Sp ecificit y (S) -6.77 Mistak e rate ( ϵ ) 13.11 Max. frequency 17 kHz Lateral angles ± 75 ° , ± 50 ° , ± 25 ° , 0 ° Barumerli2023 MC sim ulations ( N exp ) 50 ILD noise ( σ ILD ) 0.75 Sp ectral noise ( σ spectral ) 4.3 Prior uncertain ty ( σ prior ) 11.5 Motor noise ( σ motor ) 13.45 2.7. Behavioural Assessment Whilst auditory mo dels allow numerical represen ta- tion of how the human auditory system would interpret sp ecific filters for different sound lo cations, perceptual ev aluation through lo calisation exp erimen ts pro vides di- rect insigh t into ho w synthetic HR TF s perform in listen- ing scenarios. Lo calisation performance is assesse d us- ing the virtual-reality (VR) lo calisation test dev elop ed b y Daugintis et al. (2023, 2024) [ 32 , 33 ] in Unity , pre- sen ted through a Meta Quest 3 VR headset with real-time head and controller tracking. Participan ts first completed a 87-trial training phase using a loudsp eak er array to fa- miliarise themselv es with the task. In each trial, a vir- tual sound source is presen ted, and participants indicate the perceived direction b y pointing with a VR controller and pressing the trigger. The training phase comprised 29 unique source directions, each presented three times in a randomised order, yielding 87 trials in total. F or the first 29 trials, the audio source p osition was indicated visually . Thereafter, the visual indicator was remov ed and partic- ipan ts were informed that subsequent lo calisations m ust rely solely on auditory cues. Colour-co ded angular error feedbac k w as provided after each resp onse: green ( ≤ 5 ° ), y ello w ( ≤ 20 ° ), orange ( ≤ 35 ° ), and red ( ≤ 35 ° ). When the angular error exceeded 5 ° , up to tw o additional correction attempts w ere p ermitted for that p osition, with the vi- sual source indicator reinstated on the second correction attempt. Three HR TF conditions are ev aluated: (1) the par- ticipan t’s acoustically measured HR TF, (2) the PR syn- thetic HR TF, and (3) a randomly selected (differen t for eac h participant) measured HR TF within the SONICOM dataset. The latter condition w as chosen in order to b e the b enc hmark for a non-individual HR TF. Condition or- der was randomised for each participan t and each trial. The stim ulus is a sequence of three consecutiv e Gaussian noise bursts (100 ms each) windo w ed with a Hann func- tion, resulting in a total duration of 300 ms. The stim- ulus is presented using the 3D T une-In T o olkit [ 34 ] via its Unit y W rapp er. Sennheiser HD599 headphones are di- rectly plugged into the VR headset with the same set vol- ume across participants of 65 dBA which v aried slightly dep ending on stim ulus p osition. The exp erimen t comprises three blo c ks of 99 trials, co v ering 33 distinct source p ositions distributed across 16 azim uths spanning the full horizontal circle (0 ° to 330 ° ) and elev ations from -30 ° to 90 ° . Elev ation sampling is densest along the cardinal axes (0 ° , 90 ° , 180 ° , 270 ° ), with up to five elev ations p er azimuth, and includes diagonal directions (45 ° , 135 ° , 225 ° , 315 ° ) at tw o elev ations (-30 ° , 30 ° ). Intermediate azimuths (30 ° , 60 ° , etc.) are sampled at the horizon tal plane only . Source positions are pre- sen ted in a random order for eac h participant and trial. The p oin ting direction is recorded together with the cor- resp onding HR TF condition and source position. 2.8. Behavioural analysis Beha vioural p erformance is quantified using seven er- ror metrics: the great circle error (ov erall angular devi- ation b et w een target and resp onse on the sphere), the absolute lateral accuracy , the lateral precision, the abso- lute p olar accuracy , the polar precision, the fron t-bac k confusion rate and the quadrant error. F ront-bac k con- fusions are classified using the metho d of P oirier-Quinot et al. (2022) [ 35 ], defined as responses falling within a 45 ◦ cone around the mirrored fron t–bac k p osition of the target. Quadrant error is computed in lateral–p olar co- ordinates following Middlebro oks [ 36 ] as the p ercen tage of resp onses that are assigned to a differen t lateral–p olar quadran t than the target. F or each participant, p er-HR TF/lo cation p erformance is aggregated using the median across trials. Group-lev el statistics are computed as the median together with the in terquartile range (25th–75th p ercen tile) of participan t medians. Statistical analysis uses the Shapiro-Wilk test to assess normality of the distribution for each metric. F or metrics with normal distributions, rep eated-measures analysis of v ariance (ANO V A) is p erformed, follo w ed by T ukey’s HSD p ost-ho c test for pairwise comparisons. F or metrics with non-normal distributions, the F riedman test is used, follo w ed by pairwise Wilcoxon signed-rank tests with Holm correction for multiple comparisons. P earson correlation coefficients are computed to quan tify the lin- ear relationship b et ween target and resp onse p ositions in horizon tal and median planes. 5 T o examine whether sp ectral similarit y b et w een mea- sured and randomly selected HR TF s influences lo calisa- tion p erformance, a supplemen tary correlation analysis w as conducted. F or each of the 27 participants, the log- sp ectral distortion (LSD) betw een their measured HR TF and the assigned random HR TF was computed ov er the 1–16 kHz frequency range, a v eraged across all spatial di- rections and b oth ears. P earson correlation co efficien ts w ere then calculated b et w een these LSD v alues and the p erformance differences b et w een non-individual and in- dividual (Random min us Measured) for four b eha vioural metrics. 3. Results 3.1. 3D Reconstruction T o describ e qualitatively ho w photogrammetry- reconstructed (PR) meshes compare to high-resolution 3D scans, wireframe views were inspected in Blender for all sub jects. This comparison is descriptiv e only; n umer- ical geometric metrics were not applied, as differences in mesh source, neck cut, and alignmen t would confound di- rect mesh-to-mesh distance measures. The following ob- serv ations summarise what was seen across the recon- structed meshe s. Globally , b oth reconstructions capture the main fea- tures of eac h sub ject, including head width, ey es p osi- tions, lips, nose, chin, cheeks, and forehead. How ev er, clear discrepancies are observed in the external ear region. The principal differences concern the num ber of faces and v ertices, which determine mesh resolution and the level of morphological detail. The 3D scans, illustrated in Figure 2 (left), provide highly detailed and anatomically accu- rate representations of the pinna, with well-defined struc- tures such as the helix, lobule, antihelix, and concha. In con trast, the PR meshes, illustrated in Figure 2 (right), exhibit coarse geometry in this region, with ov ersimpli- fied pinna features that did not capture individual ear morphology . PR meshes were scaled to m atc h the high- resolution reference b efore HR TF computation. Although fine ear morphology is not reconstructed, the PR meshes retain sufficien t ov erall head and ear geometry for initial HR TF syn thesis. 3.2. Sp ectral Characteristics Sp ectral representations allow insp ection of direction- dep enden t sp ectral cue s, such as pinna-related p eaks and notches, and facilitate qualitativ e comparison of sp ectral fine structure b et w een individual and non- individual measured, 3D syn thetic, and PR syn thetic HR TF s. Magnitude resp onses are visualised as heatmaps o v er azimuth and elev ation. The comparisons in Figs. 3 and 4 illustrate av eraged magnitude resp onses (dB) of left ear HRIRs for four randomly selected sub jects in the az- im uth plane (elev ation 0 ◦ ) and elev ation plane (azim uth 0 ◦ ), resp ectiv ely . HRIRs are transformed to HR TF s by applying the fast F ourier transform, with the resulting sp ectra limited to 0 Hz–20 kHz. Figure 2. Wireframe views of the high-resolution 3D scan mesh (left, sub ject P0004, right ear) and the photogrammetry-reconstructed mesh (right, same sub ject and same ear). Figure 3. Azimuth plane: F our sub jects measured, 3D syn thetic, PR synthetic and random HR TF s (left HR TF s). Figure 4. Elev ation plane: F our sub jects measured, 3D syn thetic, PR synthetic and random HR TF s (left HR TF s). 6 In the azimuth plane, individual and non-individual measured HR TF s show ric h direction-dependent spec- tral structure, including multiple pinna-related p eaks and notc hes that shift systematically with azimuth. The indi- vidual 3D synthetic HR TF s app ear to ha ve sligh tly less pronounced direction-dep enden t sp ectral structure but seems to capture the individual pinna-related p eaks and notc hes. The corresponding PR syn thetic HR TF s exhibit smo other sp ectra with reduced dynamic range and few er pronounced notches, esp ecially ab o ve ≈ 6 kHz. In the elev ation plane, individual and non-individual measured HR TF s displa y moving high-frequency notches that enco de elev ation, whereas the synthetic representa- tions app ear smo othed with attenuated (3D) close to non- existen t (PR) fine structure. These examples indicate that PR syn thetic HR TF s capture directional trends but sub- stan tially reduced pinna-related peaks and notches. 3.3. A verage Metrics T o quan tify sp ectral differences observ ed in Figs. 3 and 4 and to ev aluate the localisation cues differences across conditions, Figure 5 summarises sub ject-av eraged metrics across 150 sub jects for four conditions (3D syn- thetic, PR synthetic, KEMAR and Random) against mea- sured HR TF s. Figure 5. A verage metrics across 150 sub jects showing median [25th-75th p ercen tile] with significance bars. A. Absolute ITD difference ( µ s), B. Absolute ILD difference (dB), C. Log-Sp ectral Distortion (dB). (* p < 0 . 05 , ** p < 0 . 01 , *** p < 0 . 001 ). The statistical test revealed significant differences amongst conditions for all three metrics ( p < 0 . 001 ). ITD differences remain lo w for all conditions (medians < 35 µ s), with 3D synthetic HR TF s achieving the lo west ITD difference (21.8 µ s), follow ed by the PR synthetic (24.5 µ s), KEMAR (32.8 µ s), and Random (34.7 µ s) HR TF s. This indicates that individual head geometry (3D and PR syn thetic) provides measurable b enefits for ITD preserv a- tion ov er non-individual conditions. 3D syn thetic HR TF s achiev e low er ILD differences (1.7 dB) than all other conditions ( p < 0 . 001 ). PR syn thetic HR TF s exhibit elev ated ILD differences (2.8 dB) com- pared to 3D syn thetic ( p < 0 . 001 ), KEMAR (1.8 dB, p < 0 . 001 ), and Random (2.1 dB, p < 0 . 001 ). KEMAR and Random conditions sho w no difference ( p = 0 . 179 ). LSD metrics rev eal the most pronounced condition differences. Random HR TF s achiev e the low est sp ectral distortion (6.6 dB), follow ed b y KEMAR (7.6 dB), 3D syn thetic (9.0 dB), and PR syn thetic (10.2 dB) ( p < 0 . 001 ). Critically , PR synthetic HR TF s exhibit higher sp ectral distortion than all other conditions. These aggregate metrics demonstrate that whilst PR syn thetic HR TF s preserv e ITD cues, they in tro duce sub- stan tial ILD and sp ectral errors that are even higher than those of non-individual HR TF s. 3.4. Spatial Distribution of Lo calisation Cues The direction-dependence of HR TF s motiv ates the analysis of where these errors o ccur spatially and which lo cations sho w significant differences. The spatial dis- tribution of ITD, ILD, and LSD differences across four comparisons (PR synthetic, 3D synthetic, Random, and KEMAR versus Measured HR TF s; condition m in us mea- sured), av eraged ov er 150 sub jects, is presented in Fig. 6 . The heatmaps show the signed mean difference ( µ s for ITD, dB for ILD and LSD), whilst b o xes outlined in black indicate spatial lo cations where differences are significant or not with increasing thickness. F or PR synthetic HR TF s, ITD differences remain close to zero around frontal directions but sho w systematic bi- ases at lateral azimuths and negativ e elev ation p ositions, where PR synthetic HR TF s tend to underestimate ITDs on the contralateral side and ov erestimate them on the ip- silateral side. The 3D synthetic comparison shows a sim- ilar pattern compared to PR syn thetic HR TF s. Random HR TF s exhibit no systematic ITD biases across all loca- tions. A complementary unsigned analysis revealed that the Random condition yields larger, more widespread and less lo calised unsigned ITD differences than the other conditions. Across sub jects, these ITD differences in the Random condition are not consisten tly biased in one di- rection relative to the measured HR TF so there is no con- sisten t group-lev el bias in Fig. 6 . KEMAR HR TF s show systematic ITD differences, largely underestimating on the contralateral side and o v erestimating on the ipsilat- eral side. Regarding the ILD differences, PR synthetic HR TF s sho w a more widespread pattern of significance and higher signed magnitudes at lateral p ositions. The 3D syn thetic comparison shows a similar pattern. Random HR TF s ex- hibit few ILD biases at the -135 ° lateral back lo cation, and across sub jects these ILD differences are not consis- ten tly biased in one direction. KEMAR HR TF s show p os- itiv e ILD biases across the ma jorit y of p ositions, meaning KEMAR ILDs are systematically larger than the individ- ual measured ILDs. F or LSD, all conditions show ed significan t devia- tions from the measured HR TF s at all p ositions (FDR- 7 Figure 6. Spatial distribution of ITD (top ro w), ILD (middle row), and LSD (b ottom ro w) signed mean differences (condition min us measured) for four HR TF comparisons versus measured HR TF s, a veraged ov er 150 sub jects. The div erging colour map intensit y represents signed mean error magnitude (Blue: Negativ e; Red: P ositiv e). Black frames indicate positions where the group-mean difference is significantly different from zero after FDR correction across p ositions (thin: p < 0.05; medium: p < 0.01; thick: p < 0.001; no frame: not significant). corrected (p < 0.001)). The magnitude and spatial pat- tern of LSD are more informative than the significance co ding in this case. The PR syn thetic comparison sho ws a similar spatial pattern of LSD differences compared to the 3D syn thetic HR TF s with higher LSD at negative el- ev ation positions. Random HR TF s sho w LSD errors that are low er across all lo cations compared to b oth syn thetic conditions and KEMAR, with LSD errors for KEMAR ev enly spatially distributed across locations similarly to Random HR TF s. These spatial patterns reveal that whilst syn thetic HR TF s preserve ITD cues reasonably well as indicated in Fig. 5 , they introduce sp ectral errors (LSD) that are spatially distributed and highest at negative elev ation p o- sitions. Syn thetic HR TF s sho w localised ITD and ILD biases at lateral azimuths and negative elev ation p osi- tions. KEMAR HR TF s, in contrast, in troduce a system- atic p ositiv e ILD bias across nearly all spatial positions, indicating that the mannequin’s head geometry pro duces consisten tly larger in teraural level differences than indi- vidual sub jects. KEMAR imp oses a global unidirectional scaling of interaural time differences for 150 sub jects. Random HR TF s, while exhibiting LSD errors at all p osi- tions, do not produce consistent group-lev el ITD or ILD biases in one direction but sho w higher and more spatially distributed unsigned ITD differences. The unsigned ILD distribution reveals more spatially widespread differences for Random HR TF s compared to other conditions. 3.5. F requency-Dep enden t Sp ectral Distortion T o identify which frequency regions show significan t differences b et w een HR TF conditions and the measured HR TF, LSD v alues were a veraged across ears, directions, and sub jects (N = 150) for the four HR TF conditions (3D synthetic, PR synthetic, KEMAR, and Random; see Fig. 7 . The upp er panel sho ws the av erage LSD curves for eac h condition, whilst the lo wer panel displa ys cluster- based permutation statistics identifying significan tly dif- ference frequency clusters ( p < 0 . 05 ). Horizon tal bars in- dicate frequency clusters corresp onding to the condition exhibiting the higher LSD for eac h of the six pairwise comparisons. A cross all conditions, the LSD remains relatively lo w at low frequencies (< 500 Hz) except for the KEMAR HR TF, which sho ws elev ated distortion compared to all other conditions from 250 Hz onw ards (purple bar, p < 0 . 001 ). Ab o v e 2 kHz, the LSD increases progressiv ely for all conditions, with the steep est rise o ccurring ab o v e 12 kHz for the syn thetic conditions. 3D syn thetic HR TF s show low er distortion than PR syn thetic HR TF s across multiple frequency clusters: ≈ 2 kHz ( p < 0 . 05 ), 3–10 kHz ( p < 0 . 001 ), and 12–20 kHz ( p < 0 . 001 ), indicating that higher mesh resolu- tion provides consistent b enefits across a broad frequency range. PR synthetic HR TF s exhibit higher distortion than Random HR TF s across the en tire sp ectrum. Whilst both 3D and PR synthetic HR TF s follow Random HR TF s closely in mid-frequencies (as observ ed in the ov erlapping curv es), they div erge ab o v e ≈ 11 kHz, with PR synthetic sho wing the most sev ere degradation. 8 Figure 7. F requency-dep endent log-sp ectral distortion across 150 sub jects. T op: Mean LSD curv es with standard deviation bands for four HR TF conditions compared to measured HR TF s. Bottom: Cluster p erm utation statistics sho wing frequency regions where each ro w corresp onds to one pairwise comparison. F or a given bar, coloured segments mark the frequency clusters where that condition has a significantly higher LSD than its counterpart. Asterisks indicate significance levels (* p < 0 . 05 , ** p < 0 . 01 , *** p < 0 . 001 ). Ov erall, frequency-dep enden t sp ectral distortion anal- ysis reveals that PR s yn thetic HR TF s show higher dis- tortion than 3D synthetic HR TF s esp ecially after 1 kHz. Bey ond 12 kHz to 20 kHz both synthetic conditions de- viate muc h more than the KEMAR and Random condi- tions. 3.6. Auditory Mo dels 3.6.1. Baumgartner2014 Mo del T o assess whether an y observed n umerical differences translate into predicted lo calisation p erformance differ- ences, mo del-based assessment was p erformed on the dif- feren t HR TF sets. The Baumgartner2014 mo del predicts lo calisation p erformance across six metrics sho wing me- dian [25th-75th p ercen tile] with significance bars (Fig. 8 ). The measured HR TF baseline (template = target) yields the most accurate predictions: |p olar accuracy| = 36.3 ° , quadran t error = 17.5%, front-bac k confusions = 0.0%. F or |p olar accuracy|, 3D synthetic (69.9 ° ) and Random (66.4 ° ) HR TF s demonstrate b etter predicted p erformance than KEMAR (72.8 ° , p < 0 . 001 ) and PR syn thetic (79.7 ° , p < 0 . 001 ). The 3D syn thetic and Random conditions show small difference in predicted p o- lar accuracy ( p = 0 . 029 ). PR syn thetic predictions ex- hibit the p oorest p olar accuracy , p erforming worse than all other non-individual conditions ( p < 0 . 001 ). Regarding predicted confusion rates, 3D syn thetic HR TF s yield lo wer front-bac k confusions (10.1%) com- pared to PR syn thetic (14.0%, p < 0 . 001 ), KEMAR (13.8%, p < 0 . 001 ), and Random (13.2%, p < 0 . 001 ). F or quadrant errors, 3D synthetic (37.9%) and Random (37.4%) show statistically equiv alent predicted p erfor- mance ( p = 0 . 752 ), b oth outp erforming PR synthetic (43.1%) and KEMAR (41.3%) with p < 0 . 001 . 3.6.2. Barumerli2023 Mo del The Barumerli2023 mo del predictions across six met- rics are presen ted in Fig. 9 sho wing median [25th-75th p ercen tile] with significance bars. The measured HR TF baseline demonstrates the low est predicted errors: great circle error = 16.2 ° , |p olar accuracy| = 14.2 ° , front-bac k confusions = 2.8%. F or predicted |polar accuracy|, Random HR TF s (19.2 ° ) outp erform 3D synthetic (22.6 ° ), PR synthetic (26.1 ° ) and KEMAR (22.5 ° ) with p < 0 . 001 . Notably , 3D synthetic and KEMAR predictions show no dif- ference ( p = 0 . 671 ). PR syn thetic predictions exhibit higher |p olar accuracy| errors (26.1 ° ) compared to all other conditions ( p < 0 . 001 ). The Barumerli2023 mo del predicts systematically low er absolute p olar errors than Baumgartner2014 across all HR TF conditions. F or front-bac k confusions, 3D synthetic and Random HR TF s demonstrate statistically equiv alen t predicted p erformance. These conditions yield low er predicted fron t-bac k confusion rates than PR syn thetic and KEMAR ( p < 0 . 001 ). Sp ecifically , predicted front-bac k confusions for 3D synthetic (7.3%) and Random (7.3%) are appro ximately half those predicted for KEMAR (17.7%) and lo w er than PR synthetic (12.9%, p < 0 . 001 ). Predicted quadrant error rate from the Barumerli2023 mo del are illustrated in Fig. 10 . The measured HR TF baseline yields the low est predicted quadran t errors (6.9%), establishing reference p erformance. Amongst the other conditions, Random HR TF s demonstrate the b est predicted p erformance (14.3%), follow ed by 3D synthetic (16.0%), PR syn thetic (25.6%) and KEMAR (31.5%). Statistical analysis reveals that 3D synthetic HR TF s ex- hibit low er predicted quadran t errors than PR synthetic ( p < 0 . 001 ) and KEMAR ( p < 0 . 001 ), but higher er- rors than Random HR TF s ( p = 0 . 005 ). PR synthetic pre- dictions are worse than all other conditions ( p < 0 . 001 ) 9 Figure 8. Baumgartner2014 mo del predictions across 150 sub jects showing median [25th-75th p ercen tile] with sig- nificance bars. Metrics: A. |Polar Accuracy| ( ° ), B. P olar A ccuracy (Bias) ( ° ), C. Polar Precision ( ° ), D. RMS Polar (Median Lo cal) ( ° ), E. Quadran t Error (%), F. F ront-Bac k Confusions (%). (* p < 0 . 05 , ** p < 0 . 01 , *** p < 0 . 001 ). except KEMAR that exhibits the highest predicted quad- ran t error rate. Ov erall, b oth mo dels agree on the ranking of condi- tions: measured HR TF s results in b est predictions, fol- lo w ed by 3D synthetic and Random, with PR synthetic and KEMAR revealing w orse predictions. PR syn thetic HR TF s are consisten tly predicted to p erform worst or second-w orst, esp ecially on p olar accuracy , quadran t er- ror, and fron t-bac k confusions. These predictions are, ho w ever, based on auditory models that are calibrated for measured HR TF s and hav e not b een v alidated sp ecifi- cally for synthetic HR TF s. Assessment of the lo calisation cues pro vided by these HR TF s for human listeners there- fore still requires direct behavioural testing in a sound lo calisation task. 3.7. Lo calisation T est T o assess liste ners’ lo calisation p erformance with syn- thetic HR TF s, a b eha vioural listening test w as conducted with 27 normal-hearing participan ts emplo ying acous- tically measured, PR syn thetic, and randomly selected HR TF s. Lo calisation resp onses in the horizontal and me- dian planes for the three HR TF conditions are shown in Fig. 11 , with Pearson correlation coefficients quan tifying the linear relationship b et ween target and resp onse p osi- tions. Correlation analysis rev eals distinct p erformance pat- terns across conditions and spatial planes. In the hori- zon tal plane, all HR TF conditions show strong correla- tions ( p < 0 . 001 ): Measured ( r = 0 . 705 ), PR Syn thetic ( r = 0 . 691 ) and Random ( r = 0 . 700 ). These v alues indi- cate a strong linear trend b et w een target and resp onse in the horizontal plane for all three conditions. The extent to whic h errors reflect random v ariability versus system- atic biases (e.g. front–bac k confusions) can b e seen in the ra w data in Fig. 11 . In contrast, the median plane sho ws mark edly di- v ergen t p erformance. Measured HR TF s exhibit mo der- ate correlation ( r = 0 . 548 , p < 0 . 001 ), indicating pre- serv ed elev ation p erception despite increased v ariabilit y . Random HR TF s show weak but significant correlation ( r = 0 . 248 , p < 0 . 001 ), suggesting substantial elev ation confusion. Critically , PR Synthetic HR TF s show no corre- lation ( r = 0 . 030 , p = 0 . 426 ), indicating near-random ele- v ation resp onses widely distributed across incorrect quad- ran ts and frequent fron t–back confusions. Aggregate lo calisation metrics in Fig. 12 quantify p er- formance differences observed in the correlation analysis across six metrics sho wing median [25th-75th percentile] 10 Figure 9. Barumerli2023 mo del predictions across 150 sub jects showing median [25th-75th p ercen tile] with significance bars. Metrics: A. Great Circle Error ( ° ), B. |Lateral Accuracy| ( ° ), C. Lateral Precision ( ° ), D. F ront-Bac k Confusions (%), E. |Polar A ccuracy| ( ° ), F. P olar Precision ( ° ). (* p < 0 . 05 , ** p < 0 . 01 , *** p < 0 . 001 ). Figure 10. Barumerli2023 model predicted quadrant er- ror rate across 150 sub jects showing median [25th-75th p ercen tile] with significance bars (* p < 0 . 05 , ** p < 0 . 01 , *** p < 0 . 001 ). with significance bars. Measured individual HR TF s yield lo w er great-circle error (23.4 ° ) than b oth PR syn thetic (39.3 ° , p < 0 . 001 ) and Random HR TF s (30.5 ° , p < 0 . 01 ), as shown in Fig. 12 A. PR synthetic HR TF s pro duced higher errors than Random HR TF s ( p < 0 . 001 ). Azim uthal lo calisation remained relatively robust across HR TF types, consisten t with the horizontal plane correlations. Absolute lateral accuracy show ed no sig- nifican t differences amongst measured (10.2 ° ), PR syn- thetic (10.7 ° ), and Random (10.9 ° ) conditions (Fig. 12 B). Similarly , lateral precision exhibited no differences be- t w een HR TF conditions (Fig. 12 C). In con trast, elev a- tion perception show ed mark ed degradation, corrob orat- ing the weak median plane correlations. Measured HR TF s yielded low er absolute p olar accuracy (30.6 ° ) than b oth PR synthetic (51.4 ° , p < 0 . 001 ) and Random HR TF s (43.8 ° , p < 0 . 001 ), as illustrated in Fig. 12 E. PR syn- thetic HR TF s exhibited higher p olar errors than Random HR TF s ( p < 0 . 001 ). Polar precision (Fig. 12 F) revealed that PR synthetic and Random HR TF s sho w ed higher v ariability compared to measured HR TF s ( p < 0 . 05 ). F ront–bac k confusion rates (Fig. 12 D) w ere low est for measured HR TF s (8.1%) and higher for b oth PR syn- thetic (18.2%, p < 0 . 001 ) and Random (13.1%, p < 0 . 05 ) conditions, with significan t difference b et w een the latter t w o ( p < 0 . 05 ). These elev ated confusion rates corrobo- rate the weak median plane correlations observed for PR syn thetic and Random HR TF s. 11 Figure 11. Raw lo calisation resp onses for 27 participants in horizontal (top row) and median (bottom row) planes. Eac h p oin t represents a single trial coloured b y confusion t yp e (green = precision, red = front–bac k, purple = in-cone, blue = off-cone). Dashed line indicates p erfect lo calisation. Pearson correlation co efficien ts (r) with significance levels are shown for eac h condition. Figure 13 sho ws the quadrant error (QE) confusion metric results with v alues rep orted as median [25th–75th p ercen tile] of participan t medians. The measured HR TF condition achiev ed low er rates (15.4%) to PR synthetic (40.6%) and to Random (27.1%) ( p < 0 . 001 ) with signif- ican t difference b et w een the latter tw o ( p < 0 . 01 ). The lo calisation test shows that elev ation-related lo- calisation (p olar accuracy , fron t–bac k and quadrant con- fusions) is strongly degraded for PR synthetic and, to a lesser exten t, for Random HR TF s, while azimuth remains robust across conditions, and that PR syn thetic HR TF s yield the p oorest o v erall lo calisation p erformance. 3.8. Sp ectral Similarit y and Beha vioural Performance In the localisation exp erimen t, eac h participant was assigned a differen t randomly selected measured HR TF from the SONICOM dataset as the non-individual con- dition, so that the benchmark reflects a non-individual HR TF rather than a single mannequin. A potential con- cern with this approac h is that sp ectral similarity b et w een eac h participan t’s measured HR TF and their assigned random HR TF v aries across participants (some may re- ceiv e an HR TF sp ectrally close to their o wn, others one that is sp ectrally more differen t). If that similarity influ- enced p erformance, the Random condition would b e an unfair or inconsisten t b enc hmark. T o test whether s pec- tral distance predicts b eha vioural outcome, LSD b et ween eac h participan t’s measured HR TF and their assigned random HR TF was correlated with the performance dif- ference (Random minus Measured) for four b eha vioural metrics. F or PR syn thetic HR TF s, each participant re- ceiv ed their own, so there is no betw een-participan t v ari- ation in which PR HR TF is assigned. The present analy- sis therefore fo cuses on the Random condition, where as- signmen t v aries. LSD v alues ranged from 5.26 to 8.78 dB (median: 7.14 ± 0.77 dB) across the 27 participants, in- dicating relativ ely modest inter-participan t v ariation in sp ectral distance to the assigned random HR TF. Figure 14 sho ws the relationship b et w een LSD and p erformance differences for each metric. Eac h red p oin t represen ts one participant. Dashed red lines indicate lin- ear regression fits. No significan t (ns) correlations w ere observ ed: great-circle error ( r = − 0 . 008 , p = 0 . 9671 ), absolute p olar accuracy ( r = 0 . 187 , p = 0 . 3504 ), front- bac k confusion rate ( r = 0 . 060 , p = 0 . 7652 ), and quad- ran t error rate ( r = 0 . 233 , p = 0 . 2420 ). The absolute lateral accuracy is not sho wn as no significan t correla- tion w as obtained ( r = − 0 . 064 , p = 0 . 7498 ). All corre- lation co efficien ts were near zero ( | r | < 0 . 25 ), indicating no linear relationship b et w een sp ectral distance and b e- ha vioural performance differences. Substantial individual 12 Figure 12. Lo calisation p erformance metrics for 27 participants showing median [25th-75th p ercen tile] with signifi- cance bars for Measured, PR synthetic, and Random HR TF s. A. Great-circle error ( ° ), B. Absolute lateral accuracy ( ° ), C. Lateral precision ( ° ), D. F ront-bac k confusions (%), E. Absolute p olar accuracy ( ° ), F. Polar precision ( ° ). (* p < 0 . 05 , ** p < 0 . 01 , *** p < 0 . 001 ). v ariability was observed, with some participan ts p erform- ing b etter with the random HR TF despite high LSD v al- ues, whilst others p erformed w orse despite lo w LSD v al- ues. These findings suggest that simple sp ectral similarity alone do es not predict HR TF compatibilit y for lo calisa- tion tasks and supp ort the use of a different randomly selected non-individual HR TF p er participan t as a v alid b enc hmark for the Random condition. 4. Discussion 4.1. RQ1: Numerical Fidelit y of PR Syn thetic HR TF s Statistical analysis across 150 sub jects demonstrates that PR synthetic HR TF s preserv e in teraural timing cues but exhibit degraded ILDs and sp ectral fidelit y . Aggregate metrics (Fig. 5 ) demonstrate preserv ed ITD accuracy for PR synthetic and 3D synthetic HR TF s, b oth outp erforming non-individual conditions. Ho w ever, ILD errors for PR syn thetic are higher compared to all other conditions. Critically , LSD analysis reveals PR synthetic HR TF s exhibit higher spectral distortion than all other conditions, with all pairwise comparisons reaching signif- icance. LSD v alues for non-individual measured HR TF s (median 6.6 dB) are in line with v alues obtained in past researc h [ 18 , 19 , 20 ] on the SONICOM dataset. The align- men t with prior literature supp orts the metho d used to obtain these metric results and their v alidit y . Spatial analysis (Fig. 6 ) with p erm utation testing iden tifies ITD and ILD deviations concentrated at lateral azim uths ( ± 90 ° , ± 135 ° ) and negative elev ation angles. The absence of a torso in the 3D meshes could p oten- tially explain the negative elev ation errors, as torso and shoulder geometry are kno wn to contribute to elev ation- dep enden t cues and to improv e congruence with mea- sured HR TF s in the v ertical direction [ 37 , 38 ]. F requency-dep enden t cluster p erm utation analysis (Fig. 7 ) indicates that PR synthetic HR TF s exhibit higher distortion than 3D syn thetic HR TF s, particularly after 1 kHz. Beyond 12 kHz to 20 kHz, b oth synthetic conditions deviate more compared to the KEMAR and Random con- ditions. This high deviation from the synthetic conditions could b e due to limitations in the BEM calculations, as the wa v elength decreases and the mesh resolution b e- comes insufficient [ 12 , 38 ] and also the difference of mag- nitude betw een the measured and syn thetic HR TF s at high frequencies due to the HR TF measurement micro- phone frequency resp onse [ 3 ]. 13 Figure 13. Quadrant error metric for 27 participants sho wing median [25th-75th p ercen tile] with significance bars for Measured, PR synthetic, and Random HR TF s. (* p < 0 . 05 , ** p < 0 . 01 , *** p < 0 . 001 ). Sp ectral heatmaps (Figs. 3 , 4 ) indicate that mea- sured HR TF s exhibit direction-dep enden t fine structure with prominen t pinna-related notc hes, whilst PR syn- thetic HR TF s displa y smo othed characteristics with at- ten uated high-frequency features. This sp ectral degrada- tion, quantified through statistical analysis, directly re- flects coarse pinna geometry in PR meshes and critically impairs monaural cues. In answer to RQ1, PR synthetic HR TF s do not preserv e the k ey n umerical characteristics of measured HR TF s to a similar extent as 3D synthetic HR TF s. The presen t w ork fo cuses on a single PR and mesh- pro cessing pipeline and on a sp ecific HR TF syn thesis metho d (Mesh2HR TF) and measurement configuration. The results ma y therefore not generalise to alternative reconstruction algorithms, mesh-optimisation strategies, or numerical solvers. F urther work to close this gap would need to improv e capture of fine pinna detail (e.g. through higher-resolution reconstruction or targeted ear refine- men t), consider inclusion of torso geometry in the sim- ulation, or combine PR with c omplemen tary individual- isation steps. Whether the observ ed numerical degrada- tions translate into predicted or actual p erceptual impair- men ts is addressed by the auditory mo delling (RQ2) and b eha vioural (RQ3) assessmen ts below. 4.2. RQ2: Predicted P erceptual Impact Auditory mo del predictions across 150 sub jects indi- cate that n umerical degradation in PR synthetic HR TF s translates to substantial predicted lo calisation impair- men t. Both Baumgartner2014 and Barumerli2023 mo d- els predict po orest p erformance for PR synthetic HR TF s across all metrics. Sp ecifically , Baumgartner2014 predicts that PR syn thetic p olar accuracy is worse than 3D syn- thetic , KEMAR and Random. Barumerli2023 predic- tions corrob orate this pattern. Baumgartner2014 pre- dicts PR synthetic fron t-back confusions and higher quad- ran t errors than 3D synthetic and Random conditions. Barumerli2023 similarly predicts PR syn thetic higher fron t-bac k confusions than 3D synthetic and Random. Mo del predictions should be in terpreted within the con text of the specific parameter configurations and HR TF sets employ ed here, as direct quantitativ e compar- ison with prior studies [ 18 , 28 , 29 , 31 ] is precluded by dif- ferences in model parameters, template/target HR TF se- lections, and lateral angle sampling (Baumgartner2014). Both mo dels are developed primarily for acoustically measured HR TF s and therefore may not fully capture the p erceptual implications of the sp ecific sp ectral character- istics introduced by syn thetic HR TF s. In the context of R Q2, this cav eat applies to cross- study comparison of predicted v alues. Within the present approac h, the con v ergen t ranking of conditions (PR syn- thetic worst, then KEMAR, 3D synthetic and Random) across b oth mo dels directly supp orts the conclusion that the observed numerical degradations in PR synthetic HR TF s do translate in to predicted lo calisation impair- men t particularly for elev ation-dependent and fron t–back disam biguation tasks. Whether these auditory mo del predictions translate to actual b eha vioural lo calisation deficits with human listeners required direct exp erimen tal v alidation. 4.3. RQ3: Behavioural Lo calisation Performance A ddressing the third research question, the virtual- realit y lo calisation exp erimen t with 27 participants con- firms that PR synthetic HR TF s do not yet matc h the p erceptual p erformance afforded by measured HR TF s. P earson correlation analysis (Fig. 11 ) demonstrates pre- serv ed azimuthal lo calisation across conditions, but diver- gen t elev ation p erformance. The behavioural data align with the n umerical and mo del-based findings. When ren- dered with their PR synthetic HR TF s, participan ts yield substan tially larger great-circle and elev ation errors and higher front-bac k and quadrant error rates than with measured or randomly assigned non-individual HR TF s, whilst azimuthal p erformance remains comparable across conditions. Thus the numerical degradations iden tified in R Q1 and the predicted impairments from R Q2 are con- firmed in lo calisation b eha viour. The sound localisation test results, v alues and patterns are in line with previous studies comparing individual and non-individual HR TF s [ 8 , 32 , 36 , 39 , 40 ]. Critically , azimuthal metrics sho w no differences amongst conditions, confirming that ITD preserv ation main tains lateral lo calisation whilst sp ectral degradation selectiv ely impairs elev ation p erception, in line with prior w ork [ 1 , 2 , 28 ], similarly identified in the n umerical and mo del-based assessments. The correlation analysis (Fig. 14 ) revealed no signif- ican t relationship b etw een sp ectral similarit y and p er- formance differences, suggesting that individual v ariabil- it y in HR TF compatibility reflects factors beyond sim- ple sp ectral distance. It follows that LSD, whilst useful 14 Figure 14. Correlation b et w een log-sp ectral distortion (1–16 kHz) and b eha vioural p erformance differences (Random min us Measured) for 27 participants. for c haracterising group-lev el sp ectral differences b et w een HR TF sets, should not b e o v er-in terpreted as a predic- tor of localisation performance for PR syn thetic or other non-individual HR TF s. Monaural cues are difficult to re- duce to a single global metric, they are direction- and frequency-dep enden t [ 2 , 28 ], and listeners weigh t sp ecific sp ectral regions [ 30 ]. A spatially and spectrally a v eraged LSD o v er all directions, ears and frequencies therefore do es not correlate with lo calisation performance. F uture w ork could test whether position- and frequency-sp ecific sp ectral deviations correlate with specific localisation er- rors, which would b etter align metric and p erception. 4.4. Outlo ok The findings ab o v e establish a practical baseline and a comprehensive ev aluation framework that combines nu- merical metrics, auditory mo dels, and b eha vioural data. Concrete directions for impro v ement are now well de- fined. On the geometric side, improv emen ts in image cap- ture proto cols, reconstruction algorithms, and curv ature- adaptiv e re-meshing could enhance ear detail whilst main- taining reasonable mesh size. The inclusion of torso geom- etry in future simulations may further reduce elev ation- related deviations. On the acoustic side, hybrid approaches that combine PR synthetic HR TF s with machine-learning mo dels to re- store high-frequency sp ectral detail from ear images may help bridge the gap to measured HR TF s. Relev an t meth- o ds include image-based high-frequency monaural cues prediction [ 14 , 15 ], DNN-based individualisation from pinna-related transfer functions [ 41 ], and neural net w ork prediction of HR TF s from 3D head meshes [ 42 ]. T ogether, these directions offer a clear path to w ard narro wing the remaining gap in sp ectral and p erceptual fidelit y for ac- cessible ind iv idual HR TF syn thesis. 5. Conclusion This study ev aluated whether photogrammetry recon- struction can pro vide a practically useful basis for indi- vidual HR TF synthesis by addressing three research ques- tions concerning numerical fidelity , predicted p erceptual impact and b eha vioural lo calisation p erformance. Using photogrammetry data from the SONICOM dataset, indi- vidual synthetic HR TF s were generated for 150 sub jects and ev aluated against measured HR TF s, 3D syn thetic HR TF s, KEMAR, and randomly selected HR TF s through n umerical metrics, auditory models, and a virtual-reality sound lo calisation experiment. Regarding numerical fidelity (R Q1), PR synthetic HR TF s preserve ov erall interaural timing cues but exhibit increased in teraural level differences and spectral distor- tion relative to high resolution 3D scan synthetic HR TF s. Regarding predicted p erceptual impact (RQ2), auditory- mo del predictions indicate that these differences trans- late in to substan tially higher elev ation errors, front-bac k confusions and quadran t error rates compared to non- individual and individual measured HR TF s. Regarding b eha vioural p erformance (RQ3), the lo calisation exp er- imen t confirms that PR syn thetic HR TF s yield worse elev ation accuracy and confusions rates than measured HR TF s and randomly selected HR TF s. Nev ertheless, this work establishes a practical, end-to- end baseline pip eline for accessible individual HR TF syn- thesis and a comprehensiv e ev aluation framework that com bines numerical metrics, auditory mo dels, and b e- ha vioural data. F uture research should focus on improv- ing mesh qualit y and ear detail through enhanced recon- struction and re-meshing, and on developing mac hine- learning-based refinement metho ds that use PR synthetic HR TF s as inputs and measured HR TF s as targets, with the aim of narrowing the remaining gap in sp ectral and p erceptual fidelit y . 6. CherISH This researc h is carried out within the CherISH Europ ean Do ctorate Net w ork pro ject, which aims to im- pro v e sound lo calisation skills for bilateral co c hlear im- plan ts (CI) users through VR-based training. Spatial hearing rehabilitation using virtual reality headsets and 15 headphones offers substantial practical adv an tages o v er traditional loudsp eaker arra ys, including accessibility , p ortabilit y , and reduced infrastructure requirements [ 43 ]. Ho w ever, the impact of individual spatial cues on train- ing efficacy and rehabilitation outcomes for CI users re- mains unclear. The present w ork addresses this challenge b y establishing an accessible framew ork for individual HR TF synthesis using minimal off-the-shelf hardware and a v ailable soft w are to ols. This pipeline pro vides a founda- tion for future inv estigations into spatial cue augmen ta- tion and p ersonalised rehabilitation proto cols for hearing- impaired p opulations. F unding Horizon-MSCA-2022-DN-01: CherISH is a Europ ean Do ctorate Netw ork pro ject funded by the Europ ean Union’s Horizon 2020 framework programme for researc h and inno v ation under the Marie Sklo do wsk a-Curie Grant Agreemen t No: 101120054. Conflicts of in terest The authors declare no conflicts of interest. Ethical appro v al This study was approv ed by the Research Gov ernance and Integrit y T eam at Imp erial College London. SETREC No. 7046527. Informed consent w as obtained from all par- ticipan ts. Data a v ailabilit y statemen t The data and co de used in this study will b e made a v ailable up on reasonable request. References 1. Middlebro oks J.C., Green D.M. (1991) Sound localiza- tion by human listeners, Annual Review of Psychology , 42, 135–159. 2. Langendijk E.H.A., Bronkhorst A.W. (2002) Contribution of sp ectral cues to human sound lo calization, The Journal of the A coustical So ciet y of America, 112, 1583–1596. 3. Engel I., Daugin tis R., Vicen te T., Hogg A., P au w els J., T ournier A., Picinali L. (2023) The SONICOM HR TF Dataset, Journal of the Audio Engineering Society , 71, 241–253. 4. Gardner W.G., Martin K.D. (1995) HR TF measurements of a KEMAR, The Journal of the Acoustical So ciet y of America, 97, 6, 3907–3908. 5. Brinkmann F., Dinak aran M., Pelzer R., Grosc he P ., V oss D., W einzierl S. (2019) A cross-ev aluated database of measured and simulated HR TF s including 3D head meshes, anthropometric features, and headphone impulse resp onses, Journal of the Audio Engineering Society , 67, 705–718. 6. González-T oledo D., Cuev as-Rodríguez M., Vicente T., Picinali L., Molina-T anco L., Reyes-Lecuona A. (2024) Spatial release from masking in the median plane with non-nativ e sp eak ers using individual and mannequin head related transfer functions, The Journal of the Acoustical So ciet y of America, 155, 1, 284–293. 7. Picinali L., Katz B.F.G. (2023) System-to-user and user- to-system adaptations in binaural audio, in Sonic interac- tions in virtual environmen ts, Geronazzo M., Serafin S., Editors, Cham, Springer International Publishing, 115– 143. 8. Mey er J., Picinali L. (2025) On the generalization of accommo dation to head-related transfer functions, The Journal of the Acoustical So ciet y of America, 157, 1, 420– 432. 9. P auw els J., Picinali L. (2023) On the relev ance of the dif- ferences b et ween HR TF measuremen t setups for machine learning, ICASSP 2023 – IEEE In ternational Conference on A coustics, Sp eec h and Signal Pro cessing, 1–5. 10. Ziegelw anger H., Kreuzer W., Ma jdak P . (2015) MESH2HR TF: An op en-source soft ware pack age for the n umerical calculation of head-related transfer functions. 11. P ollack K., Kreuzer W., Ma jdak P . (2022) Modern ac- quisition of p ersonalised head-related transfer functions – an ov erview, in Adv ances in fundamental and applied re- searc h on spatial audio, Katz B.F.G., Ma jdak P ., Editors, Rijek a, Intec hOpen. 12. Ziegelw anger H., Reichinger A., Ma jdak P . (2013) Calculation of listener-sp ecific head-related transfer func- tions: Effect of mesh quality , Pro ceedings of Meetings on A coustics, 19, 1, 050017. 13. Spagnol S. (2020) HR TF selection by anthropometric re- gression for improving horizontal localization accuracy , IEEE Signal Pro cessing Letters, 27, 590–594. 14. Zhao M., Sheng Z., F ang Y. (2022) Magnitude mo delling of p ersonalised HR TF based on ear images and anthropo- metric measuremen ts, Applied Sciences, 12, 16, 8155. 15. Lee G.W., Kim H.K. (2018) Personalized HR TF mo delling based on deep neural netw ork using anthropometric mea- suremen ts and images of the ear, Applied Sciences, 8, 11, 2180. 16. F an tini D., A v anzini F., Ntalampiras S., Presti G. (2021) HR TF individualization based on anthropomet- ric measuremen ts extracted from 3D head meshes, 2021 Immersiv e and 3D Audio: F rom Architecture to Automotiv e (I3DA), 1–10. 17. Mano j D., Grosche P ., Brinkmann F., W einzierl S. (2016) Extraction of anthropometric measures from 3D-meshes for the individualization of head-related transfer func- tions, Journal of the Audio Engineering Society , 9579. 18. Hogg A.O.T., Jenkins M., Liu H., Squires I., Co oper S.J., Picinali L. (2024) HR TF upsampling with a generative adv ersarial net w ork using a gnomonic equiangular pro- jection, IEEE/ACM T ransactions on Audio, Speech, and Language Pro cessing, 32, 2085–2099. 19. Hu X., Li J., Picinali L., Hogg A. (2024) HR TF spatial upsampling in the spherical harmonics domain employ- ing a generative adversarial net w ork, Pro ceedings of the 27th In ternational Conference on Digital Audio Effects (D AFx24). 20. Hu X., Li J., Picinali L., Hogg A.O.T. (2025) A mac hine learning approac h for denoising and upsampling HR TF s. 21. Dellepiane M., Pietroni N., T singos N., Asselot M., Scopigno R. (2008) Reconstructing head models from photographs for individualized 3D-audio pro cess- 16 ing, Proceedings of the 29th Annual Conference of the European Asso ciation for Computer Graphics (Eurographics 2008), Computer Graphics F orum, 27, 1719–1727. 22. Meshram A., Mehra R., Y ang H., Dunn E., F rahm J.- M., Mano c ha D. (2014) P-HR TF: Efficient p ersonalised HR TF computation for high-fidelity spatial sound, 2014 IEEE International Symp osium on Mixed and Augmented Realit y (ISMAR), 53–61. 23. P ollack K., Ma jdak P ., F urtado H. (2023) Application of non-rigid registration to photogrammetrically recon- structed pi nna p oin t clouds for the calculation of p erson- alised head-related transfer functions, Pro ceedings of the F ortsc hritte der Akustik (DA GA). 24. P ollack K., Ma jdak P ., F urtado H. (2024) Combination of photogrammetry and non-rigid pinna registration for the calculation of p ersonalised head-related transfer func- tions, Pro ceedings of F orum Acusticum 2023, T urin, Italy , 4147–4150. 25. P o ole K.C., Meyer J., Martin V., Daugintis R., Marggraf- T urley N., W ebb J., Pirard L., La Magna N., Picinali L. (2025) The extended SONICOM HR TF dataset, F orum A custicum, Malaga, Spain. 26. P alm T., Koch S., Brinkmann F., Alexa M. (2021) Curv ature-adaptiv e mesh grading for n umerical approx- imation of head-related transfer functions, Pro ceedings of the 47th German Annual Conference on Acoustics (D AGA 2021), 1111–1114. 27. Ma jdak P ., Iwa ya Y., Carp en tier T., Nicol R., Parmen tier M., Roginsk a A., Suzuki Y., W atanab e K., Wierstorf H., Ziegelw anger H., Noisternig M. (2013) Spatially oriented format for acoustics: A data exchange format representing head-related transfer functions, 134th Audio Engineering So ciet y Conv en tion. 28. Baumgartner R., Ma jdak P ., Labac k B. (2014) Modeling sound-source lo calization in sagittal planes for human lis- teners, Journal of the Acoustical So ciet y of America, 136, 2, 791–802. 29. Barumerli R., Ma jdak P ., Geronazzo M., Meijer D., A v anzini F., Baumgartner R. (2023) A Bay esian mo del for h uman directional lo calisation of broadband static sound sources, A cta Acustica, 7, 12. 30. Llad’o P ., Ma jdak P ., Barumerli R., Baumgartner R. (2025) Sp ectral w eighting of monaural cues for auditory lo calization in sagittal planes, T rends in Hearing, 29, 23312165251317027. 31. Daugin tis R., Barumerli R., Picinali L., Geronazzo M. (2023) Classifying non-individual head-related transfer functions with a computational auditory mo del: calibra- tion and metrics, ICASSP 2023 - 2023 IEEE International Conference on A coustics, Sp eec h and Signal Processing (ICASSP), 1–5. 32. Daugin tis R., Barumerli R., Geronazzo M., Picinali L. (2023) Initial ev aluation of an auditory-mo del-aided se- lection procedure for non-individual HR TF s, Pro ceedings of the 10th Conv en tion of the European A coustics Asso ciation (F orum Acusticum 2023), 2701–2708. 33. Daugin tis R., Alary B., Geronazzo M., Picinali L. (2024) Effects of binaural rendering p ersonalisation and reverber- ation on sp eec h-on-speech masking, Journal of the Audio Engineering So ciet y , 22. 34. Cuev as-Rodríguez M., Picinali L., González-T oledo D., Garre C., De la Rubia-Cuestas E., Molina-T anco L., Rey es-Lecuona A. (2019) 3D T une-In T o olkit: An Open- Source Library for Real-Time Binaural Spatialisation, PLUS ONE. 35. P oirier-Quinot D., Katz B.F.G. (2022) Spatial audio qual- it y assessment: Confusion and front-bac k error rates, in A dv ances in fundamental and applied research on spa- tial audio, Katz B.F.G., Ma jdak P ., Editors, Rijek a, In techOpen. 36. Middlebro oks J.C. (1999) Virtual lo calization impro ved b y scaling nonindividualized external-ear transfer func- tions in frequency , Journal of the Acoustical So ciet y of America, 106, 3, 1493–1510. 37. Algazi V.R., Duda R.O., Thompson D.M., A vendano C. (2002) Appro ximating the head-related transfer function using simple geometric mo dels of the head and torso, The Journal of the Acoustical So ciet y of America, 112, 5, 2053– 2064. 38. Kreuzer W., Ma jdak P ., Chen Z. (2009) F ast multipole b oundary elemen t metho d to calculate head-related trans- fer functions for a wide frequency range, The Journal of the A coustical So ciet y of America, 126, 3, 1280–1290. 39. Ma jdak P ., Baumgartner R., Laback B. (2014) Acoustic and non-acoustic factors in mo deling listener-sp ecific p er- formance of sagittal-plane sound lo calization, F rontiers in Psyc hology , 5, 319. 40. Ma jdak P ., Goup ell M.J., Labac k B. (2011) T wo- dimensional lo calization of virtual sound sources in co c hlear-implan t and normal-hearing listeners, Ear and Hearing, 32, 2, 198–208. 41. K o B.-Y., Lee G.-T., Nam H., Park Y.-H. (2023) PR TFNet: HR TF individualization for accurate sp ectral cues using a compact PR TF, IEEE A ccess, 11, 96119– 96130. 42. Zhao J., Y ao D., Gu J., Li J. (2024) Efficient prediction of individual head-related transfer functions based on 3D meshes, Applied A coustics, 219, 109938. 43. P armar B.J., Salorio-Corb etto M., Picinali L., Mahon M., Nigh tingale R., Somerset S., Cullington H., Driv er S., Ro cca C., Jiang D., Vick ers D. (2024) Virtual re- alit y games for spatial hearing training in children and y oung people with bilateral cochlear implants: the “Both Ears (BEARS)” approach, F rontiers in Neuroscience, 18, 1491954. 17
Original Paper
Loading high-quality paper...
Comments & Academic Discussion
Loading comments...
Leave a Comment