Linking Dispersive-Medium Uncertainty to Clutter Analysis in Single-Snapshot FDA-MIMO-GPR
This paper addresses the modeling gap between complex dispersive-medium characterization and clutter statistical analysis in single-snapshot frequency diverse array multiple-input multiple-output ground-penetrating radar (FDA-MIMO-GPR). Existing FDA-…
Authors: Yisu Yan, Jifeng Guo
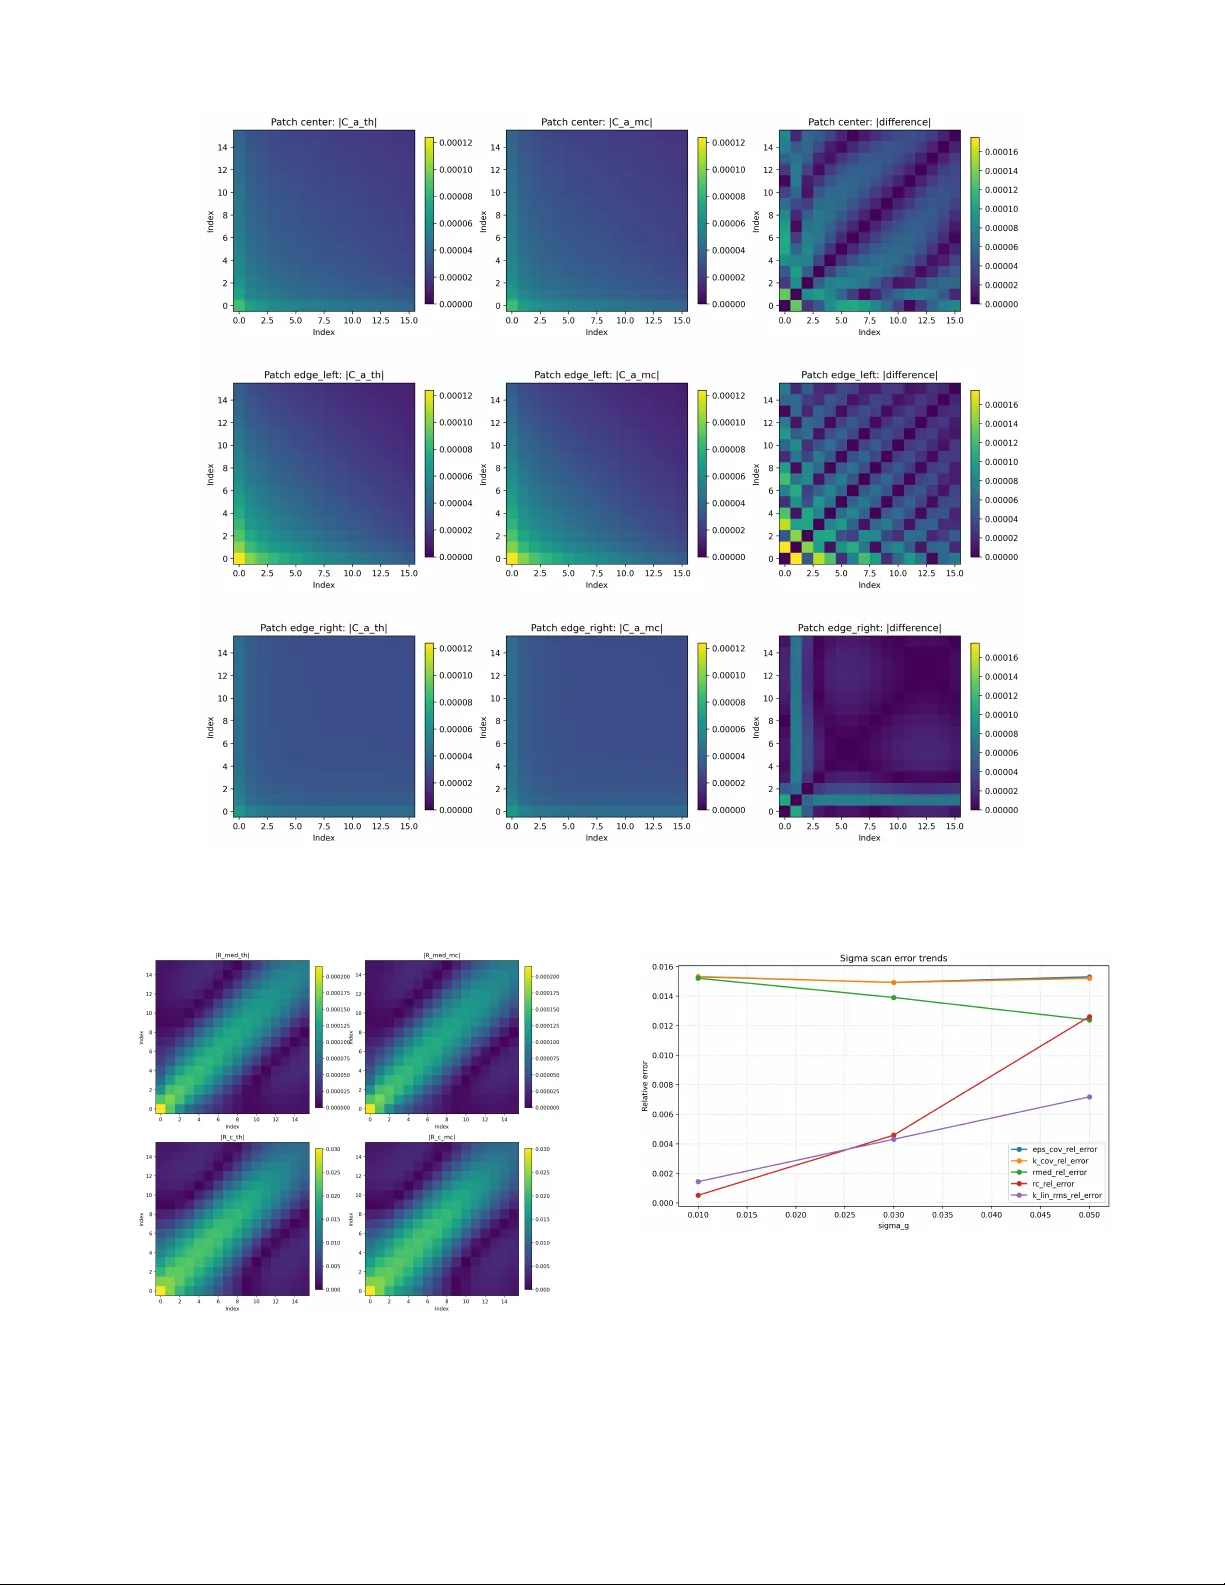
1 Linking Dispersi v e-Medium Uncertainty to Clutter Analysis in Single-Snapshot FD A-MIMO-GPR Y isu Y an , Gr aduate Student Member , IEEE, Jifeng Guo Abstract —This paper addresses the modeling gap between complex dispersive-medium characterization and clutter statisti- cal analysis in single-snapshot fr equency diverse array multiple- input multiple-output ground-penetrating radar (FD A-MIMO- GPR). Existing FD A-MIMO clutter studies ha ve rar ely incor - porated subsurface dispersion, dissipation, and random inho- mogeneity in an explicit statistical framework. T o bridge this gap, a continuous relaxation spectrum is adopted to describe complex media, and a statistical propagation chain is established from random relaxation-spectrum perturbations to complex permittivity , complex wa venumber , steering-vector perturbation, medium-induced additional clutter covariance, and total clutter covariance. On this basis, the effects of medium randomness on covariance spectral spr eading, effective rank, effective clutter - subspace dimension, and target-clutter separability are further characterized. Numerical r esults show close agreement between the deriv ed theory and Monte Carlo sample statistics across multiple stages of the propagation chain. The r esults further indicate that medium uncertainty not only changes clutter - covariance entries, but also reshapes its eigenspectrum and effective subspace, thereby influencing the geometric separation between target and clutter . The study provides an explicit and interpr etable theoretical interface f or embedding complex- medium uncertainty into FD A-MIMO-GPR clutter statistical analysis. Index T erms —Clutter co variance, Dispersive media, Fr equency diverse array multiple-input multiple-output radar , Ground- penetrating radar , Subspace separability . I . I N T RO D U C T I O N T HE emergence of demands such as real-time monitor- ing of tunnel lining quality [1], tracking of subsurface hydrological fluid migration [2], and underground fingerprint matching for extraterrestrial bodies [3] indicates that subsur- face sensing is ev olving toward real-time monitoring of dy- namic processes. As a representative non-destructiv e sensing modality , ground-penetrating radar (GPR) has dev eloped into multiple configurations, including time-lapse GPR (TL-GPR) and Doppler GPR [4]–[6]. Combined with signal processing methods such as SVD and MUSIC [7]–[10], these systems support the detection and tracking of dynamic subsurface targets. Y isu Y an is with School of Astronautics, Harbin Institute of T echnology , Heilongjiang, China (e-mail: 23B918085@stu.hit.edu.cn). Jifeng Guo is with School of Astronautics, Harbin Institute of T echnology , Heilongjiang, China (e-mail: guojifeng@hit.edu.cn). This article is accompanied by supplementary material. The PDF document includes discussion on the modal interpretation of the medium-induced cov ariance, its effecti ve-rank structure, and the geometric implications for subspace-based clutter suppression. This work has been submitted to the IEEE for possible publication. Copyright may be transferred without notice, after which this version may no longer be accessible. Compared with the single-channel scanning mode com- monly used in conv entional SFCW or FMCW systems, fre- quency div erse array (FD A) and multiple-input multiple-output (MIMO) techniques are better suited for the synchronous acquisition of range–angle information under single-snapshot or few-snapshot conditions in dynamic monitoring scenarios. The FD A-MIMO architecture introduces an additional range degree of freedom within a single snapshot and, in principle, enables point focusing at specific subsurface locations [11], thereby improving signal-to-noise ratio and interference sup- pression capability . MIMO configurations based on V iv aldi an- tenna arrays hav e also been applied to subsurface scanning of extraterrestrial bodies [12], further demonstrating the potential of integrating FD A-MIMO with GPR. Compared with conv entional FDA-MIMO airborne radar , the propagation en vironment encountered by FDA-MIMO- GPR is considerably more complex. Near-field propaga- tion, dispersion, high attenuation, and uncertainty in medium parameters jointly increase the complexity of the space- frequency observ ation structure under single- or few-snapshot conditions. Therefore, characterizing the clutter statistics in this regime and understanding their implications for tar get– clutter separation are central to FDA-MIMO-GPR analysis. Statistical analyses of FD A-MIMO radar clutter hav e formed a relativ ely mature research frame work. On the one hand, existing studies inherit classical array-radar approaches to clutter subspaces, covariance structures, and rank analysis [13], [14]. On the other hand, by incorporating the range– angle coupling characteristics of frequency-di verse wav eforms, they further in vestigate clutter rank under frequency diversity , the rank of range-ambiguous clutter in FD A-MIMO airborne scenarios, and related problems of joint space-time-range sup- pression and parameter design [15]–[19]. Additional studies hav e extended to clutter cov ariance estimation as well as parameter estimation and detection in complex clutter en vi- ronments [20]–[25]. Overall, howe ver , existing FD A-MIMO clutter studies mainly focus on statistical effects arising from array configuration, platform motion, range ambiguity , and space-time coupling [15]–[19]. Studies on FD A-MIMO for subsurface target detection have primarily addressed feasi- bility demonstration and target detection, but hav e seldom in vestigated the space-frequency statistical properties of clut- ter caused by complex dispersiv e media [26]. Accordingly , medium modeling in the current literature is generally ov er- simplified, with insufficient consideration of dispersion, dissi- pation, and random inhomogeneity . In contrast, the GPR and applied geophysics communi- ties ha ve long in vestigated the electromagnetic properties of 2 complex subsurface media and the mechanisms of dispersiv e wa ve propagation. Early studies showed that attenuation and frequency-dependent dispersion in subsurface propagation can be described in a unified framework using complex permit- tivity [27]. Subsequently , Debye, Cole–Cole, and generalized relaxation models hav e been widely adopted to characterize polarization mechanisms and time–frequency responses [28]. Further advances, including direct estimation of relaxation- time distributions and statistical learning-based representa- tions, have enriched the description of complex dispersive media [29], [30] . Meanwhile, time-domain electromagnetic modeling for arbitrary comple x permittivity and random-media simulation has continued to develop, enabling more realistic characterization of the effects of complex subsurface materials and background fluctuations on propagation and scattering [31]–[33]. Howe ver , much of the existing GPR literature remains focused on application-oriented tasks, such as clutter suppres- sion, noise reduction, tar get detection, image enhancement, and data reconstruction [34]–[44]. This suggests that clutter and noise in GPR scenarios are of clear engineering signifi- cance. Nev ertheless, these studies have rarely been integrated with adv anced array architectures such as FDA-MIMO and MIMO. As a result, it remains unclear how the effects of dispersiv e random media should be incorporated into the clutter statistical analysis framew ork of FD A-MIMO [27], [28], [31], [32]. The related works collectively rev eal a missing link. FD A- MIMO clutter studies hav e established mature cov ariance- , spectral-, rank-, and subspace-based analysis tools, while complex-medium studies have characterized dispersi ve dielec- tric behavior and material v ariability in detail. Y et an explicit statistical connection between medium uncertainty and single- snapshot FD A-MIMO-GPR clutter statistics remains largely absent. This paper de velops such a connection. From a random perturbation field on the logarithmic relaxation spectrum, medium uncertainty is propagated to the complex permittivity , complex wa venumber , steering-vector perturbation, and the resulting medium-induced and total clutter covariances. These changes are then linked to spectral broadening, effecti ve rank, effecti ve clutter-subspace dimension, and target–clutter sepa- rability metrics. The contrib ution therefore lies in providing an explicit and computable bridge between complex-medium modeling and FDA-MIMO clutter analysis. The work is primarily theoretical and numerical. Its nu- merical part validates the propagation chain and identifies the range in which the first-order statistical characterization re- mains accurate, rather than e valuating full end-to-end detection performance. Section II first presents the signal model and medium characterization. Section III then analyzes the propagation of medium randomness to the propagation constant and the statistical perturbation of the steering vector , constructs the medium-induced clutter cov ariance, and discusses its spec- tral structure, ef fectiv e rank, and separability . The preceding theoretical results are numerically validated in Section IV, where their effecti veness and applicability boundaries are also discussed. I I . F DA - M I M O G P R S I G N A L M O D E L A. Gener al Model Consider a one-dimensional collocated FDA-MIMO GPR array comprising M transmit–receive channels, where the equiv alent spatial position of the m th channel is denoted by d m . The carrier frequency of the m th channel is denoted by f m , which is generally expressed as f m = f 0 + n m ∆ f (1) where f 0 is the reference center frequency , ∆ f is the fundamental frequenc y increment, and n m is the frequency- coding coefficient. In Log-FD A, n m is specified by a prede- fined nonlinear coding rule; since the subsequent theory does not depend on its particular form, a general representation is retained here. Assume that a single scattering element is located at the parametric coordinate ( θ , r ) in the scene, where θ denotes the azimuth angle and r denotes the radial distance relativ e to the reference phase center . Assume that the local re gion containing the scattering element is isotropic, with µ ≈ µ 0 , and that no additional sources are present. Then, the corresponding complex wavenumber satisfies k 2 c ( ω ; µ ) = ω 2 µ 0 ϵ 0 ϵ c r ( ω ; µ ) (2) thus yielding k c ( ω ; µ ) = ω p µ 0 ϵ c ( ω ) (3) For the m th channel, the baseband response of the scattering element can be written as y m ( θ , r ) = β ( θ, r ) G m ( θ , r ) exp − j k c ( ω m ; µ ) L m ( θ , r ) + w m (4) where β ( θ , r ) is the equiv alent complex scattering coeffi- cient, ω m = 2 πf m , L m ( θ , r ) is the equiv alent propagation path length associated with that channel, and G m ( θ , r ) ab- sorbs geometric spreading, antenna-pattern effects, and several slowly varying deterministic prefactors. A simplifying assumption is adopted: the medium parameter µ enters the steering vector solely through the complex wa venumber k c ( ω ; µ ) , while the scattering coefficient β ( θ , r ) is treated as approximately independent of the specific medium realization. This assumption isolates the dominant ef fect of propagation-induced randomization on the second-order clutter structure in the single-snapshot regime. Accordingly , the space-frequency steering vector corre- sponding to this scattering element is given by a m ( θ , r ; µ ) = G m ( θ , r ) exp − j k c ( ω m ; µ ) L m ( θ , r ) (5) a ( θ , r ; µ ) = a 1 ( θ , r ; µ ) a 2 ( θ , r ; µ ) · · · a M ( θ , r ; µ ) ⊤ (6) Thus, the contribution of a single scattering element to one snapshot is 3 y ( θ, r ) = β ( θ, r ) a ( θ, r ; µ ) + ω (7) When a large number of distributed scattering elements are present in the scene, the received single-snapshot signal can be represented as the superposition of local contributions over the scene. T aking the residual terms such as system noise into account via n , the continuous form can be written as x = Z Z β ( θ , r ) a ( θ, r ; µ ) dθ dr + n (8) Equation (8) pro vides a unified single-snapshot signal model for FD A-MIMO GPR. The subsequent analysis of clutter statistical structure is built upon the scene-aggregated behavior of the steering-vector family { a ( θ , r ; µ ) } . B. Char acterization of Complex Media As discussed in Section I, GPR operates in subsurface media exhibiting conducti ve loss, dispersion, and spatial inhomo- geneity . W ithin the single-snapshot space–frequency frame- work considered here, the resulting frequency-dependent prop- agation ef fects directly enter the observ ation model through the complex permittivity . Medium dispersion is commonly described by relaxation- based complex-permitti vity models, including single- and multi-pole Debye models, Cole–Cole models, and continu- ous relaxation-spectrum models. In this paper , a continuous relaxation-spectrum representation is adopted. Let τ denote the relaxation time constant, and introduce the logarithmic variable u = log τ . Then, the complex permittivity is written as ϵ c ( ω ) = ϵ ∞ + Z ∞ −∞ ˜ g ( u ) 1 + j ω e u du (9) where ϵ ∞ is the high-frequency limiting dielectric response, and ˜ g ( u ) is the continuous relaxation-spectrum density defined on the logarithmic relaxation-time axis. Follo wing II-A, the medium affects the observation model through ϵ c ( ω ) → k c ( ω ) → a ( θ , r ) Here the complex permittivity determines the complex wa venumber , which modulates propagation phase and attenu- ation and thereby governs the space–frequency structure of the single-snapshot observ ation vector . The continuous relaxation- spectrum formulation provides the basis for stochastic model- ing of medium uncertainty . I I I . P RO PAG A T I O N O F M E D I U M U N C E RTA I N T Y T O C L U T T E R S TA T I S T I C S This section considers the propagation of medium uncer- tainty from the relaxation-spectrum perturbation to the clutter cov ariance and the deriv ed quantities characterizing spectral spreading, ef fectiv e clutter-subspace dimension, and tar get– clutter separability: δ ˜ g ( u ) → δ ϵ c ( ω ) → δ k c ( ω ) → δ a ( θ , r ) → R a ( θ , r ) → R med → R c → r eff , p ρ , η , γ A. Assumptions and Random F ield Model T o ensure the v alidity of the subsequent co variance propaga- tion and spectral analysis, the statistical modeling assumptions adopted in this paper are first summarized. A1 The logarithmic relaxation-spectrum perturbation δ ˜ g ( u ) is assumed to be a zero-mean second-order random process, i.e., ˜ g ( u ) = ¯ ˜ g ( u ) + δ ˜ g ( u ) , u = log τ (10) and satisfies E [ δ ˜ g ( u )] = 0 , ˜ K ( u, u ′ ) = E [ δ ˜ g ( u ) δ ˜ g ( u ′ ) ∗ ] (11) where ˜ K ( u, u ′ ) is a Hermitian positiv e semidefinite ker - nel. A2 Standard regularity conditions are assumed for the inte- gral operators appearing below , including the required in- tegrability , square integrability , and the interchangeability of expectation and inte gration. Accordingly , the Debye- type integral mappings, the resulting local cov ariance operators, and their KL expansions are well defined. A3 The scene scattering coefficient β ( θ , r ) and the medium- induced steering perturbation δ a ( θ, r ) are assumed to be second-order independent. A4 Distinct scattering elements are assumed to be second- order uncorrelated, and their local po wer is characterized by σ 2 β ( θ , r ) = E [ | β ( θ, r ) | 2 ] (12) As a baseline model, δ ˜ g ( u ) is further assumed to follow a stationary process with a Mat ´ ern kernel: ˜ K ( u, u ′ ) = σ 2 g κ ν,ℓ ( u − u ′ ) (13) where σ 2 g determines the perturbation strength, while ν and ℓ control the smoothness and correlation scale, respectiv ely . B. F r om Relaxation Spectrum to Steering P erturbation Under Assumption A1 and Assumption A2, substituting (10) into (9) yields ϵ c ( ω ) = ϵ ∞ + Z ∞ −∞ ¯ ˜ g ( u ) 1 + j ω e u du | {z } ¯ ϵ c ( ω ) + Z ∞ −∞ δ ˜ g ( u ) 1 + j ω e u du | {z } δ ϵ c ( ω ) (14) from which it follows that δ ϵ c ( ω ) = Z ∞ −∞ δ ˜ g ( u ) 1 + j ω e u du (15) Accordingly , the second-order statistics of ϵ c ( ω ) are deter- mined by the kernel ˜ K : Co v ϵ c ( ω ) , ϵ c ( ω ′ ) = Z Z ˜ K ( u, u ′ ) 1 + j ω e u 1 − j ω ′ e u ′ du du ′ (16) Next, decompose the complex permittivity as ϵ c ( ω ) = ¯ ϵ c ( ω ) + δ ϵ c ( ω ) (17) 4 where ¯ ϵ c ( ω ) is the nominal comple x permitti vity , and δϵ c ( ω ) is a small perturbation satisfying | δ ϵ c ( ω ) | ≪ | ¯ ϵ c ( ω ) | . T aking the first-order expansion of (3) about ¯ ϵ c ( ω ) gives k c ( ω ; µ ) = k c ¯ ϵ c ( ω ) + ∂ k c ( ω ; µ ) ∂ ϵ c ( ω ) ¯ ϵ c ( ω ) δ ϵ c ( ω ) + o δ ϵ c ( ω ) (18) Let ¯ k c ( ω ) = ω p µ 0 ¯ ϵ c ( ω ) . Then, δ k c ( ω ; µ ) = k c ( ω ; µ ) − ¯ k c ( ω ) ≈ ω µ 0 2 p µ 0 ¯ ϵ c ( ω ) δ ϵ c ( ω ) (19) This expression can be further rewritten in terms of the rel- ativ e permittivity . Let ¯ ϵ c ( ω ) = ϵ 0 ¯ ϵ c r ( ω ) and ¯ n c ( ω ) = p ¯ ϵ c r ( ω ) , then δ k c ( ω ; µ ) ≈ ω 2 c 0 ¯ n c ( ω ) δ ϵ c r ( ω ) (20) Combining this result with (15) gives δ k c ( ω ; µ ) = ω 2 c 0 ¯ n c ( ω ) Z ∞ −∞ δ ˜ g ( u ) 1 + j ω e u du (21) For the m th channel, define the nominal steering component as a 0 ,m ( θ , r ) = G m ( θ , r ) exp − j ¯ k c ( ω m ) L m ( θ , r ) (22) Then, according to (5), one may write a m ( θ , r ; µ ) = a 0 ,m ( θ , r ) exp − j δ k c ( ω m ; µ ) L m ( θ , r ) (23) Under the small-perturbation condition, a first-order expan- sion yields δ a m ( θ , r ) ≜ a m ( θ , r ; µ ) − a 0 ,m ( θ , r ) ≈ − j L m ( θ , r ) a 0 ,m ( θ , r ) δ k c ( ω m ; µ ) (24) Substituting (21) into (24) further gives δ a m ( θ , r ) ≈ Z ∞ −∞ H m ( θ , r ; u ) δ ˜ g ( u ) du (25) where H m ( θ , r ; u ) = − j L m ( θ , r ) a 0 ,m ( θ , r ) ω m 2 c 0 ¯ n c ( ω m ) 1 1 + j ω m e u (26) Further define H ( θ , r ; u ) = H 1 ( θ , r ; u ) , . . . , H M ( θ , r ; u ) ⊤ (27) Then, the steering-vector perturbation can be expressed as δ a ( θ, r ) = Z ∞ −∞ H ( θ , r ; u ) δ ˜ g ( u ) du (28) At this point, the medium randomness has been explic- itly propagated from the relaxation-spectrum domain to the steering-vector domain. C. Local Steering Covariance and Scene-Level Covariance Decomposition Under Assumption A1 and Assumption A2, (28) defines a well-posed second-order random vector and satisfies E [ δ a ( θ, r )] = 0 (29) Define the local steering cov ariance as R a ( θ , r ) ≜ E δ a ( θ, r ) δ a ( θ , r ) H (30) Then, from (28), (27), Assumption A1, and Assumption A2, it follows that R a ( θ , r ) = Z ∞ −∞ Z ∞ −∞ H ( θ , r ; u ) ˜ K ( u, u ′ ) H ( θ , r ; u ′ ) H du du ′ (31) Since ˜ K is a Hermitian positi ve semidefinite kernel, R a ( θ , r ) is therefore a Hermitian positiv e semidefinite matrix. Furthermore, the local steering vector can be decomposed as a ( θ , r ; µ ) = a 0 ( θ , r ) + δ a ( θ, r ) (32) where a 0 ( θ , r ) = a 0 , 1 ( θ , r ) · · · a 0 ,M ( θ , r ) ⊤ (33) Now consider the superposition of distributed scattering elements ov er the scene. From (8), the clutter snapshot can be written as x c = Z Z β ( θ , r ) a ( θ, r ; µ ) dθ dr (34) Substituting a ( θ , r ; µ ) = a 0 ( θ , r ) + δ a ( θ, r ) yields x c = Z Z β ( θ , r ) a 0 ( θ , r ) dθ dr + Z Z β ( θ , r ) δ a ( θ , r ) dθ dr (35) Define the clutter covariance matrix as R c ≜ E [ x c x H c ] (36) By Assumption A3, Assumption A4, and E [ δ a ( θ, r )] = 0 , the cross-cov ariance between the nominal term and the medium-perturbation term vanishes, leading to the decompo- sition R c = R 0 + R med (37) where R 0 = Z Z σ 2 β ( θ , r ) a 0 ( θ , r ) a 0 ( θ , r ) H dθ dr (38) denotes the clutter cov ariance under the nominal medium, while R med = Z Z σ 2 β ( θ , r ) R a ( θ , r ) dθ dr (39) 5 represents the additional cov ariance term induced by medium randomness. Since R a ( θ , r ) is Hermitian positiv e semidefinite, both R med and R c are likewise Hermitian pos- itiv e semidefinite. D. Modal Interpretation of the Medium-Induced Covariance Under Assumption A2, the kernel ˜ K ( u, u ′ ) admits the following Karhunen–Lo ` eve expansion: ˜ K ( u, u ′ ) = ∞ X q =1 λ q ϕ q ( u ) ϕ q ( u ′ ) ∗ (40) where λ q ≥ 0 are the eigen values of the kernel, and { ϕ q } are the corresponding orthonormal eigenfunctions. Substituting (40) into (31) gives R a ( θ , r ) = ∞ X q =1 λ q h q ( θ , r ) h q ( θ , r ) H (41) where h q ( θ , r ) ≜ Z ∞ −∞ H ( θ , r ; u ) ϕ q ( u ) du (42) denotes the image of the q th random relaxation-spectrum mode in the steering-vector domain. Substituting this result further into (39) yields R med = ∞ X q =1 λ q S q (43) where S q ≜ Z Z σ 2 β ( θ , r ) h q ( θ , r ) h q ( θ , r ) H dθ dr (44) Therefore, R med is a weighted superposition of a set of nonnegati ve modal components { S q } . The coefficients λ q characterize the energy distribution of medium randomness in the relaxation-spectrum domain, whereas S q describes the contribution pattern of the corresponding mode in the observation domain after propagation through the operator and scene-lev el integration. E. Spectr al Br oadening and Effective Rank T o characterize the degree of cov ariance spectral broaden- ing, the effecti ve rank is adopted and defined as r eff ( R ) ≜ tr R 2 ∥ R ∥ 2 F (45) whose range satisfies 1 ≤ r eff ( R ) ≤ rank( R ) . For the medium-induced cov ariance R med , (43) gives tr R med = ∞ X q =1 λ q tr S q (46) and ∥ R med ∥ 2 F = ∞ X q =1 ∞ X p =1 λ q λ p ⟨ S q , S p ⟩ F (47) where ⟨ A , B ⟩ F = tr( A H B ) . Hence, r eff ( R med ) = P q λ q tr S q 2 P q P p λ q λ p ⟨ S q , S p ⟩ F (48) This expression sho ws that the effecti ve rank of R med depends not only on the distrib ution of the kernel spectrum { λ q } , but also on the degree of geometric overlap among the modal components { S q } in the channel domain. For the total clutter cov ariance R c = R 0 + R med , (45) yields r eff ( R c ) = tr R 0 + tr R med 2 ∥ R 0 ∥ 2 F + ∥ R med ∥ 2 F + 2 ⟨ R 0 , R med ⟩ F (49) Further define µ ≜ ⟨ R 0 , R med ⟩ F ∥ R 0 ∥ F ∥ R med ∥ F (50) Since both R 0 and R med are Hermitian positive semidefi- nite matrices, ⟨ R 0 , R med ⟩ F = tr( R 0 R med ) ≥ 0 it follo ws that µ ∈ [0 , 1] . Accordingly , (49) can be rewritten as r eff ( R c ) = tr R 0 + tr R med 2 ∥ R 0 ∥ 2 F + ∥ R med ∥ 2 F + 2 µ ∥ R 0 ∥ F ∥ R med ∥ F (51) The parameter µ quantifies the alignment between the nom- inal clutter cov ariance and the medium-induced cov ariance under the Frobenius inner product. A smaller µ implies a larger deviation of the additional cov ariance component from the original spectral structure, and thus a higher likelihood of increasing the total ef fectiv e rank under the same trace increment. As indicated by (48) and (51), spectral broadening induced by medium randomness typically requires two conditions. First, the kernel spectrum { λ q } should not be ov erly concen- trated on a fe w modes. Second, the mapped modal components { S q } should exhibit sufficient di versity in the channel domain. The former determines the ef fective de grees of freedom in- troduced by medium randomness, while the latter determines whether these degrees of freedom produce resolvable spectral expansion in the observation domain. F . Effective Clutter Subspace Dimension and Separability Consider the eigendecomposition of the total clutter cov ari- ance R c : R c = M X m =1 λ ( c ) m u m u H m , λ ( c ) 1 ≥ λ ( c ) 2 ≥ · · · ≥ λ ( c ) M ≥ 0 (52) For a prescribed energy threshold ρ ∈ (0 , 1) , define the effecti ve clutter-subspace dimension as 6 p ρ ≜ min ( p : P p m =1 λ ( c ) m P M m =1 λ ( c ) m ≥ ρ ) (53) Accordingly , the subspace spanned by the first p ρ eigen vec- tors, U ( ρ ) c = span { u 1 , . . . , u p ρ } (54) can be regarded as the effecti ve clutter subspace in the energy sense. Let p m = λ ( c ) m P M i =1 λ ( c ) i , M X m =1 p m = 1 (55) Then, r eff ( R c ) = 1 P M m =1 p 2 m (56) Moreov er, from (53), it follows that P p ρ m =1 p m ≥ ρ . By the Cauchy–Schwarz inequality , p ρ X m =1 p 2 m ≥ P p ρ m =1 p m 2 p ρ ≥ ρ 2 p ρ (57) which yields the lower bound p ρ ≥ ρ 2 r eff ( R c ) (58) This result indicates that, as the effecti ve rank increases, the effecti ve clutter-subspace dimension corresponding to a prescribed energy threshold cannot remain arbitrarily small. Empirically , when the eigenspectrum is relativ ely smooth and no excessiv ely dominant mode exists, p ρ often exhibits a monotonic trend consistent with r eff ( R c ) , although the two quantities are generally not identical. Let a t denote the target steering vector , and let the subspace spanned by the first p dominant clutter eigen vectors, U ( p ) c = span { u 1 , . . . , u p } (59) be taken as the principal clutter subspace. Its orthogonal projection matrix is P ( p ) c = p X m =1 u m u H m (60) Then, define the ov erlap between the target and the principal clutter subspace, and the corresponding separability measure, respectiv ely , as γ ( p ) ≜ ∥ P ( p ) c a t ∥ 2 2 ∥ a t ∥ 2 2 (61) and η ( p ) ≜ ∥ ( I − P ( p ) c ) a t ∥ 2 2 ∥ a t ∥ 2 2 = 1 − γ ( p ) (62) A larger γ ( p ) indicates that a greater portion of the target energy falls within the principal clutter subspace, whereas a larger η ( p ) implies impro ved separability between the target and the clutter subspace. Therefore, when medium randomness increases and causes both the effecti ve rank of R c and p ρ to gro w , the principal clutter subspace will generally occupy a broader portion of the observ ation space. For a fixed target steering vector a t , this typically leads to an increase in γ ( p ρ ) and a decrease in η ( p ρ ) , implying a deterioration in tar get–clutter separability . In this sense, the impact of uncertainty in dispersiv e media on detection performance can ultimately be attributed to its expansion ef fect on the clutter-co variance spectral structure and the dimension of the effecti ve clutter subspace. I V . N U M E R I C A L V A L I DAT I O N Section III established a theoretical connection from relaxation-spectrum randomness to clutter-co variance spectral structure and the associated separability metrics. This section validates that connection numerically in a layered manner . The random propagation process and covariance construction are first examined against Monte Carlo sample statistics. The v alidity range of the first-order approximation, together with conv ergence and parameter robustness, is then assessed. Finally , the induced co variance v ariations are analyzed through effecti ve rank, effecti ve clutter-subspace dimension, separabil- ity metrics, and their modal organization. A. Experimental Setup and Evaluation Pr otocol 1) V alidation Objective and Numerical Realization: The experiments are organized around the theoretical propagation chain δ ˜ g ( u ) → δ ϵ c ( ω ) → δ k c ( ω ) → δ a ( θ , r ) → R a ( θ , r ) → R med → R c → r eff , p ρ , η , γ The objectiv e is to test whether the proposed theoretical connection can be realized and validated stage by stage against Monte Carlo counterparts, while assessing the validity range of the first-order approximation, the con vergence of statistical estimation, and the robustness of the conclusions with respect to the random-field parameters. In the numerical implementation, the logarithmic relaxation- time variable u is discretized on a finite grid, and the scene integral is approximated using a discrete patch grid. In the Monte Carlo procedure, δ ˜ g ( u ) serves as the sole random source. For each realization, the perturbations δ ϵ c ( ω ) , δ k c ( ω ) , and δ a ( θ, r ) are generated sequentially , from which the local sample cov ariance, the medium-induced cov ariance, and the total clutter cov ariance are constructed. In parallel, the the- oretical quantities are computed from the linear propagation relations, first-order approximation, and scene-aggregation for - mulas derived in Section III. All comparisons are performed under identical system parameters, discretization grids, and scene configurations. 2) Baseline Configuration and Scan Design: T o first verify the end-to-end consistency of the main chain under represen- tativ e conditions, the baseline experiment is set as σ g = 0 . 03 , n mc = 2000 , seed = 20260315 7 where σ g denotes the amplitude parameter of the relaxation- spectrum random field, n mc is the Monte Carlo sample size, and seed specifies the random realization. This setting corre- sponds to a moderate perturbation lev el with sufficiently dense sampling, and is therefore used as the common reference for the subsequent scanning experiments. Based on this baseline, three types of scan are further conducted. 1) Perturbation-strength scan. Fix n mc = 2000 and seed = 20260315 , and set σ g ∈ { 0 . 01 , 0 . 03 , 0 . 05 } to examine the sensitivity of the first-order propagation approxima- tion to the perturbation magnitude. 2) Sample-size scan. Fix σ g = 0 . 03 and seed = 20260315 , and set n mc ∈ { 200 , 500 , 1000 , 2000 } to distinguish statistical sampling error from model approximation error and to e valuate the con vergence beha vior of the sample cov ariance estimates. 3) Robustness scan. Fix the remaining baseline settings and vary the random seed and the Mat ´ ern kernel hyperparameters. For the seed, use seed ∈ { 20260315 , 20260316 , 20260317 , 20260318 , 20260319 } ; for the Mat ´ ern kernel, use ν ∈ { 0 . 5 , 1 . 5 , 2 . 5 } , ℓ -scale ∈ { 0 . 5 , 1 . 0 , 2 . 0 } , and σ g ∈ { 0 . 03 , 0 . 05 } to assess the stability of the conclusions with respect to smoothness, correlation scale, and perturbation intensity . 3) Evaluation Metrics: The v alidation follo ws fi ve stages consistent with the theoretical chain. Stage A compares the theoretical and sample cov ariances of the permittivity spec- trum. Stage B ev aluates the wav enumber covariance and the error of its first-order linearization. Stage C examines the local steering covariance and the associated approximation error . Stage D compares the medium-induced cov ariance R med with the total clutter cov ariance R c and verifies their Hermitian positiv e semidefinite property . Stage E analyzes the effecti ve rank, effecti ve clutter-subspace dimension, and separability metrics deriv ed from R c . Relativ e error is used as the primary consistency measure in Stages A–D, together with numerical diagnostics such as complex-square-root branch continuity , Hermitian residuals, and minimum eigen values. Stage E uses r eff ( R c ) , p ρ , η , and γ to characterize spectral structure and target–clutter separabil- ity , with p ρ ev aluated at ρ = 0 . 9 . The reported thresholds serve as practical numerical acceptance criteria under the adopted discretization and sample size. B. Baseline V alidation of the Main Statistical Pr opagation Chain This subsection ev aluates, under the baseline configuration, whether the propagation chain from relaxation-spectrum ran- domness to clutter-cov ariance construction holds numerically . Four lev els are examined: (i) the propagation of second-order statistics from δ ˜ g ( u ) to δ ϵ c ( ω ) ; (ii) the propagation from δ ϵ c ( ω ) to δ k c ( ω ) together with the first-order linearization of the wav enumber; (iii) the propagation from δ k c ( ω ) to δ a ( θ, r ) ; and (i v) the scene-le vel aggregation from the local cov ariance R a ( θ , r ) to R med and R c . Theoretical quantities are computed from the propagation and aggregation formulas in Section III-B and Section III-C, while Monte Carlo statistics are obtained from n mc = 2000 realizations of δ ˜ g ( u ) propa- gated through the full chain. T able I summarizes the principal consistency metrics. Over- all, the front-end propagation exhibits strong numerical agree- ment: the relati ve errors of the permittivity cov ariance and wa venumber cov ariance are both about 1 . 5 × 10 − 2 , indicating that the second-order statistical propagation from δ ˜ g ( u ) to δ ϵ c ( ω ) and then to δ k c ( ω ) is well supported by the sample statistics. No branch switching is observed in the complex- square-root mapping, indicating stable numerical continuity of the wa venumber transformation within the current parameter range. Compared with the first two stages, the approximation error is more evident at the steering-vector stage. Although the relativ e error of the local steering covariance is only 0 . 014077 , the maximum RMS relative error of the first-order steering ap- proximation reaches 0 . 071139 , which is close to the prescribed threshold. This indicates that, under the baseline configuration, the dominant approximation error arises primarily from the first-order linearization of the exponential mapping δ k c ( ω ) 7→ δ a ( θ , r ) rather than from the construction of the preceding second- order statistics. Hence, the principal validity boundary of the current theoretical chain appears at the steering-perturbation stage, rather than at the Debye-type or wa venumber - propagation stages. The aggregated results further support this interpretation. The relativ e error of the total clutter cov ariance ( 0 . 004577 ) is smaller than that of the medium-induced cov ariance ( 0 . 013898 ), consistent with R c = R 0 + R med When the nominal component R 0 dominates, local errors in R med are partially diluted in the assembled cov ariance R c , making the total covariance less sensitive to perturbation- induced approximation errors. In addition, the Hermitian residual and minimum eigen value both remain at machine precision, confirming that the numerical realizations of R med and R c preserve the required Hermitian positiv e semidefinite structure. As sho wn in Fig. 1, the theoretical and Monte Carlo results agree closely for the permittivity and wavenumber cov ariances in Stages A and B. Fig. 2 shows that this agreement is maintained for representativ e local steering cov ariances, and Fig. 3 confirms that the aggregated matrices R med and R c retain the same dominant structure as their Monte Carlo counterparts. These visual observations are consistent with the quantitativ e results in T able I. In summary , under the baseline configuration of moderate perturbation and suf ficient sampling, the propagation chain from relaxation-spectrum randomness to clutter-cov ariance construction is numerically well supported. The second-order statistical propagation in the permittivity and wav enumber stages agrees with Monte Carlo statistics, while both the local steering cov ariance and the scene-aggregated co variances 8 T ABLE I B A S E LI N E C O N S IS T E N CY M E T RI C S F O R T H E M A I N S TA T I S T IC A L P R OPAG A T I O N C H AI N . Stage Metric V alue Threshold A Relativ e error of permittivity cov ariance 0.014918 0.05 B Relativ e error of wavenumber covariance 0.014911 0.05 B RMS relativ e error of first-order wavenumber lin- earization 0.014617 0.05 C Maximum relativ e error of local steering covariance 0.014077 0.08 C Maximum RMS relativ e error of first-order steering perturbation 0.071139 0.08 D Relativ e error of R med 0.013898 0.08 D Relativ e error of R c 0.004577 0.08 D Maximum Hermitian residual 6 . 12 × 10 − 18 10 − 12 D Minimum eigen value − 3 . 84 × 10 − 18 > − 10 − 10 (a) P er mittivity cov ariance (b) W av enumber cov ar iance Fig. 1. Baseline comparisons for the front-end cov ariance propagation. The theoretical and Monte Carlo results are highly consistent for both the permittivity covariance and the wavenumber covariance, supporting the first part of the statistical propagation chain. remain consistent with their theoretical predictions. The main approximation boundary arises from the first-order lineariza- tion of the steering-vector exponential mapping. These results provide the baseline reference for the subsequent analyses of perturbation strength, sample size, kernel parameters, and subspace-lev el metrics. C. Ef fects of P erturbation Strength and Sample Size 1) P erturbation-Str ength Scan: This subsection examines the validity range of the first-order theory with respect to perturbation strength. Only the amplitude parameter σ g of the relaxation-spectrum random field is varied, while all other settings remain identical to the baseline, namely n mc = 2000 and seed = 20260315 . For each σ g , theoretical and Monte Carlo quantities are constructed and compared using the same procedure as in Section IV -B. The resulting error v ariation therefore reflects the influence of the input random-field strength alone, without interference from changes in sampling conditions. T ABLE II R E PR E S E NTA T I V E E R RO RS U N D ER T H E P E RT U RB A T I ON - S T RE N G TH S C A N W I TH FI X E D n mc = 2000 A N D S E E D = 20260315 . σ g Relative er - ror of per - mittivity co- variance Relative error of wav enum- ber covariance Relative er - ror of R med Maximum RMS relativ e error of steering lin- earization 0.01 0.015293 0.015315 0.015199 0.023823 0.03 0.014918 0.014911 0.013898 0.071139 0.05 0.015293 0.015190 0.012379 0.117610 T able II summarizes the representativ e error metrics. The front-end second-order propagation and the scene-lev el co- variance aggregation remain stable throughout the scan range: the relativ e errors of the permittivity covariance, wa venumber cov ariance, and R med all remain on the order of 10 − 2 and show no noticeable degradation as σ g increases. In contrast, the first-order steering approximation exhibits a clear increase in error . The maximum RMS relativ e error rises from 0 . 023823 at σ g = 0 . 01 to 0 . 071139 at the baseline setting σ g = 0 . 03 , and further to 0 . 117610 at σ g = 0 . 05 , exceeding the current acceptance range for first-order accuracy . These results indicate that the principal v alidity boundary of the theoretical chain is not determined by the Debye- type integral propagation, the construction of wa venumber statistics, or the scene-lev el cov ariance aggregation. Instead, it is governed primarily by the first-order linearization accuracy of the exponential steering mapping δ k c ( ω ) 7→ δ a ( θ , r ) Under weak to moderate perturbations, the first-order theory accurately captures the propagation of medium randomness into clutter statistics. As the perturbation strength increases, the first breakdown occurs at the local steering linearization rather than at the cov ariance-construction level. Fig. 4 illustrates the same trend: the steering-linearization error grows rapidly with increasing σ g , whereas the cov ariance-lev el errors remain comparati vely stable. Within the present setting, the first-order theory therefore remains 9 Fig. 2. Baseline comparisons for the local steering covariance at representativ e patches. The theoretical and Monte Carlo results remain consistent across the selected patches, while the dominant approximation error is associated with the first-order linearization from δ k c ( ω ) to δ a ( θ, r ) . Fig. 3. Baseline comparisons for the aggregated covariance matrices R med and R c . The theoretical and Monte Carlo results exhibit the same dominant structure after scene-lev el aggregation, supporting the covariance construction at the global lev el. numerically reliable for σ g ≤ 0 . 03 ; beyond this range, higher- Fig. 4. Error trends under the perturbation-strength scan. As the perturbation strength increases, the steering linearization error grows rapidly , whereas the cov ariance-level errors remain comparatively stable. This indicates that the effecti ve validity range of the first-order theory is primarily limited by the exponential steering mapping from δ k c ( ω ) to δ a ( θ, r ) . order corrections to the steering mapping would be required to maintain comparable accuracy . 2) Monte Carlo Sample-Size Scan: This subsection exam- ines the ef fect of sample size on theory–Monte Carlo con- 10 T ABLE III R E PR E S E NTA T I V E E R RO RS U N D ER T H E M O N T E C A RL O S A MP L E - SI Z E S C AN W I T H FI X ED σ g = 0 . 03 A N D S E E D = 20260315 . n mc Relative er - ror of per - mittivity co- variance Relative error of wav enum- ber covariance Relative er - ror of R med Relative er - ror of R c 200 0.122552 0.120413 0.104627 0.004539 500 0.051774 0.050469 0.039862 0.004563 1000 0.036956 0.037007 0.035191 0.004562 2000 0.014918 0.014911 0.013898 0.004577 sistency , with the aim of separating finite-sample fluctuation from model-approximation error . The parameters σ g = 0 . 03 and seed = 20260315 are fixed, while the Monte Carlo sample size is varied over n mc ∈ { 200 , 500 , 1000 , 2000 } . Under this setting, the theoretical quantities remain unchanged, whereas the sample statistics are estimated from increasingly large realization sets of δ ˜ g ( u ) . The resulting variation therefore reflects the sensiti vity of each stage to sample-covariance estimation error . T able III reports the representati ve errors for dif ferent values of n mc . The relativ e errors of the permittivity cov ariance, wa venumber cov ariance, and R med decrease markedly as the sample size increases. At n mc = 200 , these errors remain at the order of 10 − 1 ; they decrease substantially at n mc = 500 ; and for n mc ≥ 1000 , they further fall to the fe w-percent lev el, indicating stable agreement between the theoretical constructions and the sample statistics. This behavior shows that, at small sample sizes, the dominant error source is the instability of sample-covariance estimation. By contrast, the relati ve error of the total clutter cov ariance R c varies little ov er the entire scan range and remains around 4 . 5 × 10 − 3 . This behavior is consistent with R c = R 0 + R med since the nominal cov ariance R 0 suppresses Monte Carlo sam- pling fluctuations and makes the total covariance statistically more robust than R med alone. From the perspecti ve of statistical con vergence, n mc = 1000 already provides a sufficiently stable basis for judging theory– sample consistency , whereas the baseline choice n mc = 2000 further reduces sampling fluctuation. Fig. 5 shows the same con ver gence trend and confirms that the larger discrepancies at low sample counts arise primarily from finite-sample es- timation effects rather than systematic bias in the theoretical propagation chain. D. Rob ustness to Random Realizations and Mat ´ ern Hyperpa- rameters This subsection examines the stability of the preceding conclusions with respect to both the random realization and the random-field prior parameters. The former ev aluates whether the baseline results are representati ve across Monte Carlo runs, while the latter tests whether the conclusions remain v alid Fig. 5. Con vergence trends with respect to the Monte Carlo sample size. The cov ariance-level errors decrease substantially as n mc increases, indicating that the large discrepancies at low sample counts are primarily caused by finite-sample estimation effects rather than inconsistency of the theoretical propagation chain. T ABLE IV R E PR E S E NTA T I V E E R RO RS U N D ER T H E R A N D OM - S E ED S C A N W I TH FI X E D σ g = 0 . 03 A N D n mc = 2000 . Seed Relative error of R c Maximum RMS relativ e error of steering lin- earization 20260315 0.004577 0.071139 20260316 0.004648 0.074865 20260317 0.004639 0.074553 20260318 0.004584 0.071187 20260319 0.004604 0.075986 beyond a single set of Mat ´ ern kernel parameters. T ogether , these experiments assess whether the observed error hierarchy is structurally stable within a reasonable parameter range. The random-seed effect is first considered. With σ g = 0 . 03 and n mc = 2000 fixed, only the seed is varied. Because the theoretical quantities are independent of the seed, any differ - ences across runs reflect finite-sample Monte Carlo fluctuation. T able IV shows that the relativ e error of R c remains close to 4 . 6 × 10 − 3 , while the maximum RMS relative error of the first-order steering approximation varies only between about 0 . 0711 and 0 . 0760 . Thus, the steering linearization remains the dominant error source, and this conclusion is not tied to a particular realization. The Mat ´ ern hyperparameters are then scanned. Here, the smoothness parameter ν , correlation scale ℓ , and perturbation strength σ g are varied, and both the theoretical quantities and Monte Carlo statistics are recomputed for each parameter group. Since this scan changes the statistical structure of the random field itself, it provides a more direct test of robustness to prior-model specification. As reported in T able V, the dominant influences are σ g and ℓ . For σ g = 0 . 03 , most parameter groups remain within the acceptable range, whereas for σ g = 0 . 05 the mean steering-linearization error increases substantially , indicating a clear shrinkage of the effecti ve validity range of the first- order theory . Increasing ℓ produces a similar effect: the mean steering-linearization error rises from 0 . 07550 to 0 . 10359 , im- 11 T ABLE V G RO U PE D S TA T I S TI C S F RO M T H E M A T ´ E R N H Y PE R PAR A M E TE R S C AN . Grouping condition Number of accept- able cases Mean steering lin- earization error σ g = 0 . 03 8 / 9 0.06797 σ g = 0 . 05 0 / 9 0.11296 ℓ -scale = 0 . 5 3 / 6 0.07550 ℓ -scale = 1 . 0 3 / 6 0.09231 ℓ -scale = 2 . 0 2 / 6 0.10359 plying stronger local nonlinearity in the exponential mapping stage. By comparison, the effect of ν is weaker and mainly modifies the error lev el without changing the dominant error mechanism. Overall, the seed scan and the Mat ´ ern-parameter scan sup- port the same conclusion: the baseline error hierarchy is robust, with the dominant error consistently arising from the first- order steering linearization, while the practical validity range of the theory is influenced mainly by the perturbation strength and the correlation scale. E. Sta ge E: Spectral Structure , Effective Subspace Dimension, and Separability The preceding experiments showed that the theoretical constructions of R med and R c agree well with Monte Carlo sample statistics at the covariance le vel. This subsection exam- ines whether the same agreement extends to the spectral and separability lev els, as quantified by r eff ( R c ) , p ρ , η , and γ . The objectiv e is therefore to verify whether the effecti ve spectral dimension induced by R c and the tar get–clutter geometric relationship remain consistent with the theoretical analysis. The theoretical quantities are computed from R th c , and the Monte Carlo quantities from R mc c . The principal threshold for p ρ is set to ρ = 0 . 9 , with an additional stability check under higher energy thresholds. The results are reported mainly for representativ e locations, especially the center patch, and should therefore be interpreted as representative rather than strictly pointwise over the full observation space. T able VI reports the baseline results. At the spectral lev el, theory and Monte Carlo remain highly consistent: r th eff = 2 . 7606 , r mc eff = 2 . 7747 , p th ρ = p mc ρ = 3 ( ρ = 0 . 9) Thus, the co variance-le vel consistenc y is preserv ed after eigen- decomposition. At the separability level, the center patch gives η th = 0 . 6543 , η mc = 0 . 6513 and γ th = 0 . 3457 , γ mc = 0 . 3487 The small differences indicate that the target–clutter geometric relationship is reproduced consistently in both theory and Monte Carlo ev aluation. No unstable switching of p ρ is observed. T ABLE VI R E PR E S E NTA T I V E S T A GE E M E T RI C S U N D E R T H E BA S E LI N E C O NFI G U R A T I O N . Metric Theory Monte Carlo Effecti ve rank r eff ( R c ) 2.7606 2.7747 Effecti ve clutter-subspace dimension p ρ ( ρ = 0 . 9 ) 3 3 Separability metric η (center patch) 0.6543 0.6513 Projection metric γ (center patch) 0.3457 0.3487 Fig. 6. Representati ve Stage E comparisons under the baseline configuration. The theoretical and Monte Carlo results remain consistent in the ef fectiv e rank, the effecti ve clutter-subspace dimension, and the representative separability metrics, supporting the claim that medium uncertainty affects target–clutter separability through the spectral structure of R c . Overall, Stage E supports the full theoretical chain: medium randomness affects not only local propagation quantities and cov ariance entries, but also the spectral structure of R c , the effecti ve clutter-subspace dimension, and the target–clutter ge- ometry . These effects are ultimately reflected in the variations of η and γ . Fig. 6 further confirms this consistency at both the spectral and separability lev els. F . Modal V alidation of the Spectral Structur e Beyond the cov ariance- and subspace-level validations, the theoretical structure is further examined at the modal le vel. The KL expansion and modal aggregation analyzed in Sec- tion III-D link the relaxation-spectrum random field to the spectral structure of the covariance. The objecti ve here is to verify whether , under the present numerical implementation, the KL modes propagated through the operator and scene aggregation remain consistent with the previously observed spectral results. The validation focuses on modal reconstruction closure, local and global spectral closure, and the influence of the truncation order Q . A detailed correspondence between indi- vidual u q and v q modes is not pursued; instead, the emphasis is placed on verifying the spectral-closure relationship itself. Under the baseline configuration, the experiments ev aluate the terminal global closure, local closures at representative lo- cations, the KL cumulativ e-energy curve, and the dependence of errors and spectral quantities on the truncation order Q . Both global and local closure errors are found to be at machine precision. The terminal global closure error is 1 . 22 × 10 − 15 , and the local closure errors at the center , edge-left, and edge-right patches are all of order 10 − 15 . This indicates that 12 (a) Local closure error (b) Global closure error (c) r eff (d) KL energy accumulation Fig. 7. Modal validation of the spectral structure under the baseline configuration. As the truncation order Q increases, both local and global closure errors rapidly decay to machine precision, while the spectral quantities become stable. These results verify that the propagated cov ariance structure is consistent with its modal reconstruction and that the dominant spectral content is captured by a finite number of KL modes. T ABLE VII R E PR E S E NTA T I V E M O DA L - V A L I DA T I ON R E S U L T S U N D ER T H E B A SE L I NE C O NFI G U R A T I O N . Metric V alue T erminal global closure error 1 . 22 × 10 − 15 Global Frobenius closure error 1 . 25 × 10 − 15 Local closure error (center) 1 . 30 × 10 − 15 Local closure error (edge-left) 1 . 28 × 10 − 15 Local closure error (edge-right) 1 . 22 × 10 − 15 Maximum truncation order Q 256 the statistical structure reconstructed from KL modes is in near-e xact numerical agreement with the cov ariance obtained directly from propagation. These results confirm that the KL expansion can numeri- cally reconstruct the propagated statistical structure with high accuracy . Moreo ver , they support the earlier conclusion that the principal spectral structure of R med is governed by a limited number of dominant modes. Thus, the spectral broad- ening observed at the cov ariance and subspace lev els can be interpreted as the organized contribution of a finite set of propagated KL modes. Fig. 7 illustrates the dependence of local closure error , global closure error, effecti ve rank, and KL cumulativ e energy on the truncation order Q . As Q increases, both closure errors rapidly decay to machine precision while the spectral quantities stabilize, indicating that a finite truncation order suffices to capture the dominant statistical structure. Therefore, the spectral analysis is validated not only at the lev el of final metrics b ut also through modal reconstruction and truncation beha vior . These results demonstrate that the cov ariance, subspace, and separability conclusions obtained earlier are consistent with the underlying modal organization of the propagated random field. G. Scope and Limitations of the Experimental V alidation The experiments in this paper are intended as a numerical validation of the theoretical chain, rather than as a comprehen- siv e ev aluation of end-to-end detection performance. The val- idated objects are therefore the random propagation relations, cov ariance constructions, spectral-structure quantities, effec- tiv e subspace dimension, and separability metrics themselves, rather than downstream task-le vel indicators such as detection probability , false-alarm rate, imaging quality , or classification accuracy . Accordingly , the conclusions should be understood as numerical support for the theoretical characterization of how medium randomness af fects the single-snapshot clutter statistical structure and its geometric consequences, rather than as direct evidence of performance gains for a specific processing scheme. The current validation is conducted under a single-snapshot setting, discrete patch-based scene integration, and a unified discretization grid. Although these choices are consistent with the assumptions in Section III, the validated range remains limited by the adopted discretization accuracy , sample size, and parameter intervals. In particular, both the perturbation- strength scan and the Mat ´ ern-kernel scan indicate that the main applicability boundary of the present first-order theory lies in the local linearization of the exponential steering mapping. As the perturbation strength or correlation scale increases, higher- order approximations or more refined nonlinear treatments may be required to maintain comparable accuracy . The subspace and separability results are reported mainly for representativ e locations, especially the center patch and gridded post-processing outputs. They therefore demonstrate that the theoretical analysis can be instantiated stably at representativ e scene points, but should not be interpreted as a strict pointwise guarantee ov er the entire observ ation space. Similarly , the modal experiments validate KL reconstruction, local and global spectral closure, and truncation con ver gence, but do not address finer one-to-one modal correspondences. Their role is therefore to support the spectral-organization mechanism itself, rather than to provide an exhausti ve veri- fication of every modal detail. W ithin these boundaries, the experiments provide mutually consistent evidence across the covariance, spectral, subspace, and modal levels, thereby supporting the main theoretical claims in Section III and establishing a statistical-structure basis for future extensions toward detection, suppression, and imaging tasks. V . C O N C L U S I O N This paper addressed the modeling gap between complex dispersiv e-medium characterization and FD A-MIMO clutter statistical analysis in single-snapshot GPR scenarios. A the- oretical route was established linking logarithmic relaxation- 13 spectrum randomness to dielectric perturbation, wav enumber perturbation, steering-vector perturbation, and the resulting medium-induced and total clutter covariances. These v aria- tions were further related to ef fectiv e rank, clutter-subspace dimension, and target–clutter separability metrics, providing a computable mechanism by which medium uncertainty re- shapes clutter statistics. Numerical experiments verified the proposed propagation chain and demonstrated stable agreement between theoretical constructions and Monte Carlo statistics. Parameter scans indicated that the main applicability boundary of the first-order theory arises from the local linearization of the exponential steering mapping. Spectral, subspace, and modal analyses further confirmed that medium randomness modifies both the effecti ve spectral dimension and the geometry of the clutter subspace. The proposed frame work therefore provides a systematic interface between complex-medium random modeling and FD A-MIMO clutter analysis. Rather than acting as a simple additiv e disturbance, medium uncertainty is shown to operate as a structural statistical mechanism that reshapes the clutter spectrum and its associated effecti ve subspace. This perspec- tiv e may support future FDA-MIMO-GPR processing methods based on subspace and low-rank techniques. A P P E N D I X A F I R S T - O R D E R P RO PAG A T I O N F RO M R E L A X A T I O N - S P E C T RU M P E RT U R BAT I O N T O S T E E R I N G P E RT U R BAT I O N This appendix supplements Section III-B by making explicit the first-order propagation. From (9) and (10), the perturbation of the complex permit- tivity is δ ϵ c ( ω ) = Z ∞ −∞ δ ˜ g ( u ) 1 + j ω e u du (63) Hence, δ ϵ c ( ω ) is the image of δ ˜ g ( u ) under a linear Debye-type integral operator . Under the small-perturbation condition | δ ϵ c ( ω ) | ≪ | ¯ ϵ c ( ω ) | (64) a first-order T aylor expansion of (3) at ¯ ϵ c ( ω ) yields δ k c ( ω ; µ ) ≈ ∂ k c ( ω ; µ ) ∂ ϵ c ( ω ) ¯ ϵ c ( ω ) δ ϵ c ( ω ) = ω µ 0 2 p µ 0 ¯ ϵ c ( ω ) δ ϵ c ( ω ) (65) For the m th channel, by (5) and (22), a m ( θ , r ; µ ) = a 0 ,m ( θ , r ) exp − j δ k c ( ω m ; µ ) L m ( θ , r ) (66) If | δ k c ( ω m ; µ ) L m ( θ , r ) | ≪ 1 , then δ a m ( θ , r ) ≜ a m ( θ , r ; µ ) − a 0 ,m ( θ , r ) ≈ − j L m ( θ , r ) a 0 ,m ( θ , r ) δk c ( ω m ; µ ) (67) Substituting the expression of δ k c ( ω m ; µ ) gi ves δ a m ( θ , r ) ≈ Z ∞ −∞ H m ( θ , r ; u ) δ ˜ g ( u ) du (68) namely , δ a ( θ, r ) = Z ∞ −∞ H ( θ , r ; u ) δ ˜ g ( u ) du (69) This establishes the first-order operator chain used in the main text. A P P E N D I X B C OV A R I A N C E D E C O M P O S I T I O N A N D A L O W E R B O U N D L I N K I N G r eff A N D p ρ This appendix supplements Sections III-C and III-F. From (28), the local steering covariance is R a ( θ , r ) = E δ a ( θ, r ) δ a ( θ , r ) H (70) Let a ( θ , r ; µ ) = a 0 ( θ , r ) + δ a ( θ, r ) (71) Then the clutter snapshot can be decomposed as x c = x 0 + x med (72) with x 0 = Z Z β ( θ , r ) a 0 ( θ , r ) dθ dr x med = Z Z β ( θ , r ) δ a ( θ , r ) dθ dr (73) Under Assumptions A1 – A3, the cross terms vanish in the second-order sense, so that R c = E [ x c x H c ] = R 0 + R med (74) where R 0 = Z Z σ 2 β ( θ , r ) a 0 ( θ , r ) a 0 ( θ , r ) H dθ dr (75) and R med = Z Z σ 2 β ( θ , r ) R a ( θ , r ) dθ dr (76) T o connect the spectral spreading of R c to the effecti ve clutter-subspace dimension, let p i = λ ( c ) i P M m =1 λ ( c ) m , M X i =1 p i = 1 (77) Then r eff ( R c ) = 1 P M i =1 p 2 i (78) By the definition of p ρ , if m = p ρ , then m X i =1 p i ≥ ρ (79) Using Cauchy–Schwarz, m X i =1 p i ! 2 ≤ m m X i =1 p 2 i ≤ m M X i =1 p 2 i (80) which giv es p ρ ≥ ρ 2 r eff ( R c ) (81) Therefore, an increase in r eff ( R c ) necessarily pushes upward the lower bound of the effecti ve clutter-subspace dimension. 14 R E F E R E N C E S [1] Y . W u, F . Xu, L. Zhou, H. Zheng, Y . He, Y . Lian, Y . W u, F . Xu, L. Zhou, H. Zheng, Y . He, and Y . Lian, “ A GPR Imagery-Based Real- T ime Algorithm for Tunnel Lining V oid Identification Using Improv ed YOLOv8, ” Buildings , vol. 15, no. 18, Sep. 2025. [2] J. W en, T . Huang, X. Cui, Y . Zhang, J. Shi, Y . Jiang, X. Li, L. Guo, J. W en, T . Huang, X. Cui, Y . Zhang, J. Shi, Y . Jiang, X. Li, and L. Guo, “Enhancing Image Alignment in Time-Lapse-Ground-Penetrating Radar through Dynamic Time W arping, ” Remote Sensing , vol. 16, no. 6, Mar . 2024. [3] A. Sheppard and K. A. Skinner , “MarsLGPR: Mars Rover Localization W ith Ground Penetrating Radar, ” IEEE Tr ansactions on Field Robotics , vol. 2, pp. 906–919, 2025. [4] P . Haruzi, J. Schm ¨ ack, L. Hain, Z. Zhou, B. Pouladi, Rennes, J. D. L. Bernardie, and J. V anderborght, “The potential of time-lapse GPR full- wav eform in version as high resolution imaging technique for salt, heat, and ethanol transport, ” 2020. [5] R. Johnson and E. Poeter, “Insights into the use of time-lapse GPR data as observations for inverse multiphase flow simulations of DNAPL migration, ” Journal of contaminant hydrology , vol. 89, pp. 136–55, Feb. 2007. [6] B. Ruols, J. Klahold, D. Farinotti, and J. Irving, “4D GPR imaging of a near-terminus glacier collapse feature, ” The Cryosphere , vol. 19, no. 9, pp. 4045–4059, Sep. 2025. [7] Z. Y u, D. Zhao, and Z. Zhang, “Doppler Radar V ital Signs Detec- tion Method Based on Higher Order Cyclostationary , ” Sensors (Basel, Switzerland) , vol. 18, no. 1, p. 47, Dec. 2017. [8] B. Yılmaz, I. Erer, F . ¨ Oz, and S. Baykut, “Music guided SVD method for the detection of vital signs with SFCW radar , ” Signal, Image and V ideo Processing , vol. 19, Feb . 2025. [9] S. Liu, Q. Qi, H. Cheng, L. Sun, Y . Zhao, and J. Chai, “ A V ital Signs Fast Detection and Extraction Method of UWB Impulse Radar Based on SVD, ” Sensors (Basel, Switzerland) , vol. 22, no. 3, p. 1177, Feb . 2022. [10] A. A. Daluom and M. C. W icks, “T racking a Moving Object for T o- mographic Below Ground Imaging, ” in NAECON 2018 - IEEE National Aer ospace and Electr onics Conference , Jul. 2018, pp. 550–554. [11] W .-Q. W ang, “Frequency Diverse Array SAR With Fast-T ime Space- T ime Adaptive Processing for Subsurface Imaging, ” IEEE Access , vol. 11, pp. 122 128–122 140, 2023. [12] S. Liu, Y . Su, B. Zhou, S. Dai, W . Y an, Y . Li, Z. Zhang, W . Du, C. Li, S. Liu, Y . Su, B. Zhou, S. Dai, W . Y an, Y . Li, Z. Zhang, W . Du, and C. Li, “Data Pre-Processing and Signal Analysis of Tianwen-1 Rover Penetrating Radar, ” Remote Sensing , vol. 15, no. 4, Feb . 2023. [13] N. A. Goodman and J. M. Stiles, “On clutter rank observ ed by arbitrary arrays, ” vol. 55, no. 1, pp. 178–186. [Online]. A vailable: https://ieeexplore.ieee.or g/document/4034167 [14] F . Gini and A. Farina, “V ector subspace detection in compound-gaussian clutter . Part I: Surve y and new results, ” vol. 38, no. 4, pp. 1295–1311. [15] Y . Liu, L. Xiao, X. W ang, and A. Nehorai. On clutter ranks of frequency diverse radar waveforms. [Online]. A vailable: http: //arxiv .org/abs/1603.08189 [16] K. W ang, G. Liao, J. Xu, Y . Zhang, and L. Huang, “Clutter rank analysis in airborne FDA-MIMO radar with range ambiguity , ” vol. 58, no. 2, pp. 1416–1430. [17] C. W en, M. T ao, J. Peng, J. W u, and T . W ang, “Clutter suppression for airborne FDA-MIMO radar using multi-waveform adaptiv e processing and auxiliary channel ST AP, ” vol. 154, pp. 280–293. [Online]. A vailable: https://www .sciencedirect.com/science/article/pii/S0165168418303001 [18] Y . Sun, W .-Q. W ang, and C. Jiang, “Space–time-range clutter suppression via tensor-based ST AP for airborne FD A-MIMO radar, ” vol. 214, p. 109235. [Online]. A vailable: https://www .sciencedirect. com/science/article/pii/S0165168423003092 [19] M. Jia, Y . Sun, and W .-Q. W ang, “FD A-MIMO radar parameter designing against range-ambiguous clutter and scatter-wa ve jamming, ” vol. 240, p. 110361. [Online]. A vailable: https://www .sciencedirect. com/science/article/pii/S0165168425004773 [20] S. Jain, V . Krishnamurthy , M. Rangaswamy , B. Kang, and S. Gogineni, “Radar clutter co variance estimation: A nonlinear spectral shrinkage approach, ” vol. 59, no. 6, pp. 7640–7653. [21] N. Rojhani, M. S. Greco, and F . Gini, “CRLBs for location and velocity estimation for MIMO radars in CES-distributed clutter, ” vol. V olume 2 - 2022. [Online]. A vailable: https://www .frontiersin.org/ journals/signal- processing/articles/10.3389/frsip.2022.822285 [22] C. Tian and P .-L. Shui, “Outlier-rob ust truncated maximum likelihood parameter estimation of compound-gaussian clutter with inv erse gaussian texture, ” vol. 14, no. 4004. [Online]. A vailable: https: //www .mdpi.com/2072- 4292/14/16/4004 [23] L. Xie, Z. He, J. T ong, T . Liu, J. Li, and J. Xi, “Regularized covariance estimation for polarization radar detection in compound gaussian sea clutter , ” vol. 60, pp. 1–16. [24] F . Y ang, J. Guo, R. Zhu, J. Le Kernec, Q. Liu, and T . Zeng, “Ground clutter mitigation for slow-time MIMO radar using independent component analysis, ” vol. 14, no. 6098. [Online]. A vailable: https: //www .mdpi.com/2072- 4292/14/23/6098 [25] L. Zhang, A. Xue, X. Zhao, S. Xu, and K. Mao, “Sea-land clutter classification based on graph spectrum features, ” vol. 13, no. 4588. [Online]. A vailable: https://www .mdpi.com/2072- 4292/13/22/4588 [26] Q. Liu, C. Jiang, L. Jin, and S. Ouyang, “Detection of subsurface target based on FD A-MIMO radar , ” vol. 2018, no. 1, p. 8629806. [Online]. A vailable: https://onlinelibrary .wiley .com/doi/abs/ 10.1155/2018/8629806 [27] M. Bano, “Constant dielectric losses of ground-penetrating radar wav es, ” vol. 124, no. 1, pp. 279–288. [Online]. A vailable: https: //doi.org/10.1111/j.1365- 246X.1996.tb06370.x [28] S. Holm, “Time domain characterization of the cole-cole dielectric model, ” vol. 11, no. 1, pp. 101–105. [Online]. A vailable: https: //pmc.ncbi.nlm.nih.gov/articles/PMC7851980/ [29] N. Florsch, C. Camerlynck, and A. Revil, “Direct estimation of the distribution of relaxation times from induced-polarization spectra using a fourier transform analysis, ” vol. 10, no. 6, pp. 517–531. [Online]. A vailable: https://onlinelibrary .wiley .com/doi/abs/ 10.3997/1873- 0604.2012004 [30] J. Liu and F . Ciucci, “The gaussian process distribution of relaxation times: A machine learning tool for the analysis and prediction of electrochemical impedance spectroscopy data, ” vol. 331, p. 135316. [31] S. Majchrowska, I. Giannakis, C. W arren, and A. Giannopoulos, “Mod- elling arbitrary complex dielectric properties – an automated implemen- tation for gprMax, ” in 2021 11th International W orkshop on Advanced Gr ound P enetrating Radar (IW A GPR) , pp. 1–5. [32] Z. Jiang, Z. Zeng, J. Li, F . Liu, and W . Li, “Simulation and analysis of GPR signal based on stochastic media model with an ellipsoidal autocorrelation function, ” vol. 99, pp. 91–97. [Online]. A vailable: https://www .sciencedirect.com/science/article/pii/S0926985113001705 [33] MIT Lincoln Laboratory LGPR T ech Notes. [Online]. A vailable: https://archiv e.ll.mit.edu/publications/technotes/LGPR.html [34] W . Bi, Y . Zhao, C. An, and S. Hu, “Clutter elimination and random-noise denoising of GPR signals using an SVD method based on the hankel matrix in the local frequency domain, ” vol. 18, no. 3422. [Online]. A vailable: https://www .mdpi.com/1424- 8220/18/10/3422 [35] W . Xue, Y . Luo, Y . Y ang, and Y . Huang, “Noise suppression for GPR data based on SVD of window-length-optimized hankel matrix, ” vol. 19, no. 3807. [Online]. A vailable: https://www .mdpi.com/1424- 8220/19/17/ 3807 [36] D. Kumlu and I. Erer, “GPR Clutter Reduction by Robust Orthonormal Subspace Learning, ” vol. 8, pp. 74 145–74 156. [37] R. J. Oliveira, B. Caldeira, T . T eixid ´ o, and J. F . Borges, “GPR clutter reflection noise-filtering through singular value decomposition in the bidimensional spectral domain, ” vol. 13, no. 2005. [Online]. A vailable: https://www .mdpi.com/2072- 4292/13/10/2005 [38] Q. Su, B. Bi, P . Zhang, L. Shen, X. Huang, and Q. Xin, “GPR Image Clutter Suppression Using Gaussian Curvature Decomposition in the PCA Domain, ” vol. 14, no. 19, p. 4879. [Online]. A vailable: https://www .mdpi.com/2072- 4292/14/19/4879 [39] L. Liu, C. Song, Z. W u, H. Xu, J. Li, B. W ang, and J. Li, “GPR clutter removal based on weighted nuclear norm minimization for nonparallel cases, ” vol. 23, no. 11, p. 5078. [Online]. A vailable: https://www .mdpi.com/1424- 8220/23/11/5078 [40] Y . Zhao, X. Y ang, X. Qu, T . Lan, and J. Gong, “Clutter removal method for GPR based on low-rank and sparse decomposition with total variation regularization, ” vol. 20, pp. 1–5. [41] Q. Dai, Y . He, Y . Lei, J. Lei, X. W ang, and B. Zhang, “GPR data reconstruction using residual feature distillation block u-net, ” vol. 16, pp. 6958–6968. [42] Q. Hoarau, G. Ginolhac, A. Atto, and J. Nicolas, “Robust adaptiv e detection of buried pipes using GPR, ” vol. 132, pp. 293–305. [Online]. A vailable: https://www .sciencedirect.com/science/article/pii/ S0165168416301529 [43] B. M. W orthmann, D. H. Chambers, D. S. Perlmutter , J. E. Mast, D. W . Paglieroni, C. T . Pechard, G. A. Stevenson, and S. W . Bond, “Clutter distributions for tomographic image standardization in ground-penetrating radar, ” vol. 59, no. 9, pp. 7957–7967. [Online]. A vailable: https://ieeexplore.ieee.or g/abstract/document/9336275 15 [44] W . W ang, W . Du, Y . Li, and Z. Jia, “ Advanced adaptive median filter for reducing salt-and-pepper noise in GPR data, ” vol. 22, pp. 1–5. [Online]. A vailable: https://ieeexplore.ieee.or g/document/10851338
Original Paper
Loading high-quality paper...
Comments & Academic Discussion
Loading comments...
Leave a Comment