FinRL-X: An AI-Native Modular Infrastructure for Quantitative Trading
We present FinRL-X, a modular and deployment-consistent trading architecture that unifies data processing, strategy construction, backtesting, and broker execution under a weight-centric interface. While existing open-source platforms are often backt…
Authors: Hongyang Yang, Boyu Zhang, Yang She
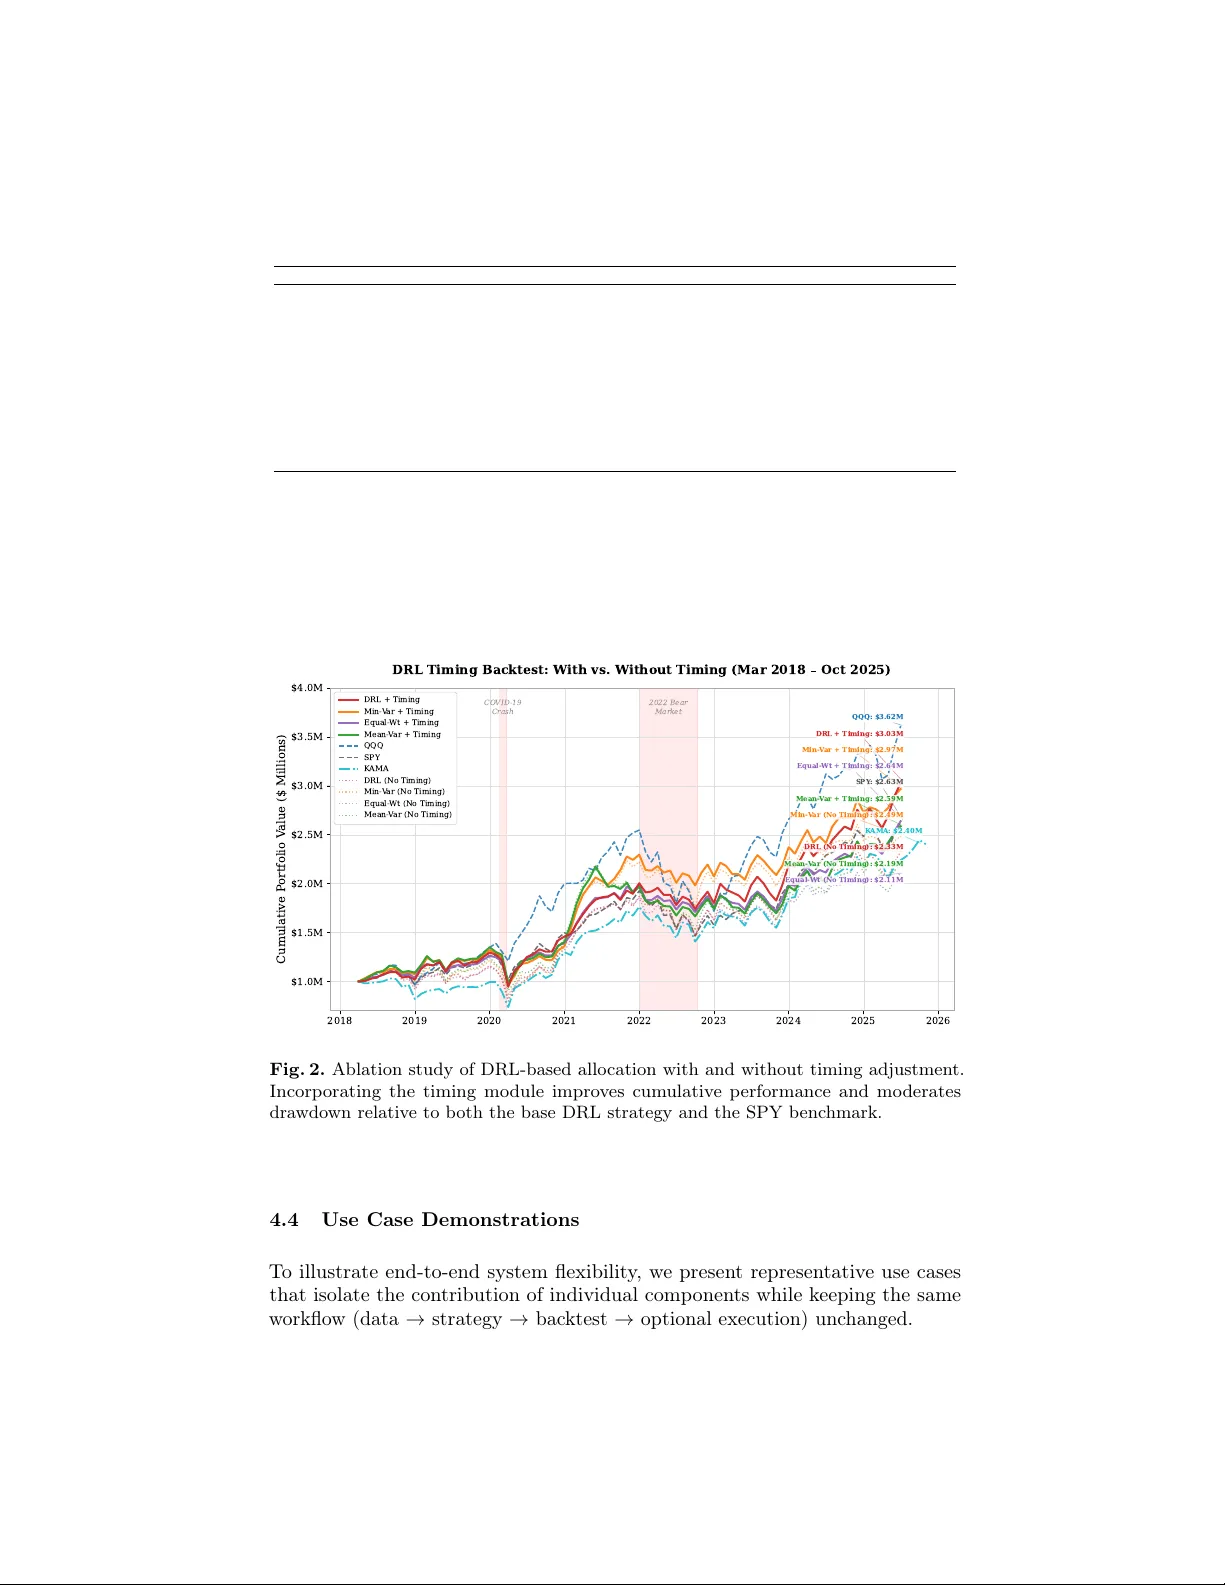
FinRL-X: An AI-Nativ e Mo dular Infrastructure for Quan titativ e T rading Hongy ang Y ang ⋆ , Bo yu Zhang, Y ang She, Xin yu Liao, and Xiaoli Zhang AI4Finance F oundation All authors con tributed equally . Abstract. W e presen t FinRL-X, a modular and deplo ymen t-consistent trading arc hitecture that unifies data processing, strategy construction, bac ktesting, and broker execution under a w eight-cen tric interface. While existing open-source platforms are often bac ktesting- or mo del-cen tric, they rarely pro vide system-lev el consistency b et w een research ev aluation and liv e deploymen t. FinRL-X addresses this gap through a comp os- able strategy pip eline that in tegrates sto c k selection, p ortfolio allocation, timing, and p ortfolio-lev el risk ov erlays within a unified proto col. The framew ork supp orts b oth rule-based and AI-driven comp onen ts, includ- ing reinforcemen t learning allo cators and LLM-based sen timent signals, without altering downstream execution semantics. FinRL-X provides an extensible foundation for repro ducible, end-to-end quantitativ e trading re- searc h and deplo yment. The official FinRL-X implementation is av ailable at h ttps://github.com/AI4Finance-F oundation/FinRL-T rading. Keyw ords: Quan titative T rading Systems · Deep Reinforcement Learn- ing · Financial Portfolio Optimization · Systematic T rading. 1 In tro duction Quan titative trading research has rapidly progressed in recen t y ears, pro ducing increasingly sophisticated signal mo dels, p ortfolio construction techniques, and learning-based trading agents [ 3 , 23 , 22 , 33 , 10 ]. Ho w ever, many research prototypes remain difficult to repro duce and deploy . Practical trading systems must address broader engineering challenges, including data reliability , in terface consistency , execution realism, and system robustness. Existing open-source framew orks t ypically address isolated stages of the trading pip eline. Recen t LLM-based approac hes, such as Blo ombergGPT [ 27 ], FinGPT [ 29 , 25 , 13 ], and FinRob ot [ 31 , 34 ], improv e financial text understanding and signal generation, but remain fo cused on modeling rather than end-to-end system integration. Researc h-oriented platforms such as FinRL [ 14 , 30 ] and T en- sorT rade [ 24 ] enable rapid exp erimentation with reinforcemen t learning agen ts but primarily fo cus on training environmen ts rather than deploymen t-consisten t arc hitectures. Engineering-orien ted libraries including Backtrader [ 4 ], Zipline [ 21 ], bt [ 17 ], vectorbt [ 19 ], Qlib [ 32 ], and T radingAgents [ 28 ] provide robust bac ktest- ing and ev aluation utilities, yet are generally used as standalone comp onen ts. In ⋆ Corresp onding author: contact@ai4finance.org 2 H. Y ang et al. practice, users m ust still integrate data ingestion, enforce consistent strategy inter- faces (e.g., selection–allo cation–timing–risk), and implement brok er connectivity and monitoring to obtain a repro ducible end-to-end system. The transition from research bac ktesting to live deploymen t introduces system- lev el distortions that are rarely formalized in academic trading framew orks. W e categorize these in to t wo primary deploymen t gaps. (1) Bac ktesting-to-pap er-trading gap. Offline backtesting environmen ts rely on simplified execution assumptions that div erge from brok er-mediated trading environmen ts. Common distortions include o versimplified execution logic (instan t fills at bar prices), unrealistic transaction cost modeling, absence of mark et impact simulation, lac k of order b o ok dynamics, survivorship bias, and data feed inconsistencies [ 5 , 9 ]. These issues create a mismatc h b et ween sim ulated realit y and brokered reality , leading to inflated p erformance metrics and unstable b eha vior once connected to a trading API. (2) P ap er-trading-to-liv e-trading gap. Ev en when strategies pass broker- in tegrated pap er trading, additional execution and op erational risks emerge in live mark ets. These include realistic fill uncertaint y (latency , partial fills, slippage), liquidit y and queue position effects, API behavior differences, infrastructure fragilit y (server crashes, disconnections), state recov ery failures, real capital constrain ts (margin rules, settlement timing), and extreme systemic even ts such as flash crashes or fault y co de deplo ymen ts [ 6 , 2 ]. These factors in tro duce execution distortion and op erational risk that are typically absent in academic simulations. These tw o gaps reveal that repro ducible mo deling alone is insufficient. What is required is a deploymen t-aw are system arc hitecture that preserves interface consistency across research, bac ktesting, broker simulation, and liv e execution, while explicitly accoun ting for execution realism and op erational resilience. T o address these challenges, we in tro duce FinRL-X , a mo dular, deploymen t- orien ted trading system built around a unified w eight-cen tric interface. It struc- tures the w orkflow into four lay ers: data, strategy , bac ktesting, and broker- in tegrated execution, where the strategy lay er comp oses mo dular decision compo- nen ts. By preserving consistent weigh t semantics across lay ers, FinRL-X reduces discrepancies b et ween offline ev aluation and liv e deplo yment. Our contributions are summarized as follows: – Deplo yment-a w are system arc hitecture. W e formalize and address the bac ktesting-to-deploymen t gaps through a la yered, w eight-cen tric design that unifies research and execution in terfaces. – Comp osable trading abstraction. W e structure trading w orkflows as mo dular transformations (selection–allo cation–timing–risk), enabling seam- less integration of rule-based and learning-based strategies without altering do wnstream comp onen ts. – Execution-consisten t ev aluation. W e provide standardized bac ktesting, brok er-integrated execution (e.g., Alpaca [ 1 ]), and monitoring mechanisms to ensure consistency b et w een sim ulation and deploymen t. – Op en-source release. W e release FinRL-X as an extensible library with repro ducible workflo ws and runnable examples to facilitate both research and deploymen t exp erimen tation. FinRL-X: An AI-Native Mo dular Infrastructure for Quantitativ e T rading 3 Fig. 1. FinRL-X F ramework: A lay ered, end-to-end trading arc hitecture that unifies data pro cessing, strategy construction, bac ktesting, and brok er-integrated execution within a consisten t pipeline, illustrating the w orkflow from data ingestion to live execution. 2 Related W ork Op en-source quan titative trading platforms are typically stage-sp ecific: frame- w orks such as Zipline [ 21 ], Bac ktrader [ 4 ], bt [ 17 ], and v ectorbt [ 19 ] focus on bac ktesting, while AI-oriented systems including Qlib [ 32 ], T radingAgents [ 28 ], and T ensorT rade [ 24 ] emphasize offline ML/RL researc h. QuantConnect Lean [ 20 ] offers brok er-integrated trading, but is not structured as a mod ular research- orien ted systems architecture. In contrast, FinRL-X adopts a deploymen t-aw are, w eight-cen tric design that unifies data, strategy , ev aluation, and execution within a single in terface (T able 1). T able 1. Comparison of FinRL-X with representativ e op en-source quantitativ e trading platforms. F eature FinRL-X Qlib T radingAgents Zipline/Backtrader QuantConnect Lean Primary Orientation End-to-End System ML Research Agen t-Based T rading Backtesting End-to-End Platform Broker Integration Y es No No No Y es Deploymen t-Consistent Interface Y es No No No Partial Reinforcement Learning Supp ort Y es Limited Y es No P artial Modular Strategy Pip eline Y es No No No Partial Portfolio-Lev el Risk Overlay Y es No No No Partial Open Source License Apache 2.0 MIT Apache 2.0 Apache 2.0 Apache 2.0 3 F ramework FinRL-X is a mo dular, deploymen t-oriented trading platform that structures the quan titative trading workflo w into four lay ers—data, strategy , bac ktesting, and execution—as sho wn in Figure 1. Its design goal is to reduce the engineering o verhead of building end-to-end systems by enforcing clear module b oundaries and stable interfaces, thereb y enabling repro ducible offline ev aluation and seamless transition to pap er or live trading. 4 H. Y ang et al. 3.1 Data Lay er The data la yer pro vides a unified pip eline for ingesting and normalizing structured (mark et, fundamental, macro) and unstructured (news) inputs, with primary in tegration to FMP [ 8 ] and extensible provider supp ort. All sources are aligned to a shared trading calendar to enable consistent rebalancing and ev aluation, while news text is transformed into structured sentimen t signals via LLM-based prepro cessing for in tegration in to the w eigh t-centric strategy pip eline. Repro- ducibilit y is ensured through p ersisten t storage of raw snapshots and pro cessed features, reducing discrepancies b et ween offline exp erimen ts and deploymen t. 3.2 Strategy Lay er The strategy lay er adopts a weight-c entric arc hitectural principle. In FinRL-X, the target p ortfolio weigh t vector w t ∈ R n is treated as the sole interface contract b et w een strategy logic and downstream ev aluation or execution mo dules. Rather than emitting trading signals, p osition deltas, or broker-specific orders, every strategy comp onen t pro duces a target allo cation vector that sp ecifies the desired capital fraction assigned to eac h asset at time t . F ormally , let U t denote the tradable asset universe at time t . The strategy lay er defines a sequence of contract-preserving transformations that map time-aligned inputs into a feasible p ortfolio w eight v ector: w t = R t T t ( A t ( S t ( X ≤ t ))) , where S denotes sto c k selection, A p ortfolio allo cation, T timing adjustment, and R p ortfolio-lev el risk o verla y . This weigh t-centric abstraction provides three system-level adv an tages: (i) it decouples strategy construction from broker implementation details; (ii) it enables comp osable transformations across heterogeneous rule-based and learning-based mo dules; and (iii) it ensures deploymen t consistency , as b oth bac ktesting and liv e execution consume the same w eight represen tation. Algorithm 1 W eight-Cen tric T rading Pip eline Require: Data streams D , F , T , R ; rebalancing times { t 1 , . . . , t n } 1: Initialize portfolio v alue P 0 2: for eac h t do 3: C t ← Select ( F ≤ t , U t ) 4: w base t ← Alloca te ( C t ) 5: w timing t ← TimeAdjust ( w base t , T ≤ t ) 6: w t ← RiskOverla y ( w timing t , R ≤ t ) 7: Observ e realized returns r t 8: P t ← P t − 1 (1 + w ⊤ t r t ) 9: end for 10: return P n FinRL-X: An AI-Native Mo dular Infrastructure for Quantitativ e T rading 5 Mo dular Comp onents. The pip eline consists of four contract-preserving transfor- mations. Sto c k Selection constructs a candidate set C t ⊆ U t using fundamentals or learned scoring mo dels under strict no-lo ok ahead seman tics. P ortfolio Allo- cation maps C t to feasible base weigh ts w base t (e.g., equal-w eight, mean–v ariance, minim um-v ariance, or DRL-based p olicies) under consistent normalization and lev erage constraints. Timing A djustment transforms w base t in to w timing t using trend-based or learning-based signals without altering the weigh t interface. Risk Ov erlay applies v olatility-a war e exp osure scaling (e.g., VIX-based) at the p ort- folio level, adjusting aggregate exp osure while preserving relativ e allo cations to pro duce final executable w eights w t . 3.3 Backtesting and Execution La yer FinRL-X reuses a unified weigh t in terface for b oth offline backtesting (via bt [ 17 ]) and live brok er execution, ensuring consistent portfolio seman tics across ev alu- ation and deploymen t. The executor con v erts target weigh ts in to orders with configurable safeguards and logs realized allo cations for p ost-trade consistency c hecks. 3.4 Deploymen t-A w are Design Bey ond modeling accuracy , quantitativ e trading systems face systematic dis- tortions when transitioning from research backtesting to live deploymen t. Let S resear ch , S paper , and S liv e denote system behavior under offline sim ulation, brok er-integrated pap er trading, and liv e execution, resp ectiv ely . In practice, S resear ch = S paper = S liv e , due to execution simplifications, infrastructure instabilit y , and op erational con- strain ts. FinRL-X narrows these deploymen t gaps architecturally . It reduces the bac ktesting-to-pap er gap by enforcing consistent execution semantics across en vironments: strategies output broker-agnostic w eight vectors, while simulation incorp orates transaction costs, slippage mo deling, and even t-driv en order han- dling aligned with broker APIs. Data ingestion follows a unified sc hema to ensure consistency b et ween historical repla y and live feeds, minimizing discrepancies caused by data formatting or synchronization differences. T o mitigate the pap er-to-liv e gap, FinRL-X introduces deplo yment-orien ted safeguards at the execution lay er. These include state persistence for crash reco very , structured logging for p ost-trade reconciliation, and fault-tolerant broker in teraction mec hanisms that handle API interruptions and execution anomalies. Imp ortan tly , these mec hanisms op erate indep enden tly of strategy logic, preserving mo dularit y while impro ving op erational resilience. By maintaining a unified w eight interface across researc h, simulation, and execution lay ers, and by explicitly engineering for execution realism and robust- ness, FinRL-X reduces behavioral divergence b et w een offline ev aluation and live deplo yment. 6 H. Y ang et al. 4 Ev aluation W e ev aluate FinRL-X from a system-lev el p erspective, emphasizing reproducibil- it y , mo dular comp osabilit y , and deploymen t consistency in addition to return p erformance. Experiments compare allo cation paradigms, timing mechanisms, and risk ov erla ys under a unified backtesting proto col with standardized metrics. 4.1 Exp erimen tal Setup and Metrics Exp erimen ts are conducted on liquid U.S. equities and ETF s, with SPY and QQQ as b enc hmark indices. The historical bac ktesting horizon spans January 7, 2018 to Octob er 24, 2025 under prop ortional transaction costs of 10 bps p er side. A broker-in tegrated pap er-trading ev aluation (e.g., Alpaca [ 1 ]) is conducted from Octob er 26, 2025 to Marc h 12, 2026 to assess deploymen t b eha vior. All decisions at time t rely strictly on information a v ailable up to t , and learning-based mo dels are ev aluated using rolling out-of-sample v alidation. Ev aluation metrics. Return (cumulativ e, ann ualized), risk (volatilit y , max- im um drawdo wn), risk-adjusted performance (Sharp e, Sortino, Calmar), and deplo yabilit y (p ortfolio turnov er). 4.2 Baselines W e compare FinRL-X with represen tative baselines from four categories: – Classical allo cation. Equal-weigh t p ortfolios serve as a reference baseline. V ariance-based portfolio construction methods are also included, namely Mean–V ariance optimization [15] and Minim um-V ariance allo cation [7]. – Learning-based allo cation. Deep reinforcemen t learning (DRL) allo cators generate contin uous p ortfolio weigh ts through sequen tial decision-making [ 16 , 11 ]. Mo del selection is performed using rolling out-of-sample v alidation. – Timing strategies. T rend-following approac hes including Time-Series Mo- men tum (TSMOM) [ 18 ] and Kaufman Adaptiv e Moving A v erage (KAMA) [ 12 ] pro vide rule-based market exp osure con trol. – Risk o verla ys. A VIX-based volatilit y scaling mechanism [ 26 ] adjusts p ort- folio exp osure as a mo dular p ost-allocation risk management o verla y . 4.3 Portfolio Performance and Ablation Analysis FinRL-X is designed to supp ort comp osable strategy mo dules under identical execution semantics. W e v alidate this mo dularit y through controlled ablations that isolate timing and o verla y effects while keeping the remaining pip eline unc hanged. Timing ablation (DRL). Figure 2 compares DRL allo cation with and without timing against the SPY b enc hmark. The timing-enhanced v arian t ac hiev es higher cumulativ e returns and low er drawdo wns, demonstrating that timing can b e in tegrated without mo difying backtest or execution interfaces. FinRL-X: An AI-Native Mo dular Infrastructure for Quantitativ e T rading 7 T able 2. P erformance and risk metrics across benchmarks Strategy Cum. Return Ann. Return Ann. V ol Sharpe Sortino Calmar Max DD DD Duration SPY 2.63 0.14 0.17 0.84 0.76 0.60 -0.23 23 QQQ 3.61 0.19 0.20 0.95 0.93 0.60 -0.33 23 KAMA 2.40 0.12 0.21 0.57 0.60 0.43 -0.29 23 Mean V ar (No Timing) 2.19 0.11 0.22 0.53 0.56 0.37 -0.31 41 Mean V ar (With Timing) 2.59 0.14 0.19 0.74 0.76 0.52 -0.27 38 Min V ar (No Timing) 2.49 0.13 0.21 0.63 0.68 0.47 -0.28 25 Min V ar (With Timing) 2.97 0.16 0.18 0.90 0.94 0.60 -0.27 23 Equal (No Timing) 2.11 0.11 0.20 0.54 0.53 0.40 -0.27 27 Equal (With Timing) 2.64 0.14 0.16 0.87 0.85 0.62 -0.23 23 DRL (No Timing) 2.33 0.12 0.22 0.55 0.54 0.40 -0.31 18 DRL (With Timing) 3.03 0.17 0.18 0.89 0.87 0.61 -0.27 18 Cross-strategy ablation. T able 2 rep orts standardized return and risk metrics across represen tative strategies. Across Mean V ar, Min V ar, Equal, and DRL configurations, timing-enabled v arian ts consistently improv e risk-adjusted p erformance and mo derate drawdo wn relative to their base counterparts. 2018 2019 2020 2021 2022 2023 2024 2025 2026 $1.0M $1.5M $2.0M $2.5M $3.0M $3.5M $4.0M Cumulative P ortfolio V alue ($ Millions) DRL Timing Backtest: W ith vs. W ithout Timing (Mar 2018 Oct 2025) DRL + Timing Min- V ar + Timing Equal- Wt + Timing Mean- V ar + Timing QQQ SPY K AMA DRL (No Timing) Min- V ar (No Timing) Equal- Wt (No Timing) Mean- V ar (No Timing) CO VID -19 Crash 2022 Bear Market QQQ: $3.62M DRL + Timing: $3.03M Min- V ar + Timing: $2.97M Equal- Wt + Timing: $2.64M SPY : $2.63M Mean- V ar + Timing: $2.59M Min- V ar (No Timing): $2.49M K AMA: $2.40M DRL (No Timing): $2.33M Mean- V ar (No Timing): $2.19M Equal- Wt (No Timing): $2.11M Fig. 2. Ablation study of DRL-based allo cation with and without timing adjustmen t. Incorp orating the timing mo dule improv es cumulativ e performance and mo derates dra wdown relative to b oth the base DRL strategy and the SPY benchmark. 4.4 Use Case Demonstrations T o illustrate end-to-end system flexibility , we present representativ e use cases that isolate the con tribution of individual comp onen ts while k eeping the same w orkflow (data → strategy → bac ktest → optional execution) unchanged. 8 H. Y ang et al. T able 3. P erformance comparison of representativ e use cases and benchmark indices (2018–2025). Metric Rolling Strategy Adaptiv e Rotation QQQ SPY Cum ulative Return 5.98 4.80 4.02 2.80 Ann ualized Return (%) 25.85 22.32 19.56 14.14 Ann ualized V olatility (%) 27.85 20.30 24.20 19.61 Sharp e Ratio 0.93 1.10 0.81 0.72 Maxim um Drawdo wn (%) -38.95 -21.46 -35.12 -33.72 Calmar Ratio 0.66 1.04 0.56 0.42 Win Rate (%) 54.36 54.77 56.25 55.28 Use Case 1: Portfolio Al lo c ation Par adigms W e ev aluate heterogeneous p ortfolio allo cation mechanisms under a unified w eigh t-centric interface, including learning- based DRL allo cation, classical optimization-based metho ds (Mean–V ariance, Minim um-V ariance), equal-w eight baselines, and signal-driven timing strategies suc h as KAMA op erating as standalone weigh ting pathw a ys. By enforcing iden- tical data and execution seman tics, FinRL-X enables fair comparison across fundamen tally different allocation paradigms without architectural mo dification. Bac ktesting results for this use case are consolidated in Figure 2 and T able 2. 2018 2019 2020 2021 2022 2023 2024 2025 2026 $1.0M $2.0M $3.0M $4.0M $5.0M $6.0M Cumulative P ortfolio V alue ($ Millions) Strategy Backtest: Cumulative Returns (Jan 2018 Oct 2025) Rolling Selection Adaptive Rotation QQQ SPY CO VID -19 Crash 2022 Bear Market $5.98M $4.80M $4.02M $2.80M Fig. 3. Bac ktest p erformance comparison across represen tative strategy configurations under the unified w eight-cen tric protocol (Jan uary 7, 2018 – October 24, 2025). Results illustrate cum ulative p ortfolio tra jectories relative to b enc hmark references. Use Case 2: R ol ling Sto ck Sele ction This use case tests the rolling sto c k selection mo dule, where the universe is up dated up on new quarterly financial rep orts. W e use all comp onent sto c ks of the NASDA Q 100 index as candidates and select the top 25% to construct a p ortfolio with DRL-based allo cation. Figure 3 (line FinRL-X: An AI-Native Mo dular Infrastructure for Quantitativ e T rading 9 Rolling Selection ) shows cum ulative returns. T able 3 (Rolling Strategy) rep orts p erformance relativ e to SPY and QQQ. Use Case 3: A daptive Multi-Asset R otation This use case presents an adaptive m ulti-asset rotation strategy designed to ac hieve stable excess returns relative to QQQ across regimes. Assets are group ed into Growth, Real Assets, and Defensive buc kets, with at most tw o active groups selected p er weekly rebalance. Group selection is driv en b y Information Ratio relativ e to QQQ, while in tra-group allo cation uses residual momen tum with robust exception handling. Regime indicators are used for risk gating rather than alpha generation. Figure 3 (line A daptive Rotation ) shows sustained outp erformance with impro ved dra wdown con trol across cycles. T able 3 (Adaptiv e Rotation) rep orts risk-adjusted metrics and drawdo wn improv ements relativ e to SPY and QQQ. 4.5 Paper T rading and Deploymen t V alidation Nov 2025 Dec 2025 Jan 2026 F eb 2026 Mar 2026 $0.95M $1.00M $1.05M $1.10M $1.15M $1.20M $1.25M $1.30M $1.35M Cumulative P ortfolio V alue ($ Millions) P aper T rading: Cumulative Returns (Oct 2025 Mar 2026) P ortfolio Equity QQQ SPY $1.20M $0.95M $0.97M Precious Metals & Mining Stocks R ally The Iran-related Conflict Geopolitical Shock Fig. 4. Paper trading performance relative to benchmark indices (October 26, 2025 – Marc h 12, 2026), demonstrating deplo yment-consisten t execution under daily rebalanc- ing. P ap er trading as deplo yment-consistency v alidation. T o bridge offline ev aluation and liv e deplo yment, we execute an ensemble strategy com bining Rolling Selection and A daptive Rotation in an Alpaca pap er trading en vironment from Octob er 2025 to Marc h 2026 under daily rebalancing. While the ev aluation horizon is limited, the results demonstrate stable deplo ymen t behavior and consisten t execution under real broker conditions. Sp ecifically , the exp erimen t serv es to v alidate op erational robustness and consistency b et ween offline p ortfolio targets and broker-lev el execution. Figure 4 and T able 4 presen t the resulting equit y curv e and summary p erformance statistics. 10 H. Y ang et al. T able 4. P erformance comparison betw een pap er trading and b enc hmark indices (Oct 26, 2025–Mar 12, 2026, Daily T urno ver). Metric Strategy SPY QQQ Cum ulative Return 1.20 0.97 0.95 T otal Return (%) 19.76 -2.51 -4.79 Ann ualized Return (%) 62.16 -6.60 -12.32 Ann ualized V olatility (%) 31.75 11.96 16.79 Sharp e Ratio 1.96 -0.55 -0.73 Maxim um Drawdo wn (%) -12.22 -5.35 -7.88 Calmar Ratio 5.09 -1.23 -1.56 Win Rate (%) 64.89 52.13 54.02 In addition to return metrics, we trac k de plo ymen t-oriented indicators such as order rejection rate, execution guardrail triggers, and p ortfolio w eight tracking error b et ween target and realized allo cations. These indicators remain consisten tly lo w throughout the pap er trading p eriod, suggesting stable execution behavior and high fidelit y b et w een target and realized p ortfolios. Oct 2025 Nov 2025 Dec 2025 Jan 2026 F eb 2026 Mar 2026 0% 20% 40% 60% 80% 100% P ortfolio Allocation (%) Dynamic Sector Rotation P ortfolio Allocation Over Time 85% 15% 55% 25% 20% 53% 23% 24% 18% 42% 39% 78% 22% 54% 27% 18% T echnology Mining Stocks Precious Metals ETFs Other Rotation Reversion Diversify Fig. 5. P ortfolio allocation tra jectory under the unified weigh t-based execution frame- w ork during pap er trading. The figure illustrates time-v arying exp osure adjustments across asset groups, demonstrating mo dular allocation outputs that are directly exe- cutable without architectural changes. P ap er T rading Analysis T o ev aluate deploymen t consistency b ey ond offline bac ktesting, w e conducted a six-month paper trading session from Octob er 26, 2025 to Marc h 12, 2026 using the ensem ble configuration under daily rebalancing. As shown in Figure 4, the strategy ac hieved a total return of +19.76% , outp erforming both SPY and QQQ ov er the same perio d. Given the limited horizon, these results are not intended to establish statistically significant alpha. Rather, the exp erimen t v alidates the end-to-end execution pip eline, including p ortfolio generation, brok er connectivity , order routing, execution monitoring, and p ost-trade reconciliation under live-lik e conditions. FinRL-X: An AI-Native Mo dular Infrastructure for Quantitativ e T rading 11 Alloc ation T r aje ctory Under Unifie d Exe cution Interfac e Figure 5 illustrates the time-v arying p ortfolio w eight allocations generated b y the strategy during the pap er trading windo w. Rather than emphasizing sector-level p erformance attribution, the figure highlights how the allocation mo dule produces dynamic w eight vectors that are transmitted unchanged through the unified w eight-based execution interface. The observ ed allo cation shifts reflect regime-a ware adjustments driv en b y relativ e momen tum and risk signals. Imp ortan tly , no arc hitectural mo dification w as required when transitioning from offline backtesting to broker-lev el execu- tion, demonstrating structural consistency b et ween research and deploymen t en vironments. Str ess Event as R isk-Mo dule V alidation The pap er-trading window also includes an adv erse episode: the p ortfolio experienced a p eak-to-trough dra wdown of appro ximately 12.2% following an extreme mov e in a lev eraged instrument. W e treat this as a deplo yment-relev ant stress case rather than a p erformance headline, highligh ting the nonlinear risk of lev eraged pro ducts and motiv ating safeguards suc h as volatilit y-a ware scaling and instrument-specific exp osure caps. Because execution is driv en by a unified weigh t interface, the same p ost-trade accoun ting and attribution pip eline applies without mo difying strategy logic, reinforcing the mo dular and diagnosable design of FinRL-X. 5 Conclusions FinRL-X is a deplo yment-consisten t, mo dular trading system that unifies data pro cessing, strategy composition, ev aluation, and brok er execution within a single arc hitecture. By adopting a weigh t-cen tric interface, the framework enforces con- sisten t decision semantics across research, backtesting, and live trading, reducing discrepancies b et ween offline ev aluation and real-w orld deplo yment. The mo dular design supp orts flexible integration of heterogeneous strategies while preserving repro ducibilit y and comp osabilit y . Empirical ev aluation, includ- ing broker-in tegrated pap er trading, demonstrates stable execution b eha vior under realistic conditions. F uture work will extend FinRL-X tow ard broader asset classes and more adv anced execution-aw are strategies for scalable real-w orld deplo yment. A c kno wledgements This work is developed and maintained under the AI4Finance F oundation op en- source ecosystem. The AI4Finance F oundation 1 w as founded in 2017 at Colum bia Univ ersity . Some authors con tributed to this work while also enrolled as students at Columbia Universit y . FinRL and the FinRL logo are trademarks of FinRL LLC and are used with p ermission. 1 https://ai4finance.org 12 H. Y ang et al. References 1. Alpaca. Alpaca api do cumen tation: P ap er trading. https://docs.alpaca.market s/docs/paper- trading , 2025. 2. Alpaca Mark ets. Paper trading vs. live trading: A data-bac ked guide on when to start trading real money . https://alpaca.markets/learn/paper- trading- vs- l ive- tra ding - a- d ata- back ed- gu ide- on- w hen- t o- sta rt- t radi ng- r eal- money , 2025. Accessed: 2026-02. 3. Andrew Ang. F actor inv esting. Columbia Business Scho ol R ese ar ch Pap er , (13-42), 2013. 4. Bac ktrader. Bac ktrader: A feature-rich p ython framework for backtesting and trading. https://www.backtrader.com/ , 2015. 5. Da vid Bailey , Jonathan Borw ein, Marcos Lopez de Prado, and Qiji Jim Zh u. The probabilit y of backtest o verfitting. The Journal of Computational Financ e , 20(4):39– 69, 2017. 6. Álv aro Cartea, Sebastian Jaim ungal, and José P enalv a. Algorithmic and high- fr e quency tr ading . Cambridge Universit y Press, 2015. 7. Roger Clark e, Harindra de Silv a, and Stev en Thorley . Minimum-v ariance p ortfolio comp osition. The Journal of Portfolio Management , 33(2):10–24, 2006. 8. Financial Modeling Prep. Financial mo deling prep. https://site.financialmode lingprep.com/ , 2026. Accessed: 2026-01-04. 9. Y ash Ganar. Wh y backtesting environmen ts differ from live markets: T ec hnical factors explained. https:/ /algobulls.c om/blog/alg o- trading/ba cktesting- t echnical- factor , 2026. Accessed: 2026-02. 10. Xuew en Han, Neng W ang, Shangkun Che, Hongyang Y ang, Kunp eng Zhang, and Sean Xin Xu. Enhancing in vestmen t analysis: Optimizing ai-agen t collaboration in financial researc h. In ICAIF 2024: Pr o c e e dings of the 5th ACM International Confer enc e on AI in Financ e , pages 538–546, 2024. 11. Zhengy ao Jiang, Dixing Xu, and Jinjun Liang. A deep reinforcemen t learning framew ork for financial p ortfolio management. arXiv pr eprint arXiv:1706.10059 , 2017. 12. Perry J. Kaufman. T r ading Sys tems and Metho ds . Wiley , 1998. 13. Yixuan Liang, Y uncong Liu, Neng W ang, Hongyang Y ang, Boyu Zhang, and Christina Dan W ang. Fingpt: enhancing sen timent-based sto c k mo vemen t predic- tion with dissemination-aw are an d context-enric hed llms. AAAI 2025 W orkshop Go o dData , 2025. 14. Xiao-Y ang Liu, Hongy ang Y ang, Qian Chen, Runjia Zhang, Liuqing Y ang, Bo wen Xiao, and Christina Dan W ang. Finrl: A deep reinforcement learning library for automated stock trading in quantitativ e finance. arXiv pr eprint arXiv:2011.09607 , 2020. 15. Harry Marko witz. Portfolio selection. The Journal of Financ e , 7(1):77–91, 1952. 16. V olo dym yr Mnih, Kora y Kavuk cuoglu, David Silver, Andrei A Rusu, Joel V eness, Marc G Bellemare, Alex Gra ves, Martin Riedmiller, Andreas K Fidjeland, Georg Ostro vski, et al. Human-level control through deep reinforcement learning. Natur e , 518(7540):529–533, 2015. 17. Philipp e Morissette. bt: Flexible bac ktesting for python. https://github.com/p morissette/bt , 2014. 18. T obias J Mosko witz, Y ao Hua Ooi, and Lasse Heje Pedersen. Time series momentum. Journal of financial e c onomics , 104(2):228–250, 2012. FinRL-X: An AI-Native Mo dular Infrastructure for Quantitativ e T rading 13 19. P olako wo. vectorbt: P ortfolio optimization and backtesting on pandas/nump y . https://github.com/polakowo/vectorbt , 2020. 20. Quan tConnect. Lean algorithmic trading engine. https://github.com/QuantConn ect/Lean , 2024. 21. Quan topian. Zipline: A pythonic algorithmic trading library . https://github.com /quantopian/zipline , 2014. 22. F rancesco Rundo, F rancesca T ren ta, Agatino Luigi Di Stallo, and Sebastiano Battiato. Machine learning for quantitativ e finance applications: A survey . Applie d Scienc es , 9(24):5574, 2019. 23. San tosh Kumar Sah u, Anil Mokhade, and Neera j Dhanra j Bokde. An o verview of mac hine learning, deep learning, and reinforcement learning-based techniques in quan titative finance: recent progress and c hallenges. Applie d Scienc es , 13(3):1956, 2023. 24. tensortrade-org. T ensortrade: An op en source p ython framework for trading algo- rithms using reinforcement learning. https://github.com/tensortrade- org/ten sortrade , 2019. 25. Neng W ang, Hongyang Y ang, and Christina Dan W ang. Fingpt: Instruction tuning b enc hmark for op en-source large language mo dels in financial datasets. NeurIPS W orkshop on Instruction T uning and Instruction F ol lowing , 2023. 26. Rob ert E Whaley . The inv estor fear gauge. The Journal of Portfolio Management , 26(3):12–17, 2000. 27. Shijie W u, Ozan Irso y , Steven Lu, V adim Dabrav olski, Mark Dredze, Sebas- tian Gehrmann, Prabhanjan Kambadur, David Rosenberg, and Gideon Mann. Blo om berggpt: A large language mo del for finance. arXiv pr eprint arXiv:2303.17564 , 2023. 28. Yijia Xiao, Edward Sun, Di Luo, and W ei W ang. T radingagents: Multi-agents llm financial trading framework. arXiv preprint , 2024. 29. Hongy ang Y ang, Xiao-Y ang Liu, and Christina Dan W ang. Fingpt: Open-source financial large language mo dels. arXiv pr eprint arXiv:2306.06031 , 2023. First official FinGPT pap er; FinLLM W orkshop at IJCAI 2023. 30. Hongy ang Y ang, Xiao-Y ang Liu, Shan Zhong, and An war W alid. Deep reinforcemen t learning for automated sto c k trading: An ensem ble strategy . In Pr o c e e dings of the first ACM international c onfer enc e on AI in financ e , pages 1–8, 2020. 31. Hongy ang Y ang, Bo yu Zhang, Neng W ang, Cheng Guo, Xiaoli Zhang, Likun Lin, Junlin W ang, Tianyu Zhou, Mao Guan, Runjia Zhang, et al. Finrob ot: An open- source ai agen t platform for financial applications using large language mo dels. arXiv pr eprint arXiv:2405.14767 , 2024. 32. Xiao Y ang, W eiqing Liu, Dong Zhou, Jiang Bian, and Tie-Y an Liu. Qlib: An ai- orien ted quantitativ e in vestmen t platform, 2020. arXiv preprint 33. Bo yu Zhang, Hongyang Y ang, tian yu Zhou, Ali Babar, and Xiao-Y ang Liu. En- hancing financial sentimen t analysis via retriev al augmented large language mo dels. ACM International Confer enc e on AI in Financ e (ICAIF) , 2023. 34. Tian yu Zhou, Pinqiao W ang, Yilin W u, and Hongyang Y ang. Finrob ot: AI agen t for equit y research and v aluation with large language mo dels. In ICAIF 2024: The 1st W orkshop on L ar ge L anguage Mo dels and Gener ative AI for Financ e , 2024.
Original Paper
Loading high-quality paper...
Comments & Academic Discussion
Loading comments...
Leave a Comment