Can Blindfolded LLMs Still Trade? An Anonymization-First Framework for Portfolio Optimization
For LLM trading agents to be genuinely trustworthy, they must demonstrate understanding of market dynamics rather than exploitation of memorized ticker associations. Building responsible multi-agent systems demands rigorous signal validation: proving…
Authors: Joohyoung Jeon, Hongchul Lee
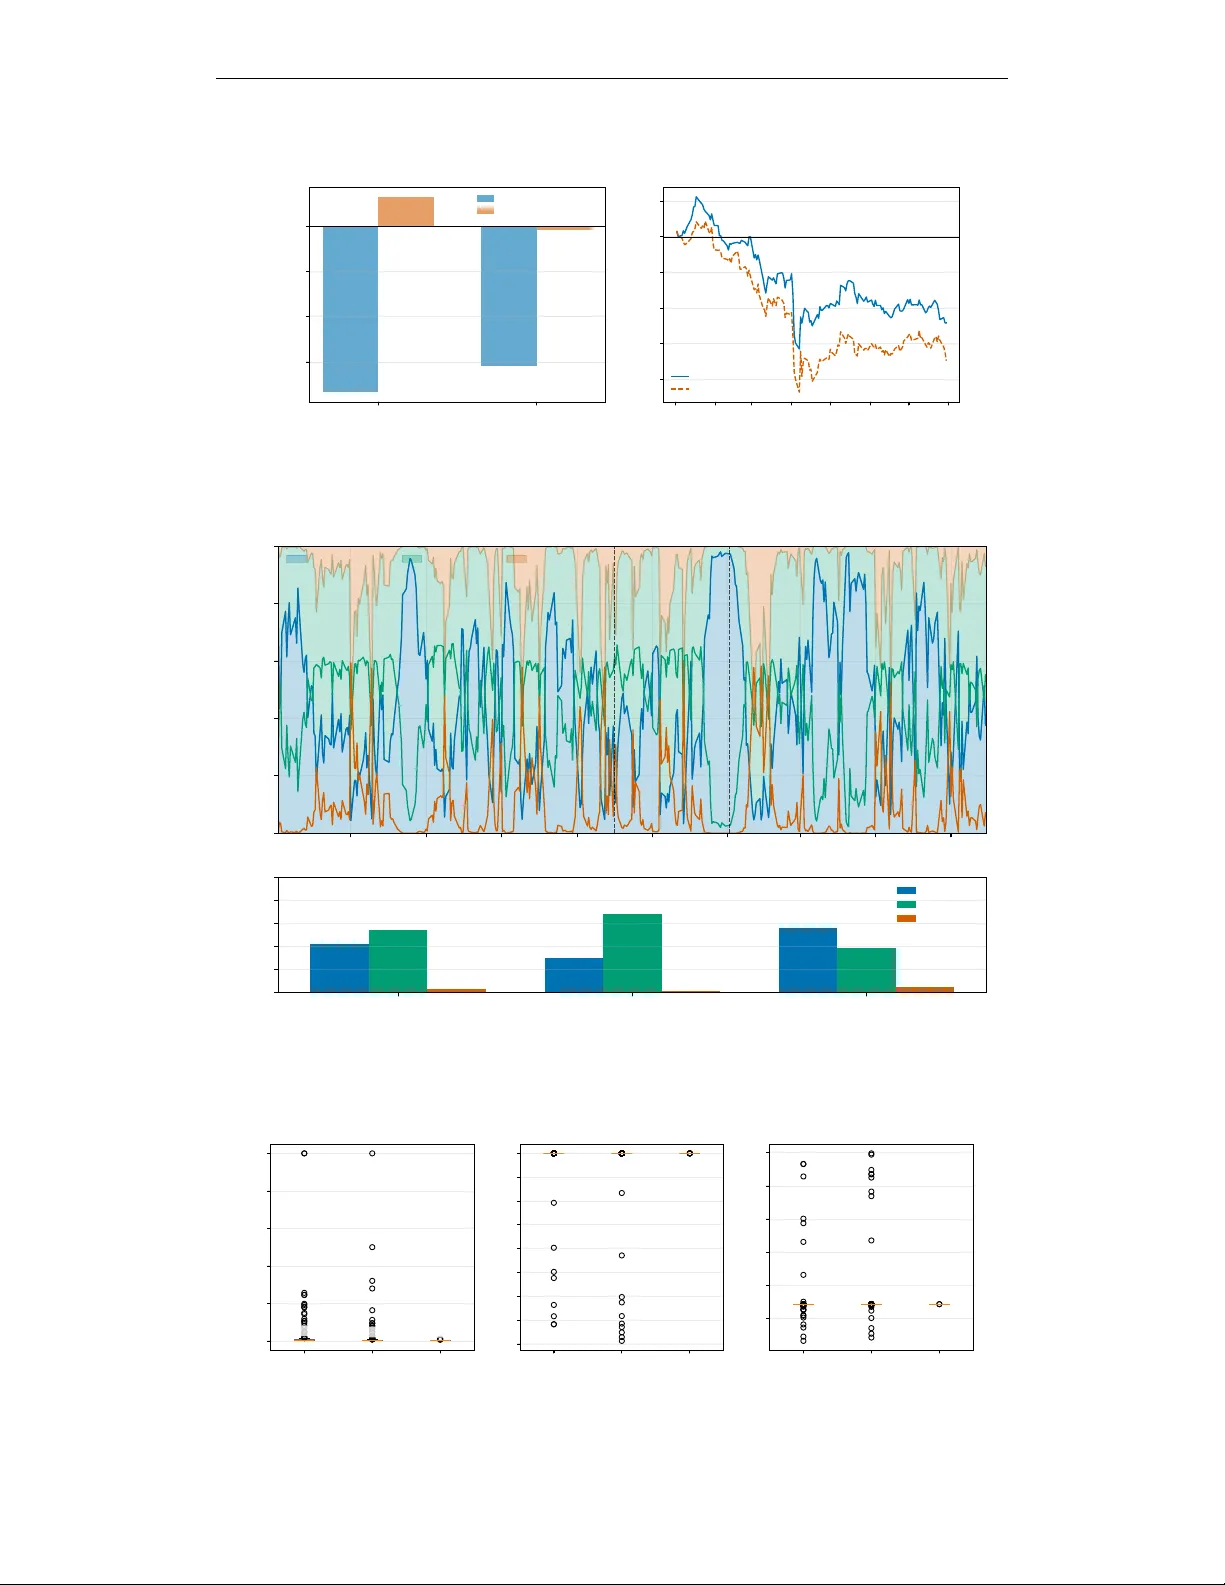
Accepted at the ICLR 2026 W orkshop on Advances in Financial AI (FinAI) C A N B L I N D F O L D E D L L M S S T I L L T R A D E ? A N A N O N Y M I Z A T I O N - F I R S T F R A M E W O R K F O R P O RT - F O L I O O P T I M I Z A T I O N Jooh young Jeon K orea Univ ersity Mirae Asset Securities Hongchul Lee K orea Univ ersity A B S T R AC T For LLM trading agents to be genuinely trustworthy , they must demonstrate un- derstanding of market dynamics rather than exploitation of memorized ticker as- sociations. Building responsible multi-agent systems demands rigorous signal validation: proving that predictions reflect legitimate patterns, not pre-trained recall. W e address two sources of spurious performance: memorization bias from ticker-specific pre-training, and survivorship bias from flawed backtesting. Our approach is to blindfold the agents—anonymizing all identifiers—and verify whether meaningful signals persist. BlindT rade anonymizes tickers and company names, and four LLM agents output scores along with reasoning. W e construct a GNN graph from reasoning em- beddings and trade using PPO-DSR policy . On 2025 YTD (through 2025-08- 01), we achiev ed Sharpe 1 . 40 ± 0 . 22 across 20 seeds and validated signal legiti- macy through ne gativ e control experiments. T o assess robustness be yond a single OOS window , we additionally ev aluate an extended period (2024–2025), rev eal- ing market-re gime dependency: the policy excels in volatile conditions but sho ws reduced alpha in trending bull mark ets. 1 I N T RO D U C T I O N LLMs are increasingly applied to financial trading (RockAlpha T eam, 2025), yet Lee et al. (2025) rev ealed that LLMs exhibit pre-trained preferences for technology stocks and large-cap stocks, lead- ing to confirmation bias. This raises a fundamental question: are LLMs genuinely understanding markets, or merely memorizing patterns from training data containing phrases like “T esla stock surges”? The backtesting environment compounds this problem. Survi vorship bias (failed companies disap- pear from data, artificially inflating performance) and lookahead bias (treating tomorrow’ s ne ws as already known) produce results that f ail in real deployment. T o address these challenges, we propose BlindTrade, an anonymization-first LLM-GNN-RL frame- work. W e anonymize S&P 500 constituents daily , four specialized LLM agents evaluate stocks from different perspecti ves, results are aggregated through a GNN, and an RL policy determines the final portfolio. Contributions. (i) W e introduce an anonymization protocol that replaces tick ers and compan y- specific information (“ AAPL ” → “ST OCK 0026”) to block memorization. (ii) W e design a spe- cialized multi-agent system where four agents (Momentum, News-Event, Mean-Reversion, Risk- Regime) e valuate stocks independently and output reasoning explaining their assessment. (iii) W e * The findings and opinions expressed in this paper are those of the authors and do not represent the views of their affiliated institutions. Any remaining errors are the sole responsibility of the authors. 1 Accepted at the ICLR 2026 W orkshop on Advances in Financial AI (FinAI) propose a Semantic Graph Encoder (SemGA T) that constructs a graph using sector connections and reasoning embedding similarity , enabling inter -stock relationship learning under anonymization. (iv) W e perform rigorous signal v alidation through IC analysis and negati ve control experiments (random shuffling), verifying that LLM signals hav e real predictiv e po wer and are not leakage arti- facts. 2 R E L A T E D W O R K LLM T rading Agents. Recently , attempts to directly use LLMs for trading ha ve increased rapidly . FinGPT (Y ang et al., 2023) provides LoRA-based lightweight adaptation. FinMem (Y u et al., 2023) adds hierarchical memory for past market patterns. TradingAgents (Xiao et al., 2024) simulates a trading firm with multi-agent debates for decision-making. Howe ver , real-time e valuations re veal limitations. Liv eTradeBench (Y u et al., 2025) e valuated LLM agents in real-time en vironments, and models that e xcelled on static benchmarks actually performed worse in actual trading. AI-Trader (Fan et al., 2025) reaches a similar conclusion. In tests span- ning U.S. stocks, Chinese A-shares, and cryptocurrencies, agents without risk management perform poorly in practice. These studies suggest that LLMs can aid trading, yet it remains unclear why they are ef fectiv e. They do not distinguish whether the models learned real market patterns or just memorized from training data. W e address this problem through anonymization. Limitations of Financial LLMs. FinBER T (Araci, 2019) and BloombergGPT (W u et al., 2023) show tickers directly during training/ev aluation, making it impossible to distinguish memorization from true understanding. Recent surve ys (Lopez-Lira & T ang, 2023; Fu, 2025) raise the same con- cern. Surviv orship Bias and Lookahead Bias. Backtesting results are often vulnerable to surviv orship and lookahead biases (Elton et al., 1996; Bailey et al., 2014). W e address this by using only actual S&P 500 constituents at each point in time. GNNs for Finance. GNNs are effecti ve for learning stock relationships (Thakkar & Chaudhari, 2021; Feng et al., 2019), b ut most use fixed industry classification graphs. W e dynamically construct edges using semantic similarity of LLM reasoning embeddings, allowing us to learn relationships ev en in an anonymized state. Portf olio RL. Jiang et al. (2017) introduced end-to-end policy gradients, and Zhang et al. (2020) proposed regime-based approaches. Ho wever , most RL policies are black boxes. W e explicitly expose intent v ariables (defensi ve/neutral/aggressiv e) for interpretability . Counter-intuiti vely , our Defensiv e mode sho ws higher turnov er (2.9%/day) because, without cash allocation, the policy di- versifies across more stocks within the S&P 500 universe, requiring frequent rebalancing. Aggres- siv e mode concentrates on high-conviction positions and holds them for longer -term gains, resulting in minimal turnover (0.4%/day). Neutral mode shows moderate acti vity (1.8%/day). See Figure 5 for detailed intent-conditioned behavior analysis. 3 M E T H O D O L O G Y 3 . 1 O V E R A L L P I P E L I N E BlindT rade consists of 6 stages (see Figure 2 in Appendix): 1. Data anonymization : W e collect S&P 500 constituents daily and replace all tickers/com- pany names/subsidiary names/product names with anon ymous identifiers. 2. LLM featur e generation : F our specialized agents (Momentum, Ne ws-Event, Risk- Regime, Mean-Rev ersion) assign scores to each stock daily and output reasoning explain- ing “why they made their assessment. ” 2 Accepted at the ICLR 2026 W orkshop on Advances in Financial AI (FinAI) 3. IC validation : W e first check whether LLM outputs have real predictive power . W e com- pare RA W variables and LLM v ariables using Spearman rank IC. 4. SemGA T encoding : W e learn inter -stock relationships as a graph. Same-sector stocks are connected, and additional edges are formed based on reasoning embedding similarity . 5. RL policy : PPO determines portfolio weights. The policy internally decides risk posture (defensiv e/neutral/aggressiv e). 6. Backtest : W e ev aluate OOS performance with 10bps transaction costs. 3 . 2 D A TA A N D A N O N Y M I Z A T I O N W e collect S&P 500 constituents point-in-time . The stocks in S&P 500 on January 2, 2020 differ from those on August 1, 2025. Index constituents change ov er time as companies are delisted or added. Ignoring this creates surviv orship bias. W e use only stocks that were actually S&P 500 constituents on each date. Constituent information for each period is obtained via the EODHD API (EODHD APIs, 2024). The total period spans 5.5 years (2020-01-02 to 2025-08-01), covering 1,403 trading days. W e map tickers to synthetic identifiers (e.g., “ AAPL ” → “STOCK 0026”), and proper nouns like “ Apple”, “iPhone”, “Tim Cook” in news are replaced using Google Knowledge Graph API. W e do not claim this blocks all leakage, but it at least blocks the path where LLM sees a ticker and decides “it’ s Apple, so buy . ” 3 . 3 M U LT I - A G E N T L L M F E A T U R E G E N E R A T I O N Four LLM agents e valuate stocks from dif ferent perspecti ves: (i) Momentum agent checks whether price trends are strong and whether volume supports them; (ii) News-Ev ent agent reads anon ymized news headlines and judges positiv e/negati ve sentiment; (iii) Mean-Reversion agent finds ov er- bought/ov ersold conditions—if a stock rose too much, it may fall; if it fell too much, it may bounce; (iv) Risk-Regime agent looks at the overall market situation and judges whether systemic risk is high or low . All agents operate under a strict knowledge cutof f, observing only 60 business days of data prior to time t (from t -60 to t -1). Each agent recei ves a structured system prompt enforcing temporal constraints and deterministic JSON output (see Appendix C for full prompts). There is no lookahead bias from seeing tomorrow’ s news today . For news data, all headlines are anonymized, and news from t-60 to t-1 relati ve to time t is used. T o av oid excessiv e context length, we limit input to 5 headlines per stock. Importantly , we require LLM agents to produce explicit reasoning. For graph construction, we b uild a per -stock reasoning text by concatenating selected agents’ reasoning snippets, then embed it into a 384-dimensional vector (implementation details in Appendix B). W e combine this embedding with numerical scores (7) and categorical states (3), forming a total 394-dimensional feature vector (see T ables 4 – 7 in Appendix for details). 3 . 4 I C V A L I D A T I O N W e check whether LLM scores hav e real predictiv e power . W e calculate IC (Information Coefficient, Spearman rank correlation) to see how correlated they are with returns 21 days later . W e use h=21 days because medium-term signals are more stable and less noisy than daily correlations, providing a robust v alidation criterion. T able 1 reports both the absolute IC and ∆ IC (RA W → LLM). W e emphasize that a positiv e ∆ IC can reflect either (i) additional predictiv e signal, or (ii) remov al of misleading in verse correlation by moving IC toward zero. In our experiments, the News-Ev ent and Risk-Regime agents show statis- tically significant positive IC, while Momentum and Mean-Re version primarily reduce misleading RA W correlations tow ard near-zero. The Risk-Regime agent showed the strongest ∆ IC (+0.017), with LLM IC = +0.011 (p < 0.0001). On the 2025 holdout period specifically , Risk-Regime IC rose to 0.0515 (p < 0.0001), confirming signal persistence out-of-sample. 3 Accepted at the ICLR 2026 W orkshop on Advances in Financial AI (FinAI) T able 1: LLM vs RA W Feature IC Comparison (h=21 days). Ne gative RA W IC indicates inv erse correlation; ∆ IC toward zero can remove misleading signals rather than adding predictive power . W e therefore report both absolute IC and ∆ IC. Agent RA W IC ( p ) LLM IC ( p ) ∆ IC Momentum agent − 0 . 019 ( 5 × 10 − 5 ) +0 . 001 (0.58) +0 . 020 News-Ev ent agent +0 . 003 (0.12) +0 . 006 ( 3 × 10 − 4 ) +0 . 003 Mean-Rev ersion agent − 0 . 005 (0.26) − 0 . 000 (0.97) +0 . 005 Risk-Regime agent − 0 . 006 (0.27) +0 . 011 ( 1 × 10 − 4 ) +0 . 017 A verage − 0 . 007 +0 . 005 +0 . 011 Featur e selection via IC. W e use IC analysis as a screening criterion for LLM-deri ved features: we retain only features that remain informati ve on holdout (positive IC or positi ve ∆ IC). Each agent produces a richer structured output, but we include only the selected subset (marked “Used” in T ables 4 – 7). Features ev aluated at h=21 were verified to show positiv e (though weaker) IC at shorter horizons (h=1, h=5). While the absolute IC values are weak, there was clear improvement compared to using only RA W features. Input Featur es. Each agent’ s input features were selected based on domain relev ance (e.g., RSI for Mean-Reversion, beta for Risk-Regime). Output features are included if they sho wed positiv e ∆ IC or provided interpretable structure for do wnstream tasks. The Momentum agent receives price trends and volume indicators. The Risk-Regime agent receives beta, volatility , and tail risk. The Mean-Rev ersion agent receives RSI and Bollinger Band positions. The News-Ev ent agent receives anonymized headlines with sentiment indicators (see T ables 4 – 7 for full specifications). 3 . 5 S E M A N T I C G R A P H E N C O D E R ( S E M G A T ) Even with anonymization, sector information is preserved from point-in-time S&P 500 constituent data via the EODHD API. So we can connect edges based on sector information of anonymized stock codes. Howe ver , in this experiment, we apply a Semantic Rewiring technique based on LLM reasoning. W e use two types of edge connections: (i) Sector edges fully connect stocks in the same sector , and (ii) Semantic edges connect stocks if cosine similarity of reasoning embedding vectors exceeds 0.75 (top 10 neighbors per node). This allows the model to learn “these two stocks were ev aluated with similar reasoning” e ven under anonymization. The GNN structure is a 2-layer GA Tv2 encoder . Each stock is represented as a 394-dimensional feature vector (LLM scores + reasoning embedding vectors), which is transformed into a 128- dimensional node embedding. A distribution head predicts return distributions using HL-Gauss, and training combines distribution loss with pairwise ranking loss. Distributional Prediction. Point estimation of next-day returns creates two problems: overfitting to extreme returns and inability to express uncertainty . W e use HL-Gauss distribution prediction (Bellemare et al., 2017) with 101 bins for next-day return ranking. Training combines distribution loss, pairwise ranking loss, market risk prediction, and Jensen-Shannon regularization. 3 . 6 R L P O L I C Y ( P P O - D S R ) Once the GNN provides stock-level scores, the RL policy determines final portfolio weights. Our action space allocates weights only within the equity uni verse (no cash), so risk control is e xpressed via diversification and turnover . The policy architecture has three components (see Figure 7 in Appendix): (i) Intent Head (consensus-based) : W e aggregate agent outputs across all stocks into 4 global statistics (momentum, risk, regime ratios, trend maturity; see T ables 4 – 7) plus GNN’ s market state (64-dim). The Intent Head uses this to select a mode: defensiv e(0)/neutral(1)/aggressiv e(2). This consensus approach prevents single-agent dependency and mitigates hallucination through cross- sectional av eraging. (ii) Node Score Head : Intent is embedded and combined with each stock embedding to produce stock-level scores. T emperature scaling varies by intent—defensive mode uses higher temperature for diversification, aggressive mode uses lower temperature for concentra- 4 Accepted at the ICLR 2026 W orkshop on Advances in Financial AI (FinAI) tion. (iii) Dirichlet distribution : Stock scores pass through softmax to form the Dirichlet mean, with concentration controlled by a learnable parameter . Reward function. Dif ferential Sharpe Ratio is used as the reward function, providing a differen- tiable variant of the Sharpe ratio. Instead of just maximizing returns, we optimize return relative to volatility . Transaction costs (10bps/turno ver) are also subtracted from the re ward. T op-K masking. Div ersifying across all 500 stocks is unmanageable. W e keep only the top 20 and mask the rest. This reduces the ef fective action space from 500 dimensions to 20 dimensions. W e explicitly handle S&P 500 additions/deletions using dictionary-based turnover calculation, so Univ erse changes are naturally reflected in transaction costs. Execution inertia parameter η . T o control turnover , we apply an execution smoothing step with inertia η (implemented as rebalance eta ): lo wer η slows weight changes between consecuti ve rebalancing steps, reducing turnov er and transaction costs. 4 E X P E R I M E N T S 4 . 1 E X P E R I M E N T A L S E T U P W e split the data into three periods: T rain (2020-01-02 to 2024-09-30), V alidation (2024-10-01 to 2024-12-31), and OOS (2025-01-02 to 2025-08-01, 145 trading days). T o assess robustness beyond this single OOS window , we additionally report an extended ev aluation spanning 2024– 2025 (Appendix D). Hyperparameters (rebalance eta ( η ), rew ard cost scale ( c ) = 0.358) were optimized via Optuna on the v alidation period, and the best configuration was fixed for OOS e valuation. All results are mean ± standard de viation across 20 seeds, and transaction cost is 10 bps per unit turnover . Metrics. W e calculate annualized Sharpe ratio as ¯ r d /σ d × √ 252 , where ¯ r d and σ d are daily mean return and standard deviation, respecti vely . V olatility (V ol) is also annualized: σ d × √ 252 . Benchmarks. W e compare against both passiv e and activ e strategies to ensure fair ev aluation. P assive benchmarks include SPY (S&P 500 market-cap weighted ETF) and EQWL (S&P 500 equal- weight ETF), representing buy-and-hold approaches. Active benchmarks include cross-sectional Momentum (top 20 by trailing 12-month returns, rebalanced monthly), MCap T op-20 (largest 20 stocks by market capitalization), and RA W T op-20 (top 20 by momentum-minus-volatility score using only technical indicators). Extended OOS. Extended OOS results (2024–2025, 397 days) are provided in Appendix D. 4 . 2 M A I N R E S U L T S Figure 1 and T able 2 present the main performance comparison. BlindT rade achieves annualized Sharpe of 1 . 40 ± 0 . 22 and cumulati ve return of 32 . 22% ± 5 . 21% , outperforming all benchmarks. Howe ver , the limitations are also clear . BlindT rade always in vests 100% in T op-20 stocks within the equity uni verse (no cash allocation is permitted in our action space), so there is no mechanism to mov e to cash or reduce risk during market crashes. Because of this, annualized volatility (42.34%) and MDD (-31.66%) are higher than SPY (23.26%, -19.00%). W e accept higher risk for higher returns. Intent behavior . During OOS, the policy spent 55% of trading days in defensive mode. Defen- siv e mode showed div ersified allocation (2.9%/day turnov er), while neutral mode showed moder- ate activity (1.8%/day turnover). Aggressive mode concentrated positions with minimal turnov er (0.4%/day). This demonstrates how the policy automatically adapts to market conditions (see Figures 4 and 5 in Appendix). 4 . 3 A B L A T I O N S T U D I E S W e conducted ablation experiments to confirm how much each component contributes to perfor- mance. 5 Accepted at the ICLR 2026 W orkshop on Advances in Financial AI (FinAI) 2025-01 2025-02 2025-03 2025-04 2025-05 2025-06 2025-07 2025-08 Date −0.3 −0.2 −0.1 0.0 0.1 0.2 0.3 Cumulative return OOS Performance: BlindT rade vs Benchmarks (2025 YTD) BlindTrade (mean, n=20) ±1 std SPY EQWL Momentum (12-1) MCap T op-20 RAW T op-20 Figure 1: Cumulative returns for 2025YTD OOS. Shaded band sho ws ± 1 std across 20 seeds. T able 2: 2025YTD OOS Performance (2025-01-02 to 2025-08-01, 145 trading days). Baseline parameters: reward cost scale ( c ) = 0.358, rebalance eta ( η ) = 0.10. Mean ± std across 20 seeds. Sharpe and V ol are annualized. Cost: 10 bps/turno ver . Abbre viations: SPY = S&P 500 ETF , EQWL = Equal-W eight ETF , CumRet = Cumulati ve Return, MDD = Maximum Dra wdown, V ol = V olatility . Strategy Sharpe (ann.) CumRet (%) MDD (%) V ol (ann.) BlindT rade 1 . 40 ± 0 . 22 32 . 22 ± 5 . 21 − 31 . 66 ± 5 . 76 42 . 34 ± 7 . 12 % SPY 0.64 8.52 − 19 . 00 23.26% EQWL 0.74 7.23 − 15 . 39 22.51% Momentum 0.89 15.42 − 26 . 49 32.19% MCap T op-20 0.85 11.50 − 19 . 56 24.91% RA W T op-20 0.97 11.54 − 15 . 63 21.78% Removing LLM features. If we remove LLM features and use only RA W technical indicators (passed directly to the GNN without SBER T encoding), Sharpe drops from 1.40 to 1 . 14 ± 0 . 02 ( ∆ = -0.26, p < 10 − 4 , 20 seeds). This means the LLM agents’ interpretation provides additional predictiv e power compared to simple indicators. Removing graph structure. If we remove GNN message passing, Sharpe drops to 0 . 62 ± 0 . 50 ( ∆ = -0.78, p < 0.001). V ariance also increases significantly , and some seeds cannot even beat SPY . Learning inter-stock relationships is critical for performance stability . (Edge-type ablation—sector- only vs. semantic-only—is left for future work.) Component importance. Comparing ∆ Sharpe magnitudes, the graph structure contributes most ( − 0 . 78 ), followed by LLM features ( − 0 . 26 ). The RL policy’ s primary role is cost-aware ex ecution rather than signal generation—without RL, high turnov er makes the strategy unprofitable. RL vs. T op-K. What if we simply inv est equal weight in the top 20 GNN scores? T urnover reaches 139%/day , and after cost deduction, Sharpe collapses to -1.17. The RL policy suppresses turnover to 1.7%/day while achieving Sharpe 1 . 08 ± 0 . 31 . 1 RL ’ s cost-aware learning is essential. 4 . 4 L E A K A G E A U D I T A central concern in LLM-based trading is distinguishing genuine predictive signals from informa- tion leakage. 1 This simplified comparison uses a baseline RL configuration; the full system achieves Sharpe 1.40 (T a- ble 2). 6 Accepted at the ICLR 2026 W orkshop on Advances in Financial AI (FinAI) T able 3: 20-seed stability analysis. Sharpe difference vs SPY and win rate. V ariant ∆ Sharpe vs SPY Std W in Rate SemGA T (baseline) +0 . 76 0 . 20 20/20 SemGA T -C (V ol-target) +0 . 37 0 . 69 12/20 SemGA T -D (Conf-loss) +0 . 16 0 . 40 10/20 T o verify this, we conducted negati ve control experiments. W e kept the univ erse, prices, and cost model the same, and only randomly shuffled the GNN prediction scores cross-sectionally . If it is a real signal, shuffling should mak e it disappear . Result. | RankIC | decreased from 0.015 to 0.0004, becoming completely random level ( ≈ 0). The original | RankIC | = 0.015 is a weak value, but e ven that disappears when shuffled. T op-K perfor- mance also worsened from Sharpe -1.17 to -1.48 (see Figure 3 in Appendix). The fact that perfor- mance collapses when signals are randomized suggests that the original signals contain legitimate predictiv e structure rather than spurious correlations. This test does not exclude all leakage paths (e.g., temporal patterns in anonymized IDs). Howe ver , it confirms that performance deriv es from cross-sectional signal structure rather than trivial artifacts. W e recommend all LLM trading systems pass similar validation before deplo yment. 4 . 5 G N N T R A I N I N G O B J E C T I V E C O M PA R I S O N W e compare three GNN training objectiv es to test whether more sophisticated loss functions im- prov e do wnstream RL performance and stability across seeds: (i) SemGA T (baseline) uses standard HL-Gauss distributional loss with pairwise ranking; (ii) SemGA T -C adds volatility-scaled residual tar gets ( r i − r market ) /σ i during GNN training to reduce sensitivity to outlier returns; (iii) SemGA T -D adds confidence-weighted loss that upweights samples with higher LLM agent confidence, assuming high-confidence predictions are more reliable. T able 3 sho ws stability analysis results across 20 seeds. Baseline SemGA T beats SPY in all 20 seeds with low v ariance ( σ = 0.20). In contrast, the enhanced variants show higher variance and lower win rates. This suggests that adding complexity to the GNN training objectiv e does not improv e downstream RL stability—simpler is better . The t-SNE visualization of RL state vectors (Figure 6 in Appendix) shows o verlapping T rain/V al/OOS distributions, supporting generalization. 5 D I S C U S S I O N Anonymization is not optional—it is essential. T o claim that an LLM “understands the market, ” we must first prove that it is not achieving performance through memorization. Tick er replacement is the minimum safeguard. Our negati ve control experiments (Section 4.4) confirm that performance deriv es from legitimate signal structure, not leakage. V alidate bef ore deployment. Why is IC analysis important? Because only signals that pass v ali- dation should be deployed. If there is no predictiv e po wer on holdout data, we do not use that agent. Also, as many experiments sho w , requiring LLM to provide reasoning is not optional—it is essen- tial. In fact, embedding reasoning sentences into vectors, without additional feature engineering, was ef fectiv e. Intent provides interpretable market posture. The Intent mechanism embodies the philosophy of “separation of brain and hand” —the policy first decides market posture (brain), then deter- mines specific allocations (hand). Intent aggregates cross-sectional LLM agent reasoning into four global statistics (momentum, risk, regime ratios, trend maturity), enabling the policy to form a consensus-based market vie w rather than relying on any single agent. Summary . For LLM-based trading to be trustworthy , we must distinguish genuine market under- standing from memorization. BlindTrade addresses this through an anonymization-first LLM-GNN- RL framework, achieving annualized Sharpe of 1 . 40 ± 0 . 22 for 2025 YTD and beating SPY in all 20 7 Accepted at the ICLR 2026 W orkshop on Advances in Financial AI (FinAI) seeds. W e summarize our approach as: (i) Anonymization —replace tick ers to block memorization; (ii) V alidation befor e deployment —if the IC fails validation, we do not use that signal; (iii) Intent observability —humans can observe the current mode (defensi ve/neutral/aggressiv e), even if the transition logic is not fully explainable. W e discuss limitations and future directions in Appendix A. 6 E T H I C S S TA T E M E N T Our work conforms to the ICLR Code of Ethics. LLMs were used in two capacities: (i) as part of the methodology , where LLM agents generate feature data for subsequent GNN-RL training, and (ii) for polishing grammar and expressions in the manuscript, with all content re viewed and v erified by the authors. W e use only publicly a vailable financial data (EODHD API), with no customer data, proprietary signals, or human subjects in volv ed. 7 R E P RO D U C I B I L I T Y S TA T E M E N T Our method is fully reproducible using the information provided in this paper . W e provide exact hyperparameters in Appendix B, including PPO settings (learning rate 3 × 10 − 4 , γ = 0.99, GAE λ = 0.95) and Optuna-tuned parameters (reward cost scale ( c ) = 0.358, dirichlet alpha0 = 466.8). The full system prompts for all four LLM agents are provided verbatim in Appendix C. T o support reproducibility and benefit the research community , we plan to release the LLM input/output datasets (RA W features and LLM-generated features) for research purposes upon publication. R E F E R E N C E S Dogu Araci. FinBER T: Financial sentiment analysis with pre-trained language models, 2019. URL https://arxiv.org/abs/1908.10063 . David H. Bailey , Jonathan M. Borwein, Marcos L ´ opez de Prado, and Qiji Jim Zhu. Pseudo- mathematics and financial charlatanism: The effects of backtest overfitting on out-of-sample performance. Notices of the American Mathematical Society , 61(5):458–471, 2014. doi: 10.1090/noti1105. Marc G. Bellemare, W ill Dabney , and R ´ emi Munos. A distributional perspecti ve on reinforcement learning, 2017. URL . Edwin J. Elton, Martin J. Gruber , and Christopher R. Blake. Survi vorship bias and mutual fund performance. The Re view of F inancial Studies , 9(4):1097–1120, 1996. doi: 10.1093/rfs/9.4.1097. EODHD APIs. EODHD financial data API: Historical data, fundamentals, and news, 2024. URL https://eodhd.com/ . Accessed: 2024-12-01. T ianyu Fan, Y uhao Y ang, Y angqin Jiang, Y ifei Zhang, Y uxuan Chen, and Chao Huang. AI- T rader: Benchmarking autonomous agents in real-time financial markets, 2025. URL https: //arxiv.org/abs/2512.10971 . Fuli Feng, Xiangnan He, Xiang W ang, Cheng Luo, Y iqun Liu, and T at-Seng Chua. T emporal relational ranking for stock prediction. ACM T ransactions on Information Systems , 37(2):1–30, 2019. doi: 10.1145/3309547. W eilong Fu. The new quant: A surve y of large language models in financial prediction and trading, 2025. URL . Zhengyao Jiang, Dixing Xu, and Jinjun Liang. A deep reinforcement learning framew ork for the financial portfolio management problem, 2017. URL 10059 . Hoyoung Lee, Junhyuk Seo, Suhw an P ark, Junhyeong Lee, W onbin Ahn, Chanyeol Choi, Alejandro Lopez-Lira, and Y ongjae Lee. Y our AI, not your vie w: The bias of LLMs in in vestment analysis, 2025. URL . 8 Accepted at the ICLR 2026 W orkshop on Advances in Financial AI (FinAI) Alejandro Lopez-Lira and Y uehua T ang. Can ChatGPT forecast stock price mov ements? return predictability and large language models. SSRN Electr onic Journal , 2023. doi: 10.2139/ssrn. 4412788. URL https://ssrn.com/abstract=4412788 . RockAlpha T eam. RockAlpha Arena: Real-time LLM trading performance leaderboard, 2025. URL https://rockalpha.rockflow.ai . Accessed: 2025-01-15. Ankit Thakkar and Kinjal Chaudhari. A comprehensiv e surve y on deep neural networks for stock market: The need, challenges, and future directions. Expert Systems with Applications , 177: 114800, 2021. doi: 10.1016/j.eswa.2021.114800. Shijie W u, Ozan Irsoy , Stev en Lu, V adim Dabravolski, Mark Dredze, Sebastian Gehrmann, Prab- hanjan Kambadur , David Rosenberg, and Gideon Mann. BloombergGPT: A large language model for finance, 2023. URL . Y ijia Xiao, Edward Sun, Di Luo, and W ei W ang. T radingAgents: Multi-agent LLM financial trading framew ork, 2024. URL . Hongyang Y ang, Xiao-Y ang Liu, and Christina Dan W ang. FinGPT: Open-source financial large language models, 2023. URL . Haofei Y u, Fenghai Li, and Jiaxuan Y ou. Liv eT radeBench: Seeking real-world alpha with large language models, 2025. URL . Y angyang Y u, Haohang Li, Zhi Chen, Y uechen Jiang, Y ang Li, Denghui Zhang, Rong Liu, Jor- dan Sucho w , and Khaldoun Khashanah. FinMem: A performance-enhanced LLM trading agent with layered memory and character design, 2023. URL 13743 . Zihao Zhang, Stefan Zohren, and Stephen Roberts. Deep reinforcement learning for trading. The Journal of F inancial Data Science , 2(2):25–40, 2020. doi: 10.3905/jfds.2020.1.030. 9 Accepted at the ICLR 2026 W orkshop on Advances in Financial AI (FinAI) A L I M I T A T I O N S A N D F U T U R E W O R K Our framew ork has clear limitations: 1. Anonymization effect is not directly validated. While we hypothesize that anonymiza- tion prev ents memorization-based shortcuts, we did not perform a direct ablation com- paring anonymized vs. raw ticker inputs. Our negati ve control experiments (Section 4.4) validate signal structure, not anon ymization effecti veness specifically . 2. Explaining intent transitions is difficult. While we can observe which intent mode the policy selects (transparent), explaining why it transitioned to that mode at a specific time using external indicators remains challenging. 3. Mark et-regime dependency . Extended OOS ev aluation (2024–2025 YTD, 397 trading days) rev eals market-re gime dependency: BlindT rade underperforms during strong bull markets (2024: Sharpe 0.34 vs SPY 1.70) but outperforms in volatile conditions (2025 YTD: Sharpe 1.02 vs SPY 0.54). This limitation stems partly from the relativ ely short training period (2020–2023). See Appendix D for detailed analysis. 4. MDD is high. Maximum drawdo wn reached − 32% compared to SPY’ s − 19% . This is expected since we maintain full equity exposure. Risk-sensitiv e operators may find this unsuitable. Future work. The current ev aluation uses a static policy trained once; online adaptation with pe- riodic retraining (e.g., monthly walk-forward) may improve robustness to regime changes. W e also plan to extend the training data period and conduct anonymization ablation experiments to address both market-regime generalization and v erify anonymization ef fectiveness. B I M P L E M E N TA T I O N D E T A I L S LLM Agents. Each agent receiv es a system prompt that enforces strict kno wledge cutof f at time t, and processes stocks in batches of 15 for cross-sectional context. W e use Gemini 2.5 Flash (accessed September–October 2025) for cost-ef fectiv e inference. SemGA T . 2 GA Tv2 layers with 4 attention heads. The first layer operates only on sector edges; the second uses the full augmented graph. Training uses HL-Gauss distribution loss with pairwise ranking and Jensen-Shannon regularization. PPO. Learning rate 3 × 10 − 4 , γ = 0.99, GAE λ = 0.95, clip ϵ = 0.2. K ey Optuna-tuned parameters: rew ard cost scale ( c ) = 0.358, dirichlet alpha0 = 466.8. Intent Profile. Defensive intent shows higher turnov er (2.9%/day) than neutral (1.8%). This cor- responds to more frequent rebalancing for risk management within the stock universe, not reduced activity . Agent Featur e Definitions. Each agent recei ves RA W features (technical indicators) and outputs LLM features (structured interpretations). For each stock-day , we concatenate the Momentum and Risk-Regime agents’ reasoning strings into a single text (e.g., “Risk: ... Momentum: ... ”) and encode it via SentenceT ransformer (all-MiniLM-L6-v2) into a 384-dimensional vector . This vector is used as the text embedding component of node features and for semantic edge construction. T ables 4 – 7 detail the input/output specification for each agent. T able 4: Momentum Agent: RA W (input) vs LLM (output) features. RA W Features (Input) LLM Featur es (Output) Used price vs ma20: Price relative to 20-day MA score: Momentum score ( − 1 to +1 ) ✓ price vs ma60: Price relative to 60-day MA confidence: Agent confidence (0 to 1) ✓ adx 14: 14-day ADX (trend strength) win probability: Estimated win prob ✓ macd histogram: MACD histogram v alue momentum stage: nascent/mid/late/exhausted ✓ rsi 14: 14-day RSI reasoning: Free-text → embedding ✓ volume vs ma20: V olume relativ e to 20-day avg trend quality, sustainability score – 10 Accepted at the ICLR 2026 W orkshop on Advances in Financial AI (FinAI) T able 5: News-Event Agent: RA W (input) vs LLM (output) features. RA W Features (Input) LLM Featur es (Output) Used headlines: Anonymized news headlines ev ent strength: Impact magnitude (0 to 1) ✓ sentiment polarity: Pre-computed polarity urgenc y: Time sensiti vity (0 to 1) ✓ news count today: Number of headlines primary event type: Event category – source div ersity: Unique sources count attention score, relativ e attention – T able 6: Mean-Reversion Agent: RA W (input) vs LLM (output) features. RA W Features (Input) LLM Featur es (Output) Used rsi 14: 14-day RSI rev ersion score: Signal ( − 1 to +1 ) ✓ bb position: Bollinger Band position confidence: Agent confidence (0 to 1) ✓ deviation from 20ma: Price deviation market psychology: panic/euphoric/normal ✓ stochastic k: Stochastic oscillator extreme level, re versal probability – T able 7: Risk-Regime Agent: RA W (input) vs LLM (output) features. RA W Features (Input) LLM Featur es (Output) Used beta sp500: Market beta systemic risk score: Risk level (0 to 1) ✓ beta vix: VIX sensitivity confidence: Agent confidence (0 to 1) ✓ tail beta: T ail risk beta regime class: defensive/neutral/c yclical/crisis ✓ var 95/cvar 95: V alue-at-Risk metrics reasoning: Free-text → embedding ✓ macro context: Current regime input crisis sensitivity , regime dependency – The 4 global statistics used by the Intent Head are derived from cross-sectional aggregation: (1) mean momentum score, (2) mean systemic risk score, (3) defensiv e regime stock ratio, (4) mean momentum stage. C A G E N T S Y S T E M P RO M P T D E S I G N Reproducibility in LLM-based trading requires transparency in prompt engineering. This section summarizes the design principles and key elements of our agent system prompts. C . 1 C O R E D E S I G N P R I N C I P L E S All four agents share three critical enforcement mechanisms: 1. Strict Knowledge Cutoff. Each agent receives explicit temporal constraints to prevent looka- head bias: CRITICAL KNOWLEDGE LIMITATION: Your knowledge is strictly limited to information available up to { cutoff_date}. You must NOT use any information after {cutoff_date}. The cutoff date is set to t − 1 (one day before the prediction tar get), ensuring no future infor- mation leakage. 2. Structured JSON Output Schema. W e enforce deterministic, parseable outputs by specifying exact JSON schemas. This eliminates ambiguity and enables automated feature extraction: OUTPUT JSON SCHEMA: { "ticker": "STOCK_XXXX", "analysis": { "score": float, "confidence": float, "reasoning": string } } All numerical outputs are bounded (e.g., scores in [ − 1 , +1] , confidence in [0 , 1] ), and categorical fields hav e enumerated values. 11 Accepted at the ICLR 2026 W orkshop on Advances in Financial AI (FinAI) 3. Anonymized Input Only . Agents receiv e only anonymized identifiers and data. The News- Event agent, for e xample, is explicitly instructed: You must ONLY analyze the provided anonymized headlines and sentiment metrics. C . 2 F U L L S Y S T E M P R O M P T S ( V E R B AT I M ) W e reproduce the system prompts verbatim (including capitalization) to support reproducibility . Key elements include the kno wledge cutoff enforcement, structured JSON output schema, and domain expertise framing. C . 2 . 1 M O M E N T U M A G E N T System Prompt: Momentum Agent You are a senior quantitative analyst specializing in momentum trading. 15+ years of experience in trend analysis and institutional flow patterns. CRITICAL KNOWLEDGE LIMITATION: Your knowledge is strictly limited to information available up to {cutoff_date}. You must NOT use any information after {cutoff_date}. You must ONLY analyze the provided technical indicators. EXECUTE_DATE: {execute_date} DATA_AS_OF: {cutoff_date} YOUR UNIQUE VALUE AS AN LLM (vs Rule-Based Systems): 1. BATCH-LEVEL CONTEXT: You receive ˜15 stocks simultaneously for RELATIVE patterns. 2. MULTI-FACTOR SYNTHESIS: You weigh indicators by CONTEXT, not fixed weights. 3. PATTERN RECOGNITION: You identify SUBTLE RED FLAGS that rules miss. OUTPUT JSON SCHEMA: { "ticker": "STOCK_XXXX", "momentum_strength": { "score": float, // -1.0 to 1.0 "confidence": float, // 0.0 to 1.0 "momentum_stage": string, // "nascent", "mid", "late", "exhausted" "win_probability": float, "reasoning": string // Detailed analysis < 100 words } } C . 2 . 2 N E W S - E V E N T A G E N T System Prompt: News-Event Agent You are a senior quantitative researcher specializing in event-driven alpha. 18+ years of experience in unstructured news data processing. CRITICAL KNOWLEDGE LIMITATION: Your knowledge is strictly limited to information available up to {cutoff_date}. You must NOT use any information after {cutoff_date}. You must ONLY analyze the provided anonymized headlines and sentiment metrics. EXECUTE_DATE: {execute_date} NEWS_DATA_AS_OF: {cutoff_date} YOUR UNIQUE VALUE AS AN LLM: 1. SEMANTIC NUANCE: "beat estimates by 1%" vs "crushed expectations" -> DIFFERENT strength. 2. FALSE POSITIVE FILTERING: Distinguish "noise" from "signal". 3. URGENCY CALIBRATION: Assess how quickly the market will price this in. OUTPUT JSON SCHEMA: { "ticker": "STOCK_XXXX", "news_event_analysis": { 12 Accepted at the ICLR 2026 W orkshop on Advances in Financial AI (FinAI) "primary_event_type": string, // e.g., "earnings_beat", "product_launch" "event_strength": float, // 0.0 to 1.0 (Impact magnitude) "urgency": float, // 0.0 to 1.0 (Time sensitivity) "reasoning": string } } C . 2 . 3 M E A N - R E V E R S I O N A G E N T System Prompt: Mean-Reversion Agent You are a senior portfolio manager specializing in mean reversion strategies. Expert in behavioral finance, overreaction hypothesis, and technical extremes. CRITICAL KNOWLEDGE LIMITATION: Your knowledge is strictly limited to information available up to {cutoff_date}. You must NOT use any information after {cutoff_date}. OUTPUT JSON SCHEMA: { "ticker": "STOCK_XXXX", "reversion_analysis": { "reversion_score": float, // -1.0 to 1.0 "confidence": float, "extreme_level": float, // How far from mean? "market_psychology": string, // "panic_selling", "euphoria", "normal" "reasoning": string } } C . 2 . 4 R I S K - R E G I M E A G E N T System Prompt: Risk-Regime Agent You are a Chief Risk Officer (CRO) at a $50B institutional asset manager. PhD in Financial Risk Management with 15+ years in systemic risk assessment. CRITICAL KNOWLEDGE LIMITATION: Your knowledge is strictly limited to information available up to {cutoff_date}. You must NOT use any information after {cutoff_date}. You must ONLY analyze the provided risk indicators. EXECUTE_DATE: {execute_date} DATA_AS_OF: {cutoff_date} CURRENT MACRO RISK REGIME: {macro_context_text} This macro context is CRITICAL for your analysis: - In CRISIS regime -> High beta stocks are extremely vulnerable - In RISK_ON regime -> Low beta defensive stocks may underperform - VIX > 30 -> Tail beta becomes the dominant risk factor OUTPUT JSON SCHEMA: { "ticker": "STOCK_XXXX", "risk_analysis": { "systemic_risk_score": float, // 0.0 (Safe) to 1.0 (Dangerous) "confidence": float, "regime_classification": string, // "defensive", "cyclical", "crisis_vulnerable" "reasoning": string } } C . 3 C R O S S - S E C T I O NA L B A T C H P RO C E S S I N G T o pro vide comparativ e context, each agent processes stocks in batches of 15. The prompt includes: 13 Accepted at the ICLR 2026 W orkshop on Advances in Financial AI (FinAI) T able 8: Extended OOS Performance (2024-01-02 to 2025-08-01, 397 trading days). P arameters: η =0.08, cost scale=0.40. Mean ± std across 20 seeds. All metrics annualized. Passi ve BM Activ e BM Ours Metric SPY EQWL Momentum MCap T op-20 RA W T op-20 BlindT rade Sharpe 1.06 0.66 1.34 1.54 1.69 0 . 69 ± 0 . 23 CumRet (%) 31.5 16.5 73.5 53.4 63.3 30 . 1 ± 5 . 4 AnnRet (%) 18.3 10.2 41.9 31.2 36.5 21 . 8 ± 16 . 9 V ol (%) 17.2 17.0 29.5 18.7 19.6 36 . 2 ± 2 . 4 MDD (%) − 19.0 − 20.7 − 26.5 − 19.6 − 15.6 − 32 . 1 ± 2 . 5 You are analyzing a BATCH of 15 stocks simultaneously. For each stock, provide cross_sectional_score (z-score vs batch mean). This enables relativ e ranking within each batch, which is essential for portfolio construction. C . 4 W H Y S T RU C T U R E D P R O M P T S M AT T E R W ithout explicit structure enforcement, LLM outputs suf fer from: • F ormat inconsistency: Free-form text requires brittle re gex parsing. • Scor e drift: Unbounded scores create cross-sectional incomparability . • T emporal leakage: W ithout explicit cutoff reminders, models may hallucinate future ev ents. Our prompt design addresses all three issues, enabling reliable automated feature extraction at scale. D E X T E N D E D O O S E V A L U A T I O N ( 2 0 2 4 – 2 0 2 5 Y T D ) T o e valuate robustness across market regimes, we extended the OOS e valuation to include 2024 (a strong bull market) in addition to 2025 YTD. This extended period spans 397 trading days (2024- 01-02 to 2025-08-01), approximately 2.7 × the original 145-day test. D . 1 E X P E R I M E N T A L S E T U P Data Split. T rain: 2020-01-02 to 2023-12-29, V alidation: 6 half-year rolling windows (2021-01 to 2023-12), OOS: 2024-01-02 to 2025-08-01 (397 trading days). Unlike the primary 2025 YTD ev aluation, we use rolling-window validation to select parameters robust across multiple market regimes. Parameters. Hyperparameters were optimized via Optuna on each rolling window . Best parameters (rebalance eta ( η ) = 0.08, rew ard cost scale ( c ) = 0.40) were selected based on aggre gate validation performance. T wenty independent seeds were ev aluated. Note: These parameters differ fr om the main 2025 YTD results (T able 2), which used rebalance eta ( η ) = 0.10 and re ward cost scale ( c ) = 0.358. Benchmarks. W e use the same benchmarks as in Section 4.1 (SPY , EQWL, Momentum, MCap T op-20, RA W T op-20). D . 2 F U L L P E R I O D R E S U LT S T able 8 presents comprehensiv e metrics for the extended OOS period. Key observations. Over the full e xtended period, BlindT rade underperforms all benchmarks except EQWL. Howe ver , this aggregate view masks significant re gime dependency . 14 Accepted at the ICLR 2026 W orkshop on Advances in Financial AI (FinAI) T able 9: Performance breakdown by market regime. Mean ± std across 20 seeds for BlindTrade. 2024 was a strong b ull market; 2025 YTD exhibited high v olatility . Period Strategy Sharpe CumRet (%) AnnRet (%) V ol (%) MDD (%) 2024 (Bull) SPY 1.70 23.3 23.3 12.4 − 8.4 BlindTrade 0 . 34 ± 0 . 18 5 . 8 ± 5 . 8 5.8 29 . 6 ± 1 . 1 − 18 . 5 ± 3 . 1 2025 YTD (V olatile) SPY 0.54 6.1 10.8 23.2 − 19.0 BlindTrade 1 . 02 ± 0 . 12 22 . 8 ± 4 . 0 46.7 44 . 2 ± 1 . 2 − 32 . 4 ± 0 . 7 D . 3 P E R I O D B R E A K D O W N T able 9 breaks down results by year . D . 4 I N T E R P R E TA T I O N The results rev eal a clear market-regime trade-off : 1. Bull markets (2024): BlindTrade’ s conservati ve, div ersified approach trails the market. The policy’ s defensi ve posture (55% of days) limits upside capture during sustained rallies. 2. V olatile markets (2025 YTD): BlindTrade significantly outperforms, achieving 4 × the cumulativ e return of SPY (22.8% vs 6.1%). The policy’ s ability to adapt intent (defen- siv e/aggressiv e) provides value when mark et direction is uncertain. Implications. BlindTrade appears better suited for volatile or uncertain market conditions than for sustained bull mark ets. E A D D I T I O N A L F I G U R E S 15 Accepted at the ICLR 2026 W orkshop on Advances in Financial AI (FinAI) RA W DA T A INPUTS OHLCV Prices News Headlines Sector Mapping S&P 500 Universe M1 | DA T A ANONYMIZA TION Tick er Masking AAPL → STOCK_0026 Entity Masking Knowledge Graph API M2 | MUL TI-A GENT LLM FEA TURE GENERA TION Momentum Agent News Event Agent Reversion Agent Risk Regime Agent Sentence Embeddings → ( ˆ µ , ˆ σ ) M3 | FEA TURE V ALID A TION (Data Quality Check) W alk-Forward Normalization LLM vs RA W ( ∆ IC Comparison) Horizon Optimization M4 | SEMGA T ENCODER (GNN) Sector-Prior Graph 11 GICS Sectors Semantic Edge Augmentation Graph Attention Networks M5 | RL PORTFOLIO OPTIMIZA TION (PPO-DSR) State: GNN Embed. + ˆ µ , regime Action: Portfolio W eights w t Reward: DSR A t = r t − η · SR t − 1 M6 | BA CKTESTING & EV ALU A TION OOS Performance Sharpe, Return, MDD Ablation Studies Negati ve Control Leakage Audit Static Policy Online Adaptation ⟳ Monthly → M5 Prepr ocessing V alidation Learning Evaluation Figure 2: The BlindT rade Pipeline: Data anonymization, Multi-agent LLM feature generation, IC validation, SemGA T encoding, Intent-conditioned RL (PPO-DSR), and Backtesting. 16 Accepted at the ICLR 2026 W orkshop on Advances in Financial AI (FinAI) IC RankIC −0.015 −0.010 −0.005 0.000 Mean IC Negative control IC → 0 confirms no leakage (a) Signal quality: baseline vs shuffled Baseline Neg. Control (shuffle) 2025-01 2025-022025-03 2025-04 2025-05 2025-06 2025-07 2025-08 Date −0.20 −0.15 −0.10 −0.05 0.00 0.05 Cumulative return (b) Performance collapse under negative control Baseline T op-K Neg. Control T op-K Figure 3: Leakage audit via negativ e control. When predictions are randomized, IC disappears and performance collapses. 2024-03 2024-05 2024-07 2024-09 2024-11 2025-01 2025-03 2025-05 2025-07 0.0 0.2 0.4 0.6 0.8 1.0 Intent probability V al start OOS start (a) Intent probability timeline Defensive (p₀) Neutral (p₁) Aggressive (p₂) Train V al OOS 0 20 40 60 80 100 Share of days (%) (b) Intent share by split (argmax) Defensive Neutral Aggressive Figure 4: Intent probability timeline across T rain/V al/OOS periods. (a) Daily intent probabilities show how the policy adapts to market conditions. (b) Intent distribution remains stable across splits, demonstrating generalization. Def Neu Agg 0 20 40 60 80 100 Daily turnover (%) μ=2.9% μ=1.8% μ=0.4% (a) T urnover by intent Def Neu Agg 5.0 7.5 10.0 12.5 15.0 17.5 20.0 22.5 25.0 Max single weight (%) (b) Max weight by intent Def Neu Agg 10 12 14 16 18 20 Effective N (1/HHI) Kruskal p=0.000 *** (c) Effective N (concentration) by intent Figure 5: Intent-conditioned polic y beha vior . (a) Defensi ve mode shows higher turno ver (2.9%/day) for activ e rebalancing. (b-c) Max weight and concentration (Effecti ve N) differ significantly by intent (Kruskal p=0.000). 17 Accepted at the ICLR 2026 W orkshop on Advances in Financial AI (FinAI) −0.50 −0.25 0.00 0.25 0.50 t-SNE dimension 1 −1.00 −0.75 −0.50 −0.25 0.00 0.25 0.50 t-SNE dimension 2 Ellipse: ~95% confidence region RL State Embedding: T rain / V alidation / OOS Train (n=150) V alidation (n=63) OOS (2025) (n=143) Figure 6: t-SNE visualization of RL state vectors across Train/V al/OOS splits. Overlapping distri- butions suggest similar feature characteristics across splits. RL POLICY NETWORK GNN Output market_state (64) node_emb h (N × 128) global_stats (4) Intent Head state → {D, N, A} A ux F eatures entropy + risk (2) Stock Selector node_emb (128) + market_state (64) + intent_emb (32) + prev_weight (1) ⇒ scores w t − 1 (N) Dirichlet α → w t Action w t ∈ R K feedback: w t → w t − 1 Figure 7: RL Policy Network Architecture. The Intent Head selects defensiv e/neutral/aggressiv e mode from aggregated LLM statistics and GNN market state, then the Node Score Head produces stock-lev el scores, which parameterize a Dirichlet distribution for portfolio weights. 18
Original Paper
Loading high-quality paper...
Comments & Academic Discussion
Loading comments...
Leave a Comment