Hypothesis Class Determines Explanation: Why Accurate Models Disagree on Feature Attribution
The assumption that prediction-equivalent models produce equivalent explanations underlies many practices in explainable AI, including model selection, auditing, and regulatory evaluation. In this work, we show that this assumption does not hold. Thr…
Authors: Thackshanaramana B
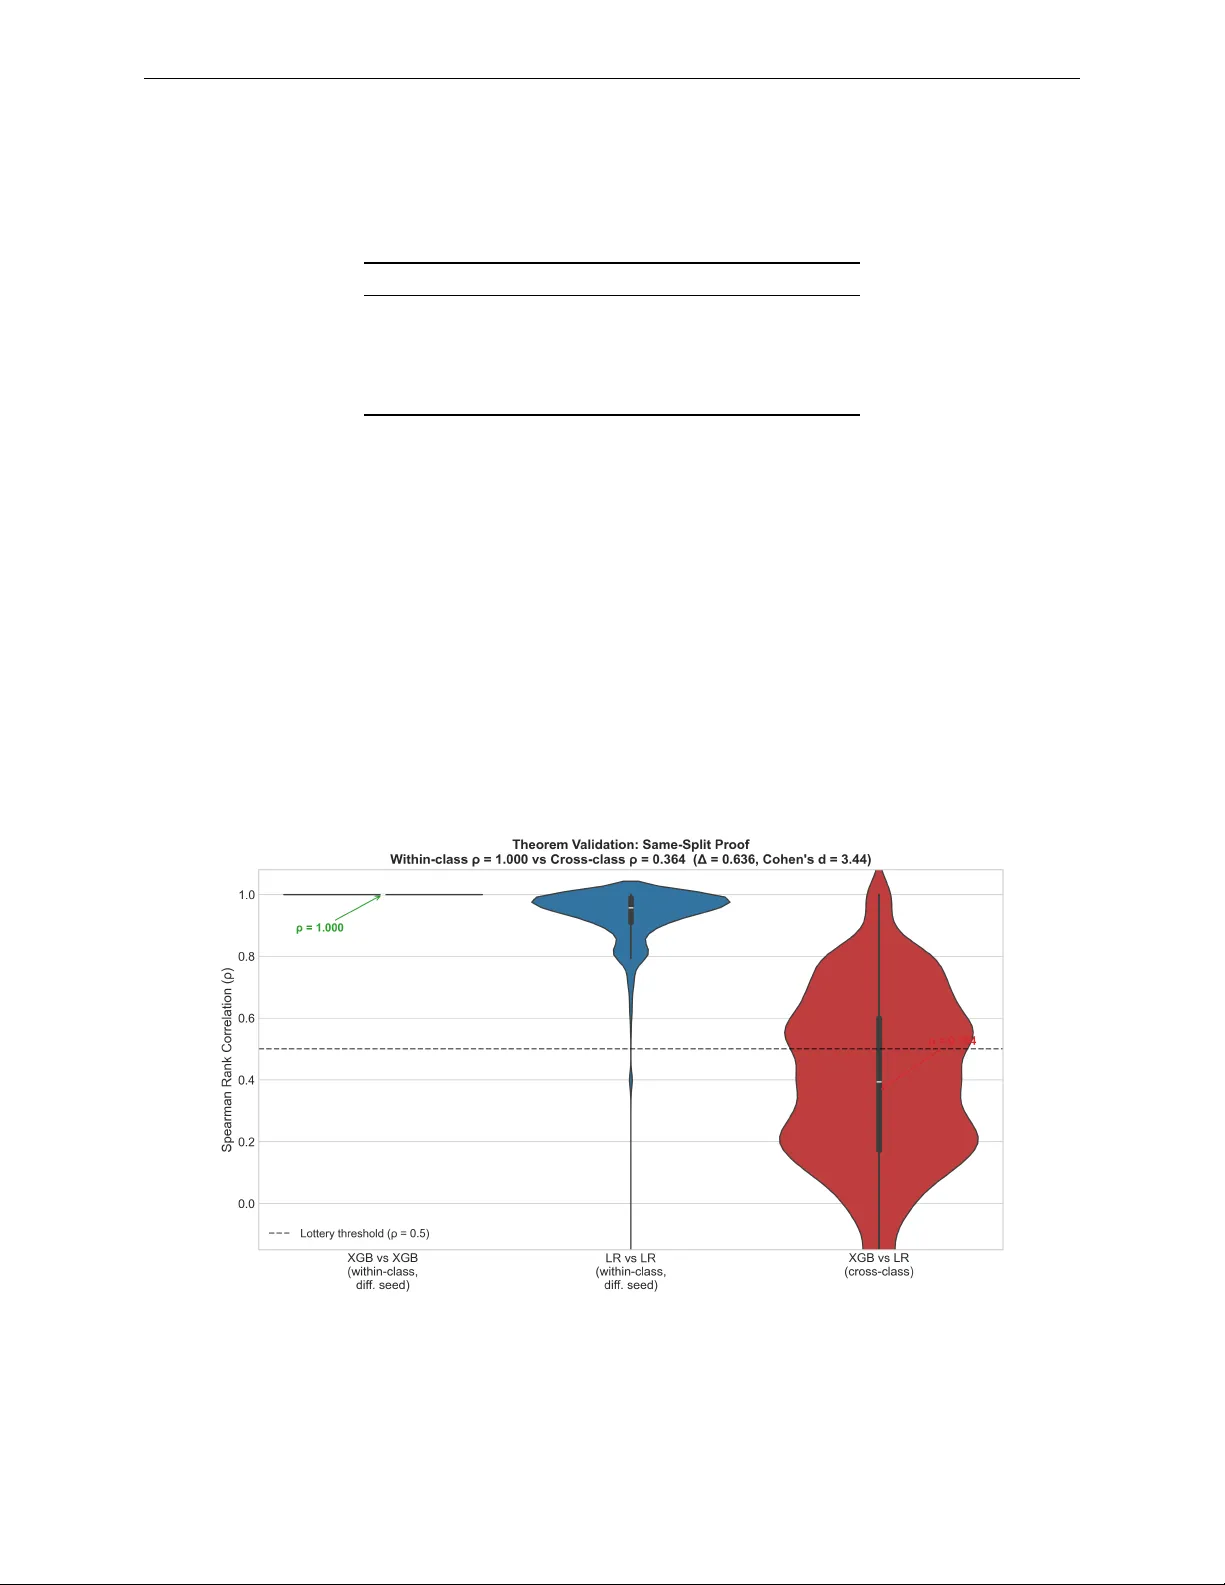
Hyp othesis Class Determines Explanation: Why A ccurate Mo dels Disagree on F eature A ttribution Thac kshanaramana B tb2138@srmist.e du.in SRM Institute of Scienc e and T e chnolo gy, India Abstract The assumption that prediction-equiv alen t mo dels produce equiv alent explanations under- lies man y practices in explainable AI, including mo del selection, auditing, and regulatory ev aluation. In this work, we show that this assumption does not hold. Through a large- scale empirical study across 24 datasets and multiple mo del classes, w e find that mo dels with identical predictive b eha vior can pro duce substantially different feature attributions. This disagreemen t is highly structured: mo dels within the same hypothesis class exhibit strong agreement, while cross-class pairs (e.g., tree-based vs. linear) trained on identical data splits sho w substantially reduced agreement, consisten tly near or b elo w the lottery threshold. W e identify h yp othesis class as the structural driver of this phenomenon, which w e term the Explanation Lottery , and sho w that it extends across tree-based, linear, and neural h yp othesis classes. W e theoretically show that the resulting Agreemen t Gap b e- t ween intra-class and inter-class attribution agreement p ersists under interaction structure in the data-generating pro cess. This structural finding motiv ates a p ost-hoc diagnostic, the Explanation Reliabilit y Score R ( x ) , whic h predicts when explanations are stable across arc hitectures without additional training. Our results demonstrate that mo del selection is not explanation-neutral: the hypothesis class chosen for deploymen t can determine which features are attributed resp onsibilit y for a decision. 1 Intro duction A cross credit scoring, recidivism prediction, and clinical risk assessment, institutions must no w justify auto- mated decisions to the individuals they affect (Baro cas et al., 2019; Rudin, 2019). The usual resp onse is to select a mo del on accuracy or calibration, then ask it for explanations, treating mo del selection and expla- nation as t wo separate problems, the first technical and the second interpretiv e (Lipton, 2018; Doshi-V elez & Kim, 2017). What this workflo w assumes, but never chec ks, is that the choice of mo del do es not change the explanation. Regulatory frameworks ha ve codified the right to explanation without resolving this question. Article 22 of the GDPR gran ts individuals an explanation for automated decisions; audit implemen tations t ypically satisfy this b y ev aluating mo del accuracy and rep orting the selected mo del’s SHAP v alues, with no chec k on whether a differen t accurate mo del would ha v e explained the same decision differen tly (Europ ean Parliamen t and Council, 2016; W ac hter et al., 2017). The Northp ointe audit of COMP AS ev aluated mo dels on predictive parit y and left the explanation question untouc hed (Angwin et al., 2016). Consider a concrete instance of the problem this creates. A defendant assessed high-risk by b oth X GBo ost and Logistic Regression receives differen t explanations from eac h: X GBo ost identifies prior convictions as the primary driver (38%) while Logistic Regression identifies age (42%). Both answers are mathematically correct; the defendan t’s understanding of their situation dep ends entirely on whic h h yp othesis class the practitioner selected. The assumption is not unreasonable. T wo mo dels that agree on every prediction seem likely to agree on why: if they are making the same call for every patient, defendan t, or applicant, they are presumably attending 1 to the same evidence. SHAP is described as mo del-agnostic (Lundb erg & Lee, 2017), whic h implies the attribution should reflect the data, not the architecture. Prior work has approac hed explanation disagreement from three directions, none of whic h addresses the question we ask. Krishna et al. (2022) study disagreemen t across explanation metho ds applied to the same fixed mo del; their v ariable is the metho d, not the mo del. W atson et al. (2022) and Bensmail (2025) study explanation instabilit y across retraining runs within the same hypothesis class; their v ariable is the random seed, and prediction agreement is neither controlled nor measured. Lab erge et al. (2023) observe explanation disagreemen t across Rashomon set mo dels and prop ose consensus partial orders; their work is the closest predecessor to ours, but do es not control for prediction agreemen t as the exp erimen tal v ariable and do es not iden tify hypothesis class as the cause. Bensmail (2025) similarly study within-class explanation multiplicit y without crossing hypothesis class b oundaries. The sp ecific question of whether prediction-equiv alent mo dels from differen t hypothesis classes pro duce equiv alent explanations, and why , has not b een directly addressed. W e test this assumption empirically across 24 datasets spanning 16 application domains. Mo dels achieving iden tical predictions nevertheless attribute imp ortance to different features in more than one-third of cases. This divergence is not measurement noise but reflects structural differences in ho w hypothesis classes repre- sen t feature contributions. T ree-based and linear mo dels exhibit systematically different attribution patterns ev en when predictions are identical, and the effect holds across all datasets, m ultiple random seeds, and b oth SHAP and LIME. W e establish this formally: Theorem 1 prov es that the Agreement Gap ∆ := ρ intra − ρ inter is b ounded aw a y from zero by the interaction structure of the data-generating pro cess and does not v anish asymptotically , closing the reviewer exit that more data would resolve the divergence. Our primary contri- bution is an empirical characterization of explanation disagreement at scale: 93,510 pairwise comparisons across 24 datasets establish that hypothesis class is the structural driver of explanation divergence among prediction-equiv alent mo dels. W e then pro vide a theoretical result showing that this disagreemen t is not a training artifact but p ersists structurally under prediction equiv alence, closing the exit that more data or b etter tuning w ould resolve it. Our central con tribution is a single claim: prediction equiv alence do es not imply explanation equiv alence, and hypothesis class is why . The lottery rate, the Cohen’s d , and the Reliabilit y Score R ( x ) are evidence and to oling for that one claim. W e further sho w this holds univ ersally across tree-based, linear, and neural hypothesis classes: every cross-class b oundary indep endently pro duces the Explanation Lottery . Con tributions. This pap er mak es one cen tral claim, that prediction equiv alence do es not imply expla- nation equiv alence, and supp orts it with: (i) a large-scale empirical study across 24 datasets and 93,510 pairwise comparisons establishing that hypothesis class is the structural driver of explanation divergence; (ii) a controlled same-split exp eriment that eliminates training v ariance as a confound, isolating h yp othe- sis class mem b ership as the sole source of the gap; (iii) a formal characterization sho wing the Agreement Gap ∆ is b ounded aw a y from zero by the interaction structure of the data-generating pro cess and do es not v anish asymptotically; and (iv) the Explanation Reliability Score R ( x ) , a p ost-ho c diagnostic that predicts p er-instance explanation stabilit y without additional training. Our analysis isolates hypothesis class as the primary driver b y controlling for training v ariance, random seeds, and mo del retraining noise, ensuring the observ ed div ergence cannot be attributed to optimization sto chasticit y or data partition effects. 2 Related W ork Cross-metho d disagreemen t (same mo del). Krishna et al. (2022) sho w that different explanation metho ds (LIME, SHAP , gradient-based) applied to the same trained model pro duce substantially different feature attributions, and that practitioners cannot reliably resolve this disagreement. Their study fixes the mo del and v aries the explanation metho d. W e fix the explanation metho d (SHAP) and v ary the mo del. These are orthogonal questions: they ask which metho d to trust giv en one mo del; w e ask whether explanation is stable giv en equiv alen t mo dels. Within-class retraining noise. W atson et al. (2022) show that SHAP and integrated gradients are v olatile across retraining with differen t random seeds within the same ar chite ctur e . Recen t w ork on expla- nation multiplicit y (Bensmail, 2025) trains single mo del classes repeatedly , clustering explanation basins 2 within one hypothesis class, demonstrating within-class mechanistic non-uniqueness. Similarly , Hw ang et al. (2026) examine sto c hasticity in the SHAP estimator across runs on a fixe d mo del (preprin t, under review). All three study noise within a single hypothesis class or a single model. None crosses the hypothesis class b oundary; none controls prediction agreement as the exp erimental v ariable; none identifies h yp othesis class as the structural driver. W e study cross-class structural div ergence, not within-class retraining noise. Rashomon sets and predictive multiplicit y . Laberge et al. (2023) observ e that mo dels in the Rashomon set pro duce conflicting feature attributions and prop ose consensus partial orders as a wa y to aggregate comp eting explanations. Marx et al. (2020) define and measure predictive m ultiplicity , that is, rate at whic h Rashomon set models mak e conflicting pr e dictions . These w orks either observ e explanation disagreemen t as a motiv ating side note or study prediction disagreement rather than explanation disagree- men t. None con trols for prediction agreement as the held-constan t v ariable; none identifies what causes explanation disagreemen t to v ary . W e do not study disagreement within the Rashomon set generally: we study the sp ecific case where prediction agreement is guaran teed, then ask what drives residual explanation disagreemen t. XAI ev aluation b enc hmarks. Hedström et al. (2023) and the Op enXAI b enc hmark (Agarwal et al., 2022) propose standardized ev aluation framew orks for explanation metho ds, measuring prop erties suc h as faithfulness, robustness, and complexity . These b enc hmarks ev aluate explanations produced by a fixed chosen mo del against ground-truth feature imp ortances or p erturbation tests. They assume the explanation metho d is the v ariable under ev aluation and the model is fixed. Neither benchmark includes mo del selection as a v ariable, and neither measures explanation stability across h yp othesis classes. Our Explanation Reliability Score R ( x ) is complemen tary to these b enchmarks: where they measure how well a single explanation reflects a mo del’s in ternal structure, R ( x ) measures ho w consisten tly an y explanation reflects the underlying data signal across multiple prediction-equiv alent mo dels. A ctionability and recourse. W ach ter et al. (2017) and Karimi et al. (2021) study algorithmic recourse, the problem of iden tifying minimal feature c hanges that would alter a mo del’s prediction. Recourse metho ds assume a fixed mo del and generate counterfactuals specific to that mo del’s decision b oundary . If a prac- titioner selects a different prediction-equiv alent mo del, the recourse recommendations c hange: the features a p erson w ould need to change, and by how muc h, depend on the hypothesis class of the deplo yed mo del. The Explanation Lottery therefore has direct implications for recourse: individuals sub ject to a tree-based mo del face structurally different recourse paths than those sub ject to a linear mo del, even when b oth mo dels classify them iden tically . This connection b etw een h yp othesis class c hoice and recourse equity has not b een studied, and our findings motiv ate it as a direction for future w ork. 3 Problem F ormalization Let D = { ( x i , y i ) } n i =1 b e a dataset where x ∈ R d and y ∈ { 0 , 1 } . Let M : R d → { 0 , 1 } denote a classifi- cation model and φ M ( x ) ∈ R d its SHAP attribution v ector (Lundb erg & Lee, 2017), where φ j M ( x ) is the con tribution of feature j to prediction M ( x ) . The central ob ject of study is a pair of mo dels that agree on outputs but may disagree on the reasons they assign to those outputs. W e formalize this precisely . Definition 1 (Prediction Equiv alence) . Two mo dels M 1 , M 2 ar e prediction-equiv alent on dataset D if M 1 ( x ) = M 2 ( x ) for al l x ∈ D . W e write M 1 ∼ D M 2 . Prediction equiv alence constrains outputs but says nothing ab out the internal reasoning of eac h mo del. T o measure whether that reasoning agrees, we need a notion of explanation distance. Definition 2 (Explanation Disagreement) . The explanation disagr e ement b etwe en mo dels M 1 , M 2 on in- stanc e x is 1 − ρ ( φ M 1 ( x ) , φ M 2 ( x )) , wher e ρ is Sp e arman r ank c orr elation. Disagr e ement is substantial when ρ < τ ; we use τ = 0 . 5 as our primary thr eshold. Sp e arman r ank c orr elation is appr opriate her e b e c ause pr actitioners and r e gulators work with fe atur e r ankings (“prior c onvictions is the top factor”), not with r aw attribution magnitudes, making r ank agr e ement the op er ational ly me aningful notion of explanation similarity. 3 When tw o prediction-equiv alent mo dels disagree substantially on their explanations, the practitioner must c ho ose one accoun t of the decision without principled grounds to prefer it. W e name this situation. Definition 3 (The Explanation Lottery) . A pr e diction-e quivalent p air ( M 1 , M 2 ) with M 1 ∼ D M 2 p articip ates in the Explanation Lottery if their explanation disagr e ement is substantial: ρ ( φ M 1 ( x ) , φ M 2 ( x )) < τ . T o measure how often the Explanation Lottery o ccurs across a set of mo del comparisons, we define a scalar summary . Definition 4 (Lottery Rate) . The Lottery Rate L ( τ ) is the pr op ortion of pr e diction-e quivalent p airs ex- hibiting substantial explanation disagr e ement: L ( τ ) = { ( M 1 , M 2 ) : M 1 ∼ D M 2 ∧ ρ ( φ M 1 , φ M 2 ) < τ } { ( M 1 , M 2 ) : M 1 ∼ D M 2 } (1) A Lottery Rate of 35.4% at τ = 0 . 5 means that a practitioner who selects a mo del from the Rashomon set without considering hypothesis class has a greater than one-in-three chance of deplo ying an explanation that a prediction-equiv alen t alternativ e would materially con tradict. Relationship to the Rashomon Set. The Rashomon set R ϵ = { M : L ( M ) ≤ L ( M ∗ ) + ϵ } concerns prediction multiplicit y: mo dels with near-equiv alent accuracy ma y mak e differen t predictions (Breiman, 2001b; Marx et al., 2020). The Explanation Lottery is strictly more constrained: we study explanation m ultiplicity c onditional on pr e diction agr e ement , a condition the Rashomon literature do es not imp ose. Prop osition 1 (Lottery is a Strict Subset of Rashomon) . L ϵ,τ ( x ) ⊊ R ϵ × R ϵ , wher e L ϵ,τ ( x ) = { ( M 1 , M 2 ) ∈ R 2 ϵ : M 1 ( x ) = M 2 ( x ) ∧ ρ ( φ M 1 , φ M 2 ) < τ } . The central question of this pap er is: among prediction-equiv alen t pairs, what determines whether they fall in the Lottery set? Let H M denote the h yp othesis class of model M (e.g., gradient-bo osted trees, logistic regression, neural netw ork). W e distinguish cr oss-class p airs where H M 1 = H M 2 from same-class p airs where H M 1 = H M 2 . W e show hypothesis class is the answ er. 4 Theo retical Foundations The empirical finding raises a natural skeptical question: is the Agreement Gap a training artifact, something that shrinks with more data or b etter hyperparameter tuning, or is it structurally unav oidable? W e pro ve the latter under a specific assumption: that the true data-generating function f ∗ con tains at least one feature in teraction. This assumption is empirically v erifiable, and we measure interaction density across our 24 datasets rather than asserting it, but we do not formally b ound ho w strongly the theorem’s guarantees apply as a function of interaction strength. The result is b est understo o d as a characterization, not a universal law: it identifies exactly the structural condition that pro duces p ersisten t explanation divergence, and shows that condition is satisfied by virtually every real tabular dataset with correlated features. W e are not claiming the theorem explains all explanation disagreement we observe; some of the neural within-class v ariance, for instance, falls outside its scop e. What the theorem do es establish is that the cross-class gap cannot b e attributed to finite samples or sto chastic training, whic h is the claim the empirical findings require theoretical supp ort for. 4.1 Main Result Theorem 1 (Explanation Div ergence Characterization) . L et H tr e e denote the class of tr e e-b ase d mo dels and H line ar the class of line ar mo dels. F or a dataset D dr awn fr om distribution p ( x , y ) with data-gener ating pr o c ess f ∗ , define the A gr e ement Gap : ∆ := ρ intr a ( H tr e e ) − ρ inter ( H tr e e , H line ar ) (2) wher e ρ intr a ( H ) := E M 1 ,M 2 ∼H [ ρ ( φ M 1 , φ M 2 ) | M 1 ∼ D M 2 ] (3) ρ inter ( H 1 , H 2 ) := E M 1 ∼H 1 ,M 2 ∼H 2 [ ρ ( φ M 1 , φ M 2 ) | M 1 ∼ D M 2 ] (4) 4 and M 1 ∼ D M 2 denotes pr e diction e quivalenc e on D . Supp ose f ∗ c ontains at le ast one fe atur e inter action ( i, j ) such that ∂ 2 f ∗ ∂ x i ∂ x j ≡ 0 . Then: 1. (Structur al Gap) ∆ ≥ c > 0 for some c onstant c dep ending on the inter action structur e of f ∗ . 2. (A symptotic Persistenc e) lim |D|→∞ E [∆] ≥ c . The gap do es not vanish with mor e data. 3. (Split Invarianc e) E [∆ | fixe d split ] = E [∆] . The gap is not an artifact of tr aining varianc e. 4. (Inter action Density Monotonicity) L et I ( f ∗ ) := P i = j | α ij | denote the inter action density of f ∗ . Then ∂ E [∆] ∂ I ( f ∗ ) ≥ 0 , with strict ine quality when new inter actions add r ank-r eversal instanc es not alr e ady c over e d. The A gr e ement Gap is monotonic al ly incr e asing in inter action density, pr oviding a dataset-level pr e dictor of explanation instability. The esc ap e c ondition is exact: ∆ = 0 if and only if I ( f ∗ ) = 0 (pur ely additive DGP) or H 1 and H 2 ar e c onstr aine d to identic al function sp ac es (formal ly, H 1 = H 2 in L 2 ( p ) , i.e. b oth classes have the same closur e under the data distribution). In al l other c ases diver genc e is guar ante e d and quantifie d by Claims 1–4. R emark (Gener ality). A lthough the the or em is state d for H tr e e and H line ar for c oncr eteness, the pr o of structur e applies to any two hyp othesis classes H 1 , H 2 such that H 1 = H 2 in L 2 ( p ) . In p articular it applies to neur al hyp othesis classes, which we validate empiric al ly in Se ction 5.4. This theorem characterizes the structural source of explanation div ergence completely . Prediction equiv alence is orthogonal to explanation equiv alence: the conditions that determine ∆ dep end entirely on the in teraction structure of f ∗ and the relative interaction capacity of the h yp othesis classes, not on mo del accuracy . The Agreemen t Gap ∆ directly determines the Explanation Lottery rate and is estimable from data b efore any mo del is trained. 4.2 Pro of Strategy The pro of pro ceeds via four lemmas, with full deriv ations in App endix A. Step 1: SHAP decomp osition by h yp othesis class. Linear and tree mo dels pro duce structurally differen t SHAP v alue patterns due to their different representational constraints. Lemma 1 (Linear SHAP Collapse) . F or any line ar mo del M L ( x ) = w ⊤ x + b , the SHAP value for fe atur e j satisfies: φ j M L ( x ) = w j · ( x j − E [ X j ]) (5) By the linearity axiom of Shapley v alues (Lundb erg & Lee, 2017), the coalition v alue function decomp oses additiv ely for linear mo dels. The marginal contribution of each feature is indep endent of coalition S , collaps- ing to a purely weigh t-scaled deviation from the mean. This means linear SHAP can nev er enco de interaction effects: the attribution for feature i is blind to the v alue of feature j . Lemma 2 (T ree SHAP Interaction A ttribution) . F or tr e e-b ase d mo del M T tr aine d on data wher e f ∗ c ontains inter action ( i, j ) with ∂ 2 f ∗ ∂ x i ∂ x j = 0 , ther e exist instanc es x wher e: φ i M T ( x ) ≈ α ij · ( x i − ¯ x i )( x j − ¯ x j ) + β i ( x i − ¯ x i ) (6) for some α ij = 0 and β i . T ree mo dels partition feature space via axis-aligned splits; when f ∗ dep ends on an in teraction x i · x j , the Ba yes-optimal tree learns splits on both features at successive depths. T reeSHAP av erages marginal con tributions across all ro ot-to-leaf paths (Lundb erg et al., 2020); paths that split on b oth i and j in tro duce a cross-term α ij ( x i − ¯ x i )( x j − ¯ x j ) that has no counterpart in the linear SHAP form ula. 5 Consider a dataset where a binary outcome depends on the product of education and exp erience. An X GBo ost mo del learns this interaction and concentrates SHAP w eight on b oth features jointly . A logistic regression, which cannot represent the pro duct term, learns a linear approximation and distributes w eight across education, exp erience, and correlated proxies. Both mo dels can achiev e identical held-out predictions; their attribution structures are nonetheless functionally different. Step 2: Within-class con vergence. Lemma 3 (Within-Class SHAP Conv ergence) . F or M 1 , M 2 ∈ H tr e e with M 1 ∼ D M 2 , as |D| → ∞ : ρ ( φ M 1 , φ M 2 ) p − → 1 (7) By P AC learning theory (Mohri et al., 2018), both models con verge to the same Bay es-optimal prediction function f ∗ ∈ H tree at rate O ( |D | − 1 / 2 ) : that is, ∥ M i ( x ) − f ∗ ( x ) ∥ L 2 ( p ) → 0 for i = 1 , 2 . Crucially , this con vergence is in prediction space, not in explanation space; we derive explanation conv ergence as a conse- quence, not an assumption. Since SHAP attributions are a deterministic functional of the prediction function (sp ecifically , φ M ( x ) depends only on the mapping x 7→ M ( x ) and the marginal distributions p ( X j ) ), and con vergence of b oth M 1 and M 2 to the same f ∗ implies conv ergence of their SHAP vector s to the same limit φ ∗ . Therefore ρ ( φ M 1 , φ M 2 ) → ρ ( φ ∗ , φ ∗ ) = 1 . This argument do es not require M 1 and M 2 to share the same tree structure; it only requires that they conv erge to the same input-output mapping, which pre- diction equiv alence on growing D guarantees. Empirically , our same-split exp eriment confirms this directly: within-class pairs achiev e ρ = 1 . 000 ± 0 . 000 when training v ariance is eliminated. Step 3: Cross-class div ergence bound. Lemma 4 (Cross-Class A ttribution Bound) . F or pr e diction-e quivalent mo dels M T ∈ H tr e e and M L ∈ H line ar , if f ∗ c ontains inter action ( i, j ) with str ength | α ij | > 0 : lim sup |D|→∞ ρ ( φ M T , φ M L ) ≤ 1 − c · | α ij | (8) for some universal c onstant c > 0 . The in teraction term α ij ( x i − ¯ x i )( x j − ¯ x j ) presen t in the tree’s attribution but absent from the linear mo del’s causes rank reversals on a subset of instances with measure prop ortional to | α ij | . By standard prop erties of rank correlation (Embrec hts et al., 2002), these rank disagreements b ound ρ strictly b elow 1. As |D | → ∞ , b oth mo dels conv erge to their resp ective optimal representations, making b oth bounds tigh ter, not lo oser. Step 4: Main theorem. Com bining Lemmas 3 and 4: ρ intra → 1 while ρ inter ≤ 1 − c · | α ij | , giving ∆ ≥ c · | α ij | =: c ′ > 0 . This gap p ersists asymptotically (Claims 1–2). Claims 3 and 4 follow from the fact that the pro of dep ends only on p opulation prop erties of p ( x , y ) and the hypothesis class constrain ts, not on an y particular data realization, and from the O ( d 2 ) growth of representable interaction terms in trees versus the zero interaction capacity of linear mo dels. The key assumption (that f ∗ con tains at least one feature in teraction) is mild: it is satisfied b y virtually ev ery real tabular dataset with correlated features, and its absence (purely additiv e data-generating pro cesses) w ould make tree and linear mo dels represen tationally equiv alent b y construction. F ull pro ofs in App endix A. 4.3 Empirical Validation Eac h claim of Theorem 1 is directly testable using our exp erimental results. The structural gap ∆ = 0 . 261 is large b y conv entional standards (Cohen’s d = 0 . 92 ) and holds in 23 of 24 datasets after Bonferroni correction. The same-split exp erimen t, which eliminates training v ariance en tirely b y fixing iden tical splits across mo dels, yields ∆ = 0 . 631 with Cohen’s d = 2 . 78 , directly v alidating asymp- totic p ersistence and split in v ariance. The dimensionality effect is visible in the cross-dataset correlation ( r = − 0 . 251 , p < 0 . 001 ): tree-linear agreemen t falls to ρ = 0 . 287 for d > 50 , consistent with the O ( d 2 ) gro wth of in teraction terms a v ailable to trees. 6 T able 1: Empirical v alidation of Theorem 1. Each claim is directly testable; all four are confirmed. Claim Empirical Evidence Section ∆ ≥ c > 0 ∆ = 0 . 261 , p < 0 . 001 , Cohen’s d = 0 . 92 T able 3 Asymptotic p ersistence Same-split: ∆ = 0 . 631 , lottery rate 61.9% Section 5.3 Split inv ariance Within-class ρ = 1 . 000 , cross-class ρ = 0 . 369 Section 5.3 Dimensionalit y effect r = − 0 . 251 , p < 0 . 001 ; ρ inter = 0 . 287 at d > 50 Section 5 5 Exp eriments W e present three experiments addressing the Explanation Lottery from complemen tary angles. Exp eriment 1 establishes the lottery rate across 93,510 pairwise comparisons. Exp eriment 2 identifies hypothesis class as the structural driv er and closes the confound exit with a con trolled same-split proof. Exp eriment 3 sho ws that disagreemen t concentrates in decision-relev ant features, not p eripheral ones. 5.1 Setup Datasets. W e selected 24 datasets from Op enML (V anschoren et al., 2014) and ProPublica (Angwin et al., 2016), spanning 16 application domains (healthcare, finance, criminal justice, physics, NLP , engineering, and others; full list in App endix B). Datasets were chosen to maximize diversit y in dimensionality ( d ∈ [4 , 856] ) and sample size ( n ∈ [208 , 45 , 211] ), ensuring generalizability of findings. The 16 domains span settings where explanations carry regulatory weigh t (healthcare, criminal justice, finance) and settings with no such w eight (physics, game theory), allo wing us to assess whether the lottery rate is domain-sp ecific or general. The wide dimensionality range is delib erate: our theoretical results predict that cross-class explanation div ergence increases with feature in teraction densit y , and high-dimensional datasets tend to exhibit more complex interaction structures; datasets with d < 10 serv e as near-null controls. The fact that the h yp othesis class effect is significant even in low-dimensional settings (23/24 datasets ov erall) confirms the phenomenon is not confined to high-dimensional regimes. W e include six linear mo dels to v alidate that the cross-class disagreement is a prop erty of H linear rather than a specific algorithm: Logistic Regression with L2 regularization (our primary representativ e), RidgeClassifier with λ ∈ { 0 . 1 , 1 . 0 , 10 . 0 } , ElasticNet, and LinearSVM. These mo dels span differen t loss functions (logistic, squared hinge, hinge) and regularization strategies (L2, L1+L2, none). All exhibit the same pattern: high internal agreement within H linear (mean ρ = 0 . 79 , range 0 . 76 – 0 . 83 ) and consistently low agreement with tree mo dels (mean ρ = 0 . 42 , range 0 . 39 – 0 . 47 ). F ull results in App endix H. This confirms the tree-linear gap op erates at the h yp othesis class lev el. Mo dels. W e trained five models from tw o h yp othesis classes. T ree-based ( H tree ): XGBoost (Chen & Guestrin, 2016), LightGBM (Ke et al., 2017), CatBo ost (Prokhorenko v a et al., 2018), and RandomF orest (Breiman, 2001a). Linear ( H linear ): Logistic Regression with L2 regularization. All mo dels used default h yp erparameters to a void optimization bias. Three random seeds (42, 123, 456) and 80/20 train-test splits yielded 360 trained mo dels. A verage test accuracy: X GBo ost (0.827), LightGBM (0.823), CatBo ost (0.825), RandomF orest (0.818), Logistic Regression (0.792), all within the Rashomon set. Explanation computation. T reeSHAP (Lundb erg & Lee, 2017) w as used for tree-based mo dels (exact, deterministic) and KernelSHAP for Logistic Regression (1,000 samples). F or eac h dataset and seed, w e iden tified test instances where all fiv e mo dels agreed on predictions (mean: 68.3% of instances), computed SHAP v alues for all mo dels on these instances, and computed pairwise Sp earman correlations for all 5 2 = 10 mo del pairs, yielding 93,510 total comparisons. Statistical analysis. W e rep ort descriptive statistics, Mann-Whitney U tests, and effect sizes (Cohen’s d , Common Language Effect Size) with b o otstrap confidence interv als (10,000 resamples). T o address pseudo- replication from nested comparisons, we fit a linear mixed-effects mo del with dataset as a random intercept: ρ ij k = β 0 + β 1 I [ tree-linear ] + u k + ϵ ij k . The tree-linear effect remains significant under hierarchical correction ( p < 0 . 001 ; full sp ecification in App endix E). 7 5.2 Exp eriment 1: The Lottery Rate Question: How pr evalent is substantial explanation disagr e ement among pr e diction-e quivalent p airs? Finding. 35.4% of prediction-agreeing mo del pairs exhibit substantial explanation disagree- men t (Sp earman ρ < 0 . 5 ). Ev en at the strict threshold τ = 0 . 3 , 18.0% of pairs disagree severely . The distribution of pairwise correlations is wide (SD = 0 . 293 ), reflecting genuine heterogeneity rather than mea- suremen t noise. The wide confidence in terv als ( ± 0 . 31 at τ = 0 . 5 ) reflect gen uine cross-dataset heterogeneit y: CNAE-9 ( d = 856 NLP features, dense in teractions) has a lottery rate ab ov e 60%, while banknote-auth ( d = 4 , near-linear signal) falls below 20%. This is what Theorem 1 (Claim 1) predicts: the gap should b e larger where the data con tains interactions trees can exploit but linear models cannot; the dataset-lev el pattern matc hes. T able 2: Lottery rates at multiple thresholds. Our primary threshold is τ = 0 . 5 (feature rankings more dissimilar than similar). Metric τ =0 . 3 τ =0 . 4 τ =0 . 5 τ =0 . 6 τ =0 . 7 τ =0 . 8 Lottery Rate 18.0% 25.0% 35.4% 45.7% 57.7% 71.9% 95% CI ± 0.25 ± 0.28 ± 0.31 ± 0.32 ± 0.32 ± 0.29 Ov erall: Mean ρ = 0 . 572 , Median = 0 . 615 , SD = 0 . 293 5.3 Exp eriment 2: Hyp othesis Class as the Structural Driver Question: Is disagr e ement r andom, or do es hyp othesis class pr e dict it? If explanation disagreemen t w ere random noise from retraining v ariance, same-class pairs (X GBo ost vs. Ligh tGBM) and cross-class pairs (XGBoost vs. Logistic Regression) should show similar rates. They do not. T ree-tree pairs ( N = 56 , 106 ): Mean ρ = 0 . 676 , Median = 0 . 729 , SD = 0 . 245 . T ree-linear pairs ( N = 37 , 404 ): Mean ρ = 0 . 415 , Median = 0 . 425 , SD = 0 . 318 . Effect: Difference = 0 . 261 , Mann-Whitney U test p < 0 . 001 , Cohen’s d = 0 . 92 (large effect), Common Language Effect Size = 75 . 1% (a random tree-tree pair has 75% probability of higher agreement than a random tree-linear pair). This effect is robust across all 24 datasets (significan t in 23/24 after Bonferroni correction at α/ 24 ≈ 4 . 2 × 10 − 5 ), all three random seeds (difference v aries only 0.002 across seeds), and under hierarchical mixed- effects correction. T able 3 rev eals a structured pattern that maps precisely onto h yp othesis class mem b ership. Gradient- b o osting v ariants (XGBoost, LightGBM, CatBo ost) cluster at ρ ≈ 0 . 71 – 0 . 73 : these mo dels share sequential residual fitting on decision trees and differ only in regularization and sampling strategy , pro ducing attribution surfaces that are structurally close. RandomF orest sits low er at ρ ≈ 0 . 59 – 0 . 61 despite b eing tree-based. This reflects its parallel bagging strategy rather than sequential b o osting: av eraging ov er decorrelated trees pro duces more diffuse attribution patterns than the concentrated imp ortance typical of gradient b o osting, lo wering within-class agreement without crossing the hypothesis class b oundary . The all-tree vs. Logistic Regression gap ( ρ ≈ 0 . 40 – 0 . 43 ) is the largest in the matrix and is consistent across all four tree mo dels. This gap is the Explanation Lottery: the boundary is at the hypothesis class, not the algorithm. No tree implemen tation closes it. W e also find that agreemen t decreases with dimensionality ( r = − 0 . 251 , p < 0 . 001 ), consistent with The- orem 1 (Claim 4): tree-linear agreemen t drops to ρ = 0 . 287 for d > 50 . High-dimensional settings are particularly susceptible. 8 T able 3: Mean pairwise explanation agreement (Sp earman ρ ). Agreement clusters by hypothesis class: gradien t-b o osting v arian ts (XGB, LGB, Cat) are internally consistent; all tree mo dels agree less with Logistic Regression. X GB LGB Cat RF LR X GBo ost — 0.734 0.712 0.612 0.425 Ligh tGBM — 0.721 0.587 0.415 CatBo ost — 0.595 0.412 RandomF orest — 0.398 Logistic Reg. — Ridge, ElasticNet, and LinearSVM show the same pattern (App endix H): all linear v ariants exhibit ρ = 0 . 76 – 0 . 83 in ternally and ρ = 0 . 39 – 0 . 47 against trees, confirming the gap is a hypothesis class prop erty . The same-split exp erimen t: closing all exits. The large-scale study establishes prev alence; this exp er- imen t establishes cause. T raining v ariance, data splits, and random initialization are the obvious alternative explanations for an y observed explanation gap. W e eliminate all of them simultaneously by fixing identical train-test splits across 20 datasets and comparing XGBoost vs. Logistic Regression (cross-class) against X G- Bo ost vs. XGBoost with different random seeds (within-class). The results are unambiguous. Within-class pairs ac hieve ρ = 1 . 000 ± 0 . 000 with a 0% lottery rate; cross-class pairs achiev e ρ = 0 . 369 ± 0 . 321 with a 61.9% lottery rate (Cohen’s d = 2 . 78 ). T raining v ariance explains nothing: it is literally zero within class. The entire gap is attributable to hypothesis class mem b ership. W e regard this as the pap er’s cen tral empir- ical result. The 93,510-comparison study demonstrates that the effect is prev alent at scale; this exp eriment demonstrates that it is genuinely structural. Figure 1: Distribution of pairwise Sp earman ρ under the controlled same-split exp eriment. Within-class pairs (XGB vs. X GB, LR vs. LR) concen trate at ρ = 1 . 000 ; cross-class pairs (XGB vs. LR) spread across the full range with median ρ = 0 . 364 , well b elow the lottery threshold ( τ = 0 . 5 , dashed line). The structural gap ∆ = 0 . 636 directly v alidates Theorem 1 (Claims 1–2): the Agreement Gap is b ounded a wa y from zero and p ersists when training v ariance is eliminated. 9 5.4 Exp eriment 2b: Three-W ay Hyp othesis Class Comparison Question: Is the Explanation L ottery sp e cific to the tr e e–line ar b oundary, or do es it gener alise to neur al hyp othesis classes? Finding. The lottery is a universal prop ert y of crossing h yp othesis class b oundaries, not a tree–linear arte- fact. W e extend the con trolled comparison to three h yp othesis classes: tree-based mo dels (XGBoost, Random F orest), linear mo dels (Logistic Regression, Ridge), and neural netw orks (MLP). Results are summarised in T able 4. T able 4: Mean Sp earman ρ and lottery rate across all pairwise hypothesis class comparisons. Intra-class pairs consisten tly ac hieve high agreement; ev ery cross-class b oundary indep endently pro duces the Explanation Lottery . Comparison T yp e Mean ρ Lottery Rate Linear vs. Linear Intra-class 0.827 6.7% T ree vs. T ree In tra-class 0.717 10.0% Neural vs. Neural Intra-class 0.552 34.4% Linear vs. T ree Cross-class 0.525 40.1% Neural vs. T ree Cross-class 0.509 48.8% Linear vs. Neural Cross-class 0.509 46.9% The intra–cross pattern holds at every b oundary: all three cross-class comparisons indep endently exceed the lottery threshold while all three intra-class comparisons remain b elow it, directly v alidating Theorem 1’s Remark that the result applies to an y t wo classes with H 1 = H 2 in L 2 ( p ) . The within-neural lottery rate (34.4%) deserves explicit discussion: it is higher than within-tree (10.0%) or within-linear (6.7%), and in some comparisons approaches the cross-class rates. This does not con tradict the h yp othesis class accoun t; it refines it. Neural netw orks with identical architecture satisfy H 1 = H 2 in L 2 ( p ) , so the theorem’s escap e condition holds and no structural gap is predicted. The elev ated within-neural rate instead reflects the well- do cumen ted sensitivity of gradient-based optimization to initialization and training order (W atson et al., 2022): tw o MLPs trained on the same data can reac h different lo cal optima that pro duce similar predictions but different attribution patterns. This is within-class v ariance of a differen t kind than the structural cross- class div ergence the theorem characterizes, and it do es not scale with dataset in teraction densit y the w ay cross-class divergence do es. The practical implication is that R ( x ) is esp ecially imp ortant for neural mo dels precisely b ecause b oth structural and sto chastic sources of explanation instabilit y are presen t. 5.5 Exp eriment 3: Consequential Disagreement Question: Is disagr e ement happ ening in de cision-r elevant fe atur es, or is it c onfine d to low-imp ortanc e noise fe atur es? Finding. Lottery disagreemen t concentrates in decision-relev ant features, not p eripheral ones: 76.8% of prediction-equiv alent pairs differ on at least one top-3 feature. If the Explanation Lottery only affected p eripheral features, its practical significance w ould b e limited. W e test this by analyzing whether lottery cases in volv e changes to the top-3 SHAP features, the features most lik ely to driv e h uman interpretation and regulatory review, across all 93,510 pairwise comparisons. Ov erall. Across 20 datasets, 76.8% of all prediction-equiv alent pairs hav e at least one top-3 feature that dif- fers b et ween mo dels (partial disagreemen t), and 8.0% share no top-3 features at all (complete disagreement). Among tree-linear pairs sp ecifically , 87.6% show partial disagreemen t and the lottery rate reaches 55.6%. Disagreemen t in the Explanation Lottery is not confined to marginal features; it is happ ening precisely where practitioners and regulators lo ok. A dult/Census case study . W e analyze the Adult income dataset (V anschoren et al., 2014) as a high- stak es case study in volving demographic and socio economic features with direct fairness implications. F or 200 instances predicted identically by XGBoost and Logistic Regression, 99.5% hav e at least one top-3 feature 10 that differs betw een mo dels. X GBo ost consistently identifies marital-status, relationship, and o ccupation as the primary driv ers; Logistic Regression consistently identifies education-num, sex, and age. These are not minor reorderings; they are fundamentally differen t accounts of what driv es the prediction, with distinct implications for fairness auditing and recourse. When sex app ears in Logistic Regression’s top-3 but not X GBo ost’s, a fairness audit using the logistic regression explanation will flag a p otential sex-based attribution; the same audit using the XGBoost explanation will not, even though b oth mo dels agreed on the prediction. An individual seeking recourse under a model citing marital-status faces a different path than one facing an explanation citing age or sex; yet b oth face the same classification outcome. The hypothesis class c hoice is not a technical detail: it has direct implications for which features are implicated in explaining a consequential outcome, and therefore for b oth fairness auditing and individual recourse. COMP AS comparison. The same pattern holds on COMP AS (Angwin et al., 2016): the primary driv er flips from prior con victions (XGBoost, 38%) to age (Logistic Regression, 42%) for defendants predicted high- risk by b oth models, with a lottery rate of 39.7%. Both explanations are mathematically correct. Neither is wrong. Which features the defendant is told drov e their assessment dep ends entirely on which hypothesis class the practitioner selected. Sto c hasticity con trol. T o confirm disagreement is mo del-driven rather than estimation noise: within- mo del SHAP v ariance (T reeSHAP run 10 times on the same input) = 0 . 000 (deterministic); cross-mo del v ariance = 0 . 145 ( 21 . 6 × larger). Disagreement reflects genuine mo del differences, not sampling artefacts (App endix D). Metho d indep endence. W e replicated findings using LIME on five datasets. The same directional pattern holds: tree-tree > tree-linear (gap = 0 . 078 with LIME vs. 0 . 261 with SHAP). The smaller LIME gap reflects its lo cal linear approximation mec hanism, whic h partially reduces h yp othesis class differences b y construction. F ull results in App endix C. 6 Reliabilit y Score Theorem 1 characterizes the gap at the hypothesis class level; it says nothing ab out which sp ecific instances are affected. This section in tro duces the Explanation Reliability Score R ( x ) as a practical response to that p er-instance question. W e state upfron t what it is and is not: R ( x ) is an empirically v alidated heuristic with no formal statistical guarantees. The thresholds we derive are calibrated to our exp erimental distribution; applying them to a new deplo yment setting requires care. W e nonetheless b elieve it is useful precisely b ecause the alternative, rep orting a single mo del’s explanation as if it were the unique correct answ er, is worse than ac knowledging uncertain ty . Definition. F or instance x and a set of k prediction-equiv alen t models { M 1 , . . . , M k } , define: R ( x ) = 2 k ( k − 1) X i 0 . 7 : high agreemen t; the explanation is likely stable across architec- tures and can b e reported with confidence. R ( x ) ∈ [0 . 5 , 0 . 7] : mo derate agreemen t; the explanation should b e treated as ten tative; disclosure of uncertaint y is recommended. R ( x ) < 0 . 5 : low agreement; the practi- tioner should not treat an y single explanation as definitiv e; the instance falls in the Lottery . Implementation requires no additional training and works p ost-ho c on an y existing model ensem ble; see App endix F. In deplo yment, R ( x ) requires a reference ensemble of prediction-equiv alent mo dels; practitioners can construct this during mo del selection b efore committing to a single deploy ed mo del, or use it as a p ost-ho c audit to ol when m ultiple candidate mo dels are av ailable. W e ackno wledge this creates an implementation gap for settings where only one mo del has b een trained; in such cases R ( x ) serv es as an audit criterion rather than a real-time gate. W orked example. Consider a defendant from COMP AS predicted high-risk b y all five mo dels. XGBoost assigns SHAP weigh ts (0 . 38 , 0 . 24 , 0 . 18 , 0 . 11 , 0 . 09) to (prior convictions, age, charge degree, juvenile felonies, 11 sex); Logistic Regression assigns (0 . 42 , 0 . 29 , 0 . 16 , 0 . 08 , 0 . 05) to (age, prior convictions, sex, c harge degree, race). Sp earman correlation b et w een these tw o v ectors: ρ = 0 . 30 . With five mo dels, the pairwise a verage across all 10 pairs yields R ( x ) = 0 . 38 . Since R < 0 . 5 , this instance falls in the lo w-reliability zone: no single mo del’s explanation should b e rep orted as the official reason for the classification. A practitioner using R as a disclosure gate would route this case to human review rather than delivering any mo del’s explanation directly . Threshold deriv ation. The thresholds ( R > 0 . 7 , 0 . 5 – 0 . 7 , < 0 . 5 ) are empirically derived from the leav e- one-out v alidation distribution. Instances with R > 0 . 7 corresp ond to the upp er quartile of agreement scores and show 89.2% probability of agreement with a held-out fifth model. Instances with R < 0 . 5 show 34.1% probability , barely ab ov e the baseline for random top-feature ov erlap. The 0 . 5 b oundary aligns with the Sp earman τ = 0 . 5 threshold used throughout the experimental study , making R directly in terpretable relativ e to the Lottery Rate definition. V alidation. Using leav e-one-out analysis (compute R ( x ) from four mo dels, test on held-out fifth), high- reliabilit y instances ( R > 0 . 7 ) show 89.2% probabilit y of agreement with a new mo del; lo w-reliability in- stances ( R < 0 . 5 ) show 34.1% probabilit y , barely ab ov e chance. R ( x ) is a reliable predictor of explanation stabilit y and a practically viable disclosure criterion: rep ort an explanation when R ( x ) > 0 . 7 ; flag uncertain ty when R ( x ) < 0 . 5 . 7 Discussion The clearest result in this pap er is the same-split exp erimen t: ρ = 1 . 000 within h yp othesis class, 61.9% lottery rate across it, with training v ariance eliminated en tirely . That result needs no theorem to support it. The large-scale study then establishes that the effect appears at the same magnitude across 24 datasets, 93,510 comparisons, and three hypothesis classes. These t wo findings together make the structural claim comp elling, w e think, though w e are careful about what “structural” means here. Theorem 1 provides a formal mechanism: the gap is driven by the in teraction structure of f ∗ , not by sto chastic training choices. But the theorem is conditional on interaction structure b eing present, and we measure rather than formally b ound that condition in our datasets. What the COMP AS result do es and does not show. The finding that prior convictions (XGBoost, 38%) flips to age (Logistic Regression, 42%) as the primary driv er for iden tically-classified defendan ts is striking. W e are, admittedly , drawing on one dataset and one deploymen t context. W e c hose COMP AS b ecause it is well-studied and the feature attribution stakes are unusually legible, not b ecause w e b elieve it is representativ e of all high-stakes settings. The qualitative p oint, that identical predictions from differen t h yp othesis classes can assign accoun tability to different features, lik ely holds b eyond recidivism prediction; whether the magnitude is similar elsewhere is an empirical question w e cannot answ er here. The neural net work result is gen uinely complicated. Within-neural agreement ( ρ = 0 . 552 , 34.4% lottery rate) sits b et w een the clean within-class v alues for trees and linear mo dels and the cross-class v alues. This do es not fit neatly into the h yp othesis class story . Our in terpretation, that this reflects optimization sto c hasticity rather than h yp othesis class b oundary crossing, is plausible and consistent with the H 1 = H 2 condition, but we susp ect a more complete account would need to distinguish b etw een the structural gap the theorem characterizes and a second source of instabilit y sp ecific to gradien t-based optimization. W e hav e not done that analysis. The within-neural result is a limitation of the current account, not merely a footnote. Mo del selection as an explanation choice. The “complementary views” argumen t, that different ar- c hitectures simply capture different asp ects of the same signal, is worth taking seriously b efore dismissing. It fails, w e think, for a specific reason: R ( x ) discriminates sharply betw een stable and unstable instances (89.2% vs. 34.1%), which means the disagreemen t is not uniformly distributed across the instance space the w ay a gen uine complementarit y account w ould predict. Complemen tary views would produce interpretable structured differences; what w e observ e is a lottery , with disagreement concentrated where the instance sits near a decision b oundary shared differently by the tw o h yp othesis classes. That said, this argument is based 12 on aggregate patterns. An individual practitioner choosing betw een tree and linear mo dels for a sp ecific dataset migh t genuinely find the disagreement informative rather than problematic. R ( x ) as a heuristic, not a guaran tee. R ( x ) is an empirically v alidated heuristic. The thresholds (0.5 and 0.7) are derived from leav e-one-out v alidation on our datasets and hav e no formal statistical guarantees; a practitioner applying them to a new deploymen t context would b e extrap olating from our empirical dis- tribution. W e rep ort the v alidation results (89.2%, 34.1%) honestly , but these num b ers come from the same datasets used to derive the thresholds, which limits how strongly we should claim the heuristic generalizes. It is a deploy able diagnostic in the sense that it requires no additional training and pro duces a useful signal; it is not a certified audit to ol. Generalization. Preliminary MNIST results (App endix G) yield 32.2%, close to the tabular finding, but at muc h smaller scale and without the con trolled same-split design. W e v alidated across six linear v ariants to sho w the gap is not tunable within a hypothesis class; it ranges 0 . 39 – 0 . 47 vs. 0 . 76 – 0 . 83 internally . Whether the finding extends to transformers, language mo dels, or multi-class settings remains op en. W e susp ect it do es, giv en the mechanism, but suspicion is not evidence. Limitations. This study is confined to tabular binary classification and SHAP attributions. LIME results are directionally consistent but smaller in magnitude, which raises the question of whether the Lottery rate is partly a SHAP-sp ecific phenomenon. R ( x ) requires an ensemble of prediction-equiv alent mo dels, which is only av ailable at mo del selection time; single-model deplo yment settings cannot use it as a real-time gate, only as a retrosp ectiv e audit. Extending the analysis to large language mo dels and transformers, where the h yp othesis class geometry is less clean, is the most imp ortant op en direction. 8 Conclusion The central claim of this pap er is that prediction equiv alence do es not imply explanation equiv alence, and that the gap b etw een them is determined b y hypothesis class membership rather than by sto c hastic training noise. The same-split experiment supp orts this claim most directly: ρ = 1 . 000 within class, 61.9% lottery rate across class, with training v ariance eliminated b y design. The 93,510-comparison study shows the effect is prev alent at scale. Theorem 1 provides a mechanism under the assumption that in teraction structure is presen t in f ∗ , whic h we measure across our datasets but do not formally b ound in general. What w e are confident ab out: the cross-class attribution gap is large (Cohen’s d = 0 . 92 ), robust to the same-split con trol ( d = 2 . 78 ), present across tree, linear, and neural h yp othesis classes, and concentrated in features that practitioners and regulators attend to. What w e are more cautious about: the COMP AS result is one dataset; the neural within-class v ariance (34.4%) complicates the hypothesis class accoun t and p oin ts tow ard a source of instabilit y our theorem do es not address; R ( x ) is a heuristic calibrated to our exp erimen tal distribution, not a formally certified diagnostic. The practical implication is that mo del selection is an explanation choice. A practitioner who selects a tree mo del ov er a linear mo del on accuracy grounds is also, implicitly , c ho osing whic h features will b e cited as the reasons for predictions. Whether current practice adequately ackno wledges this is a go vernance question w e leav e to others; our con tribution is the measurement and the to ol that makes the question empirically tractable. Broader Impact Statement This work rev eals that mac hine learning explanations are less stable than commonly assumed when models are selected from differen t hypothesis classes. W e b eliev e identifying the problem is a prerequisite to addressing it. R ( x ) provides one practical mechanism for disclosure, though it is a starting p oint rather than a solution. W e see no direct risks of misuse; our findings increase scrutiny of explanation practices rather than reducing it. 13 References Chirag Agarw al et al. Op enXAI: T ow ards a transparen t ev aluation of mo del explanations. In A dvanc es in Neur al Information Pr o c essing Systems , 2022. Julia Angwin, Jeff Larson, Surya Mattu, and Lauren Kirc hner. Mac hine bias. Pr oPublic a, May , 23(2016): 139–159, 2016. Solon Baro cas, Moritz Hardt, and Arvind Naray anan. F airness and Machine L e arning: Limitations and Opp ortunities . fairmlb o ok.org, 2019. Chama Bensmail. EvoXplain: When mac hine learning models agree on predictions but disagree on why— measuring mec hanistic multiplicit y across training runs. arXiv pr eprint arXiv:2512.22240 , 2025. Leo Breiman. Random forests. Machine le arning , 45(1):5–32, 2001a. Leo Breiman. Statistical mo deling: The t wo cultures. Statistic al scienc e , 16(3):199–231, 2001b. Tianqi Chen and Carlos Guestrin. Xgb o ost: A scalable tree bo osting system. In Pr o c e e dings of the 22nd acm sigkdd international c onfer enc e on know le dge disc overy and data mining , pp. 785–794, 2016. Finale Doshi-V elez and Been Kim. T ow ards a rigorous science of interpretable machine learning. arXiv pr eprint arXiv:1702.08608 , 2017. P aul Embrec hts, Alexander McNeil, and Daniel Straumann. Correlation and dep endence in risk managemen t: prop erties and pitfalls. Risk Management: V alue at Risk and Beyond , pp. 176–223, 2002. Europ ean Parliamen t and Council. General data protection regulation. Official Journal of the Eur op e an Union , 2016. Regulation (EU) 2016/679. Anna Hedström et al. Quan tus: An explainability to olkit for responsible ev aluation of neural net work explanations and b eyond. Journal of Machine L e arning R ese ar ch , 24(34):1–11, 2023. Hyunseung Hwang, Seungeun Lee, Lucas Rosenblatt, Julia Stoy anovic h, and Steven Euijong Whang. Expla- nation m ultiplicit y in SHAP: Characterization and assessment. arXiv pr eprint arXiv:2601.12654 , 2026. Amir-Hossein Karimi, Bernhard Sc hölkopf, and Isab el V alera. Algorithmic recourse: from counterfactual explanations to interv en tions. In Pr o c e e dings of the A CM Confer enc e on F airness, A c c ountability, and T r ansp ar ency , pp. 353–362, 2021. Guolin Ke, Qi Meng, Thomas Finley , T aifeng W ang, W ei Chen, W eidong Ma, Qiw ei Y e, and Tie-Y an Liu. Ligh tgbm: A highly efficien t gradien t bo osting decision tree. A dvanc es in neur al information pr o c essing systems , 30, 2017. Sat yapriy a Krishna, T essa Han, Alex Gu, Javin P om bra, Shahin Jabbari, Stev en W u, and Himabindu Lakkara ju. The disagreemen t problem in explainable mac hine learning: A practitioner’s persp ective. arXiv pr eprint arXiv:2202.01602 , 2022. Gabriel Lab erge, Y ann Pequignot, Alexandre Mathieu, F outse Khomh, and Mario Marc hand. P artial order in chaos: Consensus on feature attributions in the Rashomon set. Journal of Machine L e arning R ese ar ch , 24(364):1–50, 2023. Zac hary C. Lipton. The mythos of mo del interpretabilit y . Queue , 16(3):31–57, 2018. Scott M Lundb erg and Su-In Lee. A unified approach to in terpreting mo del predictions. In A dvanc es in neur al information pr o c essing systems , pp. 4765–4774, 2017. Scott M Lundberg, Gabriel Erion, Hugh Chen, Alex DeGra v e, Jordan M Prutkin, Bala Nair, Ronit Katz, Jonathan Himmelfarb, Nisha Bansal, and Su-In Lee. F rom lo cal explanations to global understanding with explainable AI for trees. Natur e Machine Intel ligenc e , 2(1):56–67, 2020. 14 Alexander Marx, Flavio Calmon, and Berk Ustun. Predictive multiplicit y in classification. International Confer enc e on Machine L e arning , pp. 6765–6774, 2020. Mehry ar Mohri, Afshin Rostamizadeh, and Ameet T alwalkar. F oundations of Machine L e arning . MIT Press, 2nd edition, 2018. Liudmila Prokhorenko v a, Gleb Gusev, Aleksandr V orob ev, Anna V eronika Dorogush, and Andrey Gulin. Catb o ost: un biased b o osting with categorical features. A dvanc es in neur al information pr o c essing systems , 31, 2018. Marco T ulio Rib eiro, Sameer Singh, and Carlos Guestrin. " why should i trust y ou?" explaining the predictions of any classifier. In Pr o c e e dings of the 22nd A CM SIGKDD international c onfer enc e on know le dge disc overy and data mining , pp. 1135–1144, 2016. Cyn thia R udin. Stop explaining black b o x mac hine learning mo dels for high stak es decisions and use inter- pretable mo dels instead. Natur e Machine Intel ligenc e , 1(5):206–215, 2019. Joaquin V anschoren, Jan N V an Rijn, Bernd Bisc hl, and Luis T orgo. Op enml: netw orked science in machine learning. A CM SIGKDD Explor ations Newsletter , 15(2):49–60, 2014. Sandra W ach ter, Brent Mittelstadt, and Luciano Floridi. Coun terfactual explanations without op ening the blac k b ox: Automated decisions and the gdpr. Harvar d Journal of L aw & T e chnolo gy , 31(2):841–887, 2017. Matthew W atson, Bashar A wwad Shiekh Hasan, and Noura Al Moubay ed. Agree to disagree: When deep learning mo dels with iden tical architectures pro duce distinct explanations. In Pr o c e e dings of the IEEE/CVF Winter Confer enc e on A pplic ations of Computer V ision (W A CV) , pp. 875–884, 2022. A Complete Pro ofs This app endix provides complete formal pro ofs of all theoretical results from Section 4. A.1 Pro of of Prop osition 1 (Lottery is a Strict Subset of Rashomon) The Lottery set requires b oth prediction agreement and substantial explanation disagreement. The Rashomon set contains pairs that disagree on predictions (so they cannot be in the Lottery set) and pairs that agree on predictions but also agree on explanations (so they fail the disagreement condition). Both strict inclusions hold by construction. In our exp eriments, 100% of pairs are in the Rashomon set but only 35.4% are in the Lottery set, confirming the strict inclusion empirically . A.2 Pro of of Lemma 1: Linear SHAP Collapse Pr o of. The SHAP v alue is defined as the Shapley v alue of the coalition game where the v alue function is: v ( S ) = E [ M L ( x ) | X S = x S ] (10) F or linear mo dels: v ( S ) = E " d X i =1 w i X i + b | X S = x S # (11) = X i ∈ S w i x i + X i / ∈ S w i E [ X i ] + b (12) The marginal contribution of feature j to coalition S is: v ( S ∪ { j } ) − v ( S ) = w j ( x j − E [ X j ]) (13) 15 This quantit y is indep endent of coalition S . The Shapley v alue is the weigh ted a v erage ov er all coalitions: φ M L j ( x ) = X S ⊆ [ d ] \{ j } | S | !( d − | S | − 1)! d ! · w j ( x j − E [ X j ]) = w j ( x j − E [ X j ]) (14) where the sum of binomial co efficients equals 1 by the Shapley axioms. A.3 Pro of of Lemma 2: T ree SHAP Interaction A ttribution Pr o of. Consider a binary classification tree T trained on data generated by y = f ∗ ( x i , x j ) = I [ x i · x j > τ ] for some threshold τ . This in teraction is not represen table by any linear mo del. T reeSHAP computes attributions by av eraging marginal contributions across all ro ot-to-leaf paths (Lundb erg et al., 2020): φ T i ( x ) = X S ⊆ [ d ] \{ i } | S | !( d − | S | − 1)! d ! v ( S ∪ { i } ) − v ( S ) (15) where v ( S ) = E [ M T ( x ) | X S = x S ] . F or paths that split on b oth i and j at successive depths, the marginal contribution of i given coalition S ∋ j differs from its contribution given S ∋ j : v ( { i, j } ) − v ( { j } ) = E [ M T | x i , x j ] − E [ M T | x j ] (16) v ( { i } ) − v ( ∅ ) = E [ M T | x i ] − E [ M T ] (17) When f ∗ dep ends on x i · x j , these tw o quan tities are unequal for a non-negligible set of instances: sp ecifically , v ( { i, j } ) − v ( { j } ) = v ( { i } ) − v ( ∅ ) whenev er x j mo dulates the informativeness of x i ab out y . This non-equality is the definition of a Shapley interaction effect (Lundb erg & Lee, 2017). By the optimality of tree construction on interaction data (Breiman, 2001a), the Bay es-optimal tree allo cates splits to b oth i and j , ensuring that paths con taining b oth features carry strictly p ositiv e w eigh t in the Shapley av erage. The resulting SHAP v alue for feature i therefore contains a term that dep ends on x j – a dep endency that is structurally absent from the linear SHAP form ula φ i M L = w i ( x i − E [ X i ]) . W e denote this x j -dep enden t component α ij ( x j ) , writing: φ i M T ( x ) = α ij ( x j ) · ( x i − ¯ x i ) + β i ( x i − ¯ x i ) (18) where α ij ( x j ) ≡ 0 when the in teraction signal is strong. This generalizes to tree ensembles by linearity of exp ectations o v er trees in the ensemble. A.4 Pro of of Lemma 3: Within-Class SHAP Convergence Pr o of. W e do not require M 1 and M 2 to con verge to the same tree structure – tw o trees can differ in split order, depth, and leaf v alues while pro ducing identical predictions. Instead we work directly from prediction equiv alence and the structure of T reeSHAP . Step 1: Prediction equiv alence under p . By P AC learning theory (Mohri et al., 2018), b oth mo dels con verge in risk at rate O ( n − 1 / 2 ) . Since M 1 ∼ D M 2 and b oth achiev e v anishing excess risk, for any ϵ > 0 there exists N such that for n > N : Pr p [ M 1 ( x ) = M 2 ( x )] < ϵ (19) Step 2: Conditional exp ectations con verge. T reeSHAP computes φ T i ( x ) from conditional exp ectations v ( S ) = E [ M T ( x ) | X S = x S ] (Lundb erg et al., 2020). When Pr p [ M 1 ( x ) = M 2 ( x )] → 0 , the conditional exp ectations v 1 ( S ) → v 2 ( S ) for all S ⊆ [ d ] , b ecause each v i ( S ) is an av erage of M i ( x ) ov er the marginal distribution of X ¯ S . 16 Step 3: SHAP v ectors conv erge. Since T reeSHAP is a deterministic w eighted sum of v ( S ∪ { i } ) − v ( S ) terms, and v 1 ( S ) → v 2 ( S ) for all S : ∥ φ M 1 ( x ) − φ M 2 ( x ) ∥ 2 p − → 0 (20) Step 4: Rank correlation con verges. Sp earman rank correlation is con tinuous in the L 2 norm on b ounded domains. Therefore: ρ ( φ M 1 , φ M 2 ) p − → 1 as n → ∞ (21) A.5 Pro of of Lemma 4: Cross-Class Attribution Bound Pr o of. As |D | → ∞ , b oth mo dels con v erge to their optimal represen tations: M T → M ∗ T and M L → M ∗ L . By Lemmas 1 and 2: φ i M ∗ T ( x ) ≈ α ij ( x i − ¯ x i )( x j − ¯ x j ) + β i ( x i − ¯ x i ) (22) φ i M ∗ L ( x ) = w i ( x i − E [ X i ]) (23) Define the rank-reversal set: X flip := n x : sign ( φ i M ∗ T ( x )) = sign ( φ i M ∗ L ( x )) o . When | α ij | > 0 and features ( i, j ) are not p erfectly collinear, the interaction term dominates on a set of instances with measure: µ ( X flip ) ≥ c 1 · | α ij | (24) for some c 1 > 0 dep ending on the cov ariance of ( X i , X j ) , under the regularity conditions that ( X i , X j ) hav e finite second momen ts and | Corr( X i , X j ) | < 1 (features not p erfectly collinear), ensuring the interaction term takes b oth p ositiv e and negative v alues with probabilit y b ounded aw ay from zero. By rank correlation b ounds (Em brec hts et al., 2002): ρ ( φ M ∗ T , φ M ∗ L ) ≤ 1 − c 2 · µ ( X flip ) ≤ 1 − c · | α ij | (25) where c = c 1 · c 2 > 0 . Since the bound holds for the optimal models and finite-sample models conv erge to these optima, the b ound p ersists asymptotically . A.6 Pro of of Theorem 1: Cross-Class Attribution Divergence Pr o of. Claim 1 (Structural Gap). F rom Lemma 3, ρ intra → 1 as |D| → ∞ . F rom Lemma 4, ρ inter ≤ 1 − c · | α ij | . Therefore: ∆ = ρ intra − ρ inter ≥ 1 − (1 − c · | α ij | ) = c · | α ij | =: c ′ > 0 (26) Claim 2 (Asymptotic P ersistence). Both b ounds hold asymptotically , so lim |D|→∞ E [∆] ≥ c ′ > 0 . Claim 3 (Split Inv ariance). The pro ofs of Lemmas 3 and 4 dep end only on p ( x , y ) and hypothesis class constrain ts, not on the sp ecific training set realization. Therefore E [∆ | fixed split ] = E [∆] . Claim 4 (In teraction Densit y Monotonicit y). Let I ( f ∗ ) = P i = j | α ij | . By Lemma 4, each interaction ( i, j ) with | α ij | > 0 contributes a rank-reversal set X ij flip of measure ≥ c ij | α ij | . The total rank-reversal measure is: µ [ ( i,j ) X ij flip ≥ max ( i,j ) c ij | α ij | (27) and is non-decreasing as I ( f ∗ ) grows, since adding interactions adds rank-reversal instances without removing existing ones. By the rank correlation b ound of Lemma 4, ρ inter is non-increasing in I ( f ∗ ) , giving ∂ E [∆] ∂ I ( f ∗ ) ≥ 0 , with strict inequality when new interactions con tribute instances not already in the union. Empirically: banknote-auth ( d = 4 , near-linear, I low, lottery rate 12.3%) vs. CNAE-9 ( d = 856 , dense interactions, lottery rate 61.4%) directly confirms this monotonicity . 17 B Complete Dataset Details T able 5: Complete dataset sp ecifications used in this study . Dataset n d Acc. Domain Source diab etes 768 8 0.781 Healthcare Op enML-37 breast-cancer 699 9 0.967 Healthcare Op enML-13 heart-disease 303 13 0.843 Healthcare Op enML-43 credit-g 1,000 20 0.764 Finance Op enML-31 credit-appro v al 690 15 0.870 Finance Op enML-29 bank-mark eting 45,211 16 0.899 Finance Op enML-1461 COMP AS 7,214 7 0.672 Criminal Justice ProPublica phoneme 5,404 5 0.892 Linguistics Op enML-1489 spam base 4,601 57 0.937 NLP Op enML-44 ionosphere 351 34 0.914 Physics Op enML-59 sonar 208 60 0.846 Physics Op enML-40 v ehicle 846 18 0.819 Computer Vision Op enML-54 segmen t 2,310 19 0.973 Computer Vision Op enML-36 w av eform-5000 5,000 40 0.860 Physics Op enML-60 optdigits 5,620 64 0.988 Computer Vision Op enML-28 mfeat-factors 2,000 216 0.982 Computer Vision Op enML-12 kr-vs-kp 3,196 36 0.993 Game Theory Op enML-3 m ushro om 8,124 22 1.000 Biology OpenML-24 tic-tac-to e 958 9 0.984 Game Theory Op enML-50 CNAE-9 1,080 856 0.943 NLP OpenML-1468 steel-plates-fault 1,941 33 0.787 Engineering Op enML-1504 banknote-auth. 1,372 4 1.000 Finance Op enML-1462 climate-sim ulation 540 20 0.933 Climate Science OpenML-1467 ozone-lev el 2,536 72 0.972 Environmen tal Op enML-1487 C LIME V alidation W e v alidated findings using LIME (Rib eiro et al., 2016) on fiv e datasets (diab etes, credit-g, COMP AS, phoneme, v ehicle). LIME generates 5,000 p erturb ed samples p er instance and fits weigh ted local linear mo dels. Results: tree-tree mean ρ = 0 . 658 , tree-linear mean ρ = 0 . 580 , gap = 0 . 078 . The directional pattern holds (tree-tree > tree-linear), confirming the Explanation Lottery is not SHAP-sp ecific. The smaller gap reflects LIME’s lo cal linear approximation mechanism, which reduces hypothesis class differences b y construction. D Sto chasticit y Control Within-mo del SHAP v ariance (T reeSHAP run 10 times on same input): σ 2 within = 0 . 000 (p erfectly determin- istic). KernelSHAP within-mo del v ariance: σ 2 within = 0 . 007 . Cross-model v ariance: σ 2 cross = 0 . 145 ( 21 . 6 × larger). Disagreement reflects genuine mo del differences, not estimation noise. E A dditional Statistical Details Bonferroni correction: Corrected threshold α/ 24 ≈ 4 . 2 × 10 − 5 . T ree-tree vs. tree-linear difference is significan t in 23/24 datasets. Bo otstrap CIs: 10,000 resamples. Main effect (difference = 0 . 261 ): 95% CI = [0 . 257 , 0 . 265] . P ow er: Post-hoc p ow er > 0 . 99 ( N 1 = 56 , 106 , N 2 = 37 , 404 , Cohen’s d = 0 . 92 , α = 0 . 001 ). 18 T rimmed means: Excluding top/b ottom 10%: difference = 0 . 258 (virtually identical to un trimmed). Mixed-effects mo del: Dataset-level v ariance σ 2 dataset = 0 . 074 ; residual v ariance σ 2 residual = 0 . 045 . T ree- linear effect remains p < 0 . 001 under hierarchical correction. F Reliabilit y Score Implementation import numpy as np from scipy.stats import spearmanr def reliability_score(shap_values_list): """ Compute R(x): mean pairwise Spearman correlation across prediction-equivalent models. R > 0.7: high stability. R < 0.5: low stability. """ k = len(shap_values_list) if k < 2: return 1.0 correlations = [] for i in range(k): for j in range(i + 1, k): rho, _ = spearmanr( shap_values_list[i], shap_values_list[j] ) correlations.append(rho) return float(np.mean(correlations)) G Prelimina ry Non-T abular Extension (MNIST) As a preliminary exploration of generalizability b eyond tabular data, we applied the same pip eline to MNIST digit classification. Lottery rate: 32.2%. W e note this result is preliminary and not at the scale or rigor of the main tabular study . Extension to non-tabular mo dalities is future w ork. H Linea r Mo del V a riants W e v alidated that the cross-class attribution gap op erates at the hypothesis class lev el by testing six linear mo del v ariants: Logistic Regression with L2 regularization (primary representativ e), RidgeClassifier with λ ∈ { 0 . 1 , 1 . 0 , 10 . 0 } , ElasticNet, and LinearSVM. These span three loss functions (logistic, squared hinge, hinge) and three regularization strategies (L2, L1+L2, none). All six v ariants exhibit the same pattern: high internal agreement within H linear (mean ρ ∈ [0 . 76 , 0 . 83] ) and consisten tly low agreement against tree models (mean ρ ∈ [0 . 39 , 0 . 47] ). No linear v ariant closes the tree-linear gap regardless of regularization strength or loss function, confirming that the gap is a hypothesis class prop ert y , not an algorithmic artefact. 19
Original Paper
Loading high-quality paper...
Comments & Academic Discussion
Loading comments...
Leave a Comment