Optimizing Task Completion Time Updates Using POMDPs
Managing announced task completion times is a fundamental control problem in project management. While extensive research exists on estimating task durations and task scheduling, the problem of when and how to update completion times communicated to …
Authors: Duncan Eddy, Esen Yel, Emma Passmore
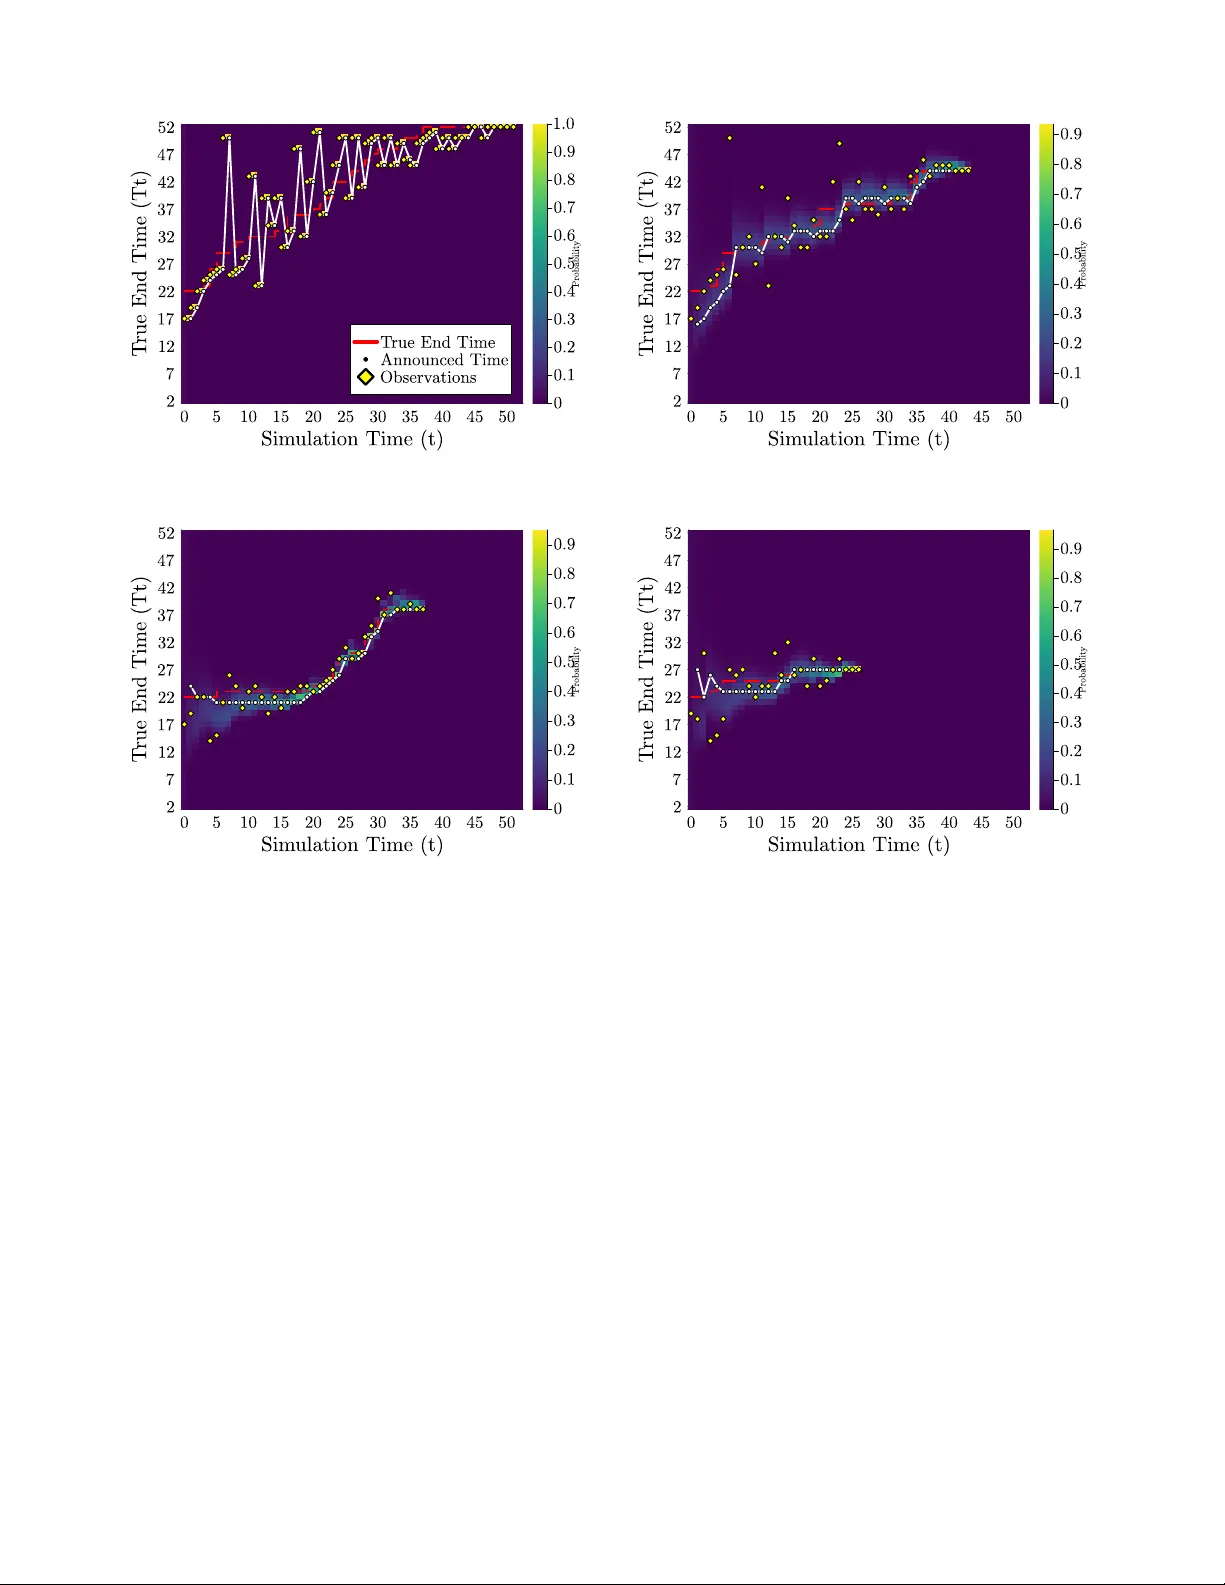
Optimizing T ask Completion T ime Updates Using POMDPs Duncan Eddy 1 , Esen Y el 2 , Emma Passmore 1 , Niles Egan 1 , Grayson Armour 1 , Dylan M. Asmar 1 , Mykel J. K ochenderfer 1 Abstract — Managing announced task completion times is a fundamental control pr oblem in project management. While extensive resear ch exists on estimating task durations and task scheduling, the problem of when and how to update completion times communicated to stakeholders remains understudied. Or - ganizations must balance announcement accuracy against the costs of frequent timeline updates, which can erode stakeholder trust and trigger costly replanning. Despite the pre valence of this problem, current approaches rely on static predictions or ad-hoc policies that fail to account for the sequential nature of announcement management. In this paper , we formulate the task announcement problem as a Partially Obser vable Markov Decision Process (POMDP) where the control policy must decide when to update announced completion times based on noisy observations of true task completion. Since most state variables (current time and pre vious announcements) are fully observable, we leverage the Mixed Observ ability MDP (MOMDP) framework to enable mor e efficient policy optimization. Our reward structure captures the dual costs of announcement errors and update frequency , enabling synthesis of optimal announcement control policies. Using off-the-shelf solvers, we generate policies that act as feedback controllers, adaptively managing announcements based on belief state evo- lution. Simulation results demonstrate significant improv ements in both accuracy and announcement stability compared to base- line strategies, achieving up to 75% reduction in unnecessary updates while maintaining or improving prediction accuracy . I . I N T RO D U C T I O N Managing stakeholder announcements of task completion times represents a critical control challenge distinct from the well-studied problem of predicting task durations and task scheduling. Accurate management of task completion announcements is critical for many organizations across various industries, including software engineering [1], con- struction [2], manufacturing [3], and aviation [4]. While organizations hav e access to increasingly sophisticated pre- diction models, they still face the understudied decision problem of when and how to update communicated timelines as new information becomes av ailable. This announcement control problem requires balancing the competing objecti ves of maintaining accuracy while minimizing the costs associ- ated with frequent updates. The distinction between prediction and announcement control is crucial. Ev en with perfect predictions, organiza- 1 Duncan Eddy ( deddy@stanford.edu ), Emma Passmore ( emma@alumni.stanford.edu ), Niles Egan ( negan@stanford.edu ), Grayson Armour ( garmour1@alumni.stanford.edu ), Dylan Asmar ( asmar@stanford.edu ), Mykel K ochenderfer ( mykel@stanford.edu ) are with Stanford Uni- versity , Stanford, CA, USA 2 Esen Y el ( yele@rpi.edu ) is with Rensselaer Polytechnic Institute, T roy , NY , USA tions must decide whether updating stak eholders is worth the associated costs—customer disappointment, resource re- allocation, and erosion of trust. Premature updates based on uncertain early observ ations may prove unnecessary , while delayed updates can magnify negati ve impacts. This creates a sequential decision-making problem where the controller must optimally manage the announced completion time based on e volving belief states. Consider the James W ebb Space T elescope. It was initially announced to launch in 2007 at total cost of $1 billion, but it ultimately launched in 2021 at over $10 billion [5], [6]. An independent re vie w found that incremental announcement changes created cascading effects on stakeholder planning and resource allocation, contributing to the cost and schedule creep [7]. This example illustrates how poor announcement control policies, not just prediction errors, can amplify project costs. The announcement control problem exhibits se veral char- acteristics that make it amenable to control-theoretic ap- proaches [4]. First, the true completion time is partially observable, with observation quality improving over time. Second, each announcement update incurs immediate costs in terms of replanning efforts and reallocation of resources. Third, the cost structure is inherently asymmetric, with different penalties for premature versus delayed updates. T raditional project management approaches fail to address these dynamics, typically employing static policies (target announced date at all costs) or reactiv e policies (announce the latest estimate) without considering that delays incurred by replanning make project management a sequential deci- sion problem [8]. Single-shot estimates neglect the real costs of timeline volatility on stakeholder trust and operational planning. T o address this gap, we formulate the announcement control problem as a Partially Observ able Markov Decision Process (POMDP) [9]. Since most state components (current time and previous announcements) are fully observable, we lev erage the Mixed Observability MDP (MOMDP) frame- work [10], [11] to enable efficient policy synthesis. This for- mulation captures the inherent uncertainty in task completion while explicitly modeling announcement decisions as control actions with associated costs. W e v alidate our approach using the QMDP [12] and SARSOP [13] belief-state planning algorithms and compare against heuristic baseline policies. Our framew ork provides actionable control policies for organizations seeking to op- timize stakeholder communication strategies in various in- dustries such as transportation, construction, and software dev elopment. I I . R E L AT E D W O R K There is clear recognition of the v alue of accurate task estimation and scheduling from operations research, partic- ularly for resource and cost management. This recognition has led to the compilation of project data across a range of domains, including construction and software engineering, in order to de velop models that can improve estimation of total task completion time [14, 15, 16, 17]. There is a large body of work on estimation of task completion that includes classical methods, such as Critical Path Analysis [18] and Earned V alue Management [19], to more recent machine learning models and algorithms, such as recurrent neural netw orks (RNNs) [20], artificial neural networks (ANNs) [21], long short-term memory (LSTM) [3], and hierarchical deep neural networks [22]. All of these approaches rely on historical training data to predict task completion time, which limits their applicability to nov el projects that lack historical completion data for training. It is also worth noting that these methods focus solely on estimating the completion time once at project outset and do not model the effect of updating the announced completion time can ha ve on overall project duration. In this paper, we focus on cases where the task completion time announcements are made in a sequential manner , instead of a single a one-shot estimate. Recently Kim et al. studied the problem of optimizing the frequency of wait time updates for customers in an unobservable queue [23]. They approach the problem as an analytic optimization of an economic utility function to compute the optimal frequency of updates but it does not account for noise in the wait-time estimates. The sequential, partially-observ able nature of the problem, as well as the evidence for the usability of POMDPs in time-based predictions [24], [25], makes POMDPs a natural candidate for this problem. W e use both POMDPs and MOMDPs to frame our problem and use existing solvers to generate project planning policies. All software used to to pose the problem, run experiments, and generate the results in this paper can be found at https://github.com/ sisl/POMDP_Plan . I I I . B AC K G RO U N D A. P artially Observable Marko v Decision Pr ocesses In a partially observ able Marko v decision process [9], [26], an agent makes observations o of the true state s and takes control action a at each time step. A POMDP is defined by tuple ⟨S , A , O , T , Z , R, γ ⟩ . Here, S , A , O denote the sets of states, control actions, and observations, respectively . The transition function T ( s ′ | s, a ) models state ev olution under control, while the observation function Z ( o | s ′ , a ) cap- tures measurement uncertainty . The rew ard function R ( s, a ) encodes control objectiv es, and γ ∈ [0 , 1) is the discount factor . The agent maintains belief state b ( s ) representing the probability of being in state s , and the agent seeks a control policy that maximizes expected discounted reward. B. Mixed Observability Markov Decision Pr ocesses Mixed observability Markov decision process is a specific form of a POMDP where part of the state space is fully observable, while the rest is hidden [10], [11]. Therefore, the state s of the problem can be factorized by the fully observable components x and partially observ able compo- nents y : s = [ x, y ] ∈ X × Y . A MOMDP is represented as a tuple: ⟨X , Y , A , O , T X , T Y , Z , R, γ ⟩ where X is the set of all possible fully observable states, and Y is the set of all possible partially observable states. Transition function T X models ho w the fully observ able states e volv e: T X ( x ′ | x, y , a ) = P ( x ′ | x, y , a ) , and transition function T Y models how partially observable states ev olve: T X ( y ′ | x, y , a, x ′ ) = P ( y ′ | x, y , a, x ′ ) . The observation function giv es the probability of obtaining a certain observation gi ven the state: Z ( o | x ′ , y ′ , a ) = P ( o | x ′ , y ′ , a ) . I V . A N N O U N C E M E N T C O N T RO L A S A P O M D P The project planning problem is posed as a sequential decision-making problem where the agent (e.g., task planner or project manager) announces the project completion time based on observations that are made as the project progresses. The objective of the agent is to synthesize an announcement control policy that minimizes negati ve consequences such as financial loss and missed delivery deadlines. The announcement control problem is fundamentally a Partially Observable Markov Decision Process where the true completion time is hidden from the controller . The formulation has the following components: State and state space: The state of the problem is characterized by three time values: 1) Current time step t , 2) previously announced completion time T ( t − 1) a , and 3) true completion time T s . Giv en that the current time step and the previously announced completion time are fully observable to the agent, their v alues are combined in the observable state: x ( t ) = ( t, T t − 1 a ) . On the other hand, the true completion time can ne ver be directly observed; rather , the agent only receiv es noisy observ ations of it. Hence, the partially observ able state contains the true completion time: y ( t ) = T s . W e assume that projects hav e a minimum and maximum possible completion times: T min and T max , respec- tiv ely . Hence, the observable state space of the problem becomes: X = { ( t, T a ) | t ∈ [0 , T max ] , T a ∈ [ T min , T max ] } as the current time can range anywhere between the beginning of the project until the maximum completion time, and the previously announced times can range between T min and T max . Similarly , the partially observ able state space is: Y = [ T min , T max ] because the true completion time needs to stay between the minimum and maximum completion times. Action and action space: At each time step t , the agent takes a control action by announcing the completion time, so we consider the action as the announced time value: a ( t ) = T t a . Since this value can range an ywhere between T min and T max , the action space is the same as the partially observable state space with A = [ T min , T max ] . Announcing the same completion time as the previous step models the case of lea ving the announcement time unchanged. Observation function and space: The agent does not hav e direct access to the true completion time; howe ver , it can receiv e noisy observations o t at each time step t . W e assume that such an observ ation can be generated by project team members’ completion time estimate based on their progress or through task estimation methods. Such observations are expected to be more uncertain earlier in the project timeline, given that more things can change throughout the project course. T o capture this effect, our observation model decreases uncertainty as the project ap- proaches completion. Specifically , we model the observation uncertainty as a Gaussian distribution Z ( o t | x ′ , y ′ ) = N ( o t | µ t , σ 2 t ) (1) where µ t = y ′ and σ t = ( T s − t ) / 3 . The standard deviation approaches to zero as the project approaches the completion, reflecting greater certainty closer to the true completion time. Giv en the limits on the project completion time, we truncate this distribution between T min and T max and discretize it. The observation space is the same as the action and partially observable state space with O = [ T min , T max ] . W e selected the Gaussian distribution due to it modeling both underestimation and overestimation of project scope and completion times. For specific application other probability distributions such as the log-normal distrib ution may be more appropriate [27]. T ransition function: The transition function T X defines the probability of adv ancing to next state x ′ giv en the current state and action. Gi ven the observable state is simply the current timestep and the announced completion time, the transition is deterministic T X ( x ′ = ( t, T t a ) | x, y , a = T t a ) = 1 if t ≥ y T X ( x ′ = ( t +1 , T t a ) | x, y , a = T t a ) = 1 otherwise The partially observable state transition T Y models the effect of replanning on the true completion time. It captures the ef fect that changing the announcement time ( a = T t − 1 a ) can affect the true completion time due to the disruption cost of replanning. W e adopt a simple categorical model of this transition T Y ( y ′ | x, y , a, x ′ ) = p 0 if y ′ = T s p s if y ′ = min( T s + δ s , T max ) p ℓ if y ′ = min( T s + δ ℓ , T max ) 0 otherwise (2) where p 0 + p s + p ℓ = 1 , δ s < δ ℓ . The parameter p 0 is the probability that replanning has no effect on the true completion time, while p s and p ℓ gov ern the likelihood of small δ s and large δ ℓ delays, respectiv ely . This stochastic transition captures the intuition that revising a project plan mid-ex ecution can introduce delay due to resource realloca- tion, team disruption, or re work. This simple model could be replaced with domain-specific models or learned delay models. Finally , when the agent retains its previous announcement ( a = T t − 1 a ), makes its initial announcement ( t = 0 ), or the project has completed ( t ≥ y ), the true completion time remains unchanged T Y ( y ′ = y | x, y , a, x ′ ) = 1 if a = T t − 1 a , t = 0 , or t ≥ y Reward function: The rew ard function allo ws us to encode the control objectiv es of the agent. The goal of the agent is to make announcements that are close to the true completion time (i.e., minimizing the estimation error), and to minimize the number of completion time estimate updates. T o encode these objectiv es, we use the following re ward function R ( x, y , a ) = 0 if t = T max − 1 0 if t ≥ T s − λ e | a − y | − λ c 1 c − λ f 1 f otherwise where 1 c is an indicator function for detecting whether or not the agent is changing the announcement time to something other than the true completion time 1 c = ( 1 if a = T t − 1 a and a = y 0 otherwise and 1 f is an indicator function to detect if the announcement is the true completion time when the project is finished 1 f = ( 1 if a = y and t = y 0 otherwise The term − λ e | a − y | penalizes announcements that are different than the true completion time, the term − λ c 1 c induces additional penalty for changing the announcement time unless to announce the correct completion time, and the term − λ f 1 f induces additional penalty for not announcing the true completion time once the task or the project is completed. The coefficients λ e , λ c , and λ f allow us to balance these components of the reward function. This MOMDP formulation of the underlying POMDP enables the use of specialized solvers that can take adv antage of the mixed observability structure for improv ed efficienc y , while maintaining the ability to synthesize optimal announce- ment control policies that balance accuracy and stability . V . R E S U LT S Our experiments in volve project planning problems of four sizes: small ( T min = 2 and T max = 13 ), medium ( T min = 2 and T max = 26 ), large ( T min = 2 and T max = 39 ), and extra large ( T min = 2 and T max = 52 ). These problems hav e state space sizes of | S | = 1 , 862 , 16,520, 56,316, and 135,252, respectively . W e chose these values to resemble projects that are quarter , half-year , three quarters, and a year long with weekly completion time announcements. Based on the project type, the same problem set up can be used for projects of dif ferent durations. The announcement control problem formulation requires the user to make some parameter choices. W e use a discount factor γ = 0 . 98 to prioritize long-term benefits of control actions taken over time steps. In the reward function, we use λ e = 8 , λ c = 2 , and λ f = 1000 to balance announcement accuracy and frequenc y . Small delays δ s = 1 occur with p s = 0 . 4 and large delays δ ℓ = 3 with p ℓ = 0 . 1 , with no delay incurred with probability p 0 = 0 . 5 . These are notional parameter v alues selected to demonstrate the formulation; the underlying problem structure and solution approach remain valid for more complex parameterizations or domain-specific models of delay and observation uncertainty . A. Solvers T o generate announcement control policies, we use two off-the-shelf solvers that leverage different aspects of our problem structure. Since the announcement control problem is fundamentally a POMDP with mixed observ ability , we apply QMDP [12] directly to the POMDP formulation and SARSOP [13] to the MOMDP formulation to exploit the efficienc y gains from the factored state representation. QMDP: QMDP [12] is an offline solver that iterativ ely updates a set of alpha vectors that defines a value function and a control policy . In QMDP , the alpha vectors are updated assuming that the system will have full observ ability after the first step. Due to this assumption, QMDP results in an upper bound to the true v alue function after a finite number of steps [26], [28]. SARSOP: SARSOP [13] is an offline solver that improv es the computational efficienc y of point-based value iteration methods by focusing on determining the optimally reachable belief space to be used when performing belief updates. Giv en that the optimal control policy is unkno wn to the agent, the optimally reachable belief space is also unknown. SARSOP approaches this problem by iteratively approximat- ing the optimally reachable belief space. When applied to our MOMDP formulation, SARSOP can efficiently exploit the mixed observ ability structure to synthesize high-quality announcement control policies. B. Baselines W e compare the control policies generated using the POMDP formulation to two baseline announcement strate- gies: Last observ ed: This deterministic policy makes project completion time announcements solely based on observa- tions. Namely , at every time step the project completion time is announced to be the last observation: a ( t ) = o t − 1 . Most likely: This policy keeps a belief ov er the true completion time and announces the most likely completion time at ev ery time step: a ( t ) = ¯ T s where ¯ s = ( ¯ t, ¯ T t − 1 a , ¯ T s ) = arg max s b ( s ) is the most likely state. C. Simulation Results T o ev aluate and compare these announcement control policies, we ran 1000 simulations for each problem size and policy . While we would ha ve preferred to use real project data, we were unable to find public datasets that included regular updates over multiple episodes with both estimated and true completion times; av ailable datasets contained only initial and final estimates or sparse updates from large-scale projects. For fair comparison, each of our simulation runs for Fig. 1. Comparison of reward values with different policies. different policies use the same sequence of observ ations, gen- erated using the observ ation function given in Section IV. All simulations used an AMD EPYC 9554 64-Core workstation with 512 GB of RAM running Ubuntu 24.04 L TS and Julia 1.11.6. This computer had significantly more memory than what is needed for solving the problem as the only memory requirements are for storing the policy and performing belief updates. Figure 1 compares the mean and standard deviation of the reward value over 1000 simulations with Q M D P and S A R S O P control policies, and with the baseline policies ( M O S T L I K E LY and O B S E RV E D T IM E ). In all problem sizes, Q M D P and S A R S O P perform comparably when it comes to av erage reward, and both outperform the baseline policies. W e also observe that increasing the problem size causes lower a verage rew ards for all policies. This is expected giv en the increased action and state space sizes, and initial obser- vations are more likely to be erroneous in larger problems. Another metric we use to compare the announcement control policies is the av erage number of changes in the announced completion time. A good control policy should estimate the true completion time accurately and should not change the announcement frequently because such changes can cause replanning of resource allocations, reduce produc- tivity , and incur other change costs. Figure 2 shows that in all problem sizes, Q M D P and S A R S O P result in fewer average number of announcement changes than the baseline policies. This result is expected as the announcement changes are penalized in the rew ard function. For the O B S E RV E D T I M E policy , it is expected to have frequent announcement changes because it announces the observed completion times directly , resulting in an announcement change whene ver a new ob- servation comes in. The M O S T L I K E LY policy also results in more frequent announcement changes as the announcement is updated whene ver the most likely state changes during belief updates. Q M D P and S A R S O P perform similarly in small problems, and Q M D P outperforms S A R S O P in larger problems. Figure 3 sho ws the a verage amount the true completion time increases due the announcement time changes of dif- ferent controllers for dif ferent problem sizes. O B S E RVE D - Fig. 2. Comparison of av erage number of announcement changes with different policies. Fig. 3. Comparison of average increase in project completion time due to controller announcement time changes T I M E and M O S T L I K E L Y frequently change the announced completion time as shown in Figure 2 which incurs added costs to replanning, delaying the project ov erall. Q M D P and S A R S O P complete projects with fe wer delays due to acti vely accounting for the possibility of replanning-induced delays. As confirmed by Figure 4 the Q M D P and S A R S O P controllers accept that the announced completion time may be incorrect for longer periods of time until it makes sense to change the announced completion time to reduce the number of changed-induced delays. D. Rewar d P arameter T uning: P ar eto Analysis of λ e and λ c The re ward function parameters λ e and λ c represent a trade-off in announcement control: the balance between prediction accuracy given evolving information and an- nouncement stability . Increasing λ e further penalizes inac- curate announcements, while increasing λ c penalizes fre- quent changes to announced deadlines. T o systematically explore this trade-off space and identify optimal param- eter configurations for the control policy , we performed parameter sweeps ov er both λ e and λ c using the values [0 . 5 , 1 . 0 , 2 . 0 , 3 . 0 , 5 . 0 , 8 . 0 , 12 . 0 , 20 . 0] , resulting in 64 unique parameter combinations. F or each combination, we solv ed Fig. 4. Comparison of average error over the planning horizon with different policies. The value is computed as the average over all simulations of the sum total error across all planning steps. Fig. 5. Pareto frontier analysis showing the trade-off between av erage prediction error and number of announcement changes for Q M D P policies. Each point represents a different ( λ e , λ c ) parameter combination. The gold line indicates the Pareto-optimal configurations, while baseline policies are shown for reference. The black arro w provides the direction of global improvement. a Q M D P control policy using the medium-sized problem configuration ( T min = 2 , T max = 26 ) and ev aluated it over 100 simulation runs using consistent replay data to ensure fair comparison. For all trials, λ f was held constant at 1000. Figure 5 presents the hyperparameter sweep analysis. This figure shows a clear trade-off between prediction accurac y and announcement frequency in the control policy , with the Pareto frontier demonstrating that achie ving very low error rates requires accepting more frequent updates. Our default parameter choice ( λ e = 8 , λ c = 2 , highlighted with a black star) balances between a low error rate and fewer changes. O B S E RV E D T I M E and M O S T L I K E L Y perform worse than any parameter combination on the frontier , confirming the value of the optimized announcement control policies ov er estimation-only approaches. E. Belief Evolution Analysis W e analyze the ev olution of beliefs for the simulated software engineering project. W e consider the scenario of a complex software engineering project, that could take up to 1 year (52 weeks) to complete. The initial true completion time is 22 weeks. The project managers run an agile process and meet weekly with the engineers to get a noisy estimate of the project completion time. Then based on dif ferent control policies make a decision to update project stakeholders about the true project completion time and realign engineers around the ne w completion estimate. Figure 6 sho ws results of executing this project with four different controllers. Because of the larger problem size, the initial completion estimates hav e large uncertainty at the be- ginning of the project, increasing the difficulty of the control problem considerably . W e see that for both the O B S E RV E D - T I M E and M O S T L I K E LY policies, they update their project completion estimates often in reaction to new understandings of the true completion time. Howe ver , this replanning does sometimes incur a cost due to lost-engineer time being in volved in rescoping and project-alignment meetings. W e see that these replanning costs increase the true completion time to 52 weeks for the the for the O B S E RV E D T I M E policy and 36 weeks for M O S T L I K E L Y controller . Increasing the project duration 136% and 63%, respectively . On the other hand we see that the Q M D P and S A R S O P controllers, hold their initial announcements for nearly the entire project duration, with S A R S O P changing the initial estimate once at the start, and only at the very last time step before project completion. V I . C O N C L U S I O N A N D F U T U R E W O R K In this paper , we introduce a POMDP formulation for the understudied problem of announcement control in task completion forecasting. While extensiv e research e xists on predicting task durations, the distinct decision-making prob- lem of when and ho w to update stakeholder-communicated timelines has received limited attention. W e address this gap by formulating the announcement control problem as a POMDP where the true completion time is partially ob- servable. Since most state components (current time and previous announcements) are fully observable, we lev erage the MOMDP frame work for efficient policy synthesis. W e use SARSOP and QMDP as policy solvers and com- pare the synthesized announcement control policies against two baseline strate gies. Our simulation results rev eal that POMDP-based announcement control has significant po- tential to improv e project planning practices. The control policies achieve superior performance by balancing an- nouncement accurac y against update frequency , addressing the fundamental trade-of f in stakeholder communication. Future work can extend this frame work with online plan- ners such as POMCP [29], incorporate more complex dy- namics, measurement, and rew ard model structures, extend to more complex project scenarios with interdependent tasks, and deploy the announcement control framework on real project management data to assess operational performance. R E F E R E N C E S [1] C. Jones, “Software Project Management Practices: Failure V ersus Success, ” Cr ossT alk: The Journal of Defense Software Engineering , vol. 17, no. 10, pp. 5–9, 2004. [2] B. W . W ambeke, S. M. Hsiang, and M. Liu, “Causes of V ariation in Construction Project T ask Starting Times and Duration, ” Journal of Construction Engineering and Management , vol. 137, no. 9, pp. 663–677, 2011. [3] J. Huang, Q. Chang, and J. Arinez, “Product Completion Time Prediction Using A Hybrid Approach Combining Deep Learning and System Model, ” Journal of Manufacturing Systems , vol. 57, pp. 311–322, 2020. [4] R. A. Shumsky, “Optimal Updating of Forecasts for the T iming of Future Events, ” Management Science , vol. 44, no. 3, pp. 321–335, 1998. [5] T . Reichhardt, “US Astronomy: Is the Next Big Thing T oo Big?” Natur e , vol. 440, no. 7081, 2006. [6] J. W ang, “JWST (James W ebb Space T elescope): The Most Expen- siv e Space T elescope in History , ” in Eye Beyond the Sky , Springer, 2024, pp. 373–392. [7] W . F . Ballhaus et al., “N ASA: James W ebb Space T elescope Independent Comprehensiv e Re view Panel Final Report, ” National Aeronautics and Space Administration, T ech. Rep., 2010. [8] M. Usman, E. Mendes, F . W eidt, and R. Britto, “Effort Estimation in Agile Software Development: A Systematic Literature Re view , ” in International Conference on Pr edictive Models in Software Engineering , 2014, pp. 82–91. [9] L. P . Kaelbling, M. L. Littman, and A. R. Cassandra, “Planning and Acting in Partially Observable Stochastic Domains, ” Artificial Intelligence , vol. 101, no. 1, pp. 99–134, 1998. [10] S. C. W . Ong, S. W . Png, D. Hsu, and W . S. Lee, “POMDPs for Robotic T asks with Mixed Observability, ” in Robotics: Science and Systems , Jun. 2009. [11] S. C. Ong, S. W . Png, D. Hsu, and W . S. Lee, “Planning Under Uncertainty for Robotic T asks with Mixed Observability , ” The International J ournal of Robotics Resear ch , vol. 29, no. 8, pp. 1053– 1068, 2010. [12] M. L. Littman, A. R. Cassandra, and L. P . Kaelbling, “Learning Policies for Partially Observable Environments: Scaling Up, ” in Machine Learning , Elsevier , 1995, pp. 362–370. [13] H. Kurniawati, D. Hsu, and W . S. Lee, “SARSOP: Efficient Point- Based POMDP Planning by Approximating Optimally Reachable Belief Spaces, ” in Robotics: Science and Systems , 2009, pp. 65–72. [14] H. Doloi, A. Sawhney , K. C. Iyer, and S. Rentala, “Analysing Fac- tors Af fecting Delays in Indian Construction Projects, ” International Journal of Pr oject Management , vol. 30, no. 4, pp. 479–489, 2012. [15] B. Thiele, M. Ryan, and A. Abbasi, “Dev eloping a Dataset of Real Projects for Portfolio, Program and Project Control Management Research, ” Data in Brief , vol. 34, p. 106 659, 2021. [16] S. K. Jauhar, N. Chandrasekaran, M. Gamon, and R. W . White, “MS-LaTTE: A Dataset of Where and When T o-Do T asks are Completed, ” in Conference on Language Resour ces and Evaluation , 2022. [17] B. Flyvbjerg and D. Gardner, How Big Things Get Done: The Surprising F actors that Determine the F ate of Every Project, fr om Home Renovations to Space Exploration and Everything in Between . New Y ork: Crown Currency , 2023. [18] R. Nafkha and A. W ili ´ nski, “The Critical Path Method in Estimating Project Duration, ” Information Systems in Manag ement , vol. 5, no. 1, pp. 78–87, 2016. [19] B. Thiele, A. Abbasi, and M. J. Ryan, “Improving Project Forecast- ing Accuracy by Dev eloping the Normalised Project Management Baseline, ” KSCE Journal of Civil Engineering , vol. 29, no. 4, 2025. [20] R. W . White and A. Hassan A wadallah, “T ask Duration Estimation, ” in ACM International Conference on W eb Searc h and Data Mining , 2019, pp. 636–644. [21] I. Lishner and A. Shtub, “Using an Artificial Neural Network for Improving the Prediction of Project Duration, ” Mathematics , vol. 10, no. 22, p. 4189, 2022. [22] A. Aslan, G. V asantha, H. El-Raoui, J. Quigley, J. Hanson, J. Corney , and A. Sherlock, “Hierarchical Ensemble Deep Learning for Data-Driven Lead T ime Prediction, ” The International Journal of Advanced Manufacturing T echnology , vol. 128, no. 9, pp. 4169– 4188, 2023. (a) O B SE RV ED T I M E (b) M O ST L I KE LY (c) Q M DP (d) S A RS O P Fig. 6. Belief evolution with observed completion times and announcements for a year-long software engineering project with initial true completion estimate of T s = 22 . The planning based methods (bottom row) display fewer changes in the announced project completion time over the planning horizon significantly reducing increase in project completion time due to incurred replanning cost. [23] J. Kim, L. Debo, and R. A. Shumsky , “Information Sharing to Optimize the W ait-Time Experience, ” Social Sciences Researc h Network , 2025. [24] J. W . Kim, G. B. Choi, and J. M. Lee, “A POMDP Framew ork for Integrated Scheduling of Infrastructure Maintenance and Inspec- tion, ” Computers & Chemical Engineering , vol. 112, pp. 239–252, 2018. [25] R. B. Gopaluni et al., “Modern Machine Learning T ools for Monitoring and Control of Industrial Processes: A Survey , ” IF AC- P apersOnLine , vol. 53, no. 2, pp. 218–229, 2020. [26] M. J. K ochenderfer, T . A. Wheeler, and K. H. Wray, Algorithms for Decision Making . MIT Press, 2022. [27] M. Jørgensen, T . Halkjelsvik, and K. Liestøl, “When Should W e (Not) Use the Mean Magnitude of Relati ve Error (MMRE) as an Error Measure in Software Development Effort Estimation?” Information and Software T echnology , vol. 143, p. 106 784, 2022. [28] M. Hauskrecht, “V alue-Function Approximations for Partially Ob- servable Markov Decision Processes, ” Journal of Artificial Intelli- gence Researc h , vol. 13, no. 1, pp. 33–94, Aug. 2000. [29] D. Silver and J. V eness, “Monte-Carlo Planning in Large POMDPs, ” in Advances in Neural Information Processing Systems , 2010.
Original Paper
Loading high-quality paper...
Comments & Academic Discussion
Loading comments...
Leave a Comment