Tokenization Tradeoffs in Structured EHR Foundation Models
Foundation models for structured electronic health records (EHRs) are pretrained on longitudinal sequences of timestamped clinical events to learn adaptable patient representations. Tokenization -- how these timelines are converted into discrete mode…
Authors: Lin Lawrence Guo, Santiago Eduardo Arciniegas, Joseph Jihyung Lee
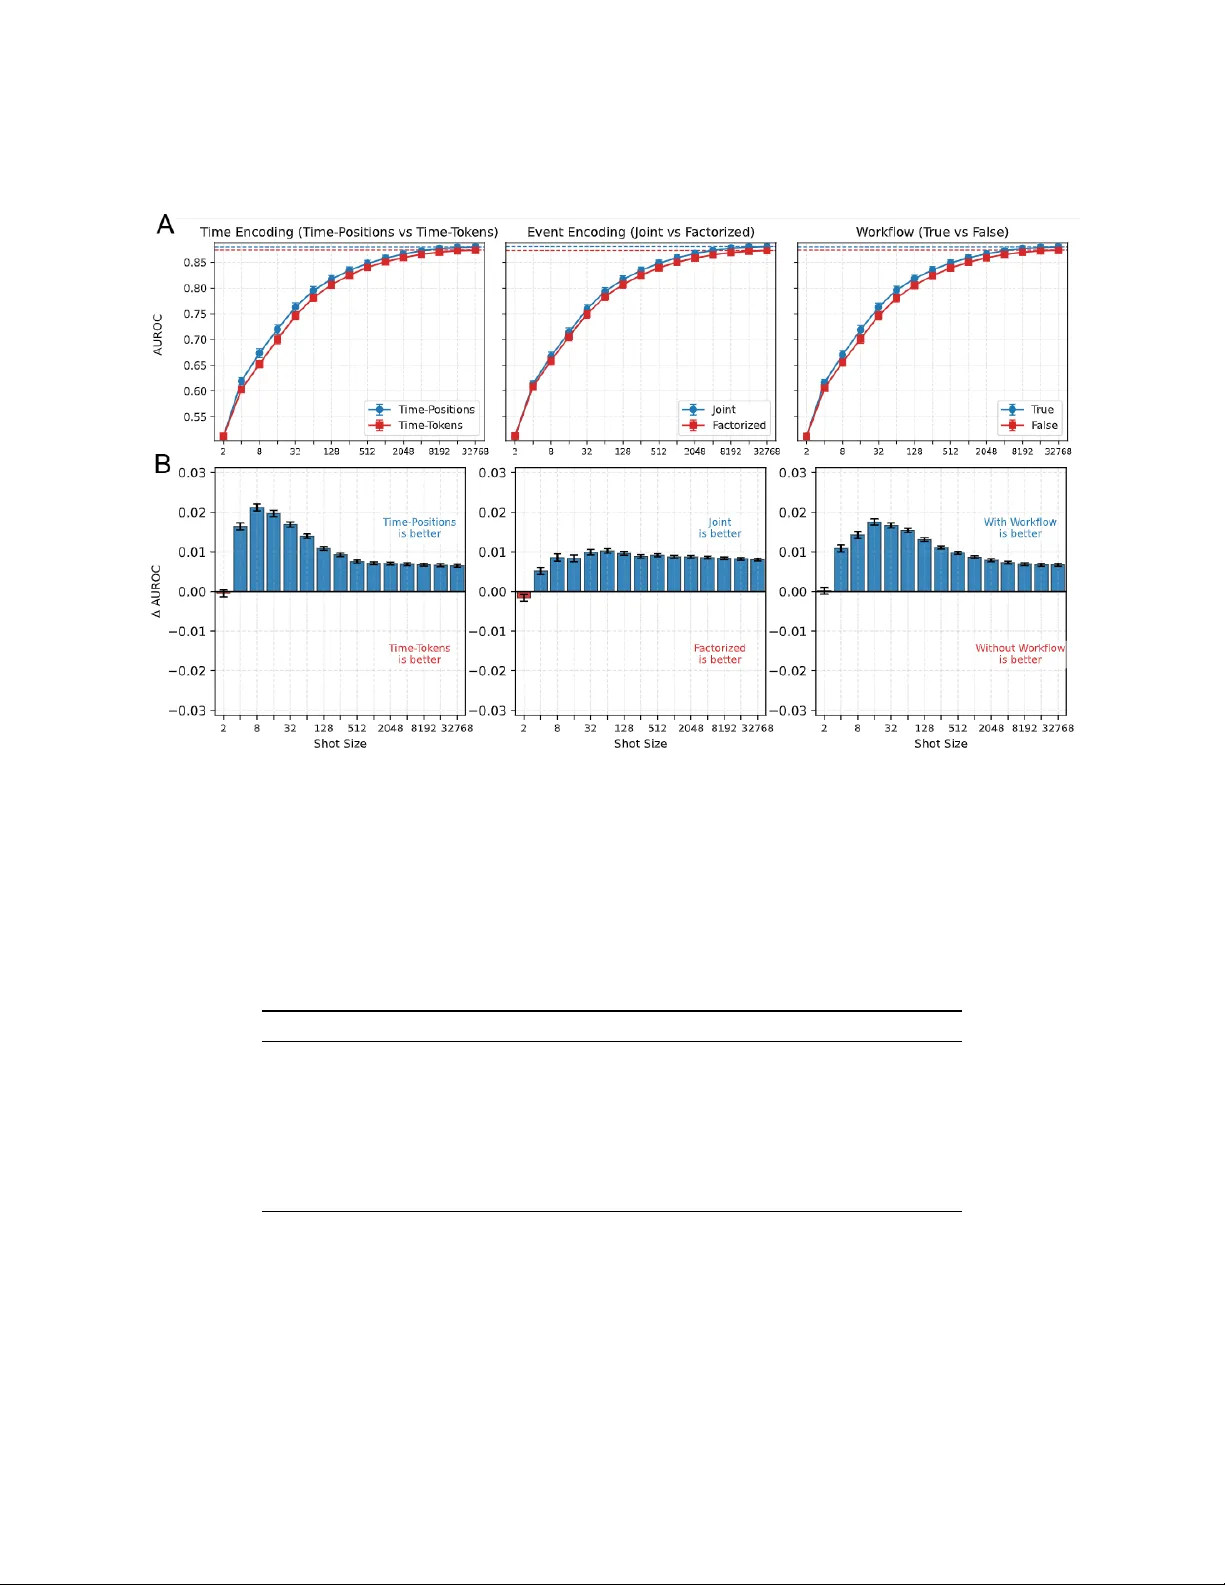
T O K E N I Z A T I O N T R A D E O FF S I N S T RU C T U R E D E H R F O U N D A T I O N M O D E L S Lin Lawrence Guo Child Health Evaluati ve Sciences The Hospital for Sick Children, T oronto, Canada Santiago Eduardo Arciniegas Child Health Evaluati ve Sciences The Hospital for Sick Children, T oronto, Canada Joseph Jih yung Lee Child Health Evaluati ve Sciences The Hospital for Sick Children, T oronto, Canada Adam Paul Y an Child Health Evaluati ve Sciences The Hospital for Sick Children, T oronto, Canada Division of Haematology/Oncology The Hospital for Sick Children, T oronto, Canada George T omlinson Department of Medicine Univ ersity Health Network, T oronto, Canada Jason Fries Department of Biomedical Data Science Division of Computational Medicine, Department of Medicine Stanford Univ ersity , Palo Alto, United States Lillian Sung ∗ Child Health Evaluati ve Sciences The Hospital for Sick Children, T oronto, Canada Division of Haematology/Oncology The Hospital for Sick Children, T oronto, Canada A B S T R AC T Foundation models for structured electronic health records (EHRs) are pretrained on longitudinal sequences of timestamped clinical events to learn adaptable patient representations. T okenization – how these timelines are con verted into discrete model inputs – determines what information is preserved, ho w ef ficiently it is encoded, and which relationships must be learned versus pre-computed. Y et the impact of tokenization design choices on downstream performance and computational efficienc y remains largely unexplored. Here, we pretrained a transformer on pediatric EHR data under a factorial design, v arying tokenization along e vent encoding, time encoding, and workflo w annotation. W e ev aluated area-under-the-recei ver -operating-characteristic curve across 74 clinical prediction tasks. Joint e vent encoding and positional time encoding outperformed their alternati ves (73/74 and 71/74 tasks) while requiring 39.5% and 9.6% fewer pretraining floating-point operations, respectiv ely . T argeted ablations traced the joint encoding advantage to local binding ef ficiency , that is, code-attribute pairs are combined into single tokens, rather than split across tokens that the model must learn to associate during pretraining. External ev aluation on an adult intensiv e care unit cohort demonstrated that this advantage generalizes despite substantial vocab ulary mismatch, while temporal and workflo w effects remain institution-specific. These results establish tokenization as a tractable lev er for improving both the performance and efficienc y of EHR foundation models. ∗ Corresponding author . Email: lillian.sung@sickkids.ca T O K E N I Z A T I O N F O R E H R F O U N DAT I O N M O D E L 1 Introduction Foundation models are transforming artificial intelligence (AI) in healthcare by shifting de velopment from bespoke, single-purpose models to reusable, adaptable backbones.[ 1 , 2 , 3 , 4 , 5 ] Foundation models for structured electronic health records (EHR), trained on longitudinal sequences of timestamped clinical ev ents such as diagnoses, procedures, medications, and laboratory results, ha ve demonstrated improv ed prediction performance,[ 6 , 7 ] robustness to distrib ution shifts,[ 8 , 9 , 10 ] and sample ef ficiency[ 11 ] in do wnstream clinical tasks. As these models adv ance tow ard broader clinical adoption,[ 12 ] understanding the design decisions that shape their learned representations becomes critical for guiding principled model dev elopment. An important yet lar gely understudied step in training EHR foundation models is tok enization: con verting a patient’ s clinical timeline into a sequence of discrete tokens. Because clinical ev ents combine categorical codes, continuous measurements, and temporal relationships, the tokenization strate gy determines what information is preserved in the token sequence (e.g., code-attribute associations, temporal intervals), how much of the patient’ s history fits within a fixed context windo w or compute budget, and which relationships the model must discov er from data versus pre-computed during tokenization. T okenization choices are fixed at pretraining time and propagate to every do wnstream application, making ev en modest effects consequential. Three tokenization design axes recur across existing structured EHR foundation models. First, event encoding determines how individual clinical e vents are represented as tokens. An elev ated serum glucose measurement, for example, may be encoded as a single composite token that fuses the code with its v alue (joint encoding),[ 6 , 13 ] or decomposed into separate tokens that the model processes sequentially or aggregates prior to input (factorized encoding).[ 14 , 15 , 16 , 17 ] Second, time encoding determines how temporal information is con ve yed: whether through dedicated time interval tokens consuming sequence positions,[ 14 , 18 , 19 ] positional encodings calibrated to temporal intervals,[ 6 ] or implicitly through sequence order alone.[ 20 , 21 , 22 ] Third, the scope of clinical context determines whether to represent clinical actions as single e vents (e.g., a finalized laboratory result) or as multi-step w orkflow sequences capturing process stages such as order placement, specimen collection, and result finalization. These choices jointly determine the vocab ulary size, sequence length, and pretraining compute requirements of a model, and may further affect downstream task performance and cross-institutional generalizability . Y et these axes ha ve been adopted without controlled comparison, hindering robust best practices.[23] Encoding clinical structure at tokenization time versus requiring the model to learn it from data reflects a fundamental trade-off in data-limited settings. EHR foundation models are pretrained on orders of magnitude fewer tokens than frontier language models,[ 12 , 23 ] limiting the signal a vailable to learn complex associations. Binding at tokenization time hard-codes compositional structure but e xpands the vocabulary and increases parameters in the embedding layer . Factorized encoding preserv es compositionality and a compact vocab ulary but requires the model to learn code-value associations from pretraining data. For instance, joint e vent encoding pre-computes the association between a clinical code and its measured value within a single token, whereas factorized encoding requires the model to learn that the same v alue token carries dif ferent clinical meaning depending on which code it follows. This is a form of the binding problem in neural netw orks,[ 24 ] applied locally to adjacent tokens that must be interpreted together , which we refer to as local binding efficiency . Whether this trade-off yields measurable performance differences has not been well established for EHR foundation models. Here, we quantify how tok enization design choices shape EHR foundation model performance and efficiency . Using a 2 × 2 × 2 factorial e xperiment, we estimate the independent ef fects of event encoding, time encoding, and workflo w annotations across 74 clinical prediction tasks spanning six clinical domains. W e complemented this analysis with targeted ablation experiments to probe mechanisms and external e valuations to assess cross-institutional generalizability . Models with a fixed transformer architecture were pretrained on pediatric EHR data and ev aluated locally and on an external adult intensi ve care cohort.[25] Our key findings are as follo ws: 1. Joint e vent encoding and positional time encoding improved do wnstream discrimination while requiring less pretraining compute, indicating that encoding more clinical structure at tokenization time improves both performance and efficienc y . 2. Ablations traced the joint encoding advantage to local binding efficienc y , whereby code-attribute pairs are pre-computed as single tokens during tok enization rather than learned across tokens from limited pretraining data. 3. Positional time encodings calibrated to temporal interv als sho wed modest improv ement ov er sequence order alone, while dedicated time tokens de graded performance, indicating that how time is encoded matters more than whether it is encoded. 2 T O K E N I Z A T I O N F O R E H R F O U N DAT I O N M O D E L 4. Benefits tied to institution-specific properties showed limited transfer: workflow annotations reflect local practice, and positional time encodings calibrated to one patient population did not generalize to populations with different age distrib utions. 2 Methods 2.1 Hospital Datasets This study used EHR data from The Hospital for Sick Children (SickKids), a tertiary pediatric hospital, as the primary dev elopment site, with data from Beth Israel Deaconess Medical Center (BIDMC), an adult academic medical center with intensiv e care unit admissions, used for external ev aluation (MIMIC-IV). The SickKids dataset was sourced from the SickKids Enterprise-wide Data in Azure Repository (SED AR),[ 26 ] which consolidates EHR data from SickKids’ Epic Clarity database into a standardized schema of 20 clinically organized tables. EHR data were mapped to the Medical Event Data Standard (MEDS)[ 27 , 28 ] format with clinical concepts standardized to Observ ational Medical Outcomes P artnership Common Data Model (OMOP CDM) ontologies. The MIMIC-IV dataset (version 1.0),[ 25 ] contains de-identified EHR data from patients admitted to the intensiv e care unit or emergenc y department at BIDMC between 2008 and 2019. MIMIC data were mapped to the OMOP CDM using code from the MIMIC project as part of Observational Health Data Sciences and Informatics[ 29 ] and subsequently con verted to MEDS format. As part of MIMIC’ s de-identification process, patient timelines are shifted to an anchor year within a three-year windo w . T o enable a consistent temporal splitting procedure across SickKids and MIMIC for pretraining and downstream e valuation, we deterministically assigned each patient a representativ e calendar year within their anchor group. Use of SEDAR data for this study was approved by the Research Ethics Board (REB) at SickKids (REB number: 1000074527). Use of the MIMIC-IV dataset was approv ed under the oversight of the Institutional Re vie w Boards (IRB) of BIDMC and the Massachusetts Institute of T echnology (MIT). Access to MIMIC-IV data was granted through a credentialed data use agreement via PhysioNet.[30] The need for informed consent was wai ved by both organizations due to the retrospectiv e nature of the project. 2.2 Cohort Definition and Splitting The cohort selection process is summarized in Supplementary Figure S1. Pretraining cohorts were defined at the patient lev el. For SickKids, we included all patients in SED AR at the time of the static data snapshot (May 7, 2025). Clinical ev ents spanned from June 2, 2018 (EHR system go-liv e) through May 7, 2025. Patients were excluded if they died prior to the EHR system go-live date or had missing date of birth. For MIMIC, all patients in the dataset were included. Patients in each dataset were deterministically assigned to training (~90%) and validation (~10%) subsets. For SickKids, training patients contrib uted e vents occurring on or before May 31, 2023, and v alidation patients contributed e vents through May 31, 2024. For MIMIC, training e vents were included through December 31, 2016, with v alidation ev ents included through December 31, 2017. Downstream ev aluation cohorts were defined at the admission le vel. For SickKids, we included inpatient admissions where age at admission w as 28 days or older . For MIMIC, we included inpatient admissions where age at admission w as 18 years or older . W e excluded admissions in which death or dischar ge occurred on the day of admission. Admissions were assigned to training, validation, and test sets using temporal splits aligned with the pretraining cohorts. Because pretraining cohorts were defined at the patient level and downstream ev aluation cohorts at the admission lev el, patients in the downstream test set may ha ve contributed historical clinical e vents to the pretraining corpus. This reflects realistic deployment, in which a foundation model trained on historical data is applied to new admissions from an ov erlapping patient population. No events occurring after the pretraining temporal cutoff were included in pretraining, and no e vents after the task-specific prediction time were used for representation e xtraction, pre venting temporal information leakage while preserving realistic data utilization. 2.3 Clinical Prediction T asks W e defined 74 clinical prediction tasks for SickKids, reflecting clinically relev ant use cases dev eloped under the Pediatric Real-world Ev aluativ e Data sciences for Clinical T ransformation (PREDICT)[ 31 ] program or based on prior SED AR data requests. T asks were grouped into six categories: blood bank transfusions (2 tasks), procedures (7 tasks), imaging (8 tasks), laboratory results (44 tasks, defined as abnormal high or low v alues relativ e to SickKids-specific reference ranges), medication administrations (10 tasks, categories defined using the American Hospital Formulary 3 T O K E N I Z A T I O N F O R E H R F O U N DAT I O N M O D E L Service classification), and clinical outcomes (3 tasks: in-hospital mortality , long length of stay of 7 or more days, and 30-day readmission). For MIMIC, we ev aluated 13 tasks comprising an adapted subset of the SickKids tasks, including the same three clinical outcomes and 10 laboratory results tasks, with abnormal values defined using MIMIC-specific reference ranges. The prediction time was set at midnight on the day of admission for all tasks except 30-day readmission, for which prediction time was set at midnight on the day before dischar ge. The prediction windo w extended until discharge for all tasks except for long length of stay and readmission, which used fixed windo ws of 7 days post-admission and 30 days post-discharge, respecti vely . For each task, admissions in which the outcome occurred between admission and the prediction time were excluded. 2.4 EHR T okenization Strategies W e ev aluated three tokenization design axes in a 2 × 2 × 2 factorial e xperiment (illustrated in Figure 1). 2.4.1 Event Encoding W e compared joint and factorized strategies for ev ent encoding. In joint encoding, each clinical ev ent was mapped to a single token representing the clinical concept and its associated attrib ute (e.g., a serum glucose measurement in the third quantile bin). In factorized encoding, ev ents were decomposed into separate tokens: a base concept token followed by attribute tok ens representing numeric quantile bins, categorical te xt values, and workflo w stages, drawn from a small, shared vocab ulary . For both strate gies, numeric v alues were discretized into 10 decile bins per clinical concept using the pretraining dataset. Joint encoding produced one token per ev ent, whereas factorized encoding produced two or more tokens per e vent, resulting in longer sequences and a smaller vocab ulary . 2.4.2 Time Encoding W e compared two strategies for time encoding: T ime-Positions and Time-T okens. In Time-Positions, each token’ s positional index corresponded to the patient’ s age in days at the time of the event, with temporal relationships encoded via Rotary Positional Embeddings (RoPE).[32] In T ime-T okens, temporal information was represented e xplicitly using discrete time-interval tok ens inserted between consecutiv e clinical ev ents, following prior work.[ 14 , 15 ] T okens were assigned sequential integer positions, and RoPE was applied to tok en order rather than patient age. W e used 13 time-interv al bins spanning 5 minutes to over 6 months (Supplementary T able S1), and each patient sequence began with demographic tokens encoding binned age and biological sex. Insertion rules and bin boundaries are detailed in Supplementary T able S1. Time-T okens sequences were longer than T ime-Positions due to the additional interval and demographic tokens. 2.4.3 W orkflow Stage Annotations W e compared models with and without workflo w stage annotations. In the without-workflo w condition, each clinical action was represented as a single e vent at its primary timestamp (e.g., finalized result time for laboratory tests; start time for procedures and sur geries). In the with-workflow condition, clinical actions with multi-step workflo ws were represented using multiple e vents occurring at distinct timestamps corresponding to workflo w stages (e.g., order placement, specimen collection, and result finalization for laboratory tests). This increased both information content and the sequence length of patient timelines. Event types without a multi-step w orkflow , such as diagnoses and flowsheet measurements, were represented identically in both conditions. W orkflow-stage representations by clinical domain are provided in Supplementary T able S2. W orkflo w stage annotations were av ailable only in the SickKids dataset; equiv alent information was not present in MIMIC. The full factorial design yielded eight tokenization conditions for SickKids pretraining. A separate vocabulary was constructed for each condition from the pretraining dataset. 4 T O K E N I Z A T I O N F O R E H R F O U N DAT I O N M O D E L 2823 - 3 Q2 Age=248d Joint Single token combining code and attribute s Factorized Separate tokens for code and attributes 2823 - 3 Age=248d Q2 Age=248d Potassium 3.8 mmol/L LOINC: 2823 - 3 | Quantile: 2 Event Encoding A Age=248d T ime-Positions RoPE on patient age -in - days T ime-T okens Discrete interval tokens between events A B T ime Encoding Age= 24 7 d W ith W orkflow Include workflow stages (e.g., order , collection) W ithout W orkflow One event only (e.g., result) 2823 - 3 Q 2 Age=248d Potassium lab test with clinical workflow timestamps W orkflow Stage Event A Event B B Age= 248 .2 d Δ 2 - 6h Position = age in days Position = 0, 1, 2 Order Collection Result 2823 - 3 Order 2823 - 3 Q 2 2823 - 3 Collect Age= 24 7.1 d Age= 24 8 d 1 event at result time 3 events at different times A. T okenization Design B. Experimental Design 1. Source Data SickKids EHR Y ear range: 2018 – 2025 2M patients 319M events MEDS format T emporal split 2. T okenization 2 x 2 x 2 Factorial 8 configurations Event: Joint / Factorized T ime: Positions / T okens W orkflow: With / Without 3. Pretraining 1 per tokenization 8 transformer models T ransformer 28 layers 768 dimension 1 16M parameters 4. Local Evaluation 74 tasks Linear probe Frozen encoder Full shot Few shot 2, 4, 8, 16, …, 32768 5. External Evaluation (MIMIC ) 13 tasks Reference (upper bound) T rain from scratch Next -token prediction Linear probe Frozen encoder Full shot Figure 1: T okenization and experiment design. (A) T okenization design choices. Event encoding determines ho w clinical ev ents are represented: joint encoding creates a single token combining the ev ent code and its attributes, while factorized encoding uses separate tokens for the code and each attrib ute. Time encoding determines ho w temporal information is captured: T ime-Positions uses rotary positional embeddings (RoPE) on patient age-in-days, while T ime-T okens inserts discrete interv al tokens between e vents with sequential integer positions. W orkflow stage determines whether clinical workflo w is included: with workflo w , a single lab test generates separate events at order , collection, and result times; without workflo w , only the result event is retained. (B) Experimental design. (1) Source data from SickKids including all patient ev ents and workflow stages, (2) tok enization configurations based on the factorial design, (3) ne xt-token-prediction pretraining of one transformer model per tokenization configuration, (4) local ev aluation settings using 74 clinical prediction tasks, and (5) external e v aluation using MIMIC across 13 tasks, with models trained from scratch on MIMIC serving as an upper-bound reference. Abbreviations: LOINC – Logical Observ ation Identifiers Names and Codes; RoPE – rotary positional embeddings; ORD – order; COL – collection; EHR – electronic health records; MEDS – medical ev ent data standard. 2.5 Foundation Model Pr etraining W e adopted a decoder-only transformer[ 33 , 34 ] with 28 layers, a hidden dimension of 768, 12 attention heads, and an intermediate dimension of 1,152.[ 35 ] This configuration yields a fixed transformer backbone of 115.6 million parameters, which w as held constant across all experiments (Supplementary T able S3). The total parameter count v aried across tokenization conditions (132M–170M parameters) due to differences in v ocabulary size, which affect the size of both the input token embedding layer and the next-tok en prediction layer used during pretraining. W e employed local attention with a window size of 128 tok ens, with global attention every third layer .[36] Eight models (one per f actorial tokenization condition) were pretrained on the SickKids cohort using autoregressi ve next-token prediction. Each training batch was constructed using token-budget-based sequence packing, filling a fixed budget of 32,768 tokens corresponding to the model’ s maximum context window . Because patient timelines v ary substantially in length, a batch could contain one long patient sequence or multiple shorter sequences concatenated together , with a minimum of one patient per batch. Causal attention masking enforced patient boundaries, prev enting information leakage across patients within the same packed sequence. Each model was trained for fi ve epochs without early stopping[ 37 ] on a single NVIDIA H100 or L40S GPU. T o estimate compute cost, total pretraining floating-point operations (FLOPs) were calculated using the standard approximation of 6 N D ,[ 38 ] where N is the number of non- embedding model parameters and D is the total number of tok ens processed during training. The transformer model was implemented using PyT orch version 2.7.[ 39 ] Optimizer settings and additional training details are provided in Supplementary T able S4. 5 T O K E N I Z A T I O N F O R E H R F O U N DAT I O N M O D E L T o establish a domain-matched upper-bound reference, we additionally trained models from scratch on MIMIC using MIMIC-specific vocab ularies, with identical architecture and training procedures. Because workflo w stage annotations were not av ailable in MIMIC, reference models were trained under a reduced 2 × 2 factorial design (e vent encoding × time encoding), all in the without-workflo w condition. 2.6 Ablation Experiments 2.6.1 Event Encoding Ablation Joint and factorized encoding differ along two axes that may independently affect downstream performance: token ef ficiency (joint encoding preserves longer clinical histories under fixed context windo ws) and local binding requirements (factorized encoding requires the model to learn that adjacent attribute tokens modify their preceding code token, whereas joint encoding encodes these associations at tokenization time). T o disentangle these mechanisms, we conducted a 2 × 4 × 2 factorial ablation. The first factor was encoding strategy (joint vs. factorized). The second was information content at four levels: Code Only (clinical concept codes without attributes), +Attributes (codes with numeric and categorical value tokens, requiring local binding between adjacent tokens in the factorized condition), +W orkflow (codes with workflo w stage e vents at distinct timestamps, requiring no local binding in either condition), and Full (all information). The third was sequence length regime: Fixed-Length (32,768 tokens, the standard training budget) versus Fixed-Ev ent (14,000 e vents, equalizing the number of clinical e vents observed re gardless of encoding strate gy). If token efficienc y drives an y performance difference between encoding strate gies, the Fixed-Ev ent regime (which remov es the sequence length disparity) should reduce performance dif ferences. If local binding requirements driv e the dif ference, the +Attributes condition (which introduces binding demands) should rev eal it, while the +W orkflow condition (which adds information without binding demands) should not. This experiment used the same model architecture and training procedure and was conducted using T ime-Positions as time encoding on the SickKids dataset. All models were pretrained under the Fixed-Length regime; the Fixed-Event condition was applied only during downstream representation extraction by truncating patient sequences to a fix ed number of ev ents. 2.6.2 Time Encoding Ablation Moti vated by recent findings that specialized time encodings often pro vide limited benefit o ver sequence order alone,[ 17 , 20 ] we sought to quantify the marginal contribution of explicit temporal information beyond ev ent ordering. Using joint ev ent encoding, we compared four time encoding strategies: (1) Order-Only , in which tokens receiv ed sequential integer positions with no temporal information; (2) T ime-Positions; (3) T ime-T okens; and (4) Positions+Scalar , which supplements RoPE by overwriting two hidden-state dimensions with normalized age and age 2 at ev ery transformer layer . The Positions+Scalar condition was included for completeness, as variants incorporating explicit continuous age features hav e been used in prior EHR foundation models.[ 6 ] Each strategy w as ev aluated with and without workflo w stage annotations, yielding eight conditions. All models used the same architecture and training procedure on the SickKids dataset. 2.7 Downstr eam T ask Evaluation For each patient admission in the do wnstream ev aluation cohorts, representations were extracted using the pretrained model for the corresponding tokenization condition. Specifically , for SickKids downstream tasks, representations were extracted using the SickKids-pretrained models. For MIMIC do wnstream tasks, representations were extracted using both SickKids-pretrained models (for transfer e valuation) and MIMIC-pretrained models (as domain-matched references). Each model was applied autore gressiv ely to the sequence of all clinical ev ents occurring at or before the task-specific prediction time, up to the model’ s maximum context windo w of 32,768 tokens. The final hidden state (768-dimensional vector) corresponding to the last event in this sequence was used as the patient representation at prediction time. Pretrained model weights were frozen during representation extraction. Downstream task performance was e valuated using the area under the recei ver operating characteristic curve (A UR OC). Performance was reported on the held-out temporal test set. 2.7.1 Full-Shot Evaluation For full-shot e valuation, L2-regularized logistic regression models from Sci-kit learn[ 40 ] were trained on pa- tient representations extracted from all available task-specific training admissions. Regularization strength ( C ∈ { 1 , 0 . 1 , 0 . 01 , 0 . 001 , 0 . 0001 } ) was selected based on validation A UROC. Input features were standardized using a standard scaler fitted on the training set and applied to validation and test sets. 6 T O K E N I Z A T I O N F O R E H R F O U N DAT I O N M O D E L 2.7.2 Sample Efficiency Evaluation T o assess sample efficiency , models were ev aluated across shot sizes ( k ) ranging from 2 to 32,768 labeled training examples, in po wers of two. For each shot size, 10 independent iterations were conducted. In each iteration, k training examples were drawn from the task-specific training set, while the validation and test sets remained unchanged. T raining subsets were constructed using balanced sampling, consisting of an equal number of positiv e and negati ve e xamples. For tasks with fewer than k / 2 positiv e instances in the training set, all av ailable positiv e instances were included in the training subset, with the remaining examples sampled from the negati ve class. The same L2-regularized logistic regression setup used for full-shot ev aluation was applied in all sample efficiency experiments. Performance was reported as the mean across the 10 iterations for each shot size. 2.8 External Evaluation on MIMIC Cross-institutional generalization was ev aluated by applying the SickKids-pretrained models to MIMIC data using frozen model weights and transferred vocabularies. Only the downstream linear classifiers were trained on MIMIC data, following the same full-shot ev aluation procedure. Transfer performance was compared to MIMIC reference models trained from scratch under the reduced factorial design. Out-of-vocab ulary rates were quantified by applying each SickKids-deri ved v ocabulary to MIMIC data and stratifying ev ents by type (code-only , numeric, and categorical text attrib utes). 2.9 Statistical Analysis W e used linear mixed models (LMMs) to estimate the effects of tokenization choices on do wnstream task performance. In all models, the outcome variable was task-level A UROC, with each observation corresponding to a single task e valuated under a specific tokenization condition. Prediction task was included as a random intercept to account for non- independence of repeated ev aluations within the same task. Model parameters were estimated using restricted maximum likelihood (REML). Confidence interv als and p -v alues were computed using W ald t -distribution approximation. For the full-shot and transfer factorial experiments, we fitted the follo wing model: A UR OC ∼ TimeEnco ding + Even tEnco ding + W orkflo w + (1 | T ask) The model estimates the independent contrib ution of each design axis. W e excluded the interaction terms as the ax es represent orthogonal design choices and the primary goal was to quantify the marginal effect of each. The event encoding ablation used a full factorial model (Encoding × Information × Regime) with task as a random intercept. For the time encoding ablation, a linear mixed model included time encoding strategy as a fix ed effect with Order -Only as the reference le vel and task as a random intercept. For the sample ef ficiency analysis, the model was extended to capture interactions between tokenization choices and training set size: A UR OC ∼ (TimeEnco ding + Even tEnco ding + W orkflo w ) × log 2 (ShotSize centered ) + (1 | T ask) Shot size was log 2 -transformed and centered at 32 examples, such that main ef fects correspond to performance at the 32-shot setting, and interaction terms capture how tok enization effects v ary with training sample size. 3 Results 3.1 Cohort Characteristics Pretraining and task cohort characteristics are summarized in T able 1. The SickKids pretraining cohort consisted of 2,027,582 patients contributing 169 million clinical ev ents with a median timeline duration of 1 day (IQR 0–224). The MIMIC pretraining cohort comprised 339,989 patients with 179 million e vents and a median timeline duration of 17 days (IQR 2–553). T ask cohorts for downstream ev aluation included 87,565 admissions across 51,242 pediatric patients (median age 7 years) at SickKids, and 58,513 admissions across 44,055 adult patients (median age 54 years) in MIMIC. T ask-specific statistics including total admissions, patients, and prev alence for SickKids and MIMIC are summarized in Supplementary T able S5. 7 T O K E N I Z A T I O N F O R E H R F O U N DAT I O N M O D E L T able 1: Characteristics of pretraining and task cohorts Characteristic SickKids MIMIC Pretraining Cohort* Patients, n 2,027,582 339,989 Clinical ev ents, n 169,323,884 178,990,210 T imeline duration in days, median (IQR) 1 (0–224) 17 (2–553) Female sex, % 49.8 53.5 T ask Cohort** Patients, n 51,242 44,055 Admissions, n 87,565 58,513 Age at admission, median (IQR) 7 (2–13) 54 (34–70) Length of stay in days, median (IQR) 2 (1–5) 4 (2–7) Female sex, % 46.0 61.9 Clinical prediction tasks, n*** 74 13 *Pretraining cohorts include patients and events (after temporal splitting and not including workflo w stages) used for self-supervised pretraining of the SickKids and the reference MIMIC foundation models. **T ask cohorts include admissions used for downstream clinical prediction ev aluation. The MIMIC cohort was also used for the external e valuation of the SickKids foundation model. ***The clinical prediction tasks were identified from data requests to the SickKids team. Among the 74 identified tasks (Supplementary T able S5), 13 could be operationalized using data available in MIMIC. Abbreviations: IQR – interquartile range; SickKids – The Hospital for Sick Children; MIMIC – Medical Information Mart for Intensiv e Care. 3.2 Effect of T okenization on Sequence Length and Pretraining Cost Across the eight tokenization configurations, v ocabulary sizes ranged from 10,889 to 35,432 tokens and total pretraining tokens ranged from 169 to 479 million (Supplementary T able S6). Factorized encoding reduced vocab ulary size by 2.3–3.0 times relativ e to joint encoding but increased total tokens by 1.8–2.0 times under matched time and workflo w settings. T ime-T okens increased total tokens by 6.9–16.4% relative to Time-Positions. T otal FLOPs ranged from 5 . 5 × 10 17 to 1 . 4 × 10 18 , scaling with tokens seen during pretraining (Supplementary T able S7). 3.3 T okenization Choices Independently Affect T ask Perf ormance All three tokenization design choices independently af fected downstream task performance across 74 clinical prediction tasks (Figure 2A; Supplementary T ables S8–S10). Joint encoding outperformed factorized encoding ( β = 0 . 008 A UR OC, 95% CI [0.007, 0.009], P < 0 . 001 ), T ime-Positions outperformed T ime-T okens ( β = 0 . 007 , 95% CI [0.005, 0.008], P < 0 . 001 ), and including workflow stage annotations improv ed performance ( β = 0 . 007 , 95% CI [0.006, 0.008], P < 0 . 001 ). When av eraging across the other two design axes, these effects were consistent in direction across most tasks (joint: 73/74 [99%]; T ime-Positions: 71/74 [97%]; workflow: 64/74 [86%]). Notably , the better- performing strategies for e vent and time encoding also required less pretraining compute (joint: 39.5% fewer FLOPs; T ime-Positions: 9.6% fewer FLOPs), while w orkflow inclusion presented a trade-of f, with improv ed performance at 35.6% greater compute cost (Figure 2B). These ef fects were stable across sample ef ficiency e valuation settings from 2 to 32,768 labeled examples (Supplementary Figure S2; Supplementary T able S11), with one exception: the time encoding adv antage diminished at larger training set sizes (interaction β = 0 . 001 , P = 0 . 012 ), while e vent encoding and workflo w effects remained stable ( P not significant). 8 T O K E N I Z A T I O N F O R E H R F O U N DAT I O N M O D E L Figure 2: Effect of tokenization design choices on task performance and pretraining cost. (A) T ask-specific differences in A UR OC between paired tokenization strategies across 74 clinical prediction tasks ev aluated on the SickKids dataset. Each transparent point represents the A UR OC difference for a single task under a specific experimental configuration. Opaque points denote the mean A UR OC difference for each task, av eraged across all other experimental factors. Background bands indicate task family . Absolute A UR OCs by tokenization condition and task are reported in Supplementary T ables S8 and S9, respectively . (B) Relativ e dif ference in pretraining compute, measured as FLOPs between paired tokenization strategies. Bars indicate the mean percentage reduction across configurations, with error bars showing the range observ ed across experimental settings. Abbreviations: A UROC – area under the recei ver operating characteristic curve; FLOPs – floating-point operations. 3.4 Joint Encoding Advantage Reflects Local Binding Efficiency A targeted ablation disentangled the contributions of tok en ef ficiency and local binding ef ficiency (Figure 3; Supple- mentary T able S12). Performance was virtually identical between the Fixed-Length and Fix ed-Event sequence regimes ( β = 0 . 000 , P = 0 . 935 ), indicating that differential truncation of patient history did not account for the encoding effect. At baseline (Code Only), joint and factorized encoding performed similarly ( β = − 0 . 001 , P = 0 . 230 ). Adding value attrib utes improved joint encoding ( β = 0 . 009 , P < 0 . 001 ) but not factorized encoding (F actorized × Attributes interaction: β = − 0 . 009 , P < 0 . 001 ). In contrast, adding workflow stages improv ed both encoding strategies similarly (Factorized × W orkflo w interaction: β = 0 . 002 , P = 0 . 188 ). 9 T O K E N I Z A T I O N F O R E H R F O U N DAT I O N M O D E L Figure 3: Event encoding ablation. Mean A UR OC for joint (blue) and factorized (red) e vent encoding as a function of information content (Code Only , +Attributes, +W orkflo w , Full), under fixed-length (solid line) and fix ed-e vent (dashed line) sequence regimes. Time-Positions was used for time encoding. Error bars are omitted because they do not reflect variability in between-condition contrasts. Abbreviation: A UROC – area under the recei ver operating characteristic curve. 3.5 Explicit T emporal Encoding Provides Modest Benefit Bey ond Sequence Order Relativ e to Order-Only encoding, which captures sequential ordering without temporal spacing, T ime-Positions and Positions+Scalar each improved performance modestly and by nearly identical magnitudes ( β = 0 . 003 , P < 0 . 001 for both; Figure 4; Supplementary T able S13). T ime-T okens performed significantly worse than Order-Only ( β = − 0 . 003 , P < 0 . 001 ). T ask-level ef fects were small across all strategies, with most tasks clustering near zero dif ference relativ e to Order-Only . 10 T O K E N I Z A T I O N F O R E H R F O U N DAT I O N M O D E L Figure 4: T ime encoding ablation. (A) T ask-specific A UR OC differences relati ve to Order -Only for three explicit time encoding strategies. Joint event encoding w as used for each condition. Each transparent point represents the A UR OC difference for indi vidual ev aluations. Opaque points denote the mean A UR OC difference. Diamond color indicates time encoding strategy . Background bands indicate task family . (B) Mean A UR OC by time encoding strategy . Error bars are omitted in the bar graph because they do not reflect v ariability in between-encoding contrasts. Abbreviations: A UR OC – area under the receiver operating characteristic curv e. 3.6 Event Encoding Effects Generalize Acr oss Institutions External e valuation of SickKids-pretrained models on MIMIC rev ealed substantial vocabulary mismatch, with o verall out-of-vocab ulary rates of 69.8% and exceeding 85% for code-only and categorical text e vents (Figure 5A). The joint encoding adv antage transferred with a similar ef fect size to the SickKids local e v aluation setting ( β = 0 . 008 , 95% CI [0.005, 0.011], P < 0 . 001 , Figure 5B; Supplementary T ables S14–S16), while time encoding ( β = 0 . 002 , P = 0 . 271 ) and workflo w ( β < 0 . 001 , P = 0 . 803 ) effects were not significant. Frozen transfer achiev ed best mean A UR OC of 0.815 (joint ev ent encoding with T ime-Positions and no workflo w stages) compared to 0.842 (joint ev ent encoding with T ime-Positions) for MIMIC models trained from scratch with domain-matched vocabularies, all without workflo w stages (Supplementary T ables S17–S18). 11 T O K E N I Z A T I O N F O R E H R F O U N DAT I O N M O D E L A B Figure 5: External ev aluation of SickKids foundation model on MIMIC. (A) Out-of-vocab ulary (OO V) rates when applying tokenizers learned during SickKids pretraining to the full MIMIC dataset, stratified by e vent type. (B) A UR OC differences between tokenization strate gies for frozen SickKids-pretrained models ev aluated on 13 MIMIC clinical prediction tasks. Each transparent point represents the A UR OC dif ference for a single task under a specific experimental configuration. Opaque points denote the mean A UROC dif ference for each task, av eraged across all other experimental f actors. Background bands indicate task family . Absolute A UROCs by tok enization condition and task are reported in Supplementary T ables S14 and S15, respectively . 4 Discussion This study systematically ev aluated how three tokenization design choices af fect structured EHR foundation model performance across 74 clinical prediction tasks. Joint e vent encoding and T ime-Positions outperformed their alternativ es while requiring less pretraining compute. W orkflow annotations improv ed local performance but did not transfer across institutions. T argeted ablations traced the joint encoding advantage to local binding ef ficiency , whereby code-attribute pairs are pre-computed as single tokens during tokenization rather than learned across tokens from limited training data. External ev aluations demonstrated that this advantage generalized across institutions despite substantial vocab ulary mismatch, while temporal and workflo w effects did not. These results indicate that tokenization can meaningfully af fect both the predictiv e performance and computational cost of structured EHR foundation models. The better-performing strate gies for event and time encoding were also more computationally ef ficient due to producing shorter token sequences. This suggests that tokens capturing meaningful domain structure are both more compact and learnable in data-limited settings. Recent research on language models has found that tokenizers that align boundaries with linguistically meaningful units (words, morphemes, common multi-word e xpressions) outperform those optimizing compression alone.[ 41 , 42 , 43 ] Here, joint encoding fuses clinical codes and their measured values into tokens that correspond to meaningful clinical concepts, while T ime-Positions encodes temporal information through the positional mechanism rather than consuming additional tokens. For both ev ent and time encoding, the less ef fectiv e tokenization strategy expands sequence length with tokens the model integrates less ef ficiently , increasing compute cost without proportional representational benefit. These efficiency dif ferences are practically significant giv en tokenization choices are fixed at pretraining time and propagate to e very do wnstream application. The e vent encoding ablation re vealed a specific dissociation: adding value attrib utes improved joint encoding b ut not factorized encoding, whereas adding workflow stages improved both strategies similarly . This pattern is consistent with a local binding problem applied to clinical ev ent sequences.[ 24 ] Under factorized encoding, a shared attribute vocab ulary is reused across thousands of clinical codes, requiring the same tok en to carry dif ferent clinical meaning depending on which code it follows. For instance, an elev ated quantile for serum glucose indicates hyperglycemia, whereas the same quantile for creatinine indicates renal impairment. The model must learn these conte xt-dependent associations from pretraining using next-token prediction. Conv ersely , workflow annotations arri ve as separate ev ents 12 T O K E N I Z A T I O N F O R E H R F O U N DAT I O N M O D E L at distinct timestamps and may be independently informativ e, without requiring local compositional binding, which may explain why both encoding strate gies benefited similarly . Joint encoding resolves the local binding problem by fusing the clinical code and its measured value into a single token, pre-computing their association at tokenization time. While transformers can in principle learn such local bindings, compositional generalization might require larger models trained on correspondingly lar ger datasets. Structured EHR data, which is orders of magnitude smaller than language corpora,[ 12 , 23 ] may be insufficient for models to reliably discov er these associations, making it adv antageous to resolve them at tokenization time. Explicit temporal encoding provided modest benefit be yond sequence order , and discrete time tokens degraded performance. The latter is consistent with recent ev aluations sho wing that explicit temporal encoding provides little benefit across supervised clinical prediction and EHR foundation model settings.[ 17 , 20 ] In our study , discrete tokens may de grade performance by fragmenting clinical e vent sequences and consuming context positions without proportional information gain. In contrast, T ime-Positions provided a small impro vement without additional tokens. Ho wev er, this adv antage did not transfer from the pediatric pretraining population to an adult ICU cohort, lik ely because age-calibrated positional encodings embed the temporal statistics of the pretraining population and become unreliable under extrapolation. These results suggest that ho w temporal information is encoded matters more than whether it is included, and that dev eloping temporal representations robust to demographic shift remains an open challenge. W orkflow stages impro ved local performance b ut required 36% more pretraining FLOPs due to the additional tokens and provided no benefit in transfer . The latter is likely because the temporal staging of orders, collections, and results varies across institutions and clinical workflo ws. Including workflo w stages during pretraining did not degrade transfer performance when applied to data without workflow annotations, suggesting the model does not become dependent on this information. Whether mismatched workflo w patterns between institutions could negati vely affect transfer remains an open question. During external e valuation, v ocabulary co verage w as poor , with nearly 70% of MIMIC clinical codes out-of-vocabulary . Despite this, the joint event encoding advantage generalized with a comparable effect size, consistent with local binding efficiency being a generalizable benefit in modeling of structured clinical event sequences. T emporal and workflo w effects were not significant, consistent with their dependence on population-specific or institution-specific characteristics. These results suggest that vocab ulary alignment should be prioritized for cross-institutional deployment and argue for explicit reporting of tokenization strategies in EHR foundation model studies.[ 23 ] The consistent advantages of joint e vent encoding and positional time encoding across tasks suggest these as reasonable def aults for future model dev elopment. More broadly , the observation that pre-computed structural associations transfer more robustly than learned temporal or conte xtual patterns may e xtend beyond EHR to other domains where foundation models are applied to sequences of structured ev ents with limited training data. Sev eral limitations warrant consideration. All models in the main experiments were pretrained on data from a single pediatric hospital. Evaluation was restricted to discriminativ e prediction tasks using linear probes on frozen representations and we did not ev aluate generative applications such as zero-shot prediction.[ 14 , 15 , 44 ] Howe ver , because tokenization operates upstream of the pretraining objectiv e and determines the information available to the model, the binding ef ficiency and temporal encoding findings are likely to hold reg ardless of do wnstream application. The external ev aluation experiments confound vocab ulary mismatch, population shift, and institutional differences, which cannot be fully disentangled. W e did not in vestigate data-dri ven tokenization approaches such as byte-pair encoding. Recent work has begun adapting BPE to structured medical codes by merging frequently co-occurring codes into single tokens,[ 45 ] but the interaction between such learned tokenization and the design axes e valuated here remains unexplored. Finally , while effect sizes were consistent across tasks, clinical significance at the indi vidual task level should be interpreted cautiously . In conclusion, our results demonstrate that encoding clinically meaningful structure at tokenization time consistently improv es both performance and computational efficienc y across 74 clinical prediction tasks. Pre-computing code- attribute associations into joint tokens avoids the local binding problem that factorized representations impose in data-limited settings, and this adv antage transfers across institutions e ven under substantial vocab ulary mismatch. As structured EHR foundation models advance to ward clinical deployment, principled tokenization of fers a tractable lev er for improving rob ustness and reducing pretraining cost. 13 T O K E N I Z A T I O N F O R E H R F O U N DAT I O N M O D E L Data A v ailability The SickKids dataset cannot be made publicly av ailable due to patient priv acy restrictions. Relev ant data are av ailable upon reasonable request to the corresponding author . The MIMIC-IV dataset is publicly a v ailable through PhysioNet ( https://physionet.org/content/mimiciv/1.0/ ) subject to credentialing and a data use agreement. Code A v ailability The codebase for EHR tokenization and foundation model training will be made publicly a vailable at https://github. com/sungresearch/ehr- fm . Acknowledgements LS is supported by the Canada Research Chair in Pediatric Oncology Supportiv e Care. Funding This research did not receiv e funding. A uthor Contrib ution L.L.G. conceptualized and designed the study with input from all authors. L.L.G. performed all experiments, analyzed and interpreted results with input from all authors. L.L.G. wrote the manuscript with input from all authors. All authors read and approv ed the final manuscript. Competing Interests The authors declare no competing interests. References [1] Rishi Bommasani, Drew A. Hudson, Ehsan Adeli, Russ Altman, Simran Arora, Sydney von Arx, Michael S. Bernstein, Jeannette Bohg, Antoine Bosselut, Emma Brunskill, Erik Brynjolfsson, Shyamal Buch, Dallas Card, Rodrigo Castellon, Niladri S. Chatterji, Annie S. Chen, Kathleen A. Creel, Jared Davis, Dora Demszky , Chris Donahue, Moussa Doumbouya, Esin Durmus, Stefano Ermon, John Etchemendy , Kawin Ethayarajh, Li Fei-Fei, Chelsea Finn, Tre vor Gale, Lauren Gillespie, Karan Goel, Noah D. Goodman, Shelby Grossman, Neel Guha, T atsunori Hashimoto, Peter Henderson, John Hewitt, Daniel E. Ho, Jenny Hong, K yle Hsu, Jing Huang, Thomas F . Icard, Saahil Jain, Dan Jurafsky , Pratyusha Kalluri, Siddharth Karamcheti, Geoff K eeling, Fereshte Khani, Omar Khattab, Pang W ei Koh, Mark S. Krass, Ranjay Krishna, Rohith Kuditipudi, Ananya Kumar , Faisal Ladhak, Mina Lee, T ony Lee, Jure Leskov ec, Isabelle Lev ent, Xiang Lisa Li, Xuechen Li, T engyu Ma, Ali Malik, Christopher D. Manning, Suvir Mirchandani, Eric Mitchell, Zanele Munyikwa, Suraj Nair , A vanika Narayan, Deepak Narayanan, Ben Newman, Allen Nie, Juan Carlos Niebles, Hamed Nilforoshan, Julian Nyarko, Giray Ogut, Laurel J. Orr, Isabel Papadimitriou, Joon Sung Park, Chris Piech, Ev a Portelance, Christopher Potts, Aditi Raghunathan, Rob Reich, Hongyu Ren, Frieda Rong, Y usuf H. Roohani, Camilo Ruiz, Jack Ryan, Christopher Ré, Dorsa Sadigh, Shiori Sagawa, Kesha v Santhanam, Andy Shih, Krishnan P . Sriniv asan, Alex T amkin, Rohan T aori, Armin W . Thomas, Florian T ramèr, Rose E. W ang, William W ang, Bohan W u, Jiajun W u, Y uhuai W u, Sang Michael Xie, Michihiro Y asunaga, Jiaxuan Y ou, Matei A. Zaharia, Michael Zhang, T ianyi Zhang, Xikun Zhang, Y uhui Zhang, Lucia Zheng, Kaitlyn Zhou, and Percy Liang. On the opportunities and risks of foundation models, 2021. [2] Michael Moor , Oishi Banerjee, Zahra Shakeri Hossein Abad, Harlan M. Krumholz, Jure Lesk ov ec, Eric T opol, and Pranav Rajpurkar . F oundation models for generalist medical artificial intelligence. Nature , 616:259–265, 2023. [3] Chenyu W u, Xiaoman Zhang, Y a Zhang, Hui Hui, Y anfeng W ang, and W eidi Xie. T o wards generalist foundation model for radiology by lev eraging web-scale 2d&3d medical data. Natur e Communications , 16:7866, 2025. 14 T O K E N I Z A T I O N F O R E H R F O U N DAT I O N M O D E L [4] Xi Fu, Shentong Mo, Alejandro Buendia, Anouchka P . Laurent, Anqi Shao, Maria del Mar Alvarez-T orres, T ianji Y u, Jimin T an, Jiayu Su, Romella Sagatelian, Adolfo A. Ferrando, Alberto Ciccia, Y anyan Lan, Da vid M. Owens, T eresa Palomero, Eric P . Xing, and Raul Rabadan. A foundation model of transcription across human cell types. Natur e , 637:965–973, 2025. [5] Karan Singhal et al. T oward expert-lev el medical question answering with large language models. Natur e Medicine , 31:943–950, 2025. [6] Ethan Steinberg, K en Jung, Jason A. Fries, Conor K. Corbin, Stephen R. Pfohl, and Nigam H. Shah. Language models are an effecti ve representation learning technique for electronic health record data. Journal of Biomedical Informatics , 113:103637, 2021. [7] Ethan Steinber g, Jason Fries, Y izhe Xu, and Nigam Shah. Motor: A time-to-ev ent foundation model for structured medical records, 2023. [8] Lin Lawrence Guo, Ethan Steinberg, Scott L. Fleming, Jose Posada, Joshua Lemmon, Stephen R. Pfohl, Nigam H. Shah, Jason Fries, and Lillian Sung. Ehr foundation models improve robustness in the presence of temporal distribution shift. Scientific Reports , 13:3767, 2023. [9] Lin Lawrence Guo, Jason A. Fries, Ethan Steinberg, Scott L. Fleming, K eith Morse, Catherine Aftandilian, Jose Posada, Nigam H. Shah, and Lillian Sung. A multi-center study on the adaptability of a shared foundation model for electronic health records. npj Digital Medicine , 7:171, 2024. [10] Joshua Lemmon, Lin Lawrence Guo, Ethan Steinberg, Keith E. Morse, Scott Lanyon Fleming, Catherine Aftandilian, Stephen R. Pfohl, Jose D. Posada, Nigam Shah, Jason Fries, and Lillian Sung. Self-supervised machine learning using adult inpatient data produces effecti ve models for pediatric clinical prediction tasks. Journal of the American Medical Informatics Association , 30:2004–2011, 2023. [11] Michael W ornow , Rahul Thapa, Ethan Steinberg, Jason A. Fries, and Nigam H. Shah. Ehrshot: An ehr benchmark for few-shot e valuation of foundation models. In Proceedings of the 37th International Confer ence on Neural Information Pr ocessing Systems , 2023. [12] Michael W ornow , Y izhe Xu, Rahul Thapa, Birju Patel, Ethan Steinberg, Scott Fleming, Michael A. Pfeffer , Jason Fries, and Nigam H. Shah. The shaky foundations of large language models and foundation models for electronic health records. npj Digital Medicine , 6:135, 2023. [13] Junmo Kim, Joo Seong Kim, Ji-Hyang Lee, Min-Gyu Kim, T aehyun Kim, Chaeeun Cho, Rae W oong Park, and Kwangsoo Kim. Pretrained patient trajectories for adverse drug event prediction using common data model-based electronic health records. Communications Medicine , 5:232, 2025. [14] Pa wel Renc, Y ugang Jia, Anthon y E. Samir , Jaroslaw W as, Quanzheng Li, David W . Bates, and Arkadiusz Sitek. Zero shot health trajectory prediction using transformer . npj Digital Medicine , 7:256, 2024. [15] Shane W axler , Paul Blazek, Davis White, Daniel Sneider , Ke vin Chung, Mani Nagarathnam, P atrick Willia ms, Hank V oeller , Karen W ong, Matthe w Swanhorst, Sheng Zhang, Naoto Usuyama, Clif f W ong, Tristan Naumann, Hoifung Poon, Andrew Loza, Daniella Meek er , Seth Hain, and Rahul Shah. Generative medical e vent models improv e with scale, 2025. [16] Kyunghoon Hur , Jungwoo Oh, Junu Kim, Jiyoun Kim, Min Jae Lee, Eunbyeol Cho, Seong-Eun Moon, Y oung- Hak Kim, Louis Atallah, and Edward Choi. Genhpf: General healthcare predictive framework for multi-task multi-source learning. IEEE J ournal of Biomedical and Health Informatics , 28:502–513, 2024. [17] Rafi Al Attrach, Rajna Fani, David Restrepo, Y ugang Jia, and Peter Schüffler . Rethinking tokenization for clinical time series: When less is more, 2025. [18] Chao Pang, Jiheum Park, Xinzhou Jiang, Nishanth P arameshwar P avinkurv e, Krishna S. Kalluri, Shalmali Joshi, Noemie Elhadad, and Karthik Natarajan. Cehr-xgpt: A scalable multi-task foundation model for electronic health records, 2025. [19] Chao Pang, Xinzhuo Jiang, Krishna S. Kalluri, Matthew Spotnitz, RuiJun Chen, Adler Perotte, and Karthik Natarajan. Cehr-bert: Incorporating temporal information from structured ehr data to improve prediction tasks. In Pr oceedings of Machine Learning for Health , volume 158 of Pr oceedings of Machine Learning Resear ch , pages 239–260. PMLR, 2021. [20] Michael W ornow , Suhana Bedi, Miguel Angel Fuentes Hernandez, Ethan Steinberg, Jason Alan Fries, Christopher Ré, Sanmi K oyejo, and Nigam H. Shah. Context clues: Ev aluating long context models for clinical prediction tasks on ehrs, 2024. [21] Zeljko Kralje vic, Dan Bean, Anthony Shek, Rebecca Bendayan, Harry Hemingway , Joshua Au Y eung, Alexander Deng, Alfred Baston, Jack Ross, Esther Idowu, James T . T eo, and Richard J. B. Dobson. Foresight—a generati ve 15 T O K E N I Z A T I O N F O R E H R F O U N DAT I O N M O D E L pretrained transformer for modelling of patient timelines using electronic health records: a retrospecti ve modelling study . Lancet Digital Health , 6:e281–e290, 2024. [22] Laila Rasmy , Y ang Xiang, Ziqian Xie, Cui T ao, and Degui Zhi. Med-bert: pretrained contextualized embeddings on large-scale structured electronic health records for disease prediction. npj Digital Medicine , 4:86, 2021. [23] Lin Lawrence Guo, Santiago Eduardo Arciniegas, Adam Paul Y an, Jason A. Fries, George A. T omlinson, and Lillian Sung. Systematic revie w of foundation models for structured electronic health records. J ournal of the American Medical Informatics Association , 2026. [24] Klaus Gref f, Sjoerd v an Steenkiste, and Jürgen Schmidhuber . On the binding problem in artificial neural networks, 2020. [25] Alistair E. W . Johnson, Lucas Bulgarelli, Lu Shen, Alvin Gayles, A yad Shammout, Stev en Horng, T om J. Pollard, Sicheng Hao, Benjamin Moody , Brian Gow , Li-wei H. Lehman, Leo A. Celi, and Roger G. Mark. Mimic-iv , a freely accessible electronic health record dataset. Scientific Data , 10:1, 2023. [26] Lin Lawrence Guo, Maryann Calligan, Emily V ettese, Sadie Cook, George Gagnidze, Oscar Han, Jiro Inoue, Joshua Lemmon, Johnson Li, Medhat Roshdi, Bohdan Sado vy , Ste ven W allace, and Lillian Sung. Development and validation of the sickkids enterprise-wide data in azure repository (sedar). Heliyon , 9:e21586, 2023. [27] Bert Arnrich, Edw ard Choi, Jason Alan Fries, Matthe w B. B. McDermott, Jungw oo Oh, T om Pollard, Nigam Shah, Ethan Steinberg, Michael W ornow , and Robin van de W ater . Medical e vent data standard (meds): Facilitating machine learning for health. In ICLR 2024 W orkshop on Learning fr om T ime Series for Health , 2024. [28] Ethan Steinberg, Michael W ornow , Suhana Bedi, Jason A. Fries, Matthew McDermott, and Nigam H. Shah. meds_reader: A fast and ef ficient ehr processing library , 2024. [29] OHDSI. Mimic, 2021. [30] Ary L. Goldber ger , Luis A. N. Amaral, Leon Glass, Jef frey M. Hausdorf f, Plamen Ch. Ivano v , Roger G. Mark, Joseph E. Mietus, George B. Moody , Chung-Kang Peng, and H. Eugene Stanley . Physiobank, physiotoolkit, and physionet: components of a ne w research resource for complex physiologic signals. Cir culation , 101(23):E215– E220, 2000. [31] Adam P . Y an, Lin Lawrence Guo, Jiro Inoue, Santiago E. Arciniegas, Emily V ettese, Agata W olochacz, Nicole Crellin-Parsons, Brandon Purv es, Steven W allace, Azaz Patel, Medhat Roshdi, Karim Jessa, Bren Cardif f, and Lillian Sung. A roadmap to implementing machine learning in healthcare: from concept to practice. F r ontiers in Digital Health , 7:1462751, 2025. [32] Jianlin Su, Murtadha Ahmed, Y u Lu, Shengfeng Pan, W en Bo, and Y unfeng Liu. Roformer: Enhanced transformer with rotary position embedding. Neur ocomputing , 568:127063, 2024. [33] Ashish V aswani, Noam Shazeer , Niki Parmar , Jakob Uszkoreit, Llion Jones, Aidan N. Gomez, Lukasz Kaiser , and Illia Polosukhin. Attention is all you need. In Advances in Neur al Information Pr ocessing Systems , volume 30, 2017. [34] T om B. Brown, Benjamin Mann, Nick Ryder , Melanie Subbiah, Jared Kaplan, Prafulla Dhariwal, Arvind Nee- lakantan, Pranav Shyam, Girish Sastry , Amanda Askell, Sandhini Agarwal, Ariel Herbert-V oss, Gretchen Krueger , T om Henighan, Rewon Child, Aditya Ramesh, Daniel M. Ziegler , Jeffre y W u, Clemens W inter, Christopher Hesse, Mark Chen, Eric Sigler , Mateusz Litwin, Scott Gray , Benjamin Chess, Jack Clark, Christopher Berner, Sam McCandlish, Alec Radford, Ilya Sutske ver , and Dario Amodei. Language models are few-shot learners. In Advances in Neural Information Pr ocessing Systems , volume 33, pages 1877–1901, 2020. [35] Benjamin W arner , Antoine Chaf fin, Benjamin Clavié, Orion W eller, Oskar Hallström, Said T aghadouini, Alexis Gallagher , Raja Biswas, Faisal Ladhak, T om Aarsen, Nathan Cooper , Griffin Adams, Jeremy Ho ward, and Iacopo Poli. Smarter, better , faster , longer: A modern bidirectional encoder for fast, memory ef ficient, and long context finetuning and inference. In Pr oceedings of the 63rd Annual Meeting of the Association for Computational Linguistics , pages 2526–2547. Association for Computational Linguistics, 2025. [36] Rew on Child, Scott Gray , Alec Radford, and Ilya Sutskev er . Generating long sequences with sparse transformers, 2019. [37] Niklas Muennighof f, Alexander M. Rush, Boaz Barak, T even Le Scao, Aleksandra Piktus, Nouamane T azi, Sampo Pyysalo, Thomas W olf, and Colin Raffel. Scaling data-constrained language models. In Advances in Neural Information Pr ocessing Systems , volume 36, pages 50358–50376, 2023. [38] Jared Kaplan, Sam McCandlish, T om Henighan, T om B. Brown, Benjamin Chess, Re won Child, Scott Gray , Alec Radford, Jeffre y W u, and Dario Amodei. Scaling laws for neural language models, 2020. 16 T O K E N I Z A T I O N F O R E H R F O U N DAT I O N M O D E L [39] Adam Paszke, Sam Gross, Francisco Massa, Adam Lerer , James Bradbury , Gregory Chanan, Tre vor Killeen, Zeming Lin, Natalia Gimelshein, Luca Antiga, Alban Desmaison, Andreas K opf, Edward Y ang, Zachary DeV ito, Martin Raison, Alykhan T ejani, Sasank Chilamkurthy , Benoit Steiner , Lu Fang, Junjie Bai, and Soumith Chintala. Pytorch: An imperative style, high-performance deep learning library . In Advances in Neural Information Pr ocessing Systems , volume 32, pages 8024–8035, 2019. [40] Fabian Pedregosa, Gaël V aroquaux, Alexandre Gramfort, V incent Michel, Bertrand Thirion, Olivier Grisel, Mathieu Blondel, Peter Prettenhofer , Ron W eiss, V incent Dubourg, Jak e V anderplas, Alexandre Passos, David Cournapeau, Matthieu Brucher , Matthieu Perrot, and Édouard Duchesnay . Scikit-learn: Machine learning in python. Journal of Machine Learning Resear ch , 12:2825–2830, 2011. [41] Omer Goldman, A vi Caciularu, Matan Eyal, Kris Cao, Idan Szpektor, and Reut Tsarfaty . Unpacking tokenization: Evaluating text compression and its correlation with model performance. In Pr oceedings of the 62nd Annual Meeting of the Association for Computational Linguistics , 2024. [42] Craig W . Schmidt, V arshini Reddy , Haoran Zhang, Alec Alameddine, Omri Uzan, Y uv al Pinter , and Chris T anner . T okenization is more than compression. In Pr oceedings of the 2024 Conference on Empirical Methods in Natural Language Pr ocessing , 2024. [43] Alisa Liu, Jonathan Hayase, V alentin Hofmann, Sew oong Oh, Noah A. Smith, and Y ejin Choi. Superbpe: Space trav el for language models, 2025. [44] Pa wel Renc, Michal K Grzeszczyk, Nassim Oufattole, Deirdre Goode, Y ugang Jia, Szymon Bieganski, Matthew B.A. McDermott, Jaroslaw W as, Anthony E. Samir, Jonathan W . Cunningham, David W . Bates, and Arkadiusz Sitek. Foundation model of electronic medical records for adaptiv e risk estimation. GigaScience , 14, 2025. [45] V ijay Prakash Dwiv edi, V iktor Schlegel, Andy T . Liu, Thanh-T ung Nguyen, Abhinav Ramesh Kashyap, Jeng W ei, W ei-Hsian Y in, Stefan W inkler , and Robby T . T an. Representation learning of structured data for medical foundation models, 2024. 17 T O K E N I Z A T I O N F O R E H R F O U N DAT I O N M O D E L Supplementary Material Supplementary Figure S1. Cohort Construction for Pr etraining and Downstr eam Evaluation SickKids EHR Dataset as of 2025 - 05 - 07 Clinical events: 2018 -06 - 02 to 2025 -05 - 07 (N=2,027,582) T rain (n=1,844,512) Events up to 2023 - 05 - 31 V alidation (n=183,070) Events up to 2024 - 05 - 31 Patient - level random split (90/10) Pretraining Cohort Unit = patients Clinical Prediction T ask Cohort Unit = admissions All inpatient admissions (n=109,509) Excluded (n=21,944): - Age < 28 days (neonates) - Death or discharge within admission day Eligible admissions (n=87,565) T emporal Split T rain: ≤ 2023 -05 - 31 V alidation: 2023 - 06 -01 to 2024 -05 - 31 T est: ≥ 2024 - 06 -01 T rain (n=62,636) V alidation (n=12,944) T est (n=1 1,985) T ask - specific exclusion (e.g., positive outcome before prediction) All patients Eligibility Data Split Additional Exclusions Figure S1: Cohort Construction for Pretraining and Downstream Ev aluation. Pretraining (left) used a patient-level random split, with different temporal cutof fs for training and validation to e valuate models on more recent clinical data during pretraining. Downstream e valuation (right) used admission-le vel temporal splits across 74 clinical prediction tasks, aligned to the same calendar cutoffs as pretraining. T ask-specific exclusions (e.g., outcomes occurring before prediction time) were applied after cohort assignment. The unit of analysis was patients for pretraining and admissions for downstream prediction. Supplementary T able S1. Discrete Time-Interv al T okens Used in the T ime-T okens Conditions T oken Label* Duration Range INT_5m_15m** 5 minutes to 15 minutes INT_15m_1h 15 minutes to 1 hour INT_1h_2h 1 hour to 2 hours INT_2h_6h 2 hours to 6 hours INT_6h_12h 6 hours to 12 hours INT_12h_1d 12 hours to 1 day INT_1d_3d 1 day to 3 days INT_3d_1w 3 days to 1 week INT_1w_2w 1 week to 2 weeks INT_2w_1mt 2 weeks to 1 month INT_1mt_3mt 1 month to 3 months INT_3mt_6mt 3 months to 6 months INT_6mt 6 months (repeatable for longer durations) * T ime-interval bins and tok en insertion rules were based on prior work [14]. Specifically , no interv al token was inserted when the elapsed time between e vents w as shorter than 5 minutes. When the elapsed time e xceeded 6 months, multiple 6-month interv al tokens were inserted to approximate the total duration. Otherwise, a single interval tok en corresponding to the appropriate bin was used. 18 T O K E N I Z A T I O N F O R E H R F O U N DAT I O N M O D E L Supplementary T able S2. SickKids W orkflo w-stage Event Representations by Clinical Domain Clinical Domain* Without W orkflow With W orkflow** Measurement (Laboratory tests) Result Order → T aken → Result Measurement (Flowsheets) Single ev ent Single ev ent Procedure (Non-surgeries) Start Order → Start Procedure (Surgeries) Start Start → End Drug (Medication administrations) Administration Order → Administration Drug (Prescriptions) Start Order → Start V isit Start, End Start, End Diagnosis Single e vent Single ev ent Observation Single event Single e vent V isit Detail Single ev ent Single ev ent * Clinical domains are grouped by OMOP domain, with sub-domain qualifiers where workflow patterns dif fer (e.g., laboratory tests vs. flowsheets). Domains without multi-step workflows are unchanged across conditions. ** Arrows indicate the temporal ordering of w orkflow-stage e vents within a clinical action. Supplementary T able S3. Model Parameter Counts Event Time W orkflow Embedding Backbone* NTP head T otal Percent vocab .-dependent** Joint Positions No 19.4M 115.6M 19.4M 154.4M 25.1% Joint Positions Y es 27.1M 115.6M 27.2M 169.9M 32.0% Joint T okens No 19.4M 115.6M 19.4M 154.5M 25.2% Joint T okens Y es 27.2M 115.6M 27.2M 170.0M 32.0% Factorized Positions No 8.36M 115.6M 8.37M 132.4M 12.6% Factorized Positions Y es 8.99M 115.6M 9.01M 133.6M 13.5% Factorized T okens No 8.40M 115.6M 8.42M 132.4M 12.7% Factorized T okens Y es 9.04M 115.6M 9.06M 133.7M 13.5% * T ransformer backbone parameters correspond to the transformer architecture and are held constant across all experiments. ** V ocabulary-dependent parameters include the embedding layer (input token embedding matrix) and the ne xt-token prediction head during pretraining. Differences in total parameter count arise from changes in v ocabulary size across tokenization strategies Abbreviations: NTP – next-token prediction; M – million. 19 T O K E N I Z A T I O N F O R E H R F O U N DAT I O N M O D E L Supplementary T able S4. Training, Model, and Ev aluation Hyperparameters Hyperparameter V alue Pretraining optimization and batching Optimizer AdamW Learning rate 5e-4 Learning rate scheduler cosine_with_min_lr Num epochs 5 Gradient accumulation steps 2 Early stopping None Max tokens per batch 32,768 Min patients per batch 1 W eight decay 0.05 Max gradient norm (clipping) 1.0 W armup steps 150 Adam β 1 0.9 Adam β 2 0.95 Floating-point format bf16 T ransf ormer backbone Hidden size 768 Num layers 28 Num attention heads 12 Intermediate size 1,152 Activ ation GELU *Alternating dense layers Y es *Dense ev ery n layers 3 *Attention width 128 Linear probe (Logistic Regr ession) Input preprocessing StandardScaler Solver LBFGS Regularization L2 In verse regularization (C) 1, 0.1, 0.01, 0.001, 0.0001 Max iterations 10,000 * Batches were constructed using a fixed token b udget (32,768 tokens per batch) with a minimum of one patient per batch to accommodate variable-length patient sequences without padding. This imposes an effecti ve upper bound of 32,768 tokens per patient sequence (i.e., maximum context windo w). When multiple patient sequences were in a batch, causal masking prevented attention across patient boundaries, ensuring independent sequence modeling. ** The transformer alternates between global and local self-attention, starting with a global attention layer , followed by three local attention layers (attention width of 128), and repeating this pattern throughout. Supplementary T able S5. SickKids and MIMIC T ask Cohort Statistics T ask T otal Admissions T otal Patients Positive Cases Pr evalence (%) SickKids Blood Bank Platelet transfusion 86030 50720 2932 3.41 Red cell transfusion 81077 48223 6487 8.00 Procedur e In vasiv e intubation 84294 49537 1557 1.85 Gastrostomy tube 87401 51177 425 0.49 Echocardiogram 85630 50296 6757 7.89 Pulmonary function test 87418 51178 774 0.89 Lumbar puncture 86577 50857 2233 2.58 Surgery 67918 39119 11958 17.61 Interventional radiology 86539 50989 7339 8.48 Imaging Plain radiography chest 78058 46552 9129 11.70 Ultrasound abdomen 85025 50238 10640 12.51 Computerized tomography chest 87115 51084 2046 2.35 Computerized tomography abdomen 87103 51066 1233 1.42 Computerized tomography head 86174 50601 2900 3.37 20 T O K E N I Z A T I O N F O R E H R F O U N DAT I O N M O D E L T ask T otal Admissions T otal Patients Positive Cases Pr evalence (%) MRI head 85777 50391 5237 6.11 MRI whole body 87441 51178 158 0.18 PET 87444 51182 190 0.22 Laboratory Abnormality High white blood count 79413 47311 11209 14.11 Low white blood count 83847 49932 8673 10.34 High absolute neutrophil count 80692 47861 9873 12.24 Low absolute neutrophil count 86130 50754 6581 7.64 High bands 82411 48715 11817 14.34 High lymphocyte 85942 50567 4052 4.71 Low lymphoc yte 81840 48854 12300 15.03 High hemoglobin 84190 49804 3845 4.57 Low hemoglobin 76558 46493 17200 22.47 High mean corpuscular volume 84106 50126 6249 7.43 Low mean corpuscular v olume 84325 49823 4297 5.10 High reticulocyte count 86490 50878 3671 4.24 Low reticuloc yte count 86829 50884 2783 3.21 High platelet 82802 49347 10999 13.28 Low platelet 80032 48114 11532 14.41 High immature platelet fraction 85633 50531 5172 6.04 Low immature platelet fraction 86820 50895 2372 2.73 High mean platelet volume 85932 50628 4504 5.24 Low mean platelet v olume 83497 49309 7682 9.20 High fibrinogen 86881 50852 2074 2.39 Low fibrinogen 84828 49769 1568 1.85 High partial thromboplastin time 84523 49896 3330 3.94 High international normalized ratio 81124 48207 6544 8.07 High sodium 80268 47701 9034 11.25 Low sodium 84152 49895 7330 8.71 High potassium 83238 49323 7071 8.49 Low potassium 79405 47367 13023 16.40 High glucose 76531 45675 10759 14.06 Low glucose 85587 50554 3735 4.36 High creatinine 84100 49855 4814 5.72 High urea 86106 50794 3135 3.64 Low alb umin 84353 49870 10279 12.19 High alanine transaminase 83472 49667 8080 9.68 High aspartate aminotransferase 84283 49930 6830 8.10 High lactate dehydrogenase 86601 50809 2330 2.69 High bilirubin 83640 49416 4785 5.72 High cholesterol 87300 51131 537 0.62 High triglyceride 86804 50825 2349 2.71 High ferritin 86385 50637 3089 3.58 High creatinine kinase 87037 50919 675 0.78 High C reactiv e protein 81869 48546 10987 13.42 High erythrocyte sedimentation rate 86470 50702 2748 3.18 Low P aO2 86622 50790 2492 2.88 Low SpO2 60215 36121 20632 34.26 Medications Any antibacterial 55021 35011 17411 31.64 Any antifungal 86729 51130 2142 2.47 Any chemotherapy 83359 50997 3092 3.71 Any antiepileptics 78305 48262 6578 8.40 Any glucocorticoid 67347 40508 14145 21.00 Dexamethasone 70377 41571 9815 13.95 Any opioid 59884 34993 16019 26.75 Morphine 67581 39484 12160 17.99 Fentanyl 69306 40392 12485 18.01 Any inotrope 83893 49299 1861 2.22 Clinical Outcomes Long length of stay ( ≥ 7 days) 87565 51242 19422 22.18 Readmission within 30 days 86395 50586 14807 17.14 Mortality 87447 51182 514 0.59 21 T O K E N I Z A T I O N F O R E H R F O U N DAT I O N M O D E L T ask T otal Admissions T otal Patients Positive Cases Pr evalence (%) MIMIC Laboratory Abnormality High hemoglobin 58403 43968 88 0.15 Low hemoglobin 35499 28992 15397 43.37 High platelet 56924 43179 3169 5.57 Low platelet 52218 39892 8889 17.02 High sodium 57390 43241 3900 6.80 Low sodium 54759 41526 8457 15.44 High potassium 55915 42348 6168 11.03 Low potassium 56570 42678 8118 14.35 High glucose 39084 30204 14428 36.92 Low glucose 57967 43715 3732 6.44 Clinical Outcomes Long length of stay ( ≥ 7 days) 58513 44055 17218 29.43 Readmission within 30 days 58512 44055 3143 5.37 Mortality 58513 44055 1741 2.98 Abbreviations: SickKids – The Hospital for Sick Children; MIMIC – Medical Information Mart for Intensive Care. Supplementary T able S6. T okenization and V ocab ulary Statistics Event T ime W orkflow V ocabulary Size T otal T okens (Pretraining)* Mean T okens per Patient Joint Positions No 25,263 169,323,884 83.51 Joint Positions Y es 35,373 225,713,027 111.32 Joint T okens No 25,322 197,021,149 214.14 Joint T okens Y es 35,432 256,387,844 278.60 Factorized Positions No 10,889 331,800,377 163.64 Factorized Positions Y es 11,758 448,086,342 221.00 Factorized T okens No 10,948 359,497,647 390.73 Factorized T okens Y es 11,817 478,761,166 520.24 *T otal tokens used for pretraining include training and validation sets with temporal cutof fs. Supplementary T able S7. Pretraining Compute and T okens Seen Event T ime W orkflow T otal FLOPs (Pretraining) T okens Seen (Pretraining) Steps for 5 Epochs Joint Positions No 5 . 51 × 10 17 680,615,416 11,965 Joint Positions Y es 7 . 70 × 10 17 899,291,143 16,200 Joint T okens No 6 . 37 × 10 17 785,851,344 14,055 Joint T okens Y es 8 . 71 × 10 17 1,015,924,901 18,555 Factorized Positions No 9 . 61 × 10 17 1,291,693,160 24,300 Factorized Positions Y es 1 . 29 × 10 18 1,719,058,463 33,095 Factorized T okens No 1 . 04 × 10 18 1,390,730,204 26,360 Factorized T okens Y es 1 . 37 × 10 18 1,831,385,376 35,495 Differences in total FLOPs, number of tok ens seen, and training steps arise from differences in ef fective sequence length across tokenization strategies. Abbreviation: FLOPs – floating-point operations. 22 T O K E N I Z A T I O N F O R E H R F O U N DAT I O N M O D E L Supplementary T able S8. Main Experiment Full-Shot Performance Event Encoding T ime Encoding W orkflow Mean A UROC* Factorized T ime Positions No 0.872 Factorized T ime Positions Y es 0.881 Joint Time Positions No 0.882 Joint Time Positions Y es 0.886 Factorized T ime T okens No 0.865 Factorized T ime T okens Y es 0.874 Joint Time T okens No 0.876 Joint Time T okens Y es 0.880 * Mean A UR OC across 74 clinical prediction tasks. Abbreviation: A UROC – area under the recei ver operating characteristics curve. Supplementary T able S9. Main Experiment Full-Shot A UROC by T ask and T okenization Condition T ask Name Pos/F/No Pos/F/Y es Pos/J/No Pos/J/Y es T ok/F/No T ok/F/Y es T ok/J/No T ok/J/Y es Platelet transfusion 0.961 0.962 0.961 0.961 0.952 0.953 0.958 0.960 Red cell transfusion 0.913 0.912 0.922 0.922 0.907 0.912 0.917 0.915 In vasi ve intubation 0.928 0.933 0.936 0.931 0.920 0.931 0.936 0.934 Gastrostomy tube 0.914 0.902 0.925 0.936 0.921 0.905 0.920 0.910 Echocardiogram 0.869 0.892 0.874 0.897 0.866 0.883 0.871 0.882 Pulmonary function test 0.957 0.955 0.965 0.970 0.960 0.948 0.966 0.953 Lumbar puncture 0.936 0.952 0.948 0.949 0.940 0.949 0.948 0.946 Surgery 0.889 0.890 0.886 0.891 0.880 0.887 0.885 0.891 Interventional radiology 0.855 0.869 0.859 0.872 0.848 0.866 0.850 0.867 Plain radiography chest 0.808 0.832 0.821 0.822 0.803 0.816 0.812 0.823 Ultrasound abdomen 0.829 0.859 0.843 0.857 0.824 0.843 0.831 0.850 Computerized tomography chest 0.880 0.894 0.877 0.889 0.872 0.882 0.869 0.886 Computerized tomography abdomen 0.883 0.891 0.891 0.894 0.878 0.887 0.880 0.882 Computerized tomography head 0.908 0.919 0.917 0.922 0.903 0.909 0.912 0.917 MRI head 0.911 0.915 0.915 0.913 0.901 0.914 0.902 0.914 MRI whole body 0.934 0.921 0.934 0.917 0.901 0.874 0.900 0.914 PET 0.911 0.900 0.909 0.914 0.851 0.874 0.894 0.910 High white blood count 0.800 0.822 0.829 0.835 0.792 0.811 0.818 0.821 Low white blood count 0.896 0.899 0.921 0.912 0.896 0.895 0.911 0.907 High absolute neutrophil count 0.819 0.828 0.839 0.836 0.807 0.819 0.827 0.824 Low absolute neutrophil count 0.900 0.905 0.919 0.914 0.898 0.901 0.912 0.910 High bands 0.857 0.871 0.868 0.873 0.851 0.864 0.861 0.868 High lymphocyte 0.832 0.841 0.850 0.851 0.825 0.831 0.844 0.841 Low lymphoc yte 0.876 0.882 0.889 0.888 0.872 0.879 0.880 0.885 High hemoglobin 0.825 0.840 0.842 0.847 0.819 0.830 0.829 0.843 Low hemoglobin 0.868 0.881 0.882 0.889 0.863 0.877 0.877 0.885 High mean corpuscular volume 0.865 0.868 0.886 0.878 0.853 0.862 0.875 0.869 Low mean corpuscular v olume 0.812 0.826 0.847 0.848 0.791 0.814 0.822 0.824 High reticulocyte count 0.891 0.902 0.905 0.907 0.885 0.899 0.899 0.903 Low reticuloc yte count 0.867 0.882 0.876 0.889 0.855 0.874 0.877 0.875 High platelet 0.830 0.845 0.847 0.848 0.824 0.838 0.842 0.843 Low platelet 0.872 0.876 0.884 0.884 0.867 0.871 0.880 0.882 High immature platelet fraction 0.872 0.887 0.882 0.887 0.865 0.877 0.884 0.884 Low immature platelet fraction 0.859 0.875 0.871 0.882 0.850 0.853 0.870 0.877 High mean platelet volume 0.894 0.900 0.906 0.900 0.882 0.889 0.901 0.900 Low mean platelet v olume 0.786 0.795 0.796 0.806 0.774 0.785 0.793 0.792 High fibrinogen 0.894 0.887 0.892 0.893 0.886 0.887 0.890 0.886 Low fibrinogen 0.893 0.896 0.908 0.902 0.884 0.890 0.896 0.896 High partial thromboplastin time 0.890 0.897 0.898 0.897 0.886 0.888 0.895 0.897 High international normalized ratio 0.866 0.873 0.886 0.890 0.863 0.879 0.880 0.881 High sodium 0.828 0.837 0.852 0.848 0.828 0.842 0.842 0.843 Low sodium 0.831 0.841 0.850 0.850 0.828 0.834 0.839 0.842 High potassium 0.826 0.834 0.835 0.834 0.818 0.832 0.827 0.836 Low potassium 0.855 0.863 0.870 0.867 0.851 0.861 0.859 0.865 High glucose 0.829 0.840 0.839 0.846 0.822 0.835 0.832 0.843 Low glucose 0.863 0.869 0.881 0.879 0.861 0.869 0.872 0.873 High creatinine 0.886 0.893 0.905 0.899 0.874 0.885 0.888 0.893 High urea 0.916 0.924 0.933 0.928 0.912 0.919 0.926 0.924 Low alb umin 0.879 0.888 0.885 0.888 0.874 0.884 0.880 0.888 High alanine transaminase 0.859 0.870 0.879 0.882 0.858 0.866 0.874 0.868 High aspartate aminotransferase 0.859 0.871 0.880 0.883 0.852 0.863 0.875 0.872 High lactate dehydrogenase 0.890 0.918 0.898 0.912 0.893 0.899 0.894 0.900 High bilirubin 0.884 0.894 0.896 0.899 0.878 0.891 0.890 0.896 High cholesterol 0.900 0.904 0.887 0.905 0.858 0.871 0.876 0.886 High triglyceride 0.830 0.847 0.850 0.863 0.840 0.854 0.843 0.853 23 T O K E N I Z A T I O N F O R E H R F O U N DAT I O N M O D E L T ask Name Pos/F/No Pos/F/Y es Pos/J/No Pos/J/Y es T ok/F/No T ok/F/Y es T ok/J/No T ok/J/Y es High ferritin 0.865 0.888 0.875 0.889 0.859 0.874 0.876 0.883 High creatinine kinase 0.901 0.904 0.909 0.923 0.872 0.895 0.897 0.910 High C-reactiv e protein 0.844 0.850 0.851 0.859 0.835 0.854 0.842 0.851 High erythrocyte sedimentation rate 0.910 0.913 0.922 0.915 0.907 0.910 0.917 0.903 Low P aO2 0.954 0.951 0.956 0.952 0.947 0.953 0.950 0.950 Low SpO2 0.808 0.814 0.814 0.824 0.802 0.811 0.808 0.823 Any antibacterial 0.858 0.874 0.866 0.879 0.849 0.878 0.858 0.875 Any antifungal 0.936 0.943 0.939 0.946 0.928 0.948 0.937 0.944 Any chemotherapy 0.967 0.972 0.973 0.970 0.962 0.967 0.961 0.966 Any antiepileptics 0.850 0.855 0.852 0.862 0.848 0.860 0.845 0.860 Any glucocorticoid 0.820 0.834 0.824 0.834 0.818 0.832 0.823 0.837 Dexamethasone 0.823 0.830 0.823 0.833 0.820 0.832 0.825 0.839 Any opioid 0.856 0.870 0.858 0.871 0.853 0.868 0.859 0.872 Morphine 0.839 0.867 0.837 0.863 0.834 0.862 0.841 0.863 Fentanyl 0.853 0.856 0.852 0.859 0.846 0.853 0.852 0.855 Any inotrope 0.915 0.916 0.932 0.919 0.903 0.912 0.913 0.915 Long length of stay (>= 7 days) 0.812 0.825 0.822 0.828 0.817 0.823 0.822 0.826 Readmission within 30 days 0.794 0.798 0.796 0.792 0.794 0.795 0.795 0.802 Mortality 0.940 0.941 0.946 0.939 0.925 0.929 0.943 0.940 Abbreviation: A UROC – area under the receiv er operating characteristics curve; Pos – positions; T ok – tokens; F – factorized; J – joint. Supplementary T able S10. Main Experiment Fixed-Effect Estimates Effect β (A UR OC) 95% CI p value Intercept* 0.870 [0.860, 0.880] < 0 . 001 T ime Encoding: T ime-Positions vs. T ime-T okens 0.007 [0.005, 0.008] < 0 . 001 Event Encoding: Joint vs Factorized 0.008 [0.007, 0.009] < 0 . 001 W orkflow: Y es vs. No 0.007 [0.006, 0.008] < 0 . 001 Fixed-ef fect estimates from a linear mixed-effects model where task-le vel A UR OC is the outcome across 74 clinical prediction tasks. The model included time encoding, ev ent encoding, and workflo w as fixed ef fects, with task included as a random intercept. p-values were computed using a W ald t-distribution approximation. *Intercept reflects T ime-Positions, Factorized and No W orkflow . Abbreviations: A UROC – area under the recei ver operating characteristics curve; CI – confidence interv al. 24 T O K E N I Z A T I O N F O R E H R F O U N DAT I O N M O D E L Supplementary Figure S2. Effect of T okenization Design Choices on Sample Efficiency Figure S2: Effect of T okenization Design Choices on Sample Ef ficiency . (A) Mean A UR OC as a function of the number of labeled training examples (shots) for time encoding (Time-Positions vs T ime-T okens), event encoding (Joint vs Factorized), and workflo w (W ith vs W ithout). Error bars indicate ± 1 standard error . Horizontal dashed lines denote av erage full-shot A UR OC. (B) Mean A UR OC differences between paired tokenization strate gies at each shot size. Error bars denote ± 1 standard error . Abbreviation: A UROC – area under the recei ver operating characteristics curve. Supplementary T able S11. Sample Efficiency Ev aluation Fixed-Ef fect and Interaction Estimates Effect β (A UR OC) 95% CI p value Main effects (at 32 shot) T ime Encoding: T ime Positions vs T ime T okens 0.006 [0.005, 0.007] < 0 . 001 Event Encoding: Joint vs. Factorized 0.008 [0.007, 0.009] < 0 . 001 W orkflow: Y es vs No 0.007 [0.006, 0.008] < 0 . 001 Interactions with log 2 (shot size) T ime encoding × log 2 (shot size) 0.001 [0.000, 0.001] 0.012 Event encoding × log 2 (shot size) 0.000 [-0.000, 0.001] 0.266 W orkflow × log 2 (shot size) -0.000 [-0.001, 0.000] 0.161 Fixed-ef fect estimates from a linear mixed-effects model where task-le vel A UR OC is the outcome across 74 clinical prediction tasks. The model included time encoding, ev ent encoding, workflow , log-transformed shot size (centered at 32 examples), and their interactions as fixed ef fects, with task included as a random intercept. Reference levels are T ime-Positions, Factorized, and No W orkflow . p-values were computed using a W ald t-distribution approximation. Abbreviations: A UR OC – area under the receiv er operating characteristics curve; CI – confidence interv al. 25 T O K E N I Z A T I O N F O R E H R F O U N DAT I O N M O D E L Supplementary T able S12. Event Encoding Ablation Fixed-Ef fect and Interaction Estimates Effect β (A UR OC) 95% CI p value Main effects Factorized (vs Joint) -0.001 [-0.003, 0.001] 0.230 Attributes (vs Code only) 0.009 [0.007, 0.010] < 0 . 001 W orkflow (vs Code only) 0.007 [0.005, 0.009] < 0 . 001 Full (vs Code only) 0.013 [0.012, 0.015] < 0 . 001 Fixed e vent (vs Fixed length) 0.000 [-0.002, 0.002] 0.935 Key interactions Factorized × Attributes -0.009 [-0.011, -0.006] < 0 . 001 Factorized × W orkflow 0.002 [-0.001, 0.005] 0.188 Factorized × Full -0.005 [-0.008, -0.002] < 0 . 001 Fixed-ef fect estimates from a linear mixed-effects model where task-le vel A UR OC is the outcome across 74 clinical prediction tasks. The model included ev ent encoding (Joint vs Factorized), information content (Code only , +Attrib utes, +W orkflo w , Full), sequence length regime (Fix ed-length vs Fixed-e vent), and corresponding interactions as fix ed effects, with task included as a random intercept. Reference lev els are Joint encoding, Code-only information content, and Fixed-length regime. p-values we re computed using a W ald t-distribution approximation. All interaction terms not shown in the table were non-significant (p > 0.958). Abbreviations: A UROC – area under the recei ver operating characteristics curve; CI – confidence interv al. Supplementary T able S13. Time Encoding Ablation Fix ed-Ef fect Estimates T ime encoding (vs Order only) β (A UR OC) 95% CI p value T ime Positions (RoPE) 0.003 [0.001, 0.004] < 0 . 001 Positions + Scalar 0.003 [0.001, 0.004] < 0 . 001 T ime T okens -0.003 [-0.005, -0.002] < 0 . 001 Fixed-ef fect estimates from a linear mixed-effects model where task-le vel A UR OC is the outcome across 74 clinical prediction tasks. The model included time encoding strategy (Order -only , Time-Positions, T ime-T okens, Positions + Scalar) as a fix ed ef fect, with task included as a random intercept. p-values were computed using a W ald t-distribution approximation. Abbreviations: A UROC – area under the receiv er operating characteristics curve; CI – confidence interval. Supplementary T able S14. Transfer Performance on MIMIC by T okenization Condition Event Encoding T ime Encoding W orkflow Mean A UROC* Factorized T ime-Positions No 0.808 Factorized T ime Positions Y es 0.806 Joint Time Positions No 0.815 Joint Time Positions Y es 0.813 Factorized T ime T okens No 0.804 Factorized T ime T okens Y es 0.805 Joint Time T okens No 0.811 Joint Time T okens Y es 0.815 * Mean A UR OC for 13 MIMIC clinical prediction tasks using linear probes trained on frozen foundation models pretrained on SickKids. Abbreviation: A UROC – area under the recei ver operating characteristics curve. Supplementary T able S15. Transfer A UROC on MIMIC by T ask and T okenization Condition T ask Name Pos/F/No Pos/F/Y es Pos/J/No Pos/J/Y es T oks/F/No T oks/F/Y es T oks/J/No T oks/J/Y es High hemoglobin 0.677 0.721 0.723 0.692 0.704 0.696 0.670 0.720 Low hemoglobin 0.853 0.851 0.849 0.851 0.856 0.857 0.856 0.855 High platelet 0.765 0.754 0.775 0.764 0.757 0.761 0.777 0.776 Low platelet 0.806 0.796 0.814 0.814 0.804 0.797 0.816 0.811 High sodium 0.795 0.788 0.819 0.816 0.789 0.795 0.809 0.810 Low sodium 0.804 0.799 0.816 0.815 0.792 0.796 0.815 0.812 High potassium 0.814 0.808 0.817 0.821 0.802 0.802 0.819 0.817 26 T O K E N I Z A T I O N F O R E H R F O U N DAT I O N M O D E L T ask Name Pos/F/No Pos/F/Y es Pos/J/No Pos/J/Y es T oks/F/No T oks/F/Y es T oks/J/No T oks/J/Y es Low potassium 0.809 0.800 0.819 0.816 0.806 0.808 0.820 0.819 High glucose 0.921 0.921 0.920 0.920 0.925 0.924 0.922 0.920 Low glucose 0.766 0.763 0.764 0.770 0.758 0.768 0.763 0.773 Long length of stay (>= 7 days) 0.794 0.791 0.785 0.789 0.789 0.788 0.782 0.789 Readmission within 30 days 0.815 0.819 0.816 0.814 0.809 0.813 0.820 0.818 Mortality 0.887 0.871 0.883 0.889 0.859 0.861 0.880 0.881 Abbreviation: A UR OC – area under the receiv er operating characteristics curve; Pos – positions; T oks – tokens; Factor – factorized. Supplementary T able S16. External Evaluation (MIMIC) Fixed-Ef fect Estimates Effect β (A UR OC) 95% CI p value Intercept* 0.806 [0.777, 0.835] < 0 . 001 T ime Encoding: T ime Positions vs T ime T okens 0.002 [-0.001, 0.005] 0.271 Event Encoding: Joint vs Factorized 0.008 [0.005, 0.011] < 0 . 001 W orkflow: Y es vs No 0.000 [-0.003, 0.004] 0.803 Fixed-ef fect estimates from a linear mixed-effects model where task-le vel A UROC is the outcome across 13 MIMIC clinical prediction tasks in the external e valuation of the SickKids foundation model. The model included time encoding, ev ent encoding, and workflo w as fixed ef fects, with task included as a random intercept. p-values were computed using a W ald t-distribution approximation. *Intercept reflects T ime-Positions, Factorized and No W orkflow . Abbreviations: A UR OC – area under the receiv er operating characteristics curve; CI – confidence interv al. Supplementary T able S17. MIMIC Reference Performance by T okenization Condition T ime Encoding Event Encoding Mean A UR OC* T ime Positions Factorized 0.839 T ime Positions Joint 0.842 T ime T okens Factorized 0.836 T ime T okens Joint 0.836 *Mean A UR OC across 13 MIMIC clinical prediction tasks for models pretrained directly on MIMIC using a MIMIC-deriv ed vocab ulary . These results represent an upper-bound reference for transfer experiments, where models pretrained at SickKids are ev aluated on MIMIC using a fixed source vocab ulary . Abbreviation: A UROC – area under the recei ver operating characteristics curve. Supplementary T able S18. MIMIC Reference A UROC by T ask and T okenization Condition T ask Name Pos/Factor Pos/Joint T oks/Factor T oks/Joint High hemoglobin 0.649 0.659 0.688 0.629 Low hemoglobin 0.879 0.876 0.869 0.874 High platelet 0.820 0.834 0.811 0.824 Low platelet 0.841 0.850 0.830 0.840 High sodium 0.833 0.844 0.821 0.833 Low sodium 0.835 0.837 0.832 0.838 High potassium 0.850 0.848 0.845 0.847 Low potassium 0.832 0.835 0.836 0.837 High glucose 0.938 0.935 0.935 0.938 Low glucose 0.816 0.815 0.802 0.805 Long length of stay (>= 7 days) 0.840 0.833 0.833 0.828 Readmission within 30 days 0.850 0.852 0.842 0.843 Mortality 0.926 0.932 0.928 0.930 Abbreviation: A UR OC – area under the receiv er operating characteristics curve; Pos – positions; T oks – tokens; Factor – factorized. 27
Original Paper
Loading high-quality paper...
Comments & Academic Discussion
Loading comments...
Leave a Comment