Toward Expert Investment Teams:A Multi-Agent LLM System with Fine-Grained Trading Tasks
The advancement of large language models (LLMs) has accelerated the development of autonomous financial trading systems. While mainstream approaches deploy multi-agent systems mimicking analyst and manager roles, they often rely on abstract instructi…
Authors: Kunihiro Miyazaki, Takanobu Kawahara, Stephen Roberts
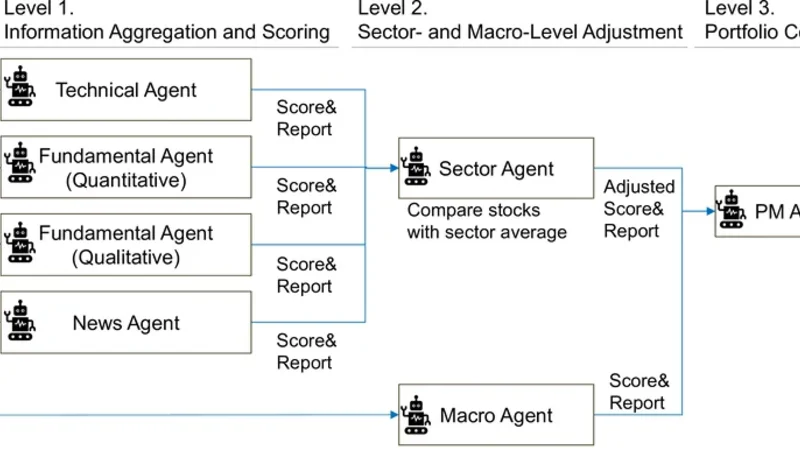
T owar d Expert Investment T eams: A Multi- Agent LLM System with Fine-Grained T rading T asks Kunihiro Miyazaki Japan Digital Design, Inc. T okyo, Japan kunihirom@acm.org T akanobu Kawahara Japan Digital Design, Inc. T okyo, Japan takanobu.kawahara@japan- d2.com Stephen Roberts Department of Engineering Science University of Oxford United Kingdom sjrob@robots.ox.ac.uk Stefan Zohren Department of Engineering Science University of Oxford United Kingdom stefan.zohren@eng.ox.ac.uk Abstract The advancement of large language models (LLMs) has accelerated the development of autonomous nancial trading systems. While mainstream approaches deploy multi-agent systems mimicking analyst and manager roles, they often rely on abstract instruc- tions that overlook the intricacies of real-world workows, which can lead to degraded inference performance and less transparent decision-making. Therefor e, we propose a multi-agent LLM trading framework that explicitly de composes investment analysis into ne- grained tasks, rather than providing coarse-grained instructions. W e evaluate the proposed framework using Japanese stock data, including prices, nancial statements, news, and macro informa- tion, under a leakage-controlled backtesting setting. Experimental results show that ne-grained task decomposition signicantly improves risk-adjusted returns compared to conventional coarse- grained designs. Crucially , further analysis of intermediate agent outputs suggests that alignment between analytical outputs and downstream decision preferences is a critical driver of system per- formance. Moreover , we conduct standar d portfolio optimization, exploiting low correlation with the stock index and the variance of each system’s output. This approach achieves sup erior performance. These ndings contribute to the design of agent structure and task conguration when applying LLM agents to trading systems in practical settings. CCS Concepts • Applied computing → Economics ; Business-I T alignment ; • Computing metho dologies → Multi-agent systems ; Natural language processing . Ke ywords LLM, Multi- Agent System, T rading, Investing, Prompt Design 1 Introduction The rapid advancement of Large Language Models (LLMs) has led to high expectations that they function as an autonomous workforce, like human emplo yees, in practical domains [ 36 , 50 ]. Consequently , many companies have initiated the internal and external implemen- tation of “ AI agents” [ 4 , 46 , 53 ]. In the nancial industr y , the devel- opment of AI agents has begun across various applications [ 9 , 39 ], with expectations to generate prots in both investment and trad- ing contexts through the utilization of agent-based autonomy and intelligence [ 34 , 62 ]. One of the most common congurations is a multi-agent trading system, in which multiple LLM agents are assigned specic roles such as fundamental analysis, news parsing, and risk management [62, 68, 72]. Howev er , considering practical applications, concerns exist that current LLM trading systems are constructed with a simplied task design, given the complexity of investment analyst tasks. Most existing studies adopt coarse-grained task settings, primarily as- signing roles and high-level objectives to agents. For instance, a fundamental agent tends to be simply instructed to “analyze nan- cial statements (e.g., 10-K)” , leaving unexplored the ne-grained task design for both qualitative and quantitative analyses typically performed in real-world situations [62, 68, 72]. Providing coarse-grained instructions to LLMs for complex tasks presents two major challenges. The rst is performance degradation. It has been reporte d that o verly vague instructions can reduce the output quality of LLMs [ 21 , 74 ], and when tasks are too complex, LLMs have been obser v ed to occasionally cease reasoning mid- way or abandon reasoning entirely [ 52 , 60 ]. The second is the lack of interpretability . When LLMs are given ambiguous instructions, typically only the nal output is visualized, making it impossible to interpret the intermediate reasoning process [ 43 , 71 ]. In such cases, practical deployment be comes dicult, especially in asset management practices where signicant capital is at stake [18]. T o address these issues, this study constructs a multi-agent LLM trading system that assigns detailed, concrete investment decision- making tasks to trading agents, based on real-world practices of investment analysts. In contexts beyond nance, it has been r e- ported that providing expert processes to LLM agent systems is eective [ 14 ]. Furthermore , separating task planning from execution is reported to be eective in LLM agent systems [ 49 , 57 ]. It is also noted that performance improves when domain experts design the tasks [ 28 ]. Inspired by these studies, we anticipate that tracing the complex worko ws of real-world investment analysts will enhance the performance of investment agents. Furthermore, responding to concrete tasks is expected to impro ve the agents’ output explain- ability [ 13 , 22 , 66 ], which is crucial for industrial applications [ 18 ]. In the experiment, we conduct backtesting to evaluate whether our proposed ne-grained task conguration leads to performance 1 , , Miyazaki et al. improvements. The evaluation uses Japanese equity market data, including stock prices, nancial statements, news articles, and macroeconomic information. T o prevent data leakage and account for the LLM model’s knowledge cuto, we set the backtesting pe- riod from September 2023 to November 2025. Beyond portfolio- level performance, w e also evaluate intermediate te xtual outputs to analyze how task decomposition aects reasoning behavior and interpretability . Finally , to demonstrate real-world applicability , we verify the strategy’s eectiveness through portfolio optimization benchmarked against market indices. This study makes the following contributions. Impact of Task Granularity: W e focus on task design for LLM-based trading agents, which has been largely overlooked in prior works, and demonstrate through controlled experiments that ne-grained task decomposition improves agent performance. A gent Ablation Anal- ysis: W e conduct a comprehensive ablation study by systematically removing and replacing individual agents, providing ne w insights into the functional roles of agents in multi-agent trading systems. Real-world Evaluation: W e emphasize real-w orld applicability by adopting realistic problem settings ( e.g., agent roles and team ar- chitecture) and evaluating not only portfolio-level performance but also intermediate te xtual outputs and portfolio optimization results benchmarked against market indices. Reproducibility: T o support reproducibility and future research, we r elease the implementation codes with prompts upon acceptance. 2 Related W ork 2.1 Multi- Agent T rading Systems with LLMs In the emergence of LLM trading systems, whereas early stud- ies primarily adopted single-agent architectures [34], more recent work has shifted toward multi-agent trading systems that more closely resemble real investment teams [ 51 ]. In such systems, mul- tiple agents are assigned complementary roles and collaborate to process heterogeneous nancial information [ e.g. 24 , 62 , 64 , 68 , 72 ]. The focus of existing research on multi-agent LLM trading can broadly be grouped into two categories [ 51 ]. The rst category involves the eorts concerning their organizational structure and roles, such as agents’ arrangements, interactions between agents, and role diversication, often inspir ed by real nancial institutions. These typically adopt a manager–analyst architecture , where a man- ager coordinates several specialized analyst agents that collect, lter , and synthesize information from various sources [ 68 ]. Analyst roles span a wide range of functions, including fundamental analysis [ 72 ], technical analysis [ 64 ], news sentiment e xtraction [ 62 ], and risk management [ 29 , 67 ]. The second category focuses on reinforce- ment learning-based approaches, which aim at improving decision policies through iterative feedback. Notable directions include Re- ection mechanisms, which incorporate realized trading outcomes into subsequent reasoning, and Layered Memory architectures that regulate the temporal scope of accessible information [55, 68, 70]. Our r esearch builds on the rst r esearch focus, namely , structure and roles. While prior studies car efully design both the structure and roles of agents, the prompts that specify how each role should operate have not been fully explored—they ar e often dened at a relatively coarse level, without explicitly aligning them with real in- vestment tasks. This is presumably because the eld of multi-agent systems for LLM-based trading is nascent; research has primarily focused on achieving end-to-end trading completion, with little light shed on the granular details of task execution. In contrast, we aim to formulate role prompts in a more ne-grained and realistic manner that delib erately imitates the division of labor in real invest- ment organizations, to improve controllability and interpretability of trading performance. Furthermore, despite the growing interest in agent-based LLM trading systems, we believe that agent-lev el ab- lation studies remain relatively underexplored; thus, by conducting a systematic analysis, we provide important practical insights. 2.2 Prompt Designs and Expert T ask Settings Recent LLM research explores whether explicitly planning and de- composing problems (rather than providing simple and ambiguous instructions) can improv e performance on complex tasks. Frame- works such as MetaGPT [ 14 ] and Agent-S [ 1 ] demonstrate that encoding Standard Operating Procedures (SOPs) into multi-agent systems can reduce errors and enhance output quality , particularly in software-engineering tasks. Related approaches, including the “plan-and-execute” [ 57 ] and “blueprint-rst” [ 49 ] paradigms, fur- ther suggest that xing workow structures—rather than allowing LLMs to autonomously determine task sequences—helps stabilize long-context reasoning. T aken together , these results indicate that embedding expert knowledge into prompts can improve reliability and performance, consistent with ndings reporte d in Li et al . [28] . In contrast, the nancial domain is only beginning to explore how such “ expert processes” can be formalized for LLMs. Existing approaches often rely on agents inspired by real or virtual investor personas [ 7 , 67 ] or on systems that allow humans to intervene dur- ing reasoning [ 58 ]. Howev er , these systems typically do not treat expert workows themselves as e xplicit structural components. The work most closely related to ours is Financial Chain-of- Thought (Co T) prompting introduced in FinRobot [ 20 , 65 ]. By pre- structuring nancial analysis into predened sections, FinRobot encourages domain-specic r easoning when generating analysis re- ports. Our approach diers from the prior work in several respects. First and foremost, we formalize expert worko ws as xed analy- sis protocols, rather than relying on generic Co T -style prompting. Second, rather than focusing on report generation, we aim to op- erationalize trading decisions. Third, we extend beyond rm-le vel analysis by incorp orating other factors such as macroeconomic information and sector information. 3 Problem Setting The primary aim of this study is to investigate whether providing ne-grained task specications to LLM agents in automated trading contributes to improved operational performance. T o validate the eectiveness of the multi-agent system with the proposed setting, we conduct evaluations under constraints that mimic the invest- ment practices of institutional investors. Specically , we construct and backtest a monthly rebalancing portfolio based on a long-short strategy targeting large-cap stocks in Japanese equity markets. 3.1 Backtesting and Model Setup Investment Universe: W e use the TOPIX 100 constituents, repre- senting stocks with the highest market capitalization in Japan. 2 T oward Expert Investment Teams: A Multi-Agent LLM System with Fine-Grained Trading T asks , , Portfolio Construction: T o eliminate market-wide volatility risk and isolate sto ck selection capability , we adopt a market-neutral strategy . Specically , the portfolio holds an equal number of stocks for both long ( buy ) and short (sell) positions with equal weighting. Rebalancing Frequency: W e conduct portfolio rebalancing at the opening of the rst business day of each month. T est Period: The evaluation covers the period from Septemb er 2023 to November 2025, totaling 27 months. Model Selection and Lo ok-ahead Bias Mitigation: W e employ state-of-the-art LLMs, specically the GPT -4o [ 15 ] with the knowl- edge cuto date in August 2023, as an inference model. Previous research warns that LLMs may “memorize ” historical nancial time-series data present in their training corpora, posing a risk of look-ahead bias that articially inates backtesting results [ 35 ]. T o guarantee the validity of our backtest, it is crucial to strictly separate the agent’s knowledge from future events [ 10 , 16 ]. In this experiment, we enforce strict temporal ordering by feeding the agents only text and market data publicly available up to the spe- cic decision point and by conducting the backtesting period after the LLM’s knowledge cuto date, thereby pr eventing information leakage. For the model setting, we use the default, such that the temperature is set to unity . While a temperature of zero might se em preferable for r educing variation, it does not fully eliminate stochas- ticity [ 3 , 42 ]. Since we aggregate multiple outputs using the median in our experiment, variability is alr eady mitigated. Also, fr om an ensemble perspective, a temperature of unity can be preferable as it preserves useful output diversity [ 8 , 59 ]. As for the inference time, we note that since we conduct a monthly r ebalancing, real-time processing is unnecessary . 3.2 Evaluation Metrics W e assess the performance of the agent-generated p ortfolios using both quantitative and qualitative metrics. Quantitative Metrics: W e use the standard measure of risk-adjusted return, namely the Sharpe ratio. W e calculate it as the mean of monthly portfolio returns divided by their standard deviation. Qualitative Metrics: W e analyze the scores and reasoning te xts generated by the analyst agents to assess how these agents com- municate with the manager agents. 4 Multi- Agent Framew ork Conguration Prior to detailing the ne-grained tasks assigned to each agent, this section outlines our baseline conguration of the LLM investment team. While multi-agent systems generally allow for exible com- position of agents [e.g., 55 , 62 , 64 , 68 , 72 ], from a practical industry perspective, we aim to assemble the realistic comp onents emulating the operational workows of professional institutional investors. 4.1 Hierarchical Decision-Making Process The system adopts a b ottom-up manager-analyst framework for decision-making, where information is progressively abstracted and aggregated through a multi-lev el hierarchical structure from analysts to the portfolio manager . Figure 1 depicts an overview of our trading system composition. Level 1. Information A ggregation and Scoring ( Analyst Agents): Four types of specialist agents—Quantitative, Qualitative, News, and T echnical—analyze each sto ck in the investment universe. The Quantitative and T e chnical A gents assign attractive scores 𝑆 ∈ [ 0 , 100 ] and generate a textual rationale supporting their evalu- ation based on their sp ecic domain expertise. The Qualitative and News Agents generate the supplemental information ( scores and texts). The output scores and reports are integrated and submitted to the Sector Agent. Level 2. Sector-Level Adjustment (Se ctor Agent): The Sector Agent aggr egates scores and reports from subordinate analysts and adjusts them based on sector-specic benchmarks. Specically , a stock’s quantitative valuation score is re-e valuated against sector averages. The adjusted scores and reports are submitted to the Portfolio Manager (PM) agent. Level 2. Macro-Environmental Assessment (Macro Agent): Independently , the Macro Agent analyzes broader economic indi- cators, such as interest rate trends, business cycles, and foreign exchange dynamics. It evaluates the current market regime and submits scores and texts to the PM Agent. Level 3. Final Portfolio Construction (PM Agent): The PM Agent synthesizes the scores and reports fr om the Sector Agent and the Macro Agent to determine nal scores for all stocks in the TOPIX 100. Then, we select the same number of stocks for long positions with the highest scores and the short positions with the lowest scores to construct a portfolio. 4.2 Data Sources The agents access a combination of structured and unstructured data to inform their decisions. Considering reproducibility , we ad- here to open data as much as possible. Stock Price Data: W e use daily prices of stocks in TOPIX 100 ob- tained from Y ahoo Finance [ 2 ]. W e use close prices to calculate the metrics for inv estment decisions, and use open prices for e xecution and performance evaluation. T o clarify , we conduct rebalancing af- ter the market close of the last business day of a month and execute it at the open of the rst business day of the following month. Financial Statements Data: W e utilize quarterly , semi-annual, and annual securities reports of companies. W e retrieve these doc- uments through the EDINET API [ 11 ] managed by the Financial Services Agency (FSA) of Japan. W e use both numerical nancial statements and qualitative textual information. News Data: T o capture sentiment and ev ents (e .g., scandals, prod- uct launches) related to companies, we aggregate headlines and freely accessible article previews from major nancial news out- lets, including Nikkei , Reuters , and Bloomberg (all Japanese editions) sourced from Ceek.jp News [ 6 ], a comprehensive aggregator of virtually all Japanese news media articles. Macroeconomic Data: T o gauge the macr oeconomic environment, we compile a comprehensive dataset using the FRED [ 12 ] and Y ahoo Finance. W e use the metrics from four dimensions: Rates & Policy includes the US Federal Funds Rate, US 10Y T reasury Yield, JP Policy Rate, and JP 10Y JGB Yield; Ination & Commodities covers US and JP CPI, along with Gold and Crude Oil prices; Growth & Econ- omy tracks US Non-Farm Payrolls, Industrial Production, Housing Starts, Unemployment Rate, and the JP Business Conditions Index; and Market & Risk indicators include the USD/JPY exchange rate, major equity indices (Nikkei 225, S&P 500), and volatility indices 3 , , Miyazaki et al. Fundamental Agent (Quantitative) PM Agent Fundamental Agent (Qualitative) T echnical Agen t News Agent Score& Report Score& Report Score& Report Sector Agent Compare stocks with sector average Macro Agent Adjusted Score& Report Final score for each stock Financial statements Stock prices News texts Macroeconomics data Input data Level 1. Information Aggregation and Scoring Level 2. Sector- and Macro-Level Adjustment Level 3. Portfolio Construction Score& Report Score& Report Figure 1: O v erview of our multi-agent LLM trading system (see main text for details). (US VIX, Nikkei VI). For all indicators, we utilize the latest available closing values and their month-over-month rates of change. 5 Methodology This section details the ne-grained tasks we provide to agents in prompts and the design of experiments to v erify their eectiveness. The core metho dological contribution of this study lies in the granularity of instructions (prompts) for AI agents. Theoretically , the decomp osition of tasks can be arbitrarily granular . However , to operationalize automated trading, we dene ne-grained tasks as standard analytical tasks that should be performed routinely in practical operations by professional analysts. While these tasks are fundamental to human practitioners, they have received limited attention in existing nancial multi-agent research. 5.1 T asks and Prompt Design Here, we dene the tasks for the seven individual agents. Among these, the T echnical and Quantitative Agents are the targets of our experiments; thus, we describe both ne-grained and coarse- grained tasks for these agents. W e selected these two agents b ecause , among the other agents, only they produce outputs that directly lead to investment execution and their numerical data processing can be clearly dened. W e provide the full prompts in Appendix B. 1. T echnical Agent (T echnical A nalysis). This agent analyzes stock price movement to generate attractiv e scores ranging from 0 to 100 for each stock. For ne-grained tasks , we pass pre-calculated technical indica- tors commonly used in market analysis to the T echnical Agent. T o eliminate the bias of nominal price levels, all indicators are normal- ized or ratio-adjusted. W e refer existing resear ch on the selection of indicators [e.g., 30, 32, 38, 44, 61, 62, 64, 70]. Momentum: Rate of Change (RoC): W e compute the RoC across multiple lookback horizons (5, 10, 20, and 30 days; 1, 3, 6, and 12 months) to capture trend strength and temporal persistence. V olatility: Bollinger Band: Instead of price bands, we identify statistically extr eme lev els using the Z-score formula 𝑍 = ( 𝑃 − 𝜇 20 ) / 𝜎 20 , which normalizes the price deviation from the 20-day moving average by the standard de viation. Oscillator: Moving A verage Convergence Div ergence (MA CD): This metric measures trend momentum as the dier ence between short-term (12-day) and long-term (26-day ) exponential moving averages (EMA) of price, with a 9-day EMA of the MA CD line as the “signal line, ” and their dier ence as the “histogram. ” W e sho w the detailed formulations in Appendix A. Oscillator: Relative Strength Index (RSI): This metric compar es the magnitude of recent gains and losses over a 14-day lookback period to identify potentially overbought or oversold conditions. W e show the detailed formulations in Appendix A. Oscillator: (KDJ): W e calculate the stochastic oscillator % 𝐾 (price position within the 9-day high–low range), % 𝐷 (3-day moving average of % 𝐾 ), and the divergence 𝐽 = 3 𝐷 − 2 𝐾 to captur e potential trend rev ersals. W e show the detailed formulations in Appendix A. For coarse-grained tasks for the T e chnical Agent, instead of adding pre-calculated metrics, we add the raw data directly to the prompts. Specically , we feed the data used to calculate the metrics employed in ne-grained tasks (i.e., daily prices over one year) directly into the agent. 2. antitative Agent ( antitative Fundamentals). This agent quan- titatively evaluates a company’s nancial health and gr owth poten- tial based on the numbers on nancial statements, then generates attractive scores ranging from 0 to 100 for each stock. For all metrics, we provide the agent with the numerical values and the RoC compared to the previous year , regar dless of the granu- larity of tasks. For o w variables ( e.g., ROE and Sales), we calculate valuation metrics using Trailing T welve-Month (T TM) to mitigate seasonality while incorporating the most recent p erformance [ 47 ]. For stock variables (e.g., Equity Ratio, T otal Assets), w e utilize val- ues from the latest quarterly balance sheet to ensure timeliness [ 33 ]. When a metric cannot be computed due to insucient data, we pass NaN values to the LLM and rely on the mo del to handle missing data appropriately . For ne-grained tasks , as in the T echnical Agent, we follow the standard practices in nancial analysis [e.g., 25 , 31 , 48 ] to cal- culate the traditional investment metrics with the ve dimensions: Protability: ROE, ROA, Operating Prot Margin, FCF Margin; Safety: Equity Ratio , Current Ratio, D/E Ratio; V aluation: P/E 4 T oward Expert Investment Teams: A Multi-Agent LLM System with Fine-Grained Trading T asks , , Ratio, EV/EBITDA Multiple, Dividend Yield; Eciency: T otal As- set T urnov er , Inventory Turno ver Period; and Gro wth: Revenue Growth Rate (CA GR), EPS Growth Rate. For coarse-grained tasks for the Quantitative Agent, instead of providing aggregated nancial metrics, we pro vide the agent with raw data points that we can get from nancial statements, such as: Income Statement: Sales, Op erating Pr ot, Net Income, Cost of Sales, Depreciation; Balance She et: T otal Assets, Equity , Cash, Receivables, Financial Assets, Inventory , Current Liabilities, Inter- est Bearing Debt; Cash F low: Operating, Investing; and Market Data: Monthly Close, EPS, Dividends, Issued Shares. Additionally , historical EPS data (1-year and 3-year lookbacks) are included to assess long-term earnings stability . 3. alitative Agent (alitative Fundamentals). This agent ana- lyzes unstructured text data from securities reports to evaluate sustainability and competitive advantages that are not captured by numerical metrics. It extracts information from specic sections and analyzes it based on predetermined evaluation criteria: Business Overview evaluates business model robustness based on “History , ” “Business Description, ” and “ Aliated Companies;” Risk Analysis extracts potential do wnside risks fr om “Business Risks” and “Issues to Address;” Management Policy evaluates strategic intent and execution capability based on “Management’s Discussion and Anal- ysis (MD&A);” Governance assesses management transparency via board composition (proportion of outside directors) and “Cor- porate Governance Status. ” The agent outputs business, risk, and management scores (5-point scale) and reasoning texts as input to the Sector Agent. 4. News Agent (News Sentiment and Ev ents). This agent aggregates recent news headlines and summaries from major e conomic media outlets. It detects material events such as earnings revisions, scan- dals, new product announcements, and M&A activities. For each company , the system inputs news data from the current month; if no news is available, we use NaN as input. The agent sear ches for headlines containing company names (and their abbreviations) and extracts the headline and content when found. The agent outputs risk and return outlook scores (5-point scale) and r easoning texts as input to the Sector Agent. 5. Sector A gent (Sector-Level Adjustment). This agent synthesizes the outputs fr om the four analyst agents and compares the quantitative gures of each stock with the sector averages. The agent provides the re-evaluated attractive score (0-100 scale) and an investment thesis to the PM agent. 6. Macro Agent (Macr o-Environmental Assessment). This agent an- alyzes the e conomic environment with ve dimensions—Market Direction, Risk Sentiment, Economic Growth, Interest Rates, and Ination—based on the absolute levels and month-to-month changes of JP/US economic indicators, then provides the scor es (0-100 scale) for each dimension and reasoning texts to the PM agent. 7. PM Agent (Final Portfolio Construction). This agent integrates the bottom-up view (from the Sector Agent) with the top-down view (from the Macr o Agent), then generates a nal attractive score (0-100 scale) for the long-short portfolio construction. 6 Experimental Results In this section, we present the empirical backtesting results of the proposed multi-agent trading system using the Japanese TOPIX 100 universe from September 2023 to November 2025. 6.1 Fine-Grained vs Coarse-Grained T asks T o evaluate the eectiveness of ne-grained task decomposition, which is our main objective, we compare the performance of the proposed method (agents with ne-grained tasks) against the base- line method (with coarse-grained tasks) across varying portfolio sizes ( 𝑁 ∈ { 10 , 20 , 30 , 40 , 50 } ). Note that 𝑁 = 10 , for instance, indi- cates that w e long v e stocks and short ve stocks. W e conduct the experiments in two settings: using all agents and agents without one agent (leave-one-out). 6.1.1 Comparison using All Agents. Figure 2 shows the comparison of Sharp e ratios between ne-grained (pink) and coarse-graine d (blue) task settings across ve dierent portfolio sizes, with each conguration evaluated over 50 independent trials. Stars (*) indicate Mann- Whitney U test signicance: 𝑝 < 0.0001, 0.001, 0.05 shown as **** , ***, * . ‘ns’ indicates not signicant. Hereafter , we use the same notation thr oughout the paper . As indicate d by the stars, the agents with the ne-grained tasks signicantly outperform their coarse- grained counterparts in 4 out of the 5 tested horizons (20, 30, 40, and 50 stocks). The only exception is the initial case (10 stocks), denoted as "ns" (not signicant), which may be attributed to the relatively small number of stocks that renders the backtesting results noisy and unstable. Overall, despite the noise in the smallest setting, the aggregate trend demonstrates that pr oviding detailed (ne-grained) information contributes to superior risk-adjusted returns. 10 20 30 40 50 P ortfolio size 0.0 0.5 1.0 1.5 2.0 Sharpe ratio *** ns * **** **** F ine-grained Coarse-grained Figure 2: Sharpe ratios for ne-grained (pink) and coarse- grained ( blue) settings across portfolio sizes. Box plot notches represent the 95% condence interval of the me dian. 6.1.2 Comparison with Leave-One-Out Seings. W e further com- pare ne-grained and coarse-grained agent settings under leave- one-out settings. Specically , we systematically remov e one of the bottom-level spe cialist agents—namely , T echnical, Quantitative, Qualitative, News, and Macro—to assess the r obustness of the pro- posed metho d’s superiority . T able 1 reports the dierences in me dian Sharpe ratio between ne-grained and coarse-graine d settings, as Δ 𝑆 𝑅 = Median ( 𝑆 𝑅 ne ) − Median ( 𝑆 𝑅 coarse ) . The top row (" All agents") 5 , , Miyazaki et al. corresponds to the all-agent conguration, consistent with the re- sults shown in Figure 2. Across leave-one-out settings, we nd T able 1: Sharp e Ratio Dierences Between Fine-graine d and Coarse-grained Settings Portfolio size 10 20 30 40 50 All agents -0.12 +0.19**** +0.08* +0.17**** +0.26**** w/o T echnical +0.54*** -0.07 -0.34*** -0.66**** -0.79**** w/o Quant. +0.1 +0.04 +0.16 +0.2* +0.12 w/o Qual. +0.49*** +0.24* +0.41*** +0.55**** +0.33*** w/o News +0.35* +1.0**** +1.04**** +1.04**** +1.08**** w/o Macro +0.11 +0.1 +0.23 +0.31* +0.01 that the dierences are pr edominantly positive in most congura- tions. This indicates that the ne-grained architectur e generally achieves higher Sharpe ratios than the coarse-grained baseline, even when specic analytical perspectives are removed. A notable exception is the “w/o T echnical” setting, where the p erformance reverses for larger portfolio sizes, suggesting that the T echnical Agent plays a central role in driving the performance advantage of ne-grained task decomposition. O verall, the results demon- strate that the ne-grained task design robustly outperforms the equivalent coarse-grained design in backtesting. 6.2 Ablation Studies W e conduct ablation studies to quantify the contribution of each sp e- cialized agent to overall performance. T able 2 presents the changes in the Sharpe ratios compared to the “ All agents” baseline. The values represent the dier ence calculated as SR ablation − SR baseline . Consequently , a positive value indicates that removing the agent im- proved performance (implying the agent was detrimental or noisy), while a negative value indicates that performance degraded (imply- ing the agent was benecial). O v erall, most ablation settings show T able 2: Trading performance under Ablation Settings (a) Fine-grained settings 10 20 30 40 50 All agents (Baseline) 0.54 0.84 0.84 0.79 0.9 w/o T echnical +0.13 -0.42**** -0.4**** -0.56**** -0.66**** w/o Quant. +0.45**** +0.23*** +0.41**** +0.48**** +0.2**** w/o Qual. +0.16 +0.27*** +0.47**** +0.5**** +0.33**** w/o News +0.21 +0.23** +0.29*** +0.12 +0.25**** w/o Macro +0.28* +0.15* +0.27* +0.36**** +0.16*** (b) Coarse-grained settings 10 20 30 40 50 All agents (Baseline) 0.66 0.65 0.76 0.62 0.63 w/o T echnical -0.52**** -0.16* +0.02 +0.28*** +0.4**** w/o Quant. +0.24*** +0.38**** +0.33**** +0.46**** +0.34**** w/o Qual. -0.45**** +0.22*** +0.14 +0.13 +0.26**** w/o News -0.26** -0.59**** -0.68**** -0.75**** -0.57**** w/o Macro +0.05 +0.23**** +0.11 +0.22* +0.41*** positive dierences relative to the full-agent conguration, indicat- ing that most individual agents may introduce noise or redundant signals. This highlights the importance of car efully designing agent roles and interactions, rather than simply increasing the number of specialized comp onents. In the ne-grained setting (T able 2a), howev er , the “w/o T e chni- cal” condition shows predominantly negative dierences, espe cially for larger portfolio sizes. This implies that the T echnical Agent provides particularly strong pr edictive signals. In contrast, remov- ing other agents (Macro, Quantitative, Qualitative) often results in positive dierences, suggesting that while they may appear to contribute useful information, they may also introduce noise or redundant signals when combined under ne-grained coordination. In the coarse-grained setting (Table 2b), a similar but weaker pattern is obser v ed for the T echnical Agent, further supporting the importance of technical signals in the overall system. Notably , the “w/o News” row e xhibits strongly negative dier ences across most portfolio sizes, with relatively large magnitudes. This behav- ior is not clearly obser v ed in the ne-grained setting. One possible interpretation is that, in the absence of ne-grained task decomposi- tion, news information may be relatively better utilized, potentially compensating for weaker propagation of technical signals. Overall, the results indicate that performance depends not only on agent diversity but also on how information is structured and propagated across the system. Fine-grained task de composition ap- pears to facilitate more eective signal transmission—particularly for technical signals—while reducing redundancy and noise intro- duced by loosely co or dinated agents. This highlights the importance of task design and information routing in hierarchical LLM agent architectures. 6.3 T ext Analysis for Interpretability Understanding the rationale behind LLM outputs is critical for prac- tical deployment, especially in nancial trading. Given the signi- cant performance disparities obser ved b etw een dierent prompting strategies in our experiments, we analyze the textual outputs gen- erated during backtesting. First, we compare the textual outputs generated under ne- grained and coarse-grained settings using the log-odds ratio with a Dirichlet prior [ 37 ], a statistical measure to compare how strongly a word is associated with one group versus another . Second, we an- alyze information propagation acr oss agents to quantify how much information from lower-lev el agents is reected in higher-level agents’ outputs. Concretely , inspired by the pre vious research on information propagation [e .g., 5 , 75 ], we rst convert each agent’s output text into v ector representations using an LLM embedding model (text-embedding-3-small [ 41 ]). W e then compute cosine sim- ilarities b etween agent output vectors to measure the degree of semantic alignment, which ser v es as a proxy for information adop- tion across the agent hierarchy . 6.3.1 Representative wor ds of Fine-grained vs Coarse-grained Set- tings. W e obtained the highest log-odds ratios for ne-grained and coarse-grained settings across four agent types: T echnical, Quan- titative, Sector , and PM Agents. W e present the complete list of words ( shown in T able 5), as well as the preprocessing of texts, in Appendix D for brevity . First, we observe that both the ne-grained and coarse-grained conguration emphasizes vocabulary that is closely aligned with 6 T oward Expert Investment Teams: A Multi-Agent LLM System with Fine-Grained Trading T asks , , their respective prompt instruction, which is consistent with our expectations. The ne-grained setting tends to produce mor e nu- anced analytical terms such as “momentum, ” “volatility , ” and “con- dition” for T echnical, and “margins, ” “growth-rate, ” and “protabil- ity” for Quant. In contrast, the coarse-grained setting favors more surface-level market descriptors, such as “price, ” “trend, ” “rise, ” and “increase ” for T echnical, and “EPS, ” “ earnings, ” and “net in- come”–r elated expressions for Quant. This conrms that prompt granularity directly inuences the level of abstraction in generate d reasoning: without explicit procedural guidance, the LLM re verts to broad, supercial descriptions of market movements and nancial statements. Second, observing the hierarchical relationships, we nd evi- dence of vocabulary propagation from lower-level specialists to higher-level decision makers. Higher-level agents, namely the Sec- tor and PM Agents, tend to reuse or inherit vocabulary originating from low er-level agents. For instance, in the ne-grained setting, the PM and Sector Agents’ distinctive words include “Momentum” (characteristic of the T echnical Agent) and “Soundness” (character- istic of the Quant A gent). Similarly , in the coarse-grained setting, the PM and Sector Agents adopt “Trend” and “EPS, ” mirr oring the vocabulary of their respective subordinates. This indicates that the hierarchical architecture enables upwar d propagation of semantic signals, suggesting that higher-level decision-making is at least partially grounded in lower-lev el analytical outputs. 6.3.2 Information Propagation A nalysis. T able 3 shows the cosine similarity b etw een the Sector Agent outputs and those of lower- level agents, which pr esents the median values of the aggr egated results over 50 independent backtesting trials. The table reports similarities under both ne-grained and coarse-grained settings, along with Di. = Similarity Fine-grained − Similarity Coarse-grained . Re- garding the absolute magnitude of similarity , the Quantitative and Qualitative Agents exhibit relatively high scores ( ≈ 0 . 48 − 0 . 52 ) compared to the T echnical Agent ( ≈ 0 . 40 − 0 . 42 ). This suggests that, by default, the Sector Agents’ decision-making logic aligns more closely with fundamental analysis (nancials and business models) rather than technical price analysis. One might think that the length of the output of each agent ae cts the similarity , but we set the output length within 100 Japanese characters for each agent, and we observed no signicant dierence in the output lengths across agents. Howev er , most importantly , regarding the comparison be- T able 3: Semantic Similarity with Se ctor Agent Agents Fine-grained Coarse-graine d Di. T echnical 0.419 0.397 0.022 Quantitative 0.476 0.477 -0.001 Qualitative 0.514 0.514 -0.001 News 0.378 0.372 0.006 tween the ne-grained and coarse-grained settings, we nd that only the T echnical Agent demonstrates a signicant improvement in the ne-grained setting (0.022 in Di.). Specically , in the ne- grained setting, the higher similarity score suggests that technical insights are eectively transmitted and integrated into the Sector Agent’s reasoning process. This aligns with the backtesting results; the T echnical Agents perform well, and their impact is critically high, especially in a ne-grained setting. Note that, across trials, the similarity values exhibit v ery small variance, with below 0.002 standard de viation for all cases. Because of this small deviation, the dierence between the two settings (Di.) is statistically signicant in all cases. T aken together , while the system naturally leans towards fun- damental data, the proposed ne-grained architecture eectively amplies the signal transmission of technical analysis, indicating that technical factors are explicitly integrated into the higher-level decision-making process in the ne-grained setting. 6.4 Portfolio Optimization In regulated nancial environments, deploying a fully autonomous trading system directly to live capital is typically infeasible with- out extensive staged validation. Consequently , to demonstrate the real-world applicability of our system under these constraints, we perform standard portfolio optimization against a market index as a realistic pre-deployment validation setting. W e conduct a sys- tematic backtest to evaluate the allocation b etw een the TOPIX 100 equity index and a composite portfolio of six LLM-based agent strategies. Six LLM-based agent strategies include the strategies using all agents and ve leave-one-out strategies, constructed using an equal risk contribution weighting scheme. Here, we exploit the heterogeneity in outputs across the six strategies—instructed with dierent combinations of information sources. The covariance structure among the six agent strategies is de- rived from the sto ck-le vel covariance matrix of TOPIX 100 con- stituents. Letting 𝑉 ∈ R 𝑛 × 𝑛 denote the stock covariance matrix and 𝑃 ∈ R 𝑀 × 𝑛 the portfolio weight matrix whose rows correspond to each agent’s stock-level holdings, the agent-le vel covariance is computed as Σ = 𝑃 𝑉 𝑃 ⊤ . T o combine the six strategies into a single composite, we solve for the weight vector 𝑤 that equalizes each agent’s risk contribution to total portfolio variance: each asset’s con- tribution 𝑤 𝑖 ( Σ 𝑤 ) 𝑖 / √ 𝑤 ⊤ Σ 𝑤 is driven towar d 1 / 𝑁 via constrained optimization, subject to Í 𝑖 𝑤 𝑖 = 1 . W e then vary the allocation ratio between TOPIX 100 and the agent composite from 0% to 100% in 10% increments, evaluating out- of-sample performance including annualize d return, v olatility , and Sharpe ratio, net of realistic transaction costs (10bps one-way). A key empirical nding is that the correlation b etw een the TOPIX 100 index returns and the agent composite returns is low ( ≈ 0 . 4 ), creat- ing substantial diversication benets. As Figure 3 shows, blended portfolios consistently achieve higher Sharpe ratios than either the TOPIX 100 index or the agent composite alone (The return and volatility are shown in T able 4 in Appendix C). While the ex-ante op- timal allocation ratio is unknown in practice , e ven a naïve 50% / 50% split between the index and the agent composite yields a Sharpe ratio superior to b oth standalone components—demonstrating that practitioners can capture meaningful risk-adjusted performance improvements without r equiring precise allocation optimization. 7 Discussion and Conclusion In this study , we constructed a hierarchical multi-agent trading framework and investigated how task granularity aects system 7 , , Miyazaki et al. 0% 20% 40% 60% 80% 100% Agent strategy allocation (%) 1.00 1.25 1.50 1.75 2.00 Sharpe ratio Gr oss Net (10bps) Figure 3: Sharpe ratio as a function of allocation between TOPIX 100 and the aggregated agent strategy in the test pe- riod. Gross performance (orange) and net performance after 10 bps one-way transaction cost (green) are shown. behavior by comparing ne-grained and coarse-graine d task set- tings. Our experimental results demonstrate that the ne-grained setting yields statistically superior overall performance in terms of risk-adjusted returns. Furthermore, the ablation study r evealed that the T echnical agent is a primar y performance driver . Crucially , text-based analyses consistently conrme d that the ne-grained instructions enabled the eective propagation of technical insights to higher-le vel decision-makers. These results provide evidence from performance, ablation, and textual b ehavior analyses that ne- grained task structuring improves both the eectiveness and the information ow within hierarchical LLM agent systems. Finally , we evaluated real-w orld performance through portfolio optimiza- tion using market indices as benchmarks. Our ndings suggest that the performance of LLM-base d trading agents is driven not merely by the model’s r easoning capability , but signicantly by the quality of feature engineering embedded within the prompt design. 7.1 Implications From an agent design perspective, our ndings suggest a shift in how to construct multi-agent systems for nancial analysis. Prior work has often implicitly assumed a one-to-one mapping between data modality and agent specialization, with the role-based ambigu- ous instructions. However , our results indicate that agents may be more eectively designed around task decomposition rather than data source boundaries. In practical settings, this opens the pos- sibility that users can embed their own domain-specic expertise directly into task-specialized agents, enabling customizable and organization-specic agent frameworks. Another important implication concerns interpretability . Our study demonstrates that meaningful insights can be extracted from analyzing agent text outputs, providing a practical pathway for understanding LLM-driven decision processes. Interpr etability is especially critical in enterprise settings, particularly for large-scale asset management. Prior work has suggeste d that the adoption of LLMs introduces new operational workows centered around validating generated outputs [ 19 ]. In this context, building trading agents with strong interpretability characteristics is not merely desirable but may become operationally ne cessary . Simultaneously , there is an ongoing debate ov er whether natural language should be adopted as the primary communication inter- face in multi-agent LLM systems. Many existing frameworks [ 27 , 45 , 69 , 76 ] rely on natural language communication, while alternative approaches propose machine-oriented languages that are mutually intelligible among AI agents to improve eciency and accuracy [ 63 , 73 ]. Nev ertheless, from a practical perspective [ 18 ], natural lan- guage interfaces appear advantageous, as they enable interpretabil- ity and downstream analyses such as those conducted in our study . 7.2 Limitations and Future W ork Despite promising r esults, sev eral limitations remain. First, it is not yet fully clear whether the performance gains are fundamentally at- tributable to ne-grained task decomposition itself. One alternative explanation is that certain vocabulary patterns may be more easily adopted by the prefer ence of LLMs to inuence do wnstream agents. Investigating linguistic bias in LLM-based multi-agent systems is, therefore, an important direction for futur e research [ c.f., 17, 26]. Second, due to the knowledge cuto of the LLM model, back- testing was limited to approximately two years of historical data. Financial markets exhibit strong regime shifts over longer horizons, and therefore, longer-term validation is necessar y to conrm ro- bustness. One possible future direction is the use of time-aware or temporally constrained LLM variants, such as approaches similar to Time Machine GPT [ 10 ], which could enable historically consistent simulations across longer market periods. Third, while we established rigorous experimental settings, we acknowledge that there remains room for exploration under dier- ent conditions, such as employing other LLM models or targeting dierent markets ( e.g., the US market). However , we believe the scope of this analysis is sucient for the following reasons. Pri- marily , from an industrial perspe ctiv e, our primary focus is on the Japanese market due to specic deployment requirements. Also, current LLMs have demonstrated sucient pre-trained knowledge regarding the Japanese market [ 40 ]. Furthermore, given the recent competitive progress acr oss providers [ 54 ], we infer that the funda- mental validity of our proposed method remains consistent across high-performing models. References [1] Saaket Agashe, Jiuzhou Han, Shuyu Gan, Jiachen Y ang, Ang Li, and Xin Eric W ang. 2024. Agent s: An open agentic framework that uses computers like a human. arXiv preprint arXiv:2410.08164 (2024). [2] Ran Aroussi. [n. d.]. ranaroussi/ynance: Download market data from Y ahoo! Finance’s API. https://github.com/ranar oussi/ynance?tab=readme- ov- le [On- line; accessed 2026-02-05]. [3] Berk Atil, Sarp A ykent, Alexa Chittams, Lisheng Fu, Rebecca J Passonneau, Evan Radclie, Guru Rajan Rajagopal, Adam Sloan, T omasz Tudr ej, Ferhan T ure, et al . 2024. Non-determinism of “deterministic" LLM settings. arXiv preprint arXiv:2408.04667 (2024). [4] Erik Br ynjolfsson, Danielle Li, and Lindsey Raymond. 2025. Generative AI at work. The Quarterly Journal of Economics 140, 2 (2025), 889–942. [5] Tristan JB Cann, Ben Dennes, T ravis Coan, Saron O’Neill, and Hywel TP Williams. 2025. Using semantic similarity to measure the echo of strategic communications. EPJ Data Science 14, 1 (2025), 20. [6] Ceek.jp. [n. d.]. Ceek.jp News. https://news.ceek.jp/ [Online; accessed 2026-02- 05]. [7] Jiaxiang Chen, Mingxi Zou, Zhuo Wang, Qifan W ang, Dongning Sun, Chi Zhang, and Zenglin Xu. 2025. FinHEAR: Human Expertise and Adaptive Risk- A ware T em- poral Reasoning for Financial Decision-Making. arXiv preprint (2025). [8] Mark Chen. 2021. Evaluating large language models trained on code. arXiv preprint arXiv:2107.03374 (2021). [9] Yifei Dong, Fengyi Wu, Kunlin Zhang, Yilong Dai, Sanjian Zhang, W anghao Y e, Sihan Chen, and Zhi-Qi Cheng. 2025. Large Language Model Agents in Finance: A Survey Bridging Research, Practice, and Real- W orld Deployment. In Findings of the Association for Computational Linguistics: EMNLP 2025 . 17889–17907. 8 T oward Expert Investment Teams: A Multi-Agent LLM System with Fine-Grained Trading T asks , , [10] Felix Drinkall, Eghbal Rahimikia, Janet Pierrehumbert, and Stefan Zohren. 2024. Time machine GPT. In Findings of the Association for Computational Linguistics: NAACL 2024 . 3281–3292. [11] EDINET . [n. d.]. EDINET . https://disclosure2dl.edinet- fsa.go.jp/guide/static/ disclosure/WEEK0060.html [Online; accessed 2026-02-05]. [12] FRED. [n. d.]. St. Louis Fed W eb Ser vices: FRED ® API. https://fred.stlouisfed. org/docs/api/fred/ [Online; accessed 2026-02-05]. [13] Zhixuan He and Y ue Feng. 2025. Unleashing Diverse Thinking Modes in LLMs through Multi- Agent Collaboration. arXiv preprint arXiv:2510.16645 (2025). [14] Sirui Hong, Mingchen Zhuge, Jonathan Chen, Xiawu Zheng, Yuheng Cheng, Jinlin Wang, Ceyao Zhang, Zili W ang, Steven Ka Shing Y au, Zijuan Lin, et al . 2023. MetaGPT: Meta programming for a multi-agent collaborative framework. In The Twelfth International Conference on Learning Representations . [15] Aaron Hurst, Adam Lerer , Adam P Goucher , Adam Perelman, Aditya Ramesh, Aidan Clark, AJ Ostrow , Akila W elihinda, Alan Hayes, Alec Radford, et al . 2024. GPT-4o system card. arXiv preprint arXiv:2410.21276 (2024). [16] Y oontae Hwang, Yaxuan K ong, Stefan Zohren, and Y ongjae Lee. 2025. Decision- informed neural networks with large language model integration for portfolio optimization. arXiv preprint arXiv:2502.00828 (2025). [17] Y erin Hwang, Dongr y eol Lee, T aegwan Kang, Minwoo Lee, and K yomin Jung. 2026. When W ording Steers the Evaluation: Framing Bias in LLM judges. arXiv preprint arXiv:2601.13537 (2026). [18] Aakanksha Jadhav and Vishal Mirza. 2025. Large Language Models in Equity Markets: Applications, T echniques, and Insights. Frontiers in Articial Intelligence V olume 8 - 2025 (2025). [19] Ranim Khojah, Mazen Mohamad, Linda Erlenhov , Francisco Gomes de Oliveira Neto, and P hilipp Leitner . 2025. LLM Company Policies and Policy Implications in Software Organizations. IEEE Software (2025). [20] Alex Kim, Maximilian Muhn, and Valeri Nikolaev . 2024. Financial statement analysis with large language models. arXiv preprint arXiv:2407.17866 (2024). [21] Hyuhng Joon Kim, Y ouna Kim, Cheonb ok Park, Junyeob Kim, Choonghyun Park, Kang Min Y oo, Sang-goo Lee, and T aeuk Kim. 2024. Aligning language models to explicitly handle ambiguity . arXiv preprint arXiv:2404.11972 (2024). [22] Harvey Bonmu Ku, Jeongyeol Shin, Hyoun Jun Lee, Seonok Na, and Insu Jeon. 2025. Multi-agent LLM debate unveils the premise left unsaid. In Proceedings of the 12th A rgument mining W orkshop . 58–73. [23] T aku Kudo . 2005. Mecab: Y et another part-of-speech and morphological analyzer. http://mecab. sourceforge. net/ (2005). [24] Sayani Kundu, Dushyant Sahoo, Victor Li, Jennifer Rabowsky , and Amit V arsh- ney . 2025. A Multi-Agent Framew ork for Quantitative Finance: An Application to Portfolio Management Analytics. In Proceedings of the 2025 Conference on Empirical Methods in Natural Language Processing: Industry Track . 812–824. [25] Charles MC Lee. 2025. V alue investing: integrating theory and practice. In Handbook on the Financial Reporting Environment . Edward Elgar Publishing, 347–374. [26] Hoyoung Lee, Junhyuk Seo, Suhwan Park, Junhyeong Lee, W onbin Ahn, Chanyeol Choi, Alejandro Lopez-Lira, and Yongjae Le e . 2025. Y our AI, not your view: The bias of llms in investment analysis. In Proceedings of the 6th A CM International Conference on AI in Finance . 150–158. [27] Guohao Li, Hasan Hammoud, Hani Itani, Dmitrii Khizbullin, and Bernard Ghanem. 2023. Camel: Communicative agents for “mind" exploration of large language model society . Advances in Neural Information Processing Systems 36 (2023), 51991–52008. [28] Miao Li, Jey Han Lau, Eduard Hovy , and Mirella Lapata. 2025. Decomposed Opinion Summarization with V eried Aspect-A ware Mo dules. arXiv preprint arXiv:2501.17191 (2025). [29] Xiangyu Li, Yawen Zeng, Xiaofen Xing, Jin Xu, and Xiangmin Xu. 2025. Hedgeagents: A balanced-aware multi-agent nancial trading system. In Com- panion Procee dings of the ACM on W eb Conference 2025 . 296–305. [30] Y awei Li, Peipei Liu, and Ze W ang. 2022. Stock trading strategies based on deep reinforcement learning. Scientic Programming 2022, 1 (2022), 4698656. [31] Michael Lin. 2019. Quantitative vs. fundamental equity investing. Active Quanti- tative Equity (A QE). [32] Xiangdong Liu and Jiahao Chen. 2025. QTMRL: An Agent for Quantitative Trad- ing Decision-Making Based on Multi-Indicator Guided Reinforcement Learning. arXiv preprint arXiv:2508.20467 (2025). [33] Joshua Livnat and Richard R Mendenhall. 2006. Comparing the post–earnings announcement drift for surprises calculated from analyst and time series forecasts. Journal of accounting research 44, 1 (2006), 177–205. [34] Alejandro Lopez-Lira. 2025. Can Large Language Models T rade? T esting Financial Theories with LLM Agents in Market Simulations. arXiv preprint (2025). [35] Alejandro Lopez-Lira, Y uehua T ang, and Mingyin Zhu. 2025. The Memo- rization Problem: Can W e Trust LLMs’ Economic Forecasts? arXiv preprint arXiv:2504.14765 (2025). [36] Aaron Mok. 2023. Wharton Pr ofessor Says AI Is Like an ’Intern’ Who ’Lies a Little Bit’ - Business Insider . https://w ww .businessinsider .com/wharton- professor- ai- is- intern- who- lies- a- little- bit- 2023- 5 [Online; accessed 2025-11-28]. [37] Burt L Monroe, Michael P Colaresi, and Kevin M Quinn. 2008. Fightin’words: Lexical feature selection and evaluation for identifying the content of political conict. Political Analysis 16, 4 (2008), 372–403. [38] Sina Montazeri, Hase ebullah Jumakhan, and Amir Mirzaeinia. 2025. Finding Optimal Trading History in Reinforcement Learning for Stock Market Trading. arXiv preprint arXiv:2502.12537 (2025). [39] Y uqi Nie, Y axuan Kong, Xiaowen Dong, John M Mulvey , H Vincent Poor , Qing- song W en, and Stefan Zohren. 2024. A survey of large language models for nancial applications: Progress, prospects and challenges. arXiv preprint arXiv:2406.11903 (2024). [40] Katsuhiko Okada, Moe Nakasuji, Y asutomo T sukioka, and T akahiro Y amasaki. 2025. From words to returns: sentiment analysis of Japanese 10-K reports using advanced large language models. PeerJ Computer Science 11 (2025), e3349. [41] OpenAI. [n. d.]. text-embe dding-3-small Model | OpenAI API. https://platform. openai.com/docs/models/text- embedding- 3- small [Online; accessed 2026-02-08]. [42] Shuyin Ouyang, Jie M Zhang, Mark Harman, and Meng W ang. 2025. An empirical study of the non-determinism of chatgpt in code generation. ACM Transactions on Software Engineering and Methodology 34, 2 (2025), 1–28. [43] A vash Palikhe, Zhenyu Yu, Zichong W ang, and W enbin Zhang. 2025. T owards Transparent AI: A Survey on Explainable Large Language Models. arXiv preprint arXiv:2506.21812 (2025). [44] George Papageorgiou, Dimitrios Gkaimanis, and Christos Tjortjis. 2024. Enhanc- ing stock market forecasts with double deep q-network in volatile stock market environments. Ele ctr onics 13, 9 (2024), 1629. [45] Joon Sung Park, Joseph O’Brien, Carrie Jun Cai, Meredith Ringel Morris, Percy Liang, and Michael S Bernstein. 2023. Generative agents: Interactive simulacra of human behavior . In Proce edings of the 36th annual acm symposium on user interface software and technology . 1–22. [46] Sida Peng, Eirini K alliamvakou, Peter Cihon, and Mert Demirer . 2023. The impact of AI on developer productivity: Evidence from github copilot. arXiv preprint arXiv:2302.06590 (2023). [47] Stephen H Penman. 2010. Financial statement analysis and security valuation . McGraw-Hill/Irwin New Y ork. [48] Joseph D Piotroski. 2000. V alue investing: The use of historical nancial statement information to separate winners from losers. Journal of accounting research (2000), 1–41. [49] Libin Qiu, Y uhang Y e, Zhirong Gao, Xide Zou, Junfu Chen, Ziming Gui, W eizhi Huang, Xiaobo Xue, W enkai Qiu, and Kun Zhao. 2025. Blueprint First, Model Second: A Framework for Deterministic LLM W orkow . arXiv preprint arXiv:2508.02721 (2025). [50] Evan Ratli. 2025. All of My Employees Are AI Agents, and So Are My Executives | WIRED. https://www .wired.com/story/all- my- employees- are- ai- agents- so- are- my- executives/ [Online; accessed 2025-11-28]. [51] Preetha Saha, Jingrao Lyu, Arnav Saxena, Tianjiao Zhao, and Dhagash Mehta. 2025. Large Language Model Agents for Investment Management: Foundations, Benchmarks, and Research Frontiers. In Proceedings of the 6th ACM International Conference on AI in Finance . 736–744. [52] Parshin Shojaee, Iman Mirzadeh, Keivan Alizadeh, Maxwell Horton, Samy Bengio, and Mehrdad Farajtabar . 2025. The illusion of thinking: Understanding the strengths and limitations of reasoning models via the lens of problem complexity . arXiv preprint arXiv:2506.06941 (2025). [53] Alex Singla, Alexander Sukharevsky , Lareina A. Y ee, and Michael Chui. 2025. The State of AI: Global Survey 2025 | McKinsey . https://www.mckinse y .com/ capabilities/quantumblack/our- insights/the- state- of- ai [Online; accessed 2025- 11-28]. [54] AI Wiki Editorial Team. 2025. LLM Benchmark Rankings 2025 | AI Model Compari- son Guide. https://articial- intelligence- wiki.com/generative- ai/large- language- models/llm- benchmark- rankings- 2025 [Online; accessed 2026-02-07]. [55] Feng Tian, F lora D Salim, and Hao Xue. 2025. TradingGroup: A Multi- Agent Trading System with Self-Reection and Data-Synthesis. arXiv preprint arXiv:2508.17565 (2025). [56] T aiichi Hashimoto T oshinori Sato and Manabu Okumura. 2017. Implementation of a word segmentation dictionary called me cab-ipadic-NEologd and study on how to use it eectively for information retrieval (in Japanese). In Proceedings of the T wenty-three A nnual Meeting of the Association for Natural Language Processing . The Association for Natural Language Processing, NLP2017–B6–1. [57] Lei W ang, W anyu Xu, Yihuai Lan, Zhiqiang Hu, Yunshi Lan, Roy Ka- W ei Lee, and Ee-Peng Lim. 2023. P lan-and-solv e prompting: Improving zer o-shot chain- of-thought reasoning by large language models. arXiv preprint (2023). [58] Saizhuo W ang, Hang Y uan, Leon Zhou, Lionel Ni, Heung Y eung Shum, and Jian Guo. 2025. Alpha-gpt: Human-ai interactive alpha mining for quantitative investment. In Proceedings of the 2025 Conference on Empirical Methods in Natural Language Processing: System Demonstrations . 196–206. [59] Xuezhi W ang, Jason W ei, Dale Schuurmans, Quoc Le, Ed Chi, Sharan Narang, Aakanksha Chowdhery , and Denny Zhou. 2022. Self-consistency improves chain of thought r easoning in language models. arXiv preprint arXiv:2203.11171 (2022). 9 , , Miyazaki et al. [60] Jiaxin W en, Ruiqi Zhong, Akbir Khan, Ethan Perez, Jacob Steinhardt, Minlie Huang, Samuel R Bowman, He He, and Shi Feng. 2024. Language models learn to mislead humans via RLHF. arXiv preprint arXiv:2409.12822 (2024). [61] Zeyu Xia, Mingde Shi, and Changle Lin. 2023. Stock trading strategy developing based on reinforcement learning. In Proceedings of the 2nd International Academic Conference on Blockchain, Information T echnology and Smart Finance (ICBIS 2023) . Atlantis Press, 156–164. [62] Yijia Xiao, Edward Sun, Di Luo, and W ei W ang. 2024. TradingAgents: Multi- agents LLM nancial trading framework. arXiv preprint arXiv:2412.20138 (2024). [63] Zhuoran Xiao, Chenhui Y e, Yijia Feng, Yunbo Hu, Tianyu Jiao, Liyu Cai, and Guangyi Liu. 2025. Transmission With Machine Language T okens: A Paradigm for Task-Oriented Agent Communication. arXiv preprint arXiv:2507.21454 (2025). [64] Fei Xiong, Xiang Zhang, Aosong Feng, Siqi Sun, and Chenyu Y ou. 2025. Quanta- gent: Price-driven multi-agent llms for high-fr equency trading. arXiv preprint arXiv:2509.09995 (2025). [65] Hongyang Y ang, Boyu Zhang, Neng W ang, Cheng Guo, Xiaoli Zhang, Likun Lin, Junlin W ang, Tianyu Zhou, Mao Guan, Runjia Zhang, et al . 2024. FinRobot: An open-source ai agent platform for nancial applications using large language models. arXiv preprint arXiv:2405.14767 (2024). [66] Shunyu Y ao, Jerey Zhao , Dian Yu, Nan Du, Izhak Shafran, Karthik R Narasimhan, and Y uan Cao. 2022. React: Synergizing reasoning and acting in language models. In The eleventh international conference on learning representations . [67] Y angyang Yu, Haohang Li, Zhi Chen, Yuechen Jiang, Y ang Li, Jordan W Suchow, Denghui Zhang, and Khaldoun Khashanah. 2025. Finmem: A performance- enhanced LLM trading agent with layered memory and character design. IEEE Transactions on Big Data (2025). [68] Y angyang Yu, Zhiyuan Y ao, Haohang Li, Zhiyang Deng, Yuechen Jiang, Y upeng Cao, Zhi Chen, Jordan Suchow , Zhenyu Cui, Rong Liu, et al . 2024. Fincon: A synthesized llm multi-agent system with conceptual verbal reinforcement for enhanced nancial decision making. Advances in Neural Information Processing Systems 37 (2024), 137010–137045. [69] Ceyao Zhang, K aijie Y ang, Siyi Hu, Zihao W ang, Guanghe Li, Yihang Sun, Cheng Zhang, Zhaowei Zhang, Anji Liu, Song-Chun Zhu, et al . 2024. Proagent: building proactive cooperative agents with large language models. In Proceedings of the AAAI Conference on A rticial Intelligence , V ol. 38. 17591–17599. [70] W entao Zhang, Lingxuan Zhao, Haochong Xia, Shuo Sun, Jiaze Sun, Molei Qin, Xinyi Li, Y uqing Zhao, Yilei Zhao, Xinyu Cai, et al . 2024. A multimodal founda- tion agent for nancial trading: T ool-augmente d, div ersied, and generalist. In Proceedings of the 30th acm sigkdd conference on knowledge discovery and data mining . 4314–4325. [71] Haiyan Zhao, Hanjie Chen, Fan Yang, Ninghao Liu, Huiqi Deng, Hengyi Cai, Shuaiqiang W ang, Dawei Yin, and Mengnan Du. 2024. Explainability for large lan- guage models: A survey . ACM Transactions on Intelligent Systems and Technology 15, 2 (2024), 1–38. [72] Tianjiao Zhao, Jingrao Lyu, Stokes Jones, Harrison Garber, Stefano Pasquali, and Dhagash Mehta. 2025. AlphaAgents: Large Language Model based Multi-Agents for Equity Portfolio Constructions. arXiv preprint arXiv:2508.11152 (2025). [73] Y ujia Zheng, Zhuokai Zhao, Zijian Li, Y aqi Xie, Mingze Gao, Lizhu Zhang, and Kun Zhang. 2025. Thought communication in multiagent collaboration. arXiv preprint arXiv:2510.20733 (2025). [74] Denny Zhou, Nathanael Schärli, Le Hou, Jason W ei, Nathan Scales, Xuezhi W ang, Dale Schuurmans, Claire Cui, Olivier Bousquet, Quoc Le, et al . 2022. Least-to- most prompting enables complex reasoning in large language models. arXiv preprint arXiv:2205.10625 (2022). [75] Jialong Zhou, Lichao W ang, and Xiao Y ang. 2025. GU ARDIAN: Safeguarding LLM Multi-A gent Collaborations with T emporal Graph Modeling. arXiv preprint arXiv:2505.19234 (2025). [76] Mingchen Zhuge, Haozhe Liu, Francesco Faccio, Dylan R A shley , Róbert Csordás, Anand Gopalakrishnan, Abdullah Hamdi, Hasan Ab ed Al Kader Hammoud, Vincent Herrmann, Kazuki Irie, et al . 2023. Mindstorms in natural language- based societies of mind. arXiv preprint arXiv:2305.17066 (2023). A Formulas for T echnical Indicators A.1 MA CD W e calculate the MACD line ( 𝑀 𝑡 = EMA 12 − EMA 26 ), the signal line ( 𝑆 𝑡 = EMA 9 ( 𝑀 𝑡 ) ), and the histogram ( 𝐻 𝑡 = 𝑀 𝑡 − 𝑆 𝑡 ), where EMA indicates the e xponential mo ving average with the smoothing factor 𝛼 = 2 𝑡 + 1 . These values are normalized by the closing price 𝑃 𝑡 (i.e., 𝑀 𝑡 / 𝑃 𝑡 ) to enable cross-sectional comparison. A.2 RSI The RSI is dened as 𝑅𝑆 𝐼 𝑡 = 100 − 100 1 + 𝑅𝑆 𝑡 , where 𝑅𝑆 𝑡 = A vgGain 𝑡 A vgLoss 𝑡 . The average gain and loss are compute d using exponentially smo othed moving averages ov er a 14-day lookback period. A.3 Stochastic Oscillator Formulation Let 𝑃 𝑡 denote the closing price at time 𝑡 . W e dene the highest and lowest prices ov er the past 𝑛 days as 𝐻 ( 𝑛 ) 𝑡 = max 𝑖 = 0 ,. ..,𝑛 − 1 𝑃 𝑡 − 𝑖 , (1) 𝐿 ( 𝑛 ) 𝑡 = min 𝑖 = 0 ,. ..,𝑛 − 1 𝑃 𝑡 − 𝑖 . (2) The stochastic oscillator % 𝐾 is dened as % 𝐾 𝑡 = 100 × 𝑃 𝑡 − 𝐿 ( 9 ) 𝑡 𝐻 ( 9 ) 𝑡 − 𝐿 ( 9 ) 𝑡 . (3) The signal line % 𝐷 is computed as the 3-day simple moving average (SMA) of % 𝐾 : % 𝐷 𝑡 = 1 3 2 𝑖 = 0 % 𝐾 𝑡 − 𝑖 . (4) Finally , the divergence term 𝐽 is dened as 𝐽 𝑡 = 3% 𝐷 𝑡 − 2% 𝐾 𝑡 . (5) B Prompts B.1 T echnical Agent B.1.1 System Prompt. System Prompt (Role Definition): Role: You are a technical analyst on the trading team. Your task is to forecast stock prices one month ahead based strictly on technical indicators to assist portfolio managers. Policy & Constraints: - Input scope: Use only the provided technical indicators; disregard news or fundamentals. - Scoring: Provide a score between 0 and 100 based on a balanced assessment of momentum, oscillators, and volatility. - Scale interpretation: · 100 : Strong long recommendation · 50 : Neutral (no clear advantage) · 0 : Strong short recommendation - Output requirements: strictly JSON format, including a brief one-sentence comment. B.1.2 User Prompt (Fine-Grained). Instruction: The following are technical indicators for a particular stock at the end of a given month. Based on these, please rate the attractiveness of long or short positions in this stock on a scale of 0 to 100 points. Technical indicators used (summary of definitions/reference): - Momentum: RoC (Rate of Change) · Percentage change in price over the past 𝑛 days ( 𝑛 = 5 , 10 , 20 , compared to previous month) and 𝑚 months ( 𝑛 = 1 , 3 , 6 , 12 ). - Volatility: Bollinger Band Deviation · Actual value used: (Close - 20-day MA) / 20-day Close standard deviation - Oscillators: 10 T oward Expert Investment Teams: A Multi-Agent LLM System with Fine-Grained Trading T asks , , · MACD: (12-day EMA - 26-day EMA) / Close price. Normalized by dividing by Close. · RSI: Ranges from 0 to 100. (100 × Upward Avg) / (Upward Avg + Downward Avg). · Stochastic Oscillator: Uses K, D, J indicators. Evaluation Rules: - Comprehensively assess the risk-reward ratio for the next month based on the combination of indicators. - Check consistency among momentum, oscillators, and volatility. - 100 : Strong Long, 0 : Strong Short, 50 : Neutral. - State the reason in Japanese in one sentence ( ≈ 50 chars). Output Format (JSON only): { "score": , "reason": "" } This Month’s Technical Indicators: RoC 5day: % RoC 10day: % RoC 20day: % RoC 1Month: % RoC 3Month: % RoC 6Month: % RoC 12Month: % RSI: MACD: Signal: Hist: Stochastic %K: %D: %J: B.1.3 User Prompt (Coarse-Grained). Instruction: The following list contains raw daily closing prices for a particular stock over the past 252 business days. The values on the left are the most recent. Based on these, rate the attractiveness of long or short positions on a scale of 0 to 100. Evaluation Rules: - Analyze the price trend to assess the risk-reward ratio for the next month. - 100 : Strong Long, 50 : Neutral, 0 : Strong Short. - State the reason in Japanese ( ≈ 50 chars). Output Format (JSON only): { "score": , "reason": "" } This Month’s Stock Prices (List of 252 days): [, , ..., ] (e.g., [1500.5, 1498.2, ..., 1200.0]) B.2 Quant. Agent B.2.1 System Prompt. System Prompt (Role Definition): Role: You are a Quantitative Fundamental Analyst. Your task is to evaluate the medium-to-long-term investment attractiveness of a stock based strictly on quantitative financial metrics to assist the Portfolio Manager. Guidelines & Constraints: - Input scope: Use only the provided financial metrics; exclude news, sentiment, or technical patterns. - Evaluation Balance: Assess Profitability (Margins, ROE), Value (PER), Financial Health (Quick Ratio, D/E), Growth, and Cash Flow quality. - Scoring Scale: · 100 : Strong Long (extremely attractive) · 50 : Neutral (fairly valued) · 0 : Strong Short (extremely unattractive) - Missing Data: Ignore items marked "NaN" or blank; analyze based on remaining data. - Output requirements: Strictly JSON format; "reason" must be a single short sentence in Japanese. B.2.2 User Prompt (Fine-Grained). Instruction: The following are fundamental metrics and their changes from a month ago. Evaluate the attractiveness for a Long/Short position on a scale of 0 to 100 based on these. Rules & Definitions: - Metrics: Profitability, Value (PER), Cash Flow, Financial Health, Growth (Sales/EPS). - Trend Analysis: Consider both "Absolute Value" and "Diff" (change from prev. month). - Freshness: If "Information Update Month" is "Yes", latest results are reflected. - Output: Score (0-100) and reason (in Japanese, ≈ 50 chars). Output Format (JSON only): { "score": , "reason": "" } Stock Data (TTM) [Format: Value (diff: Value)]: Info Update Month: [Profitability] Net Margin: (diff: ) ROA: (diff: ) ROE: (diff: ) Asset Turn: (diff: ) Inv. Turn Days: (diff: ) [Value] PER: (diff: ) [Cash Flow] FCF: (diff: ) Margin: (diff: ) EBITDA: (diff: ) [Health] Equity Ratio: (diff: ) Quick Ratio: (diff: ) D/E Ratio: (diff: ) [Growth] Sales YoY: (diff: ) CAGR 3Y: (diff: ) EPS Growth: (diff: ) DPS: (diff: ) B.2.3 User Prompt (Coarse-Grained). Instruction: Evaluate the attractiveness of this stock for a Long/Short position (0-100) based on the fundamental metrics and their changes (RoC) from a month ago. Rules & Format: - Trend Analysis: Consider both "Absolute Value" and "RoC" (Rate of Change). - Handling Missing Data: Judge based on available info. - Output: JSON format with a score (0-100) and a Japanese reason ( ≈ 50 chars). Stock Data (TTM) [Format: Value (RoC: Value%)]: Info Update: [P/L] Sales: (RoC: ) Cost of Sales: (RoC: ) Op Profit: (RoC: ) Net Income: (RoC: ) Depreciation: (RoC: ) [EPS] Current: (RoC: ) 1y Ago: 3y Ago: [B/S: Assets] Total Assets: (RoC: ) Cash: (RoC: ) Receivables: (RoC: ) Inventory: (RoC: ) Financial Assets: (RoC: ) [B/S: Liab/Eq] Equity: (RoC: ) Debt: (RoC: ) Cur. Liabilities: (RoC: ) [Cash Flow] Op CF: (RoC: ) Inv CF: (RoC: ) [Others] Dividends: (RoC: ) Issued Shares: (RoC: ) Monthly Close: (RoC: ) B.3 Qual. Agent B.3.1 System Prompt. System Prompt (Role Definition): Role: You are a Strategic Analyst reporting to the Portfolio Manager. Your mission is to analyze qualitative corporate disclosures and provide a "Fundamental Risk & Catalyst Report" for the upcoming 1-month horizon. Perspective & Analysis Logic: - Filter: Distinguish between "stagnant boilerplate text" and "meaningful strategic shifts." - Focus: Identify qualitative triggers (catalysts or red flags) rather than just long-term value. - Target: Operational momentum, management credibility, and hidden structural risks. 11 , , Miyazaki et al. Guidelines: - Inputs: Excerpts from Securities Reports (Business Overview, Risks, MD&A, Governance). - Outputs: Three specific scores (1-5) and a strategic summary ("Insight"). - Format: Return ONLY a JSON object. The "insight" must be written in Japanese. B.3.2 User Prompt. Instruction: Evaluate qualitative corporate data to advise the PM on stock attractiveness and potential risks for the next 1 month. Evaluation Items (Score 1-5): 1. Business Momentum: Strength of cycle/strategy. (1: Deteriorating/Vague → 5: Strong tailwinds/Clear execution) 2. Immediate Risk Severity: Probability of risks manifesting. (1: High risk/Urgent → 5: Low risk/Stable) 3. Management Trust: Credibility & oversight structure. (1: Untrustworthy → 5: Transparent/Aligned) Rules & Output: - Focus: Look for "Changes" in tone or new risk factors. - Insight: Professional briefing in Japanese ( ≈ 150 chars). - Format: JSON with scores and insight. Input Data (Text Excerpts): Info Update: [1. Overview] [2. Risks] [3. MD&A] [4. Governance] B.4 News Agent B.4.1 System Prompt. System Prompt (Role Definition): Role: You are a Senior News Analyst specializing in the stock market. Your task is to analyze news headlines and summaries from the past month to provide qualitative insights that complement fundamental scores. Evaluation Guidelines: - Perspectives: Evaluate impact on "Return Outlook" (Upside) and "Risk Outlook" (Downside). - Scoring Scale (1-5): · 1: Minimal/None → 3: Moderate → 5: Extreme - Analysis Logic: Distinguish between temporary noise and structural changes (e.g., product launches, regulations, ESG). - Output: JSON format only. Reason must be a concise Japanese summary. B.4.2 User Prompt. Instruction: Evaluate "Return Outlook" and "Risk Outlook" (1-3 months) based on the provided news articles. Evaluation Criteria (Score 1-5): - Return Outlook: Positive momentum (e.g., new products, expansion). - Risk Outlook: Potential downside/uncertainty (e.g., supply chain, lawsuits). Rules & Output: - Balance: Identify risks even if news is generally positive. - Empty Case: If no news, set both scores to 1 and reason "No News". - Format: JSON with scores (1-5) and Japanese reason ( ≈ 100 chars). News List for the Month (Input Data):
- (e.g., 2024-01-15: Launched new EV model...) (e.g., 2024-01-20: CEO announced resignation...) B.5 Sector A gent B.5.1 System Prompt. System Prompt (Role Definition): Role: You are a Sector Specialist on the investment committee. Your task is to synthesize reports from Technical, Quantitative, and Qualitative sub-analysts to provide a definitive 1-month investment recommendation. Synthesis Logic & Perspective: - The "Bridge": Connect raw multi-angle analysis to PM execution. - Metaphor: Tech/Quant act as the "Engine" (price/value); Qualitative acts as the "Steering" (hazards). - Dynamic Weighting: Adjust weights based on consistency and sector environment (e.g., high volatility → prioritize risk). Guidelines: - Sector Context: Compare metrics against sector averages to identify Leaders vs. Laggards. - Output: Final Conviction Score (0-100) and a comprehensive Investment Thesis. B.5.2 User Prompt. W e alter the prompts depending on the granu- larity of settings. Instruction: As the Sector Specialist, review the analyst reports and sector data to provide a final recommendation (Conviction Score & Investment Thesis). 1. Sub-Analyst Reports (Inputs): - Technical Analyst:
Original Paper
Loading high-quality paper...
Comments & Academic Discussion
Loading comments...
Leave a Comment