Optimal inference via confidence distributions for two-by-two tables modelled as Poisson pairs: fixed and random effects
This paper presents methods for meta-analysis of $2 \times 2$ tables, both with and without allowing heterogeneity in the treatment effects. Meta-analysis is common in medical research, but most existing methods are unsuited for $2 \times 2$ tables w…
Authors: Céline Cunen, Nils Lid Hjort
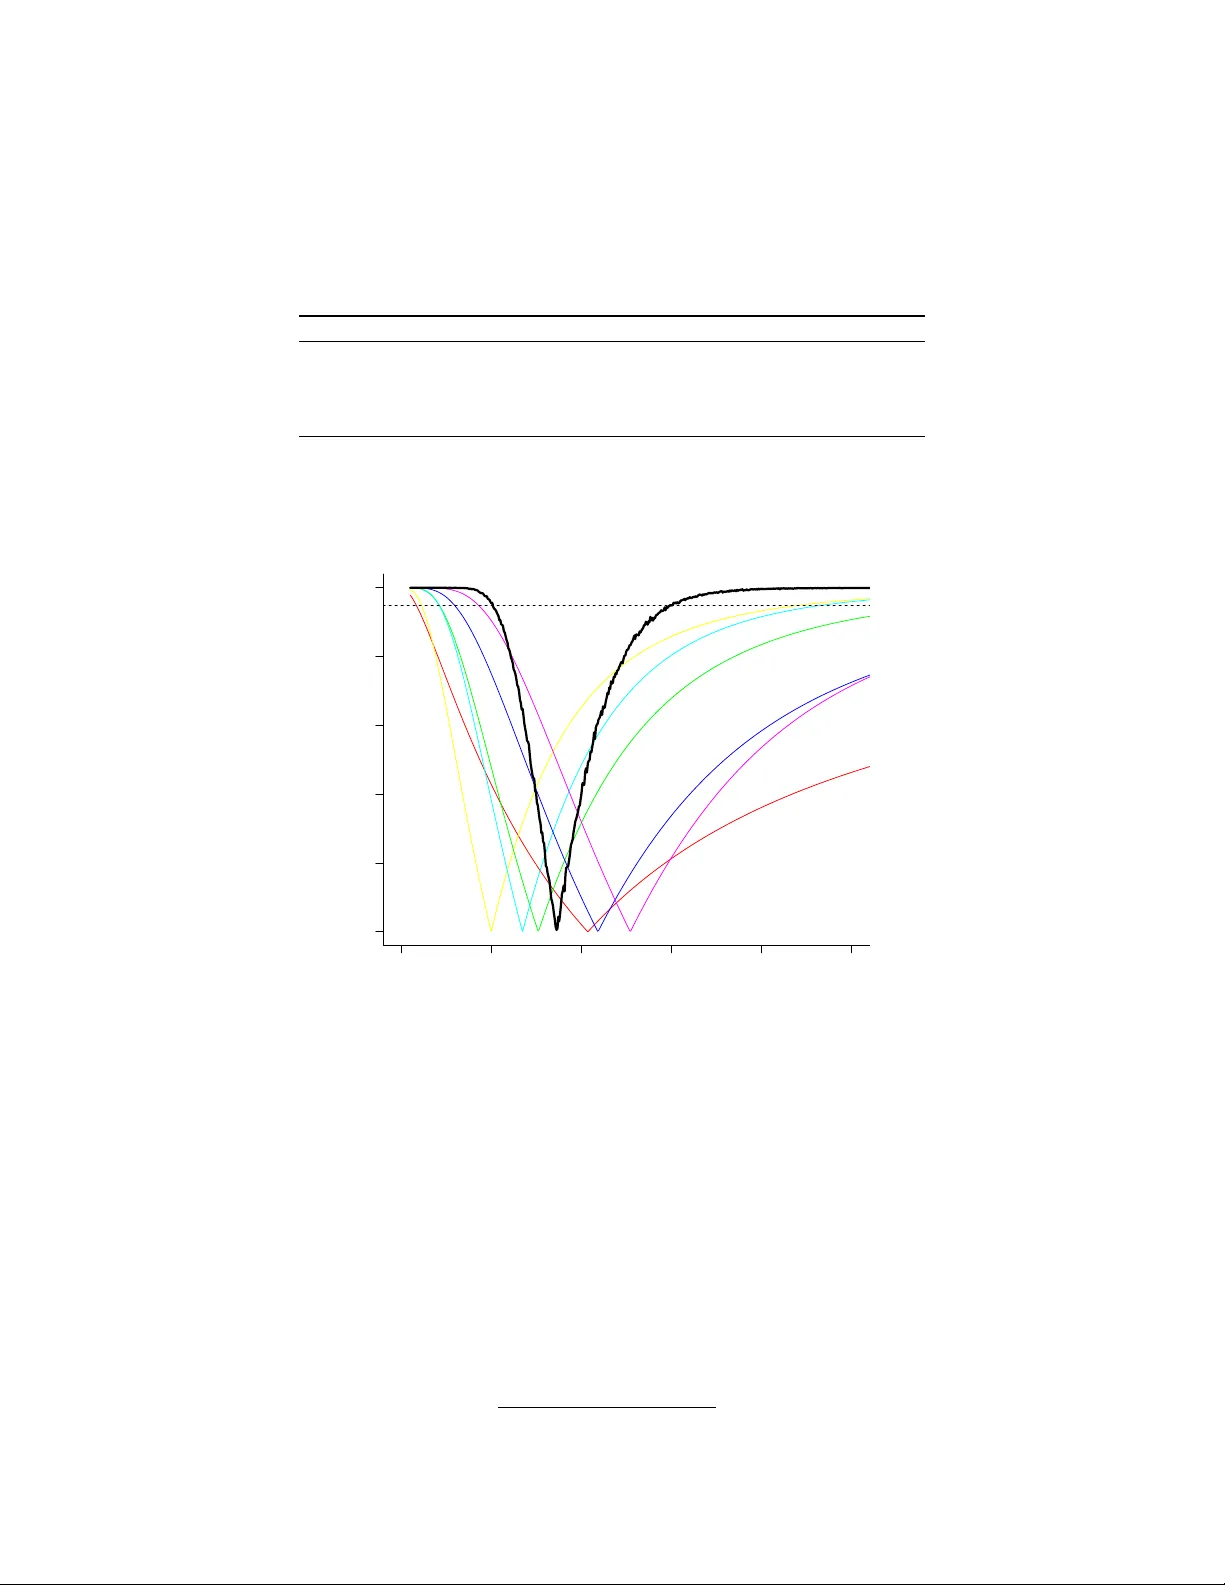
Optimal inference via confidence distributions for t w o-b y-tw o tables mo delled as P oisson pairs: fixed and random effects C ´ eline Cunen* Univ ersity of Oslo, Oslo, Norw a y - cmlcunen@math.uio.no Nils Lid Hjort Univ ersity of Oslo, Oslo, Norw a y - nils@math.uio.no Abstract This pap er presents metho ds for meta-analysis of 2 × 2 tables, b oth with and without allowing heterogeneity in the treatmen t effects. Meta-analysis is common in medical researc h, but most existing me thods are un- suited for 2 × 2 tables with rare ev ents. Usually the tables are modelled as pairs of binomial v ariables, but w e will mo del them as Poisson pairs. The metho ds presented here are based on confidence distributions, and offer optimal inference for the treatment effect parameter. W e also prop ose an optimal metho d for inference on the ratio b et ween treatment effects, and illustrate our metho ds on a real dataset. Keyw ords : combining information; meta-analysis; rare even ts. 1. In tro duction Meta-analysis is a class of widely used methods for com bination of information from independent studies. In medicine, meta-analyses of 2 × 2 tables are esp ecially common. There are for example many studies in vestigating whether a certain drug is related to harmful side-effects. The usual set-up is to divide patients in to a treatment and con trol group, and coun t the n umber of side-effect ev ents in both groups. If the side- effect in question is v ery rare, individual studies can hav e lo w pow er, and meta-analysis is therefore esp ecially imp ortan t (Liu et al., 2014). The most common methods for meta-analysis of 2 × 2 tables rely on large sample appro ximations, whic h mak es them unsuited for analysis of tables with rare ev en ts (Bradburn et al., 2007). This applies for example to the well-kno wn Mantel-Haenszel metho d, the Peto metho d and the DerSimonian and Laird metho d (Bradburn et al. (2007) and Liu et al. (2014)). Recen tly Liu et al. (2014) introduced certain confidence distributions (CDs) based metho ds for this t yp e of analysis. In this pap er w e present differen t CD-based methodology . Our methods utilise certain optimality theorems which in particular lead to CDs with a uniformly higher confidence pow er than for CDs constructed via the methods of Liu et al. (2014). The n um be r of even ts (cell-counts) in k 2 × 2 tables are often mo delled as pairs of independent binomial random v ariables ( Y 0 ,i , Y 1 ,i ), with sample sizes ( m 0 ,i , m 1 ,i ) and ev ent probabilities ( p 0 ,i , p 1 ,i ). Here Y 0 ,i is the num b er of ev en ts among the con trol group in study i and Y 1 ,i is the n um b er of ev en ts in the treatment group in study i . Usually , the primary interest is not in the even t probabilities themselv es, but rather in the p oten tial discrepancy betw een the ev ent probabilities in the tw o groups. Whereas suc h a discrepancy can b e defined in differen t fashions, the usual wa y in biostatistics is via the logistic transform: p 0 ,i = e θ i 1 + e θ i and p 1 ,i = e θ i + ψ i 1 + e θ i + ψ i . In particular, the o dds ratio is OR i = p 1 ,i / (1 − p 1 ,i ) p 0 ,i / (1 − p 0 ,i ) = e θ i + ψ i e θ i = e ψ i . In the case of small even t probabilities, the cell-counts can alternatively b e mo delled as pairs of indep endent P oisson v ariables, Y 0 ,i ∼ P ois( e 0 ,i λ i ) and Y 1 ,i ∼ P ois( e 1 ,i λ i γ i ) . (1) The argument for this is that binomial v ariables con v erge in distribution to P oisson when the sample size is large and the ev en t probabilities are small. Here e 0 ,i and e 1 ,i are kno wn exp osure w eigh ts reflecting the sample sizes, i.e. w e will exp ect more cases from a larger study , than a smaller one, indep endent of the ev ent probabilities. W e choose e 0 ,i = m 0 ,i / 100 and e 1 ,i = m 1 ,i / 100 . Th us, λ i can be interpreted as the risk of ev ent p er 100 patien ts in the con trol group, and γ i as the m ultiplica- tiv e parameter asso ciated with the p otentially different risk (p er 100 patients) for patien ts in the treatment group compared to the con trol group (henceforth called the treatmen t effect). Inference concerning odds ratio in the binomial model and γ i in the Poisson mo del is similar when ev en t probabilities are small and samples sizes are large. In fact, OR i = p 1 ,i / (1 − p 1 ,i ) p 0 ,i / (1 − p 0 ,i ) ≈ p 1 ,i p 0 ,i ≈ e 1 ,i λ i γ i /m 1 ,i e 0 ,i λ i /m 0 ,i = λ i γ i λ i = γ i . The λ i parameters v ary from table to table. In our pap er we shall consider the fixed effect mo del, where the γ i are equal to a common γ , as well as random effect mo dels, where the γ i are allo wed to differ. Our modus of inference will be that of CDs. A CD C ( θ ) for a parameter θ is a ‘distribution estimator’, i.e. a sample-dep endent cumulativ e distribution function ov er the parameter space summarising all asp ects of frequentist inference for θ (for a thorough introduction to inference with CDs see Sch w eder & Hjort (2015) and Xie & Singh (2013)). In addition to presenting the results as a cumulativ e distribution function, it is fruitful to represen t the distribution of confidence as a confidence curve, defined as cc( θ ) = | 1 − 2 C ( θ ) | . The confidence curve is a funnel plot pointing to the median confidence estimate ˆ θ = C − 1 ( 1 2 ); also, confidence in terv als for all levels α can b e read off, see for example Figure 1. F or parameters from mo dels of the exp onential class, there exist optimal confidence distributions (Sc hw eder & Hjort, 2015, Ch. 5). These are uniformly most p o werful, in the sense of having low er exp ected confidence loss than all other CDs for a large class of p enalty functions and all parameter v alues (see Sch w eder & Hjort (2002, 2015)). F or b oth the binomial and Poisson mo del these optimal CDs are given in Sch w eder & Hjort (2015, Ch. 14). If the optimal (or other exact) CDs are hard or time-consuming to compute, approximate CDs can b e constructed. There are several metho ds for this, and we will present some examples in section 3. In section 2 the optimal CD for the fixed effect Poisson mo del will b e pro vided, while the Poisson model with heterogeneous treatmen t effects (random effects) is treated in section 4. Section 5 offers some concluding remarks. 2. Optimal confidence distribution for the fixed effect mo del The P oisson fixed effect mo del has the following log-likelihoo d, writing z i = y 0 ,i + y 1 ,i , ℓ ( γ , λ 1 , . . . , λ k ) = k X i =1 { y 1 ,i log γ + z i log λ i − ( e 0 ,i + e 1 ,i γ ) λ i } . (2) This is a log-lik eliho o d of the exp onen tial family class. By theorems in Sch weder & Hjort (2015, Ch. 5) optimal inference for γ is based on its sufficien t statistic ( P Y 1 ,i ) given the ancillary statistics ( Z 1 , . . . , Z k ). The conditional distribution of Y 1 ,i | Z i is seen to b e binomial, Y 1 ,i | ( Z i = z i ) ∼ Bin z i , e 1 ,i γ e 0 ,i + e 1 ,i γ . (3) F rom this distribution we can construct CDs for γ from each study (with half-correction for discreteness) C i ( γ ) = P γ ( Y 1 ,i > Y 1 ,i, obs | z i, obs ) + 1 2 P γ ( Y 1 ,i = Y 1 ,i, obs | z i, obs ) . (4) Similarly , w e can construct a com bined CD for γ for all the studies, which is uniformly most p ow erful according to Sc hw eder & Hjort (2015, Ch. 5), C ∗ ( γ ) = P γ ( B > B obs | z 1 , obs , . . . , z k, obs ) + 1 2 P γ ( B = B obs | z 1 , obs , . . . , z k, obs ) . where B = P k i =1 Y 1 ,i , and B obs is the observed v alue of B . This is a sum of binomially distributed v ariables with differen t probability parameters ( e 1 ,i γ / ( e 0 ,i + e 1 ,i γ )), and its distribution might easily be sim ulated. As an illustration of this method, we ha v e applied it to a medical datasets with six studies in v estigating death rates among heart attac k patien ts (Normand, 1999). The treatment group received the drug Lido caine and the con trol group did not. The sample sizes and num b er of deaths in the six studies are listed in T able 1. Study Sample size con trol Even ts control Sample size treatment Even ts treatment 1 39 1 43 2 2 44 4 44 4 3 107 4 110 6 4 103 5 100 7 5 110 3 106 7 6 154 4 146 11 T able 1: Sample sizes and num ber of deaths for the six Lido caine studies. F or the Lido caine data, the combined CD for γ is shown in Figure 1, along with CDs from each study . 0 1 2 3 4 5 0.0 0.2 0.4 0.6 0.8 1.0 γ confidence cur v es Figure 1: Confidence curves for γ for six Lido caine studies (in colour) and combined confidence curve for all the studies (in black). A 95% confidence interv al for γ can b e read off (dashed line), [1.01,3.01]. 3. Appro ximate confidence distributions for the fixed effects mo del The optimal CD can be slightly time-consuming to compute, but we can construct appro ximate CDs, offering a fast and often accurate alternative. Consider the log-lik eliho o d function of the conditional mo del following from (3). W e learn that the maxim um conditional lik eliho od (MCL) estimator is a monotone function of B = P Y 1 ,i . Since CDs are inv ariant with resp ect to monotone transformations, the optimal CD in the previous section is actually the same as the CD based on the MCL estimator ˆ γ mcl . Ignoring half-corrections, w e get C ∗ ( γ ) = P γ ( B > B obs | z 1 , obs , . . . , z k, obs ) = P γ ( ˆ γ mcl > ˆ γ mcl , obs ) . F or the Poisson mo del the MCL estimator of γ is the solution of the following equation, k X i =1 y 1 ,i ( e 0 ,i + e 1 ,i γ ) − z i e 1 ,i γ γ ( e 0 ,i + e 1 ,i γ ) = 0 . Inciden tally , the solution to the equation ab ov e is also the maximum likelihoo d (ML) estimator. Thus the unconditional and conditional likelihoo ds lead to the same estimators for this Poisson mo del. This pans out differen tly for other mo dels, as for example the mo del of binomial pairs (Breslow, 1981). Classical large samples metho ds for ML giv e us an appro ximate CD for γ , C approx ( γ ). The distribution of ˆ γ mcl is approximately a normal ( γ , ˆ J − 1 ), with ˆ J the Hessian matrix asso ciated with the log-likelihoo d function. This leads to the follo wing approximate CD, C approx ( γ ) = Φ(( γ − ˆ γ mcl ) / p ˆ J − 1 ) . Alternativ ely an approximate confidence distributions for γ can b e constructed b y χ 2 1 -transforming the de- viance function of the profiled likelihoo d (see Sch weder & Hjort (2015, Ch. 2-3)). The k + 1-dimensional log-lik eliho o d function in (2) is profiled by maximising o ver λ 1 , . . . , λ k , leading (in this case) to an explicit profile log-lik eliho o d ℓ prof ( γ ) = k X i =1 { y 1 ,i log γ − z i log( e 0 ,i + e 1 ,i γ ) } . The corresp onding deviance function and the resulting confidence curv e are D ( γ ) = 2 { ℓ prof ( ˆ γ ml ) − ℓ prof ( γ ) } and cc a ( γ ) = Γ 1 ( D ( γ )) , where Γ 1 () is the cum ulative distribution function of the χ 2 1 . Both appro ximations w ork reasonably well, esp ecially when there are man y studies (large k ), see Figure 2. 0 1 2 3 4 0.0 0.2 0.4 0.6 0.8 1.0 γ confidence cur v es Figure 2: Optimal confidence curv e for γ (in blac k) for the Lidocaine data, confidence curve based on the appro ximate distribution of the MCL (in red) and confidence curve based on profile deviance (in blue). 4. Optimal and approximate inference with heterogeneous treatment effects In meta-analysis of 2 × 2 tables, the o dds ratio from the binomial mo del is sometimes treated as a random effect (for example in the DerSimonian and Laird metho d). Similarly , cell-counts from 2 × 2 tables can b e mo delled with a Poisson mo del with a non-constant γ parameter. This allows the treatment effect γ i to v ary , as in (1). There are several p ossibilities regarding such mo dels. Our first suggestion is based on pairwise comparisons. Consider tw o studies at the time, for example study 1 and 2, with Y 0 , 1 ∼ Pois( e 0 , 1 λ 1 ), Y 1 , 1 ∼ Pois( e 1 , 1 λ 1 γ 1 ) and with Y 0 , 2 ∼ Pois( e 0 , 2 λ 2 ), Y 1 , 2 ∼ Pois( e 1 , 2 λ 2 γ 2 ). W e can construct a CD for the ratio b etw een the tw o treatmen t effects, δ = γ 2 /γ 1 . By arguments similar to those w orked with in section 2, a p ow er optimal CD for δ is found. It takes the form (with half-correction) C 1 , 2 ( δ ) = P δ ( Y 1 , 2 > Y 1 , 2 , obs | w obs , z 1 , obs , z 2 , obs ) + 1 2 P δ ( Y 1 , 2 = Y 1 , 2 , obs | w obs , z 1 , obs , z 2 , obs ) , where W = Y 1 , 1 + Y 1 , 2 , Z 1 = Y 0 , 1 + Y 1 , 1 and Z 2 = Y 0 , 2 + Y 1 , 2 . Thus we need the distribution of Y 1 , 2 | ( W, Z 1 , Z 2 ), and w e find that it is an eccentric hypergeometric distribution, which may b e expressed as f ( y 1 , 2 | ( w , z 1 , z 2 )) = z 1 w − y 1 , 2 z 2 y 1 , 2 e 0 , 1 e 1 , 2 e 1 , 1 e 0 , 2 y 1 , 2 δ y 1 , 2 P w u =0 z 1 w − u z 2 u e 0 , 1 e 1 , 2 e 1 , 1 e 0 , 2 u δ u , for y 1 , 2 from 0 to min( w, z 2 ) . In this wa y we can construct CDs for δ i,j for all pairs among the six Lido caine studies. In Figure 3 the CD for δ 2 , 6 is display ed. These are the tw o studies with the most different median confidence estimates for γ (see Figure 1). The CD for this δ indicates that 1 is a lik ely v alue (the 95% confidence in terv al is [0 . 37 , 17 . 81]). Hence the γ s in the Lido caine data do not seem sufficiently different to justify the use of a random effects mo del. 0 5 10 15 20 0.0 0.2 0.4 0.6 0.8 1.0 δ confidence curve 0 1 2 3 4 0.0 0.2 0.4 0.6 0.8 1.0 γ 0 0.0 0.1 0.2 0.3 0.4 0.0 0.2 0.4 0.6 0.8 1.0 κ Figure 3: Three confidence curves are sho wn. In panel 1, for δ b etw een the tw o most different Lido caine studies (in red); in panel 2 for γ 0 ; in panel 3 for κ . The 95% confidence interv als can b e read off, [0 . 37 , 17 . 81] for δ , [1 . 02 , 3 . 00] for γ 0 and [0 , 0 . 072] for κ . The v ariation among the treatment effects from different studies can also b e inv estigated in other wa ys. A natural suggestion is to mo del the v ariation of the γ i with a b eta distribution for the probabilities π i from the conditional distribution of Y 1 ,i | ( Z i = z i ), Y 1 ,i | ( Z i = z i , γ i ) ∼ Bin( z i , π i ) with π i = e 1 ,i γ i e 0 ,i + e 1 ,i γ i , where in addition π i ∼ Beta { τ π 0 ,i , τ (1 − π 0 ,i ) } and π 0 ,i = e 1 ,i γ 0 / ( e 0 ,i + e 1 ,i γ 0 ). Letting κ = ( τ + 1) − 1 , we ha ve E( π i ) = π 0 ,i and V ar( π i ) = κπ 0 ,i (1 − π 0 ,i ) . If τ = ∞ , then κ is equal to zero and w e are bac k in the Poisson mo del with a common γ . W e can construct appro ximate confidence curves for γ 0 b y using profile deviance metho ds as describ ed in section 3, cc( γ 0 ) = Γ 1 ( D 1 ( γ 0 )) , D 1 ( γ 0 ) = 2 { ℓ 1 , prof ( ˆ γ 0 ) − ℓ 1 , prof ( γ 0 ) } . F or κ , cc( κ ) = | 1 − 2 P κ ( Q min ≥ Q min , obs ) | is a v alid confidence curve, since it is (b y construction) nearly uniformly distributed at the true parameter v alue. W e use the natural statis tic Q min = min γ 0 k X i =1 { y 1 ,i − z i f i ( γ 0 ) } 2 z i f i ( γ 0 ) { 1 − f i ( γ 0 ) } , where f i ( γ 0 ) = e 1 ,i γ 0 e 0 ,i + e 1 ,i γ 0 , and calculate it for the observed data (finding Q min , obs ) and for a num b er of y 1 ,i v ectors, simulated under differen t κ v alues, with fixed z i and ˆ γ 0 . The CD for γ 0 allo ws us to mak e inference ab out the increase in risk related to the the treatment in question. While the CD for κ is used to assess the v ariation in the treatment effect. If the estimate for κ is small and the CD for κ has a significan t point mass at zero, then th e v ariation among the treatmen t effect is small and we can choose to use the fixed effect mo del from section 2. Otherwise, the random effect mo del may b e preferable. F or the Lido caine example, the CD estimate for κ is zero and the p oint mass at zero is 0.85 (Figure 3). This supp orts our conclusion for the δ analysis ab ov e, that there is little v ariation among the γ s for the Lido caine studies, and that the fixed effect mo del is the most appropriate. 5. Concluding remarks There are many other asp ects of meta-analysis of 2 × 2 tables (in the CD framework) worth considering. First, w e hav e applied our CD-methods to several other datasets, including a small dataset from Narum et al. (2014), with five studies inv estigating whether drugs of a certain type (corticosteroids) are related to gastroin testinal bleeding for patients in am bulatory care. These data p oses some c hallenges for man y tra- ditional meta-analysis metho ds b ecause most of the studies hav e zero ev ent entries, either in the treatment group or the control group. Many existing metho ds demand 0.5 corrections to zero even ts in such situations, but these kinds of corrections can giv e large biases and are not recommended (Bradburn et al., 2007). One of the strengths of our metho d is that it can pro duce a combined confidence distribution in this case, without needing to add anything to the data. Secondly , w e ha ve implemented the alternativ e CD based com bination metho d from Liu et al. (2014), and compared it to our metho ds. The t wo classes of methods can yield similar results, but ours yield stronger confidence. Lastly we hav e considered extensions to 2 × 3 tables (which the P oisson model can handle without problems) and alternativ e w a ys to mo del the heterogeneous treatment effects (for example with a P oisson-gamma mo del). References Bradburn, M. J., Deeks, J. J., Berlin, J. A., & Russell Lo calio, A. (2007). Muc h ado ab out nothing: a comparison of the p erformance of meta-analytical metho ds with rare ev en ts. Statistics in Me dicine , 26, 53–77. Breslo w, N. (1981). Odds ratio estimators when the data are sparse. Biometrika , 68, 73–84. Liu, D., Liu, R. Y., & Xie, M. (2014). Exact meta-analysis approac h for discrete data and its application to 2 × 2 tables with rare ev ents. Journal of the Americ an Statistic al Asso ciation , 109, 1450–1465. Narum, S., W estergren, T., & Klemp, M. (2014). Corticosteroids and risk of gastrointestinal bleeding: a systematic review and meta-analysis. BMJ op en , 4. Normand, S.-L. T. (1999). T utorial in biostatistics meta-analysis: formulating, ev aluating, combining, and rep orting. Statistics in Me dicine , 18, 321–359. Sc hw eder, T. & Hjort, N. L. (2002). Confidence and lik eliho o d. Sc andinavian Journal of Statistics , 29, 309–332. Sc hw eder, T. & Hjort, N. L. (2015). Confidenc e, Likeliho o d, Pr ob ability: Infer enc e With Confidenc e Distri- butions . Cambridge Universit y Press. Xie, M. & Singh, K. (2013). Confidence distribution, the frequen tist distribution estimator of a parameter: a review [with discussion and a rejoinder]. International Statistic al R eview , 81, 3–39.
Original Paper
Loading high-quality paper...
Comments & Academic Discussion
Loading comments...
Leave a Comment