In-Situ Analysis of Vibration and Acoustic Data in Additive Manufacturing
Vibration from an erroneous disturbance harms the manufactured components and lowers the output quality of an FDM printer. For moving machinery, vibration analysis and control are crucial. Additive manufacturing is the basis of 3D printing, which uti…
Authors: Muhammad Fasih Waheed, Shonda Bernadin
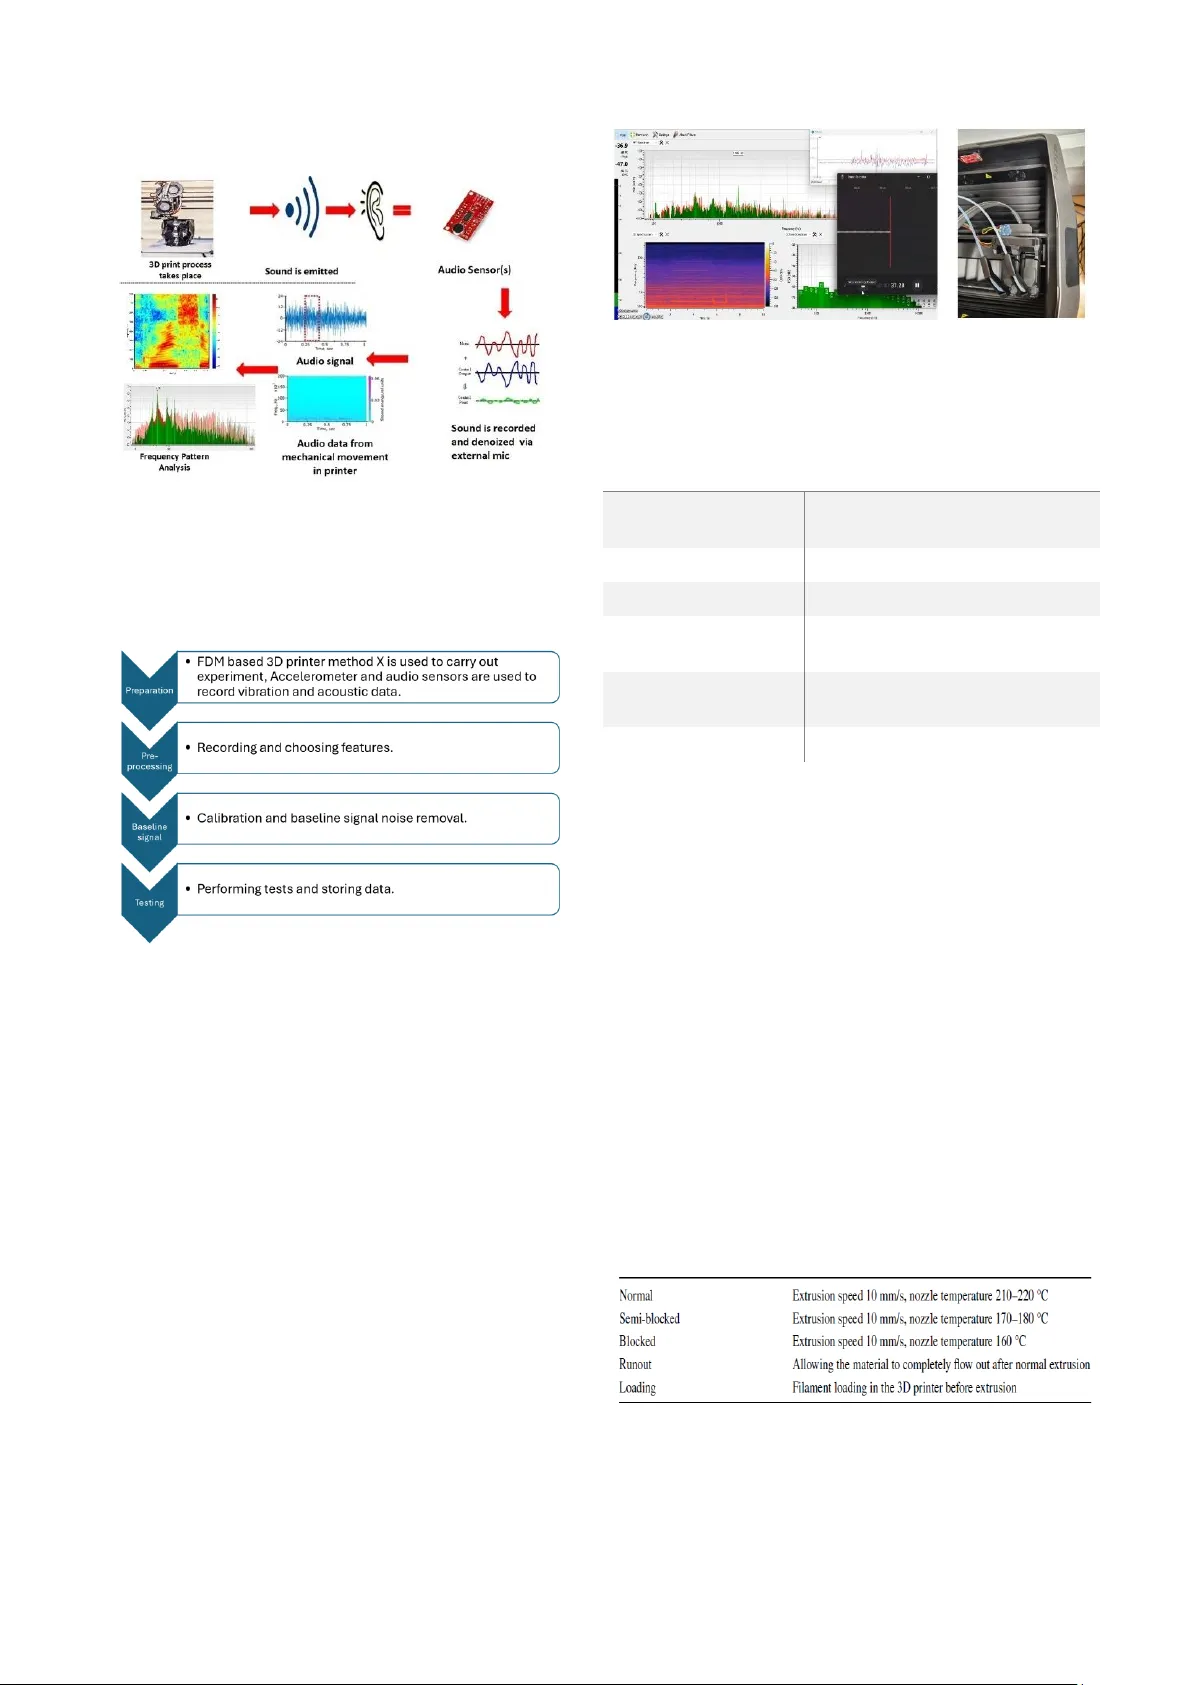
In -Situ Analysis of Vibration and Acoustic Data in Additive Manufacturing Muhammad Fasih Waheed Electrical and Computer Engineering Florida A&M University Tallahassee, USA muhammad1.waheed@famu.edu Dr. Shonda Bernadin Electrical and Computer Engineering Florida A&M University Tallahassee, USA bernadin@eng.famu.fsu.edu Abstract — Vibration from an erroneous disturbance harms the manufactured components and lowers a FDM printer’s output quality. For mo ving machinery, vibration an alysis and control are crucial. The additive manufacturing technique is the basis for 3D printing which utilizes mechanical movements of extruder to print objects and fa ults occur due to unwanted vibrations. Therefore, it is vital to examine the 3 D printer's vibration pattern. In this work we will observe these parameters of FDM printer exemplified by Maker Bot method X. To analyze, it is necessary to understand the motion it generates, a nd appropriate sensors must be selected to detect those motions. The sensor measurement values can be used to determine the printer's condition. We have used an accelerometer a nd an a coustic sensor to mea sur e the vibration and a c oustics produced by the printer. The in dividual output from these sensors a re e xamined. The findings show th at vibration occurs at relatively low levels during continuous motion because it only o ccurs at the components' soft edges. Due to the abrupt acceleration and deceleration during the zigzag motion, the vibration is at its peak. Keywords — Sensors in additive manufacturing; Acoustic analysis; machine condition monitoring, vibration monitoring, In situ qua lity monitoring, Acoustic emission, a coustic-based diagnosis; Fused filament fa brication, Fused dep osition modeling. 1. I NTRODUCTIO N To ensure the quality and consistency of parts produced by the MakerBot Method X, it is esse ntial to have an effective quality control system in place. One of the most promisin g approaches for quality control in FDM is conditio n monitoring. Condition monitorin g invol ves the continuous monitori ng of key parameters during the printin g process t o detect anomalies and id entif y potent ial defe cts before they become critical. Many studies have alrea dy been done on this topic [1-8] This technique can provide valuable insights into t he quality of printed parts, enabling manufactu rers to take correct ive action and optimize their productio n proc esses. In this pape r, we will review the cu rrent state- of -t he-ar t in -situ conditi on monitori ng for FDM printers, examine the benefits and c hallen ges associated with this t echniqu e, propose future research directi ons to enhance the effective ness of condition monitorin g in this printer , and present experiment al findings to contribu te valuable insights to the f ield. FDM is a prevale nt additive manufacturing m eth od that involves melting materi al, extru ding it throu gh a nozzle, depositin g it on a bed, and la yerin g it to form parts. FDM offers several benefits, includi ng low cost, simpl e operati on, and t he ability to manufacture complex s hapes efficiently and environmentall y friendly. We are going to different iate between various modes of failure within the 3d printer caused by the motions. We will also analyze the acoustic patterns of th e 3d pri nter duri ng moti on. A. Background Despite techn ological adv ancements, FDM p rinting can still result in defec ts, necessitating exten sive research into monitoring the printing process and product q uality to enhance success rates and efficien cy. [1] By doing a comparison and analysis of vibration signal generated by extruder h ead movements in a FDM p rinter we can further understand the root cause of failure, in FDM printer the x - axis, y-axis, and z -axis mo tor s wor k tog ether to control the movemen t of the extruder head an d the build platform in three-dim ensional space. The p rint head moves in 2 axis ‘x’ an d ‘y’, Th e print bed moves in ‘z’ direc tion, The x -axis moto r is respon sible for moving the pr int head horizontally along the x -axis, while the y-ax is mo tor controls the movem ent of the build platform along the y-axis. The z-ax is motor, o n the other hand, con trols the vertical movem ent of the print head and the build platform along the z -axis. Also three different motions, including p oint- to -point, zigzag, and continu ous motion are produced by extruder which result in sometim es unwanted vibratio n. Fig 1.1 . shows the locatio n of X and Y axis motor in the 3D printer. Fig. 1.1 . T op v iew show s h ighl ight ed X and Y a xis m oto r . For this rese arch, we will be using The MakerBo t Method X, it is a high-pe rforma nce 3D printe r that use s Fused Deposition Modeling (FDM) technolo gy to produce high-qualit y parts. This printer is desi gned for industrial applicati ons and is capable of printing with a wide rang e of materials , incl uding ABS , Nyl on, a nd Carb on Fiber . II. I N - S ITU MONI TORING A ND ANALYSI S OF 3D PRINTER HEALTH In the context of 3D printing, in situ monitoring (ISM) refers to the use of auto mated pr ocesses to facilitat e real-time quality monitoring during the printing process. This type of monitori ng is essential for detecti ng product qualit y defects and ensurin g the overall health of the 3D printi ng process [9][10]. Research and studies have explore d the use of accelerom eters and acoustic sensors for in sit u monito ring of 3D printers, particular ly in the context of f used filamen t fabricati on (FFF) processes. Acceleromete rs have been utilized to analyze and contro l the vibration of 3D printers, with the extracted accelerati on data being u s ed to identif y various states of t he FFF machine and predict produc t quality[ 14 ][ 15 ] . Additi onally, the instal latio n of accelerom eters on 3D printers has been presented in experiment al set ups for nozzle conditio n m onito ring , demonstr ating t heir p otential in th is appl ication [ 16 ]. Acoustic sensors have also been considere d for in sit u monitori ng during the FFF process. Some studies have used time-domai n features of acoustic emission data to identif y abnormal conditions, such as material runout and blocked extruders, s howcasin g t he po tential of acoustic sens ors i n monitori ng the 3D printing process [ 16 ]. Various tech niques , such as in-situ print characte rizatio n, d efect monitoring via conductiv e filament and Ohm's Law, and digital image correlati on (DIC)-based monitori ng methods, have been developed for i n situ monitoring of additive manufact uring [ 11 ][ 12 ]. ASTM Internatio nal has released a report on in-situ monitori ng for 3D printin g, w hich aims t o pr ovide a comprehe nsive assessment of the tec hnology readiness and to identi fy gaps and challenges within the field of i n- sit u technolog y [19]. The report is the result of a workshop series organized by ASTM Internationa l, NASA, and America Makes, and it serves as a valuable resourc e for the 3D printing c ommunit y [10 ][ 13 ]. A. Components in a 3D printer A general idea of main compone nts in a 3D printer are shown in Fig 1.2. [17]. The thermoplasti c filame nt is d rive n from the extruder cold end to the hot end, where it is h eate d until molten, then fed through the nozzle to be bonded layer- by -la yer until the product is complete. In some cases, the platform may occasionally be referred to as just a build platform and not heated. Machine downtime and material loss can be prevented by keeping an eye on a 3D printer's health while it is printing. The extruder and heated b uild platform are the two crucial components that, to a signifi cant extent, define the success of printi ng for the majority of FFF machines used by people and industry [9]. Nozzle clogging , nozzle temperat ure, filament runout, and hot build are a few instances of spec ific sit uations or factors that need to be watched. The cold e nd and t he hot e nd are the t wo comp onents th at make up the extr uder. Fig 1 .2 . shows the speci fics for these two parts. Two crucial parts , the idler pulley shaft, which holds the fila ment, the step per motor and dr iv e gear make up the cold en d, which pu s hes the filament into the hot end of the extruder: [10]. The heater block, heat sink , heater cartridg e, and thermocouple in the hot end work together to precisel y heat the filament to a liquid condition before extrudi ng it from the nozzle when the filament reaches the hot end [11 ]. Fig. 1.2 . S hows se veral co mpo nents of an FD M prin ter. 1) Extru der teardown To g ain a deeper understanding of th e intricate mechanics and electrical sy stems at play within a print extruder, a model 1a ex truder is disassembl ed . This dissection allowed for a comprehensive exploration of the inner workings of this critical component in 3D printing technology. One of the key rev elations during this disassembly is the iden tification of two pr imary controllers integral to the extruder's operation and commun ication with the 3D printer. These controllers played d istinct but complemen tary roles in ensuring the accurate an d efficient extrusion of material. Th e first of these contro llers, deno ted as GQ2 55, is primarily responsible for ov erseeing and regulating the extrusion process. See Fig 1.3. its key function is to receiv e signals emanating from a m agnetic angle sensor, which had been m eticulously affixed to the filament feed ing tube. The m agnetic angle sensor, through its co ntinuous monitoring of th e position and rotation of the filam ent feeding tube, provided precise data that was tran smitted t o controller GQ255. It uses real-time data to ad just filament speed and flow for precise and aligned 3D printing. The magnetic angle sensor's syn chronization with GQ255 is crucial fo r p recision. The second controller manages communication between print extruder and 3D printer using serial co mmunication. It enables real -time adjustments and monitoring of p arameters like temperature and pr int speed for quality pr ints. Fig. 1.3 . Mech anical and elec tronic componen ts of model 1A extruder. B. Vibration sign al preprocessing To ac hieve desira ble outcomes while analyzing vibra tion signals, it is essenti al to conside r multiple fa ctors in practicalit y. The first fact or is the signal' s qualit y, which holds signi ficant importance . As per researc h [ 12 ], more than 70% of success is attrib uted to good signal acquis ition. To enhance the si gnal qualit y and guarante e the consiste ncy of the results, we are using ADXL 335 acceleromete r from Adafruit i ndustr ies as a vibrati on se nsor, See F ig 1.4. T o digitize the vibra tion signal accur ately, it is ess entia l t o determin e the appropriate sampling rate. The Nyquist theorem states th at the sampling frequen cy must be a minimum of two times higher than the maximum frequency in the vibration signal to captur e all signif icant informa tion. However, an e xcessi vely high s amplin g rate ca n result i n increased computati onal costs . Therefo re, in the exp eriments, a sampling rate of 2KHz has been employed to strike a balance between preservi ng information integrit y and ensuring computati onal efficie ncy. Fig. 1.4. Acceleromet er installe d on top of the extruder carriage. To diffe rentiat e operational states whi le FFF p rinti ng, the extracted character istics must possess a high sensiti vity to operatin g conditions as opposed to being impervi ous to noise. This stud y [13] has presente d f ive frequently employed features in time-domain signals, namely m ean, STD, RMS, CF, and KI. For a vibration signal x(n), where N, u, and represent length, mean, and STD values , respecti vely, RMS, CF, and KI can be formulated as follows . The root m ean square (RMS) is directly propo rtional to the energy levels of th e sig nal in the temporal domain. Variations in the RMS could indicate alteratio ns in the operatio nal states of the three-dimensiona l printer or be linked t o defects in th e fin al pr oduct [13]. CF is the ratio of peak - to -valley value to th e RMS value of the vibration s ignal and elucidates any outcome p resent i n the vibrat ion sig nal [ 14 ]. The implementation of ZigZag motion in 3D printers is recognized for its efficacy in ach ieving intricate prints; however, it necessitates a careful consider ation of the accompanying vib rational effects. ZigZag motion inheren tly generates sub stantial v ibrations d uring the rapid and repeated directional changes of the p rint h ead. Th ese vibrations, ch aracterized by the intr oduction of h armonic frequencies, have the potential to adversely impact various mechanical components within the printer. Of p articular concern is th e likelihood of compr omised structural integ rity due to th e vibr ations, which may manifest as consequ ences such as the loosening of screws or vulnerab ilities in the design of metal sheets. These structur al deficiencies, if unaddressed, can escalate to significant is sues, p osing a threat to the overall stability of the printer. Additionally, the vibrational effects of Zig Zag motio n exten d to critical mechanical parts, with pulleys and drive gears emerging as susceptible elemen ts. The oscillation s induced by Zig Zag motion may result in misalign ment, slippag e, or other oper ational irregularities in these components, thereby necessitating a compreh ensive understand ing and proactive m itigation strateg ies to ensure the sustained p erformance and durability of 3 D printers. C. Acoustic signa l preprocessing Audio sensor s can detect the high an d low fr equency acoustic emissions g enerated by the movement of the motors, gears and the v ibrations they create [8] . These sensors can detect any changes in th e acoustic emission s, such as increased no ise or unusual sounds, which can indicate a p roblem with th e system . Fig 1.5. shows an illustration of how audio sensor can be u sed to visualize frequency p atterns. Multiple arrays o f acoustic sensors ca n be placed on a 3D printer to enhance mechanical fault detectio n. The sensors ca n be placed at strateg ic location s on the pr inter, such as near th e motors, gears, and belts. The sensors ca n be used to detect acoustic em issions, which are sound waves that are generated by the printer d uring o peration. Thes e sensors are part of a larger system that includes various other types of sensors, such as ac celerometers, vibration sensors, thermal cameras, and optical camer as, to monitor the health o f the printer du ring the printing pro cess [ 18 ] . The use of multiple sensors allows for a more compreh ensive under standing of the printer's p erformance, as differen t sensors can capture differen t aspects of its operation [ 19 ]. Fig. 1.5. Ill ustration of utilization of audio sensor for frequency pattern visualization and a nalysis. III. E XPERIMENTAL S ETUP This aspect o f the study' s experimental design is described in detail , and Fig 2.1. shows the associated flowchart . Fig. 2 .1. Fun dam ent al ste ps for in -situ moni tori ng and diag nosti c for the FFF (F used Fil ame nt F abri cat ion) proc ess In step 1, the FFF machine, Acceleromet er sensor, Acoustic sens or, data acquisi tion (DAQ) devi ce (Arduino uno), and laptop computer are u sed to set u p the experi ment system. Step 2 involves gatheri ng the signals and choosi ng the features. In stages 3 and 4 , data graphs are used to monitor and diagnos e the machine state. The establis hed setup comprises of the FFF Printer, Accele rometer , audi o sensors, DAQ system, and a personal computer, as ill ustrate d in Figure 3 .1 The FFF equipment utilized in this investigati on is Method X, a high-performanc e fiber composite FFF machine produ ced by Ma kerBot, ( NYC, NY , USA). An accelerome ter is attac hed to the extrud er in a way that it can detect and measure horizontal movement in either directi on. A DAQ u nit is employed to process the signals which comprises of Arduino Uno. The digital signal processin g module on the laptop is c apable of processi ng real-time signals . The laptop used is XPS 9570 produce d by Dell, and t he signal processing s oftware used is Arduino IDE. All d ata processing and t estin g is carried out in a MATLAB and S pectroi d . The FFF process specifi cati ons presented in this article are listed in Table 1. 0. The material used is ABS-R, which provides a high-strength ther moplasti c with good heat resista nce, surface finis h, and chemical resis tance. The extrusio n speed is 10mm/s. Fig 3. 1. Au dio se nsor and a cce lero meter rec ord ing da ta si mul taneo usl y , with spec tra l visual iza tion of audio signal and graphi ng of accele rom ete r data. DATA VALUE EXTRUDER TEMPERATURE MATERIAL TYP E ABS – R LAYER THICK NESS 0.2mm NOZZLE DIAMETER 0.4mm PRINT TYPE 2 INCH SQUARE Table 1. 0. Par ameters of pri nter for t he expe riment al setu p. Typical extrusion is achieved by main taining the nozzle temper ature within the designated temperature range for PLA during 3D printing. The obstructed and par tially obstructed states were cr eated by reducing the nozz le temperature. Th e runou t state per tains to the excess material that flows ou t of the nozzle after extrusion has ceased. Th e loading state pertain s to the insertion of the filament in to the 3D printer before extrusion. Liu et al. [5] iden tified f ive machine states dur ing their research on the a coustic emission mo nitoring of FDM mach ine operation, wh ich are listed in T able 2. 0. The normal state, as indicate d, pertains to the con tinuous extrusio n of th e filament. The semi - blocked state r efers to abnormal extrusion, wh ere incomplete mater ial is extruded throug h the nozzle. The blocked state arises when the no zzle is clog ged and no material is extruded. The runout state per tains to th e flo w of molten material through the nozzle after 3D printing has ceased. Loading refers to the filament in sertion be fore the commencem ent of a print. Table 2.0. Summar y of the e xperimental conditions of Liu et al. In anot her experi ment, a mini audio sensor produced by sparkfun electronics was utilized as the audio sensor, with a frequenc y response range of 50 Hz to 1 6 kHz. A 4 0 d B gain was chosen for the ampli fier, and hot glue was u sed to attac h the sensor to the 3D printer ’s extruder body being studied . According to initial investigati ons, the sig nal f requ encies were below 1 kHz, and hence, a samplin g rate of 5 kHz was considere d sufficient. The obtained signa ls were filtered using a band-pass filt er from 1 to 2499 Hz. These positions were identifie d as the most convenie nt mounting points for placing the senso r close to the nozzles, taki ng into account the sens or's siz e. IV. O BSERVATI ONS As a b aseline signal, only op erating Y m otor at a constant speed, Th e Y Axis stepper motor under l oad conditions generate Fundamental frequency @ 381 Hz and harmonics at multiple frequencies. See Fig 4 .1 . Fig. 4.1. A snapshot from Spectroid shows frequency visualizati on for Y motor. During continuous printing t he recorded frequency of audio signal changes abruptly because of th e print head movemen t, this ca n be seen from the spectr ogram below in Fig 4 .2 . The accelero meter readings show n in Fig 4.3. indicate that the vibration at extru der is at its peak during zigzag motion of normal operation . ` Fig. 4.2. S pectr ogr am sh ows fre quen cy cha nge be twe en 100 and 1000 Hz. Fig. 4.3. Th e Acc eler om eter gr aph s hows ext rude r m oveme nt pat terns . The recorded frequency changes during continuous printing can b e attributed to the mov ement of the prin t head. In th is scenario, high amplitude spikes in f requency were observed, ranging fro m 100 to 1000Hz. These spik es suggest the p resence of multiple frequen cy componen ts within th e signal. The abrupt changes in frequency are likely a result of the dynamic nature o f the prin ting process. As the print head moves, it intr oduces variations in the signal that manifest as spikes in the frequency domain. The range of 100 to 1000Hz indicates a broad spectru m of frequencies, making it ch allenging to distinguish between the individu al sounds orig inating fro m differ ent parts of the printer machinery. The c omplexity of the s ignal, with its multiple frequency components, implies th at various mechanical co mponents within the printer contrib ute to the overall acoustic profile. E ach compo nent, such as g ears, motors, or other m oving parts, may generate distinct frequency signatures. The ov erlap of th ese frequencies during continuo us pr inting creates a composite signal that is difficult to d econvolve. To better understand and analyze the acoustic characteristics of th e printer machinery, it may be necessary to employ advance d signal processing techniques. Additionally, monitoring the signal over time and correlating frequency changes with specific printer actions or mo vements may p rovide insights in to the sou rce of ea ch frequency component. The identi fied phenomenon persisted wh en an audio sensor was attached to the extrude r body. This implies that the overlappin g frequencies , ranging from 100 to 1000Hz, continue to pose challe nges in isolating and focusin g on specific sounds associate d with the extrusio n process. The extruder, being a critica l component of a 3D printer responsib le for material deposi tion, contri butes its own set of acoustic signals, which, when mixed with other printer machinery sounds, creates a co mplex a udio pr ofile. In such scenarios whe re distin guishi ng b etwee n individ ual sounds becomes intri cate due to overl apping frequenci es, the applicatio n of machine learning algorithm s emerges as a promising solution[21]. These algorit hms have shown effica cy in correlati ng frequenc y changes with specific acti ons or events , even in noisy environments[2 2] . By leveragi ng mac hine learni ng, it ma y be possible to trai n models that can identif y and isolate the extrusion sound amidst t he caco phony o f other printe r-relate d noises. There is precede nt for the applicat ion of deep learni ng algorith ms in fault detectio n using acousti c signals. For instance, in a study involving an air compress or [ 20 ], deep learning techniq ues were employed to detect faults based on acoustic signals . This sugges ts that simil ar meth odol ogies could be adapted for 3D printe r faul t detec tion. V. C ONCLUSI ONS In this study, an analy sis of accelerometer and audio sensor data was co nducted on a Fused Deposition Modelin g (FDM) based 3D printer . The findings indicate that both acoustic and vibration data carry valuable information f or detecting faults. Notably, the vibration reaches its peak during the printer's zigzag motion, which cou ld potentially lead to m echanical faults in the long term. Monito ring vibration d ata proves to be an effective meth od for early detection of faults. The acoustic sign atures produced by th e 3D printer exhibit a complex ov erlap of various frequency pattern s, making manual analysis challengin g. However, there is significant potential in leveragin g machine learning techniques to analyze these frequency patterns for faul t detection purposes. Applying m achine learning algorithms can enh ance the efficiency of fault detection by automatically identifying and interpreting p atterns within the acoustic d ata, thereby providing a more advanced and reliable m ethod for identifying potential iss ues in the 3 D printing proce ss. A CKNOWLEDGMENT We express our sincere gratitude to the SPADAL Lab for grantin g us the v alu able opportunit y to conduct our research work. Ad ditionall y, we extend our ap preciat ion to Honeywell and ASTERI X for their generous fundi ng support. Their contributi ons have pla yed a cr ucial role i n making our research endeavo rs possible, and we are truly thankful for their commi tment to advancing knowle dge and innovati on. R EFERENCES [1] Tlegenov Y, Hong GS, L u WF (2018) Nozzle condition moni toring in 3D p r inting. Robot Comput I ntegr Manuf 54:45 – 55. https:// doi. org/ 10. 1016/j. rcim. 2018. 05. 01 0 [2] Guo J, Li X, Liu Z, Zhang S, Wu J, Li C , Long J (2021) A novel doublet extreme learning ma chines for De lta 3D printer fault diagnosis using attitude sensor. ISA Trans 109:327 – 339. h ttps:/ / doi.org/ 10. 101 6/j. isatra. 20 20. 10. 024 [3] Khan MF, Alam A, Siddique MA, Alam M S, Rafat Y, Sali k N, Al - Saidan I (2020) Real-time defect detection i n 3D printing using machine learning. Mater Today Proc 42:521 – 528. https:/ / doi. org/10. 1016/j. matpr. 2 020. 10. 48 2 [4] Giri J, Shahane P, Jachak S, C hadge R, Giri P (20 21) Optimization of FDM process parameters for dual extruder 3d printer using artificial neural network. Mater Today Proc 43:3242 – 3249. https ://doi. org/ 10. 1016/j. matpr. 2 021. 01. 89 9 [5] Liu J, Hu Y, Wu B, Wang Y (2018) An impr oved fault diagnosis approach for FDM process with acoustic emission. J Manuf Process35:570 – 57 9. https :// doi. org/ 10. 1016/j. jmapro. 2018. 08. 038 [6] Lambos N, Vosniakos GC, Papazetis G (2020) Low -cost automatic identification of nozzle clogging in material extrusi on 3D printers. Procedia Manuf 51:274 – 279. h ttps:// doi. org/ 10. 1016/j.promfg. 2020. 10. 0397. [7] Yao T, Ouyang H, Dai S, Deng Z, Zhang K (2021) Effects of manufacturing m icro-structure on vibr ation of FFF 3D printin g plates: material characterisation, numerical analysis and experimental study. Compos Struct 268:113970. https:// doi. org/ 10.1016/j. comps truct. 2021. 113970 [8] Y. Zhao, Y. Z hang, and W. Wa ng, “Researc h on conditi on monitoring of FDM equipment b ased on LSTM,” 2021 IEEE I nternational Conference on Advances in Electrical Engineering and Computer Applications (A EECA), 2021 . [9] Y. Fu, A. Downey, L. Yuan, A. P ratt, and Y. Balogu n, “In situ monitoring for fus ed Filament Fabric ation P rocess: A R eview,” Additive Manuf acturing , vol. 3 8, p. 101749, 202 1. [10] Michael E. Mackay, Zachary R. Swain, Colby R. Banbury, David D. Phan, Davi d A. Edwards, The performance of the hot end in a plasticating 3d pr inter, J. R heol. 61 (2) (2017) 229 – 236. [11] Wang, L.; Gao, R. Condition monitoring and control for intelligent manufacturing. Spr inger Ser. A dv. Man uf.2006, 205, 1 – 399 [12] Y. Li, W. Zhao, Q. Li, T. Wang, and G. Wang, “In -situ monitoring and diagnosing for fused filame nt fabrication process b ased on vibration sensors ,” Sensors , vol. 19, no. 11, p. 2589, 2019. [13] Dron, J.P.; Bolaers, F.; Rasolofond raibe, L. Improveme nt of the sensitivity of the scalar indicators (crest factor,kurtosis) using a de - noising metho d by spectral subtraction: Applicat ion to the detection of defects in bal lbearings. J. S ound. Vib. 20 04, 270, 61 – 73 [14] Y. Yao, H. Wang, S. Li, Z. Liu, G. Gui, Y. Dan, and J. Hu, “End - to - end convol utional n eural n etwor k model for gear fault diagnosis based on so und si gnals,” Applie d Sciences , vol. 8, no. 9, p. 1584, 2018. [15] E. Prianto and H. Sigit Pramono, “IOT -based 3D printer d evelopm ent for Student Competence Impro vement,” Journal of Physics: Conference Se ries , vol. 2111, no. 1 , p. 012002, 2021. doi:10.1088/174 2-6596/2111/1/ 012002 [16] Y. Fu, A. Downey, L. Yuan, A. P ratt, and Y. Balogu n, “In situ monitoring for fus ed Filament Fabric ation P rocess: A R eview,” Additive Manufacturi ng , vol. 38, p. 101749, 2021. doi:10.1016/j.ad dma.2020.1017 49 [17] E. Prianto and H. Sigit Pramono, “IOT -based 3D printer d evelopm ent for Student Competence Impro vement,” Journal of Physics: Conference Se ries , vol. 2111, no. 1 , p. 012002, 2021. doi:10.1088/174 2-6596/2111/1/ 012002 [18] M. Kreme netsky, “ASTM Internatio nal R eleases Report on in -situ monitoring for 3D printing - 3dprint.com: The Voice of 3D printing / additive manufacturing, ” 3DPrint.com | The Voice of 3D Printing / Additive Manufacturing, https://3dprint.com/30 0893/astm- international-releas es-report- on - in -situ-monitoring-for- 3d -pri nting/ (accessed Jan. 1 5, 2024). [19] H. Parker, S. Ps ulkowski, P. Tran, and T. D ickens, “In -situ print characterizati on and defect monitoring of 3D printing via conductive filament and O hm’s Law,” Proc edia Manuf acturing , vol. 53, pp. 417 – 426, 2021. doi:1 0.1016/j.promf g.2021 .06.044 [20] In -situ monitoring of additive manufacturing using ... - scholarly commons, https://commons .erau.edu/c gi/viewconten t.cgi?article=1 655&context =edt (accessed J an. 15, 202 4). [21] A. Hassan and S. Bernadin, "A Comprehensive Analys is of Speech Depression Recognition Systems," in S outheast Con 2024 (SoutheastCon 2 024), Atlant a, USA, Mar. 15, 2024, pp. 9.76. [22] S. Shahid and A. Hassan, "Internet of Things -Ena bled Vessel Monitoring System for Enhance d Maritime Safet y and Tracking a t Sea," in Southe astCon 2024 (SoutheastCon 2024), Atlanta, USA, Mar. 15, 2024, pp. 8.24.
Original Paper
Loading high-quality paper...
Comments & Academic Discussion
Loading comments...
Leave a Comment