Deep description of static and dynamic network ties in Honduran villages
We examine static and dynamic social network structure in 176 villages within the Copan Department of Honduras across two data waves (2016, 2019), using detailed data on multiplex networks for 20,232 individuals enrolled in a longitudinal survey. The…
Authors: Marios Papamichalis, Nikolaos Nakis, Nicholas A. Christakis
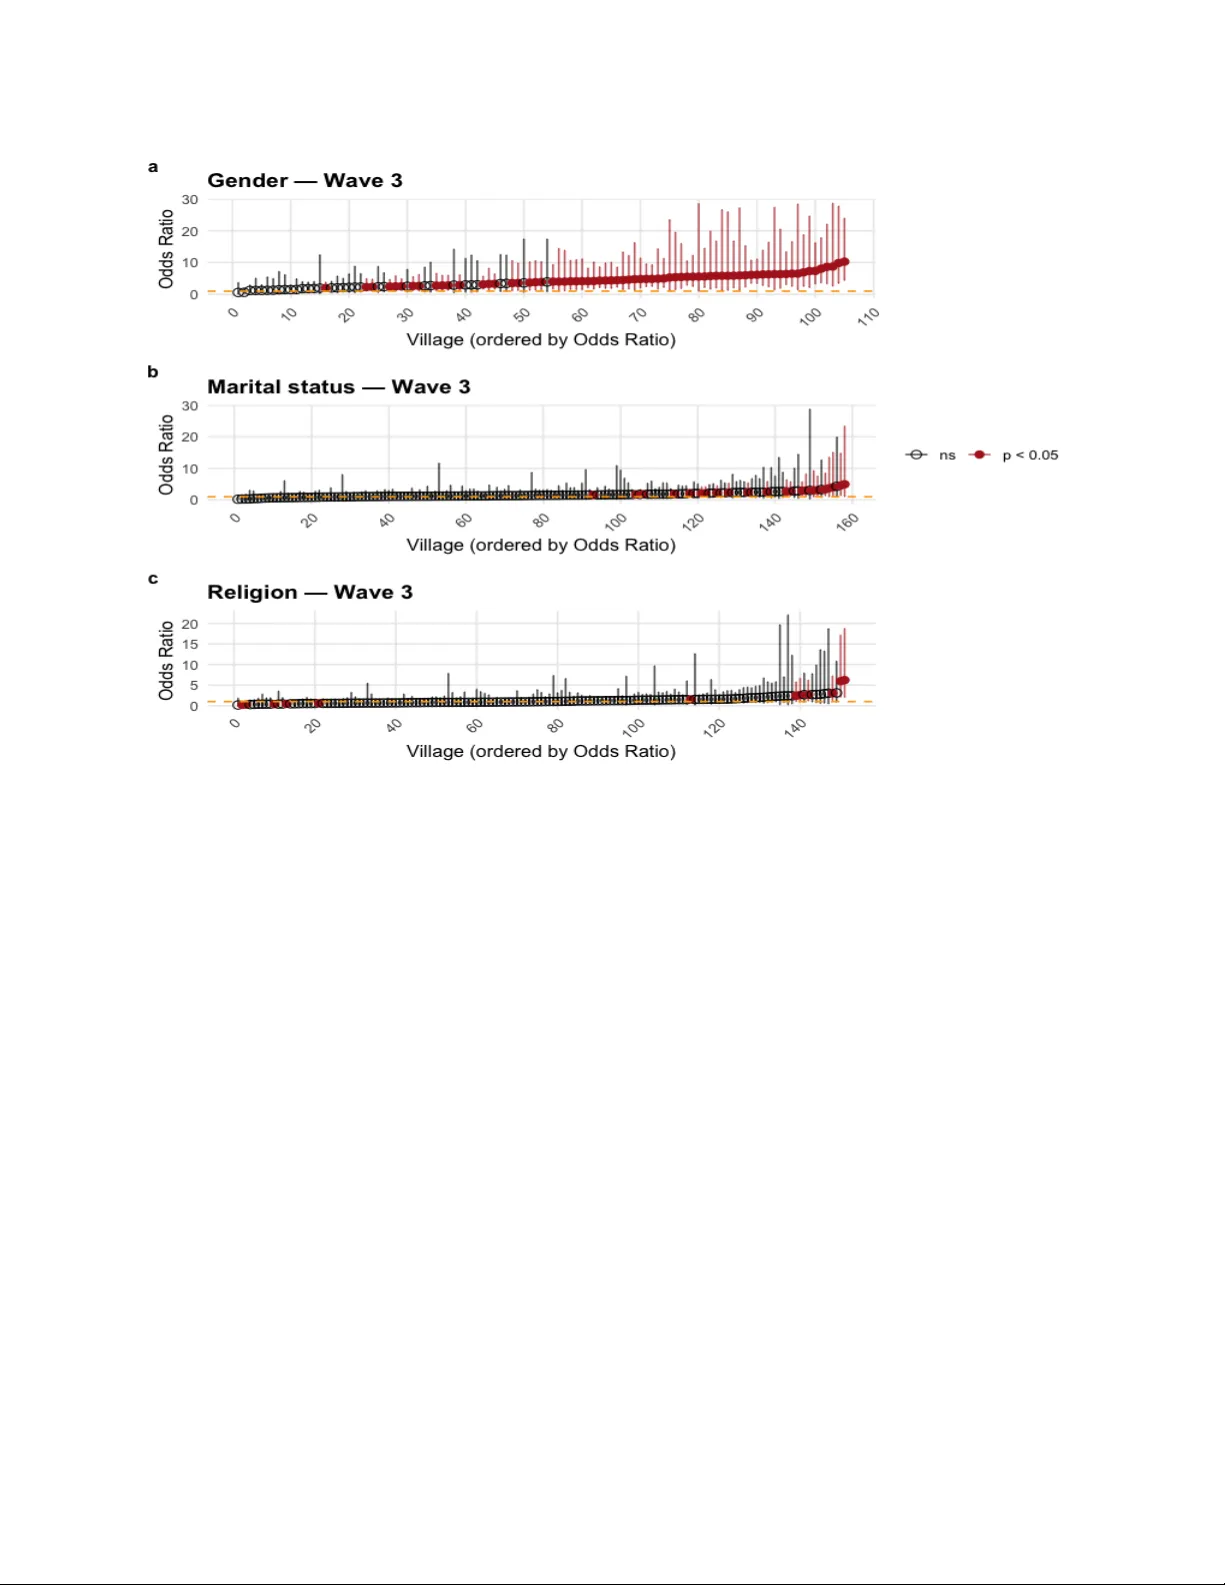
Deep description of static and dynamic net w ork ties in Honduran villages Marios P apamichalis 1 , Nik olaos Nakis 1 , and Nic holas A. Christakis 1,2,3 1 Human Nature Lab, Y ale Univ ersity 2 Departmen t of Statistics and Data Science, Y ale Universit y 3 Departmen t of So ciology , Y ale Univ ersity marios.papamichalis@yale.edu ; nicolaos.nakis@gmail.com ; nicholas.christakis@yale.edu Abstract W e examine static and dynamic so cial netw ork structure in 176 villages within the Copán Department of Honduras across tw o data wa ves (2016, 2019), using detailed data on multiplex net works for 20,232 individuals enrolled in a longitudinal survey . These netw orks capture friendship, health advice, financial help, and adversarial relationships, allowing us to show how co op eration and conflict join tly shap e social structure. Using node-level net work measures derived from near-census so cio centric village net works, we leverage mixed-effects zero-inflated negativ e binomial mo dels to assess the influence of individual attributes, such as gender, marital status, education, religion, and indigenous status, and of village characteristics, on the dynamics of social net works ov er time. W e complemen t these node-level mo dels with dyadic assortativit y (o dds-ratio-based homophily) and communit y-level measures to describ e ho w sorting by key attributes differs across netw ork t yp es and b etw een wa ves. Our results demonstrate significan t assortativit y based on gender and religion, particularly within health and financial net works. A cross netw orks, gender and religion exhibit the most consistent assortativ e mixing. A dditionally , comm unity-lev el assortativity metrics indicate that educational and financial factors increasingly influence social ties ov er time. Our findings pro vide insigh ts in to ho w p ersonal attributes and comm unity dynamics in teract to shap e netw ork formation and so cio-economic relationships in rural settings o ver time. 1 In tro duction So cial netw orks shap e individual b ehaviors, access to resources, and ov erall well-being ( Smith and Christakis , 2008 ). They are asso ciated with information flow, distribution of supp ort, and the main tenance of so cial norms within comm unities. In vestigating the factors that determine the formation and maintenance of so cial netw orks sheds light on how comm unities are b ound together. This understanding is particularly vital in rural settings, where resources are often scarce, and so cial ties significan tly impact individuals’ access to supp ort and opp ortunities. Here, we in vestigate the determinants of health, friendship, financial, and adversarial relationships among 20,232 individuals in 176 rural Honduran villages. By fo cusing on these diverse t yp es of relationships, we aim to capture a holistic view of so cial netw ork dynamics within these comm unities. Health advice relationships are crucial for understanding ho w individuals seek and provide care, while friendship ties reveal patterns of so cial supp ort and companionship. Financial relationships shed ligh t on economic exchanges and resource sharing. A dversarial relationships highlight conflict and so cial tensions. By examining these relationships, we iden tify the so cio-economic and demographic factors that are asso ciated with netw ork formation and maintenance. Village so cial life in lo w - infrastructure settings is multiplex: the same households exchange health advice, friendship, and financial help while also experiencing conflict. These ties shap e ho w information mo ves, who receives supp ort, and where disputes arise. Decades of work show that netw ork structure can b e lev eraged to deliver programs and trace behavior change, from microfinance diffusion to health messaging and p eer - influence exp eriments ( Christakis and F o wler , 2010 ; Banerjee et al. , 2013 ; Centola , 2010 , 2011 ; Kim et al. , 2015 ; Hunter et al. , 2015 ). A t the same time, homophily and communit y structure can segmen t populations and limit reac h. In single - la yer village 1 net works, comm unities are often “connected yet segregated,” with sharp alignment to so cial attributes suc h as caste or sex ( Montes et al. , 2018 ; Ghasemian and Christakis , 2024 ). More sp ecifically , empirical analyses of rural village netw orks across the Global South reveal dense, highly clustered structures that are nonetheless segregated along so cial lines, with substantial heterogeneit y in individual p ositions and tie t yp es that shap es diffusion and program reach Perkins et al. ( 2015 ). In 75 Karnataka villages, net works aggregated from 12 relationship t yp es featured large connected comp onents (typically ∼ 98% of nodes) and high clustering ( ∼ 0 . 6 ), y et strong dyad-lev el assortativity b y caste (significant in 98% of villages; same-caste tie o dds ratios ≈ 1 . 1 –18.6) and by sex, and comm unity partitions that aligned most with caste (normalized mutual information ≈ 0 . 39 ), while sex explained little of mo dular structure; ( Mon tes et al. , 2018 ). These patterns confirm homophily and triadic closure as organizing mec hanisms in rural net works and help explain wh y diffusion often pro ceeds within identit y-defined mo dules unless bridges are present ( Newman , 2003 ; Henry et al. , 2011 ; F ortunato , 2010 ; Blondel et al. , 2008 ). Related empirical work sho ws that netw ork structure, rather than geography or simple demographics, predicts spread of innov ations and b ehaviors in villages: microfinance participation in India follo wed netw ork paths and w as an ticipated by cen trality-based measures ( Banerjee et al. , 2013 ); exp erimental and field studies demonstrate that homophily and clustered top ology mo dulate adoption dynamics ( Centola , 2010 , 2011 ), and that netw ork-informed targeting, e.g., seeding nominated friends to exploit the friendship parado x, can outp erform naiv e strategies in increasing p opulation-level uptak e ( Kim et al. , 2015 ; Hun ter et al. , 2015 ; Airoldi and Christakis , 2024 ). Bey ond single-la yer representations, the literature emphasizes m ultiplexity , distinct la yers such as kinship, advice, and resource exchange that are not redundant and can differentially mediate con tagion, implying that aggregating ties may obscure critical pathw ays for asso ciation ( Porter et al. , 2009 ; Kumpula et al. , 2007 ; Airoldi and Christakis , 2024 ). A t the same time, iden tity-based segregation (e.g., caste, religion, gender) and traditional institutions shap e access to information and opp ortunity , generating village-to-village and within-village heterogeneit y in net work roles (h ubs, brok ers) and exp osure to external ideas ( Munshi and Rosenzweig , 2006 ; Sany al , 2015 ; Berreman , 1972 ; Patil , 2014 ). Metho dologically , studies hav e leveraged a comm unity detection and modularity ( Girv an and Newman , 2002 ; F ortunato , 2010 ; Blondel et al. , 2008 ), assortativit y metrics ( Newman , 2003 ; Noldus and V an Mieghem , 2015 ), and statistical net work models ( Hoff et al. , 2002 ; W ang and W ong , 1987 ; Robins et al. , 2007 ), while design-oriented work has highligh ted that ignoring homophily can bias seeding ev aluations and that connectivity-informed designs can strengthen cluster-randomized trials ( Aral et al. , 2013 ; Harling et al. , 2017 ). T aken together, the evidence indicates that rural netw orks are cohesiv e yet partitioned; interv en tions should therefore seed multiple comm unities, engage both h ubs and brok ers, and use lay er-appropriate channels to tra verse homophilous b oundaries and achiev e equitable diffusion ( Mon tes et al. , 2018 ; Banerjee et al. , 2013 ; Kim et al. , 2015 ). Y et, despite this foundation, we lack an in tegrated accoun t of multiplex rural structure that (i) quantifies how co op erative la yers, friendship , financial help , and he alth advic e , couple at the p erson and place lev els, and (ii) p ositions negativ e ties within that co op erative scaffold. W e address these gaps using a tw o - w av e, near - census m ultiplex of V = 176 Honduran villages (2016, 2019), measuring four undirected lay ers p er village: he alth , friendship , financial , and adversarial . Our empirical framework spans nodes, dy ads, comm unities, and villages. W e estimate multiv ariate mixed mo dels for degree (with village/wa ve heterogeneit y and a Mundlak decomposition); test assortativit y with degree - a ware lab el p ermutations; and detect communities on the p ositive union and relate them to attributes using normalized mutual information (NMI) and within-village regularized multinomial models. Sev eral robust regularities emerge. First , co op erative la yers co - mo ve strongly at b oth the village and individual lev els y et sho w little dy adic redundancy: places dense in friendship are also dense in health and financial help, but the same pairs seldom carry more than one coop erative tie. Se c ond , Schooling and age are asso ciated with more co op erative and fewer adv ersarial ties; men concentrate in financial exc hange while women anchor friendship/health; marriage broadens engagemen t; income sufficiency shifts ties to ward financial help and low ers conflict; ma jor religious denominations show mild co op erative adv an tages; indigenous iden tity is linked to slightly higher degrees across la yers; and place correlates are weak on a verage. Thir d , assortativity and de gr e e - awar e p ermutations show perv asive 2 same - gender and same - religion mixing across co op erative la yers (with little cross - gender dissortativity), while other attributes (age, education, income, indigenous status) are mo dest and heterogeneous once degree is con trolled. F ourth , multiplex comm unities hav e mo derate–to–high mo dularity and align most closely with friendship; single attributes con vey limited information ab out communit y lab els, though gender, age, marital status, and education remain predictive in within - village multinomial fits. In sum, we offer a unified p ortrait of rural multiplex structure that links segregation, cross - la yer coupling, and metho dologically , w e combine m ultiv ariate GLMMs, degree - a ware n ulls and signed-net work diagnostics. The pap er is organized as follo ws. Section 2 details the setting, measurement, four la yers (friendship, financial, health, adversarial), cov ariates, and the construction of the p ositive union and signed netw orks, and rep orts descriptive net work c haracteristics by la yer. Section 3 cov ers: village/individual co - mo vemen t vs dyadic o verlap; the traits of individuals who ha ve more connections in b oth co op erative and conflict la yers, with village/respondent heterogeneit y and a Mundlak decomp osition; dyad - lev el assortativit y with degree - a ware p ermutation tests; communities and their alignmen t with attributes. Section 4 concludes. 2 Data This study w as conducted in the Copan Department of Honduras, cov ering a geographic area of o ver 200 square miles. W e b egan with 176 villages with 32,800 health-related eligible participants, of whic h 93% ( N =30,422) consented to b e included in our census. F rom this p opulation, we enrolled n = 20 , 232 individuals for participation in the t wo w av es used in the present study (labeled wa ve 1 and w av e 3). These participan ts expressed willingness to participate in surveys, undergo randomization, and engage in a p otential 22-month interv ention. They also committed to ongoing participation in annual or biann ual surveys. Due to the geographic isolation of the Copan villages, so cial netw orks w ere primarily intra village. T o capture the complexity of these net works, w e used publicly a v ailable softw are, detailed in Lungean u et al. ( 2021 ), which facilitated the mapping of these intricate so cial connections. T able 1 presents the questionnaire items (“name generators”) used to construct four distinct so cial net works, health, financial, friendship, and adv ersarial, based on self-rep orted in terp ersonal connections. All netw orks are undirected, with at most one edge b etw een an y pair of no des, derived from directed surv ey responses (b y symmetrizing nominations). T able 2 summarizes the individual- and village-lev el v ariables used throughout the analyses. F urther details regarding the statistical analysis of eac h c haracteristic and additional data related information are presented in the App endix C . Connection User Health Who would y ou ask for advice ab out health-related matters? Health Who comes to you for health advice? F riendship Who do you trust to talk to ab out something p ersonal or priv ate? F riendship With whom do you spend free time? F riendship Besides your partner, paren ts, or siblings, who do y ou consider to b e y our closest friends? Financial Who would y ou feel comfortable asking to b orrow 200 lempiras from if y ou needed them for the day? Financial Who do you think w ould b e comfortable asking y ou to b orrow 200 lempiras for the day? A dversarial Who are the p eople in this village with whom you do not get along w ell? T able 1: Questionnaire with Connection T yp e (“Name Generators”) 3 T able 2: V ariables used in the analyses. Category V ariables Individual Gender; Age; Education (y ears); Marital status; Religion; Income sufficiency (self-rep orted); Indigenous identit y Village / spatial Village size (survey ed adults); T rav el time to health cen ter; T rav el time to main road; T rav el time to maternity clinic; Household geo co ordinates (for pairwise distances) Net works (p er village, p er wa v e) F our undirected lay ers: F riendship, Financial, Health, Adv ersarial; Net work c haracteristics by la yer F riendship netw orks W e summarize the structure of the friendship lay er in T able 3 . Across w av es, netw orks are mo derate in size (median N = 80 ; range 16–370) and relatively dense for village so cial netw orks (median δ ≈ 0 . 06 in W a ve 1 and 0 . 058 in W av e 3) with noticeable clustering (median ⟨ C ⟩ = 0 . 29 and 0 . 32 , resp ectively). F ragmen tation is limited (median of 5 vs. 6 comp onen ts). F or analysis we focus on the largest connected comp onents (LCCs), whic h contain a median of 95% (W av e 1) and 94% (W a ve 3) of nodes and essentially all ties (median m/ M = 100% in b oth wa ves). Median mean degree in the LCC is very close to that of the full netw ork (ab out +4% in W a ve 1 and +6% in W a ve 3), and median clustering is virtually unchanged, mirroring the pattern highlighted b y Montes et al. ( 2018 ). T able 3: F riendship la yer (W a ve 1 and W av e 3): characteristics of full netw orks and LCCs. W av e 1 W av e 3 Netw orks LCC Net works LCC Metric Min Med Max Min Med Max Min Med Max Min Med Max N 16 80 370 15 75 359 16 80 370 15 74 358 M 23 202 1066 23 202 1065 34 180 805 34 180 802 δ 0.011 0.062 0.206 0.013 0.071 0.219 0.011 0.058 0.283 0.012 0.065 0.324 ⟨ k ⟩ 2.17 5.02 9.30 2.57 5.22 9.41 2.11 4.53 7.31 2.64 4.79 7.46 ⟨ C ⟩ 0.13 0.29 0.47 0.13 0.29 0.47 0.20 0.32 0.56 0.20 0.32 0.56 Components 1 5 24 1 1 1 1 6 37 1 1 1 n/ N – – – 81% 95% 100% – – – 50% 94% 100% m/ M – – – 97% 100% 100% – – – 65% 100% 100% Notes: N = num b er of nodes; M = num b er of edges; δ = edge density; ⟨ k ⟩ = mean degree; ⟨ C ⟩ = mean clustering coefficient; Comp onents = num b er of connected comp onents. LCC = largest connected comp onent; n/ N and m/ M are the fractions of no des and edges con tained in the LCC. Health net works T able 4 rep orts results for the health lay er. Median degree and densit y are low er than in friendship (W a ve 1: ⟨ k ⟩ = 2 . 82 , δ = 0 . 035 ; W a ve 3: ⟨ k ⟩ = 2 . 45 , δ = 0 . 030 ), and net works are more fragmente d (median of 11 and 13 comp onen ts). The LCCs capture a median of 86% (W a ve 1) and 80% (W a ve 3) of no des and 99% and 96% of ties, resp ectively . As expected, LCC densities are higher, and median mean degree in the LCC exceeds that of the full netw ork b y roughly 16% (W av e 1) and 19% (W a ve 3), while median clustering remains essentially unchanged (within ∼ 2% ). 4 T able 4: Health lay er (W a ve 1 and W av e 3): characteristics of full net works and LCCs. W av e 1 W av e 3 Netw orks LCC Netw orks LCC Metric Min Med Max Min Med Max Min Med Max Min Med Max N 16 80 370 10 64 284 16 80 370 7 59 307 M 18 115 536 14 113 504 13 98 456 6 92 429 δ 0.006 0.035 0.150 0.009 0.051 0.356 0.006 0.030 0.108 0.009 0.051 0.286 ⟨ k ⟩ 1.09 2.82 6.77 2.00 3.26 6.85 0.88 2.45 4.73 1.71 2.90 4.94 ⟨ C ⟩ 0.00 0.29 0.65 0.00 0.29 0.63 0.04 0.29 0.50 0.00 0.29 0.49 Components 1 11 91 1 1 1 2 13 101 1 1 1 n/ N – – – 29% 86% 100% – – – 19% 80% 97% m/ M – – – 42% 99% 100% – – – 32% 96% 100% Notes: N = num b er of nodes; M = num b er of edges; δ = edge density; ⟨ k ⟩ = mean degree; ⟨ C ⟩ = mean clustering coefficient; Comp onents = num b er of connected comp onents. LCC = largest connected comp onent; n/ N and m/ M are the fractions of no des and edges con tained in the LCC. Financial net works As shown in T able 5 , the financial lay er exhibits lo w degree and mo dest clustering (median ⟨ k ⟩ = 2 . 41 and 2 . 26 ; median ⟨ C ⟩ = 0 . 23 and 0 . 24 in W a ves 1 and 3, resp ectiv ely), with substantial fragmen tation (median 15 and 16 comp onen ts). The LCC con tains a median of 79% (W av e 1) and 75% (W av e 3) of no des and 96% and 95% of ties. Relativ e to the full net works, LCC median degree is higher by ab out 19% (W a v e 1) and 28% (W av e 3), while median clustering remains within a few p ercen t. T able 5: Financial lay er (W a ve 1 and W av e 3): characteristics of full net works and LCCs. W av e 1 W av e 3 Netw orks LCC Netw orks LCC Metric Min Med Max Min Med Max Min Med Max Min Med Max N 16 80 368 7 60 304 16 80 368 5 55 284 M 12 97 497 8 92 491 11 92 457 4 84 414 δ 0.005 0.030 0.117 0.011 0.057 0.381 0.006 0.029 0.109 0.010 0.056 0.500 ⟨ k ⟩ 1.00 2.41 5.90 1.88 2.88 6.20 0.74 2.26 4.73 1.60 2.88 5.04 ⟨ C ⟩ 0.00 0.23 0.44 0.00 0.23 0.45 0.00 0.24 0.61 0.00 0.23 0.58 Components 2 15 96 1 1 1 2 16 97 1 1 1 n/ N – – – 13% 79% 98% – – – 9% 75% 98% m/ M – – – 25% 96% 100% – – – 21% 95% 100% Notes: N = num b er of nodes; M = num b er of edges; δ = edge density; ⟨ k ⟩ = mean degree; ⟨ C ⟩ = mean clustering coefficient; Comp onents = num b er of connected comp onents. LCC = largest connected comp onent; n/ N and m/ M are the fractions of no des and edges con tained in the LCC. A dversarial net works Finally , T able 6 shows the adv ersarial lay er, whic h is the sparsest and most fragmented. Median degree is below one (W a ve 1: ⟨ k ⟩ = 0 . 88 ; W a ve 3: 0 . 53 ), with extremely low densities (W a ve 1 min δ ≈ 4 . 17 × 10 − 4 ). Net works comprise many components (medians 45 and 59). The LCCs contain a relativ ely small share of no des, a median of 24 % (W av e 1) and 13% (W av e 3), and of ties ( 67% and 50% ). Because the LCC is, b y construction, connected, its median degree is substan tially higher than the net work median (roughly 2 . 4 × in W av e 1 and 3 . 6 × in W av e 3), while median clustering remains zero. 5 T able 6: Adv ersarial lay er (W a ve 1 and W av e 3): characteristics of full net works and LCCs. W av e 1 W av e 3 Netw orks LCC Net works LCC Metric Min Med Max Min Med Max Min Med Max Min Med Max N 16 77 365 2 21 166 16 77 365 2 10 87 M 2 36 226 1 22 220 1 21 119 1 10 99 δ 4 . 17 × 10 − 4 0.011 0.067 0.016 0.108 1.000 5 . 23 × 10 − 4 0.006 0.034 0.026 0.222 1.000 ⟨ k ⟩ 0.06 0.88 2.53 1.00 2.08 3.21 0.07 0.53 1.81 1.00 1.89 2.75 ⟨ C ⟩ 0.00 0.00 0.56 0.00 0.00 0.58 0.00 0.00 0.43 0.00 0.00 0.70 Components 8 45 268 1 1 1 15 59 288 1 1 1 n/ N – – – 2% 24% 81% – – – 2% 13% 72% m/ M – – – 13% 67% 100% – – – 9% 50% 100% Notes: N = num b er of nodes; M = num b er of edges; δ = edge density; ⟨ k ⟩ = mean degree; ⟨ C ⟩ = mean clustering coefficient; Comp onents = num b er of connected comp onents. LCC = largest connected comp onent; n/ N and m/ M are the fractions of no des and edges con tained in the LCC. Cross-la yer comparison A cross lay ers and wa v es, net work cohesion declines monotonically from friendship to he alth to financial to adversarial . Median edge density is highest in friendship (W av e 1: δ = 0 . 062 ; W av e 3: δ = 0 . 058 ) with substantial clustering ( ⟨ C ⟩ ≈ 0 . 29 / 0 . 32 ) and mild fragmen tation (median comp onen ts = 5 / 6 ); the LCC captures almost the entire net work (median n/ N = 95 . 1% / 94 . 4% , m/ M = 100% / 100% ). Health and financial la yers are sparser and more fragmented (health: δ ≈ 0 . 035 / 0 . 030 , comp onents = 11 / 13 ; financial: δ ≈ 0 . 0295 / 0 . 0289 , comp onents = 15 / 16 ), but their LCCs still contain the large ma jority of nodes and nearly all ties (health: n/ N = 85 . 9% / 79 . 6% , m/ M = 98 . 8% / 96 . 2% ; financial: n/ N = 79 . 4% / 75 . 0% , m/ M = 96 . 4% / 94 . 7% ). In adversarial netw orks, by con trast, densit y and clustering are minimal ( δ ≈ 0 . 011 / 0 . 006 ; ⟨ C ⟩ = 0 ), fragmentation is extreme (comp onents = 45 / 59 ), and the LCC cov ers only a small fraction of no des and ties (median n/ N = 23 . 8% / 12 . 6% , m/ M = 66 . 7% / 50 . 0% ). Consistently across la yers, the LCC median mean degree exceeds the full-netw ork median, slightly in friendship ( +4% to +6% ), mo destly in health ( +16% to +19% ) and financial ( +19% to +28% ), and dramatically in adversarial ( +136% to +258% ), while median clustering changes little betw een full netw orks and LCCs. 3 Empirical Results 3.1 Co op erativ e lay ers co-mov e but are not redundan t A t the village level, the three co op erative lay ers co-mov e strongly . Using village random intercepts from the m ultiv ariate degree model in Eq. ( 1 ) , we find high cross-la yer correlations in b oth wa ves (t ypically r ≈ 0 . 86 – 0 . 92 ), indicating that places with dense friendship net works also tend to ha ve dense health and financial help net works. The left panel of Fig. 1 summarizes these correlations by w av e. A t the dyad lev el, co op erative ties are functionally sp ecialized rather than fully redundant. Jaccard ov erlaps b et ween pairs of coop erativ e la yers are mo dest in b oth wa ves, t ypically in the 0 . 20 – 0 . 40 range across villages (right panel of Fig. 1 ). Across villages, the median o verlap is about 0 . 27 for F riendship–Financial, 0 . 29 for F riendship– Health, and 0 . 26 for Financial–Health (roughly 0 . 22 – 0 . 35 ), with only small shifts from W av e 1 to W av e 3. Thus, ev en in socially ric h places, richness does not arise from stac king m ultiple co op erative relations on the same pairs; instead, different co op erative functions are carried by partially o verlapping but distinct dyads. 6 Figure 1: Village - lev el coupling and dyad - lev el sp ecialization of co op erativ e la yers. L eft: Correlations among village random effects from the m ultiv ariate degree mo del (F riendship, Health, Financial), faceted b y wa ve (W1, W3). When random effects are unav ailable, the panel uses p er - village mean degree as a proxy (results are nearly identical). Right: Distribution of dyad - lev el o verlap (Jaccard index) b etw een pairs of co op erative la yers across villages, by w av e. Violin shap es show the across-village distribution; p oints mark medians. W e estimate ego-level ov erlap b etw een co op erative la yers—F riendship, Financial (F–Fin), F riendship–Health (F–H), and Financial–Health (Fin–H), using beta mixed mo dels with random intercepts for village and resp ondent and w eights prop ortional to the pairwise union size. F or each fo cal attribute, mo dels include the other six co v ariates and w av e fixed effects; the v alues b elow are adjusted marginal means a veraged across wa ves. Overlaps are mo dest in absolute size (across all mo dels, t ypically 0 . 10 – 0 . 28 ), consistent with functional specialization, but who reuses the same partners across functions v aries systematically: • Gender: W omen show more ov erlap than men, esp ecially where health is inv olved: F–H = 0 . 25 (women) vs. 0 . 16 (men; ∆ = +0 . 09 ), Fin–H = 0 . 16 vs. 0 . 10 ( ∆ = +0 . 06 ), and a small edge in F–Fin ( 0 . 21 vs. 0 . 20 ; ∆ = +0 . 01 ). T riple multiplexity: not estimable in the GLMM (no stable contrasts returned). • Age: Older resp ondents hav e more o verlap across all pairs: F–H = 0 . 28 (older) vs. 0 . 25 (y ounger; ∆ = +0 . 03 ), F–Fin = 0 . 26 vs. 0 . 24 ( ∆ = +0 . 03 ), Fin–H = 0 . 18 vs. 0 . 16 ( ∆ = +0 . 02 ). T riple multiplexity: J triple = 0 . 15 (older) vs. 0 . 13 (younger; ∆ = +0 . 02 ); Pr( an y triple ) = 0 . 48 vs. 0 . 33 (i.e., 48% vs. 33% ; ∆ ≈ +15 pp). • Education: Education raises ov erlap when money is inv olv ed, but not for F–H: F–Fin = 0 . 27 (educated) vs. 0 . 24 (non-educated; ∆ = +0 . 03 ); Fin–H = 0 . 18 vs. 0 . 17 ( ∆ = +0 . 01 ); F–H is sligh tly higher among the non-educated ( 0 . 26 ) than the educated ( 0 . 26 ; ∆ ≈ − 0 . 01 ). T riple multiplexity: J triple = 0 . 14 (educated) vs. 0 . 14 (non; ∆ ≈ +0 . 01 ); Pr( any triple ) = 0 . 43 vs. 0 . 38 ( +5 pp). • Income sufficiency: Those rep orting insufficien t income show sligh tly more ov erlap when health is inv olv ed: F–H = 0 . 26 (sufficient) vs. 0 . 28 (insufficient; ∆ ≈ − 0 . 02 when co ded sufficien t − insufficien t), Fin–H = 0 . 17 vs. 0 . 18 ( ∆ ≈ − 0 . 01 ), and essentially no gap in F–Fin ( 0 . 25 vs. 0 . 25 ). T riple multiplexity: J triple = 0 . 15 (sufficient) vs. 0 . 14 (insufficient; ∆ ≈ +0 . 00 ); Pr( any triple ) = 0 . 53 vs. 0 . 53 (no meaningful difference). • Marital status: Singles ov erlap slightly more than partnered across all pairs: F–H = 0 . 20 (single) vs. 0 . 20 (partnered; ∆ ≈ +0 . 01 ), F–Fin = 0 . 20 vs. 0 . 19 ( ∆ ≈ +0 . 01 ), Fin–H = 0 . 14 vs. 0 . 13 ( ∆ ≈ +0 . 01 ). T riple multiplexity: not estimable in the triple-ov erlap mo dels. • Indigenous identit y: Non-indigenous resp ondents hav e slightly higher pairwise ov erlaps: F–H = 0 . 16 (non-indigenous) vs. 0 . 16 (indigenous; ∆ ≈ +0 . 01 ), F–Fin = 0 . 15 vs. 0 . 14 ( ∆ ≈ +0 . 01 ), Fin–H = 0 . 10 vs. 7 0 . 09 ( ∆ ≈ +0 . 01 ). T riple multiplexity: J triple = 0 . 12 (non-indigenous) vs. 0 . 12 (indigenous; ∆ ≈ +0 . 00 ); Pr( an y triple ) = 0 . 37 vs. 0 . 39 (indigenous slightly higher, +2 pp). • Religion: Protestants ha ve the highest pairwise ov erlaps: F–H: Protestant = 0 . 23 > Catholic = 0 . 21 ≈ None/Other = 0 . 21 ; F–Fin: Protestant = 0 . 22 > Catholic = 0 . 20 ≈ None/Other = 0 . 20 ; Fin–H: Protestant = 0 . 15 > Catholic = 0 . 14 > None/Other = 0 . 13 . T riple multiplexity: J triple : Catholic = 0 . 14 ≳ Protestan t = 0 . 13 > None/Other = 0 . 13 ; Pr( any triple ) : Catholic = 0 . 47 > Protestan t = 0 . 44 > None/Other = 0 . 39 . Ov erlaps are mo dest (pairwise 0 . 10 – 0 . 28 ; triple J triple ≈ 0 . 12 – 0 . 15 ; Pr ( an y triple ) ≈ 0 . 33 – 0 . 53 ), so lay ers remain only partially redundant. W omen, older adults, the educated (for money ties), and Protestan ts are the groups most likely to r euse partners across functions; income, marital status, and indigenous identit y show small or no differences. 3.2 Degree mo dels: who k eeps ties and ho w lay ers co-mov e Degree distributions by la yer and w av e are summarized in T able 7 . T able 7: Degree distributions by la yer and wa v e. All n are resp ondents observed p er wa ve. La yer W a ve n Mean V ariance Zeros (n) Zeros (%) Health 1 20,232 2.84 10.30 3,691 18.2 3 20,232 2.40 7.95 4,060 20.1 F riendship 1 20,232 7.36 30.80 2,522 12.5 3 20,232 6.91 27.10 2,530 12.5 Financial 1 20,232 2.73 7.18 4,348 21.5 3 20,232 2.53 6.58 4,664 23.1 A dversarial 1 20,232 0.90 1.90 11,168 55.2 3 20,232 0.53 1.04 14,190 70.2 W e mo del resp ondent i ’s degree y ( ℓ ) i in lay er ℓ ∈ { Health , F riendship , Financial , A dversarial } using a cross - classified mixed sp ecification with resp ondent, village, and wa ve random in tercepts. F or b oth co op era- tiv e and conflict lay ers we fit zero - inflated NB2 with a log link. Co efficients are reported as incidence - rate ratios (IRR). F ormally , log E h y ( ℓ ) i i = β 0 + β fr fr i + β fin fin i + β adv adv i + β ⊤ X i + u village [ i ] + u wa ve [ i ] + u resp [ i ] , (1) with a separate zero - inflation equation for coop erative la yers. Degrees are o ver - disp ersed and substan tially zero - inflated for co op erativ e lay ers (e.g., F riendship mean/v ar/zeros: W1 = 7.36/30.8/12.5%; W3 = 6.91/27.1/12.5%), while adversarial degrees are sparse (W1 mean/v ar/zeros = 0.90/1.90/55.2%; W3 = 0.53/1.04/70.2%), motiv ating zero inflated negative binomial model. Data details and full tables are presented in the SI. Education is asso ciated with more coop erative ties and fewer conflict ties: Health (IRR ≈ 1 . 010 p er year; p < 0 . 001 ), F riendship (IRR = 1 . 009 , p = 1 . 19 × 10 − 9 ), Financial (IRR = 1 . 014 , p = 1 . 01 × 10 − 11 ), and Ad- v ersarial (IRR = 0 . 974 , p = 1 . 00 × 10 − 9 ). More schooling is linked to broader supp ortive net works and few er an tagonistic relations, possibly consisten t with better comm unication/status and conflict - managemen t skills. The pattern that education expands co op erative net works and reduces conflict is consisten t with other research link- ing sc ho oling to larger and more div erse p ersonal net works and civic engagement ( Bokányi et al. , 2023 ; Putnam , 2000 ). Age increases F riendship (IRR = 1 . 004 , p = 1 . 20 × 10 − 60 ) and Financial degree (IRR = 1 . 002 , p = 1 . 75 × 10 − 13 ) and slightly low ers Adv ersarial degree (IRR = 0 . 996 , p = 1 . 94 × 10 − 6 ); Health sho ws a positive age gradient as w ell (IRR ≈ 1 . 008 p er y ear; p < 0 . 001 ). Older adults sustain somewhat broader coop erative engagement but are marginally less in volv ed in conflict, consistent with life - cycle shifts to ward stabilit y and selective engagemen t. A mo dest p ositive age gradient in coop erativ e lay ers and reduced antagonistic ties accords with so cio emotional selectivit y theory and evidence of age - structured netw ork change in rural settings ( Carstensen , 1992 ; Harling et al. , 8 2020 ). Generally speaking, older adults prune low-v alue ties and a void conflict. Men rep ort more Financial ties (IRR = 1 . 234 , p < 2 × 10 − 16 ) but few er F riendship ties (IRR = 0 . 968 , p = 2 . 04 × 10 − 6 ) and mark edly few er Adv ersarial ties (IRR = 0 . 624 , p = 3 . 99 × 10 − 66 ). Men’s instrumen tal exc hange net works are larger, whereas friendship net works are sligh tly smaller; conflictual ties are concentrated in fewer named relations (or resolv ed/av oided), conditional on other co v ariates. Men’s larger financial out - degree and slightly smaller friendship out - degree are consisten t with gendered role sp ecialization in instrumen tal v ersus so cio - emotional ties; con textual evidence on w omen’s constrained net works in low - income settings supp orts these differences ( Andrew et al. , 2020 ; Harling et al. , 2020 ). Marriage is p ositively associated with degree across lay ers: F riendship (IRR = 1 . 064 , p < 2 × 10 − 16 ), Financial (IRR = 1 . 083 , p = 6 . 95 × 10 − 16 ), and A dversarial (IRR = 1 . 076 , p = 2 . 43 × 10 − 4 ). Marriage app ears to broaden out ward engagement—spouses connect households to more partners across activities and also mo destly raises named an tagonistic ties, plausibly as a by - pro duct of wider in teraction. The positive asso ciation of marriage with friendship and financial degree is compatible with household - to - household linking via sp ouses and in - la ws; small increases in an tagonistic out - degree may reflect greater exp osure through wider in teraction (see general so cial capital arguments in Putnam , 2000 ). Income sufficiency reduces F riendship (IRR = 0 . 982 , p = 1 . 12 × 10 − 3 ) and Adv ersarial (IRR = 0 . 957 , p = 0 . 0106 ) but increases Financial degree (IRR = 1 . 044 , p = 2 . 64 × 10 − 7 ). Economically secure resp ondents engage more in v oluntary exc hange net works, but name sligh tly fewer casual friends and conflicts, consistent with less necessit y - driv en so cializing and low er exp osure to disputes. Higher financial degree alongside fewer friendship/conflict ties suggests a shift from necessit y - driv en to elective engagement; related work do cumen ts so cio economic gradien ts in lo cal isolation and differing reliance on informal ties ( Andrew et al. , 2020 ; Bokányi et al. , 2023 ). Compared to the no religious villages, Protestants and Catholics report more F riendship ties (Protestan t: IRR = 1 . 056 , p = 9 . 43 × 10 − 7 ; Catholic: IRR = 1 . 036 , p = 0 . 00155 ) and more Financial ties (Protestant: IRR = 1 . 063 , p = 9 . 79 × 10 − 5 ; Catholic: IRR = 1 . 050 , p = 0 . 00242 ); effects on Adv ersarial are small and not significant (Protestant: IRR = 0 . 994 , p = 0 . 862 ; Catholic: IRR = 0 . 941 , p = 0 . 0719 ). Mem b ership in the t wo ma jor denominations is asso ciated with slightly denser co op erative net works, with no systematic differences in conflict. Mo dest coop erativ e adv an tages for Protestants/Catholics, with no clear conflict difference, fit the view that affiliation offers mild b onding capital without strongly re - wiring ev eryday village ties; homophily may b e present but limited in integrated comm unities ( Lync h et al. , 2022 ; McPherson et al. , 2001 ). Indigenous resp ondents report slightly more ties in each la yer: F riendship (IRR = 1 . 026 , p = 0 . 0308 ), Financial (IRR = 1 . 040 , p = 0 . 0207 ), and A dversarial (IRR = 1 . 14 , p = 3 . 86 × 10 − 4 ). Conditional on other factors, indigenous villagers maintain modestly broader out ward engagement and also name more antagonistic ties, consistent with greater ov erall in teraction v olume (more opp ortunities for both coop eration and friction). Slightly higher degrees across la yers are consistent with greater in teraction volume; in other contexts, minorit y status can yield strong b onding ties and weak er bridging ties ( W oolco ck , 1998 ). Place correlates sho w limited a verage effects: access to road routes is not significant for F riendship (IRR = 1 . 025 , p = 0 . 339 ), Financial (IRR = 1 . 033 , p = 0 . 128 ), or Adv ersarial (IRR = 1 . 03 , p = 0 . 540 ); village size is weakly negativ e for F riendship (IRR = 0 . 999 , p = 2 . 08 × 10 − 11 ) and near null for Financial and A dversarial (b oth p > 0 . 20 ). Ph ysical access alone do es not reconfigure micro - ties, while larger p opulations slightly dilute a verage friendship degree via segmentation. Net effects are context - dep enden t. Null access - to - routes effects and a small negative village - size asso ciation with friendship align with the idea that larger p opulations segment net works, diluting a verage degree ( Dunbar , 1992 ; Shaky a et al. , 2019 ). Physical access alone may be insufficient to alter micro-tie formation. Ho w lay ers co - mo ve. Co op erative la yers co - mo ve strongly . F or the F riendship outcome, Financial degree has a large p ositiv e asso ciation (IRR = 1 . 10 , p < 2 × 10 − 16 ) and Health degree is also p ositive (IRR = 1 . 046 , p < 2 × 10 − 16 ). F or the Financial outcome, F riendship (IRR = 1 . 073 , p < 2 × 10 − 16 ) and Health (IRR = 1 . 039 , p < 2 × 10 − 16 ) raise exp ected out - degree. Health degree rises only slightly with co op erative degrees, F riendship (IRR = 1 . 068 , p < 2 × 10 − 16 ), Financial (IRR = 1 . 077 , p < 2 × 10 − 16 ), Adv ersarial (IRR = 1 . 034 , p < 2 × 10 − 16 ), indicating 9 stronger co - mo vemen t with conflict ties than among co op erative la yers. Adv ersarial degree rises only slightly with co op erative degrees, F riendship (IRR = 1 . 021 , p < 2 × 10 − 16 ), Financial (IRR = 1 . 043 , p < 2 × 10 − 16 ), Health (IRR = 1 . 019 , p = 2 . 08 × 10 − 10 ), indicating far weak er co-mov ement with conflict ties than among co op erative la yers. Bet ween - village heterogeneit y (non - zero random in tercept v ariance) suggests contextual differences in o verall connectedness. In short, socially activ e individuals tend to b e active across coop erative domains (m ultiplexity), while an tagonistic ties scale muc h less with co op eration. In the literature, strong co - mo vemen t among co op erative la yers and w eak coupling with conflict is a hallmark of multiplex so cial organization: general so cial “hubs” accum ulate ties across activities, whereas antagonism scales less ( Gluc kman , 1973 ; Ghasemian and Christakis , 2024 ). Within vs. b etw een and heterogeneit y . A Mundlak decomp osition distinguishes within - from b etw een - p erson gradien ts (e.g., for Health, the b et ween - p erson age effect is p ositive and precise; village size sho ws small negative within/b et ween effects). Allowing village - v arying cross - la yer slop es rev eals heterogeneity in how general connectedness translates into Health support: the SD of the F riendship to Health slope is ˆ σ = 0 . 071 on the log scale, i.e., a ± 7% band around the mean effect. W a ve differences. W av e 3 shows a mild contraction in co op erative degree (and stable zeros in F riendship) alongside a marked reduction and higher zero mass in Adv ersarial. T able 8: Core fixed - effect IRRs from the degree mo dels (coun t parts). En tries are shown only when p < 0 . 05 in the corresp onding lay er-sp ecific mo del; otherwise the cell is left as “—” . V alues are incidence-rate ratios (IRR). Predictor Health F riendship Financial Adv ersarial F riendship degree ( f r c ) 1.058 — 1.073 1.022 Financial degree ( f in c ) 1.077 1.101 — 1.044 Health degree ( h c ) — 1.046 1.039 1.019 A dversarial degree ( adv c ) 1.034 1.022 1.040 — Education (p er year) 1.014 1.009 1.014 0.974 Age (p er year) 1.009 1.004 1.002 0.999 Male 0.687 0.968 1.234 0.629 Married 1.061 1.064 1.083 — Income sufficient 0.979 0.982 1.044 0.959 Protestan t (Rel. lev el 1) 1.082 1.056 1.063 — Catholic (Rel. level 2) 1.051 1.037 1.050 — Indigenous 1.107 1.026 1.040 1.153 A ccess to routes (centered) — — — — Village size (centered) — 0.999 — — Ov erall: (1) Co op erative lay ers co - mo ve strongly at b oth p erson and place levels (5–9% p er added tie; village r = 0 . 86 – 0 . 92 ), y et dyadic ov erlap is lo w. (2) Education and age push coop erativ e and adversarial degrees in opp osite directions; gender roles are sp ecialized (men: financial; women: friendship/health; men rep ort few er adversarial ties). (3) Cross - la yer couplings v ary across villages ( ± 7% around the mean for F riendship → Health), highlighting scope for village-lev el meta-analysis and targeting. F or a compact summary of the main cov ariate effects, see T able 8 . 3.3 Dy ad-level assortativit y and degree-aw are p ermutations W e provide an in-depth analysis of factors asso ciated with net work connections in 176 rural villages in the Copan Departmen t of Honduras, focusing on health, friendship, financial, and adv ersarial relationships across tw o years. Using mixed-effects zero inflated negative binomial regression mo dels and assortativity measures, we examined ho w individual attributes and netw ork characteristics asso ciated with the formation of v arious so cial ties. W e find that gender and religion are the most significant factors driving b oth within-communit y and inter-comm unity assortativit y . Specifically , strong gender homophily is evident across all netw ork types, with female-female rela- tionships predominating in health and friendship netw orks and male-male ties b eing more prev alent in financial 10 net works. Additionally , shared religious affiliations significan tly con tribute to comm unity cohesion and the formation of inter-comm unit y connections, highlighting the fundamen tal role of cultural and identit y-based factors in shaping so cial structures. F riendship and financial connections emerge as critical predictors across all t yp es of relationships, underscoring their cen trality in facilitating broader so cial interactions. Individuals with extensive friendship and financial net works are more likely to engage in multiple forms of so cial relationships, demonstrating the interconnected nature of so cial and economic ties in fostering comm unity resilience and supp ort systems. In contrast, attributes such as age, education, and income sufficiency exhibit weak er assortativit y , particularly in in ter-communit y ties. While these factors contribute to in ternal comm unity cohesion, their limited role in bridging different communities suggests the presence of so cio-economic stratifications or cultural barriers that hinder broader social integration. Comm unity-lev el assortativit y further emphasizes the imp ortance of education, age, and religion in structuring communities, with increasing m utual information v alues ov er time indicating a gro wing alignment of communit y structures with so cio-economic factors. P ermutation-based assortativit y results are summarized in T able 9 . T able 9: Assortativity across la yers and tolerances. Cells show the percentage of villages with p < 0 . 05 at tolerances ± 5% / ± 10% / ± 20% on group–sp ecific mean degrees. F or non - gender attributes (Religion), p ermutations are stratified by gender. Gender Religion La yer (W a v e 1) M–M F–F M–F (dissort.) P–P C–C F riendship 97.1 / 96.6 / 92.0 96.0 / 93.1 / 74.3 0.0 / 0.0 / 0.0 67.4 / 64.0 / 60.0 60.0 / 54.9 / 48.6 Health 97.1 / 36.6 / 16.6 96.0 / 38.9 / 50.9 0.6 / 0.0 / 0.0 60.0 / 58.9 / 54.9 53.7 / 46.9 / 36.6 Financial 97.1 / 77.7 / 74.9 96.0 / 63.4 / 25.7 0.0 / 0.0 / 0.0 56.6 / 53.1 / 46.3 54.3 / 52.0 / 43.4 A dversarial 97.1 / 59.4 / 60.6 96.0 / 57.7 / 59.4 0.0 / 0.0 / 0.0 60.0 / 58.9 / 54.9 53.7 / 46.9 / 36.6 3.4 Comm unities align most with friendship and are w eakly explained b y single traits W e aggregate friendship, health, and financial ties by union to obtain denser undirected graphs suited for meso - scale analysis. T able 10 rep orts Min/Median/Max metric across villages for W av e 1 and W a ve 3 (village 156 excluded). In W av e 1, aggregates are sligh tly denser (median δ = 0 . 083 ) with higher median mean degree ( ⟨ k ⟩ = 6 . 58 ) and strong clustering ( ⟨ C ⟩ = 0 . 349 ), while fragmen tation is limited (median 4 comp onen ts). W av e 3 shows a similar pattern (median δ = 0 . 075 , ⟨ k ⟩ = 6 . 02 , ⟨ C ⟩ = 0 . 374 ; median 5 comp onen ts). In b oth wa ves the largest connected comp onent (LCC) con tains nearly the entire netw ork (median n/ N = 96 . 3% in W1 and 95 . 7% in W3; median m/ M = 100% in both) and is even denser (W1: δ LCC = 0 . 091 , ⟨ k ⟩ LCC = 6 . 86 ; W3: δ LCC = 0 . 083 , ⟨ k ⟩ LCC = 6 . 32 ), confirming that aggregation yields fav orable conditions for communit y detection. 11 T able 10: Aggregated lay er (W av e 1 and W av e 3; friendship ∪ health ∪ financial): characteristics of full net works and largest connected comp onen ts (LCCs) (Min/Median/Max across villages; village 156 excluded). W av e 1 (Aggregated) W av e 3 (Aggregated) Netw orks LCC Net works LCC Metric Min Med Max Min Med Max Min Med Max Min Med Max N 16 80 370 15 76 362 16 80 370 15 75 366 M 29 274 1352 29 274 1351 41 237 1013 41 237 1013 δ 0.014 0.083 0.262 0.016 0.091 0.276 0.014 0.075 0.342 0.015 0.083 0.390 ⟨ k ⟩ 3.09 6.58 13.13 3.40 6.86 13.29 2.44 6.02 10.41 2.97 6.32 10.63 ⟨ C ⟩ 0.230 0.349 0.520 0.230 0.349 0.520 0.263 0.374 0.590 0.263 0.374 0.590 Components 1 4 21 1 1 1 1 5 22 1 1 1 n/ N – – – 84.3% 96.3% 100% – – – 77.1% 95.7% 100% m/ M – – – 99.2% 100% 100% – – – 87.0% 100% 100% Notes: N = num b er of nodes; M = num b er of edges; δ = edge density; ⟨ k ⟩ = mean degree; ⟨ C ⟩ = mean clustering coefficient; Comp onents = num b er of connected comp onents. LCC = largest connected comp onent; n/ N and m/ M are the fractions of no des and edges con tained in the LCC. W e extract each village’s LCC, detect communities with Louv ain ( γ = 1 ), and mask comm unities with < 4 no des, based on mo dularity . F or a single (aggregated) lay er with adjacency A , degrees k , m edges, and partition g , mo dularit y is Q = 1 2 m X i,j A ij − γ k i k j 2 m 1 { g i = g j } , (2) with γ = 1 throughout. Applying Louv ain ( γ = 1 ) on the LCC with a minimum communit y size of four yields a consisten t meso-scale decomposition across villages and w av es. Villages contain on a verage about six comm unities (W1: mean 6 . 12 , SD 1 . 84 , range [2 , 12] ; W3: mean 6 . 26 , SD 1 . 92 , range [3 , 15] ), indicating nontrivial segmen tation b ey ond a core–p eriphery split. The largest comm unity in a village t ypically holds ab out one quarter of cov ered no des (W1: mean size 20 . 7 ; mean share 0 . 251 ; range [7 , 60] ; W3: mean size 20 . 4 ; mean share 0 . 247 ; range [5 , 55] ), so no single group dominates. Pooling communities o ver all villages, typical comm unity size is ∼ 15 no des with mo derate disp ersion (W1: mean 15 . 1 , SD 7 . 83 , range [4 , 60] ; W3: mean 14 . 8 , SD 7 . 83 , range [4 , 55] ). These structure-only results confirm that the aggregated net works admit stable, meso-scale communit y structure in b oth wa ves, setting the stage for the trait analyses below. T able 11: Structure-only comm unity statistics (Louv ain on aggregated lay er; LCC; minim um comm unity size = 4 ). (A) # comm unities p er village W a ve Vill. Mean SD Min Max 1 176 6.12 1.84 2 12 3 176 6.26 1.92 3 15 (B) Largest comm unity per village W a ve Mean size SD Min Max 1 20.7 8.84 7 60 3 20.4 9.24 5 55 Mean share: W1 = 0 . 251 , W3 = 0 . 247 (C) All comm unities p o oled W a ve Comms Mean SD Min Max 1 1070 15.1 7.83 4 60 3 1080 14.8 7.83 4 55 Structure-only communit y statistics are rep orted in T able 11 . Next, trait–comm unity asso ciation is quantified in tw o complementary wa ys. (i) Pr e diction (multinomial lo git). Within each village w e fit an ℓ 2 -regularized multinomial mo del Comm unity ∼ Gender + Religion + Marital Status + Indigenous Status + Income Sufficiency + Age + Education , and summarize each attribute’s contribution by the village - wise mean absolute z across its co efficien ts (“mean | z | ”); w e also rep ort pseudo - R 2 v ersus an intercept - only mo del and (ii) A lignment/p ermutation. F or each attribute w e 12 compute the mo dularity of the attribute partition on the aggregated graph ( Q attr ) and assess significance with degree - a ware lab el p erm utations that preserv e group - sp ecific mean degrees under ± 5% , ± 10% , and ± 20% tolerances. W e also visualize the normalized mutual information betw een Louv ain communities and single attributes (NMI) to sho w direct lab el alignment (upper-right panel of Fig. 2 ). A cross villages and w av es, gender is the strongest single predictor (highest median mean | z | ), follow ed by marital status , e duc ation , and age ; inc ome and r eligion are weak er on av erage. Pseudo - R 2 is mo dest and stable across w av es (means ≈ 0 . 25 ). See T able 12 for across - village summaries, and the lo wer panels of Fig. 2 for mean | z | (95% CIs) and the share of villages with mean | z | > 1 . Information - theoretic alignmen t b etw een communit y lab els and any single attribute is small in median terms, as sho wn b y the NMI panel (Fig. 2 , upp er - righ t). Median NMI is near zero for most attributes, reflecting many villages with degenerate comparisons (e.g., one communit y after size masking or a single observed attribute lev el); a small but non - zero median is visible for education. In contrast, Q attr is frequen tly p ositiv e and statistically de- tectable under degree - a ware p ermutations for gender and r eligion , and to a lesser extent for marital status (T able 13 ). Ov erall, these results indicate that while several traits are assortativ e on edges (captured by Q attr ), they explain only limited v ariance in full communit y assignments (lo w NMI), consisten t with communities reflecting multiple o verlapping attributes rather than a single dominant trait. T able 12: Predictive strength for comm unity mem b ership (mean | z | ) and pseudo- R 2 . W a ve Attribute Villages Median | z | Mean | z | Mean R 2 W1 Gender 176 1.030 1.070 0.252 W1 Marital 176 0.850 0.930 0.252 W1 Income 174 0.788 0.826 0.252 W1 Religion 154 0.639 0.664 0.258 W1 Education (bin) 172 0.612 0.673 0.251 W1 Age (bin) 176 0.592 0.662 0.252 W1 Indigenous 95 0.503 0.653 0.251 W3 Gender 176 0.780 0.820 0.250 W3 Marital 176 0.697 0.734 0.250 W3 Income 174 0.629 0.724 0.250 W3 Religion 155 0.588 0.641 0.253 W3 Education (bin) 173 0.581 0.651 0.249 W3 Age (bin) 176 0.566 0.629 0.250 W3 Indigenous 96 0.448 0.510 0.253 T able 13: P ermutation summary . Q attr is the mo dularity of the attribute partition on the aggregated graph; shares are fractions of villages with p < 0 . 05 under degree - a ware label p ermutations (10% tolerance). NMI columns are omitted to av oid degenerate cases; NMI distributions are sho wn in Fig. 2 (upp er-right). W a ve Attribute Villages Median Q attr Share p Q 0 . 05 (10%) W1 Gender 176 0.085 0.93 W1 Marital 176 0.040 0.63 W1 Income 176 0.004 0.15 W1 Religion 176 0.043 0.74 W1 Education (bin) 176 0.026 0.42 W1 Age (bin) 176 -0.011 0.28 W1 Indigenous 176 0.000 0.40 W3 Gender 176 0.073 0.91 W3 Marital 176 0.025 0.40 W3 Income 176 0.008 0.23 W3 Religion 176 0.051 0.68 W3 Education (bin) 176 0.020 0.33 W3 Age (bin) 176 -0.013 0.26 W3 Indigenous 176 0.001 0.44 13 Figure 2: Upper Left: Num b er of communities per village (aggregated, min size = 4 ). Upp er Right: Alignment (NMI) b etw een communities and single attributes. Low er Left: Mean | z | (95% CI) from within - village multinomial logit. Low er Right: Share of villages with mean | z | > 1 by attribute. 4 Conclusion W e provide an in-depth analysis of factors asso ciated with netw ork connections in 176 rural villages in the isolated Copan Department of Honduras, focusing on health, friendship, financial, and adversarial relationships across t wo y ears. Using mixed-effects zero inflated negativ e binomial regression mo dels and assortativity measures, we examined ho w individual attributes and net work c haracteristics are associated with the formation of v arious social ties. W e find that gender and religion are the most significant factors driving b oth within net work comm unity assortativit y and b etw een netw ork communit y (inter net work communit y) assortativity . Sp ecifically , strong gender homophily is eviden t across all netw ork types, with female-female relationships predominating in health and friendship netw orks and male-male ties being more prev alent in financial net works. Additionally , shared religious affiliations significantly con tribute to communit y cohesion and the formation of inter-comm unit y connections, highlighting the fundamental role of cultural and identit y-based factors in shaping so cial structures. F riendship and financial connections emerge as critical predictors across all types of relationships, underscoring their cen trality in facilitating broader social interactions. Individuals with extensive friendship and financial net works are more likely to engage in multiple forms of so cial relationships, demonstrating the interconnected nature of so cial and economic ties in fostering communit y resilience and supp ort systems. In con trast, attributes such as age, education, and income sufficiency exhibit w eaker assortativit y , particularly in inter net work communit y ties. 14 While these factors contribute to in ternal comm unity cohesion, their limited role in bridging differen t communities suggests the presence of socio-economic stratifications or cultural barriers that hinder broader so cial integration. Comm unity-lev el assortativity further emphasizes the imp ortance of education, age, and religion in structuring comm unities, with increasing mutual information v alues o ver time indicating a gro wing alignment of comm unity structures with so cio-economic factors. These underlying social patterns ha ve implications for designing targeted interv entions aimed at impro ving outcomes. By iden tifying and leveraging k ey individuals with extensive friendship and financial net works, health initiativ es can more effectively disseminate information and resources, hereby enhancing comm unity-wide health outcomes ( Kim et al. , 2015 ; Airoldi and Christakis , 2024 ). The observed strengthening of comm unity cohesion based on education and income sufficiency o ver time suggests that socio-economic adv ancemen ts play a crucial role in shaping resilient comm unities. F uture researc h should explore the underlying mechanisms driving these assortativit y patterns and in vestigate ho w ongoing so cio-economic and cultural shifts influence netw ork dynamics. Understanding these factors will pro vide deep er insights in to sustaining communit y resilience and optimizing health in terven tions in similar rural settings. References Airoldi, E. M. and Christakis, N. A. (2024). Induction of so cial contagion for diverse outcomes in structured exp erimen ts in isolated villages. Scienc e , 384(6695):eadi5147. Andrew, A., Attanasio, O., A ugsburg, B., Behrman, J., Day , M., Jervis, P ., Meghir, C., and Phimister, A. (2020). Mothers’ social net works and socio economic gradien ts of isolation. T echnical rep ort, National Bureau of Economic Researc h. Aral, S., Muchnik, L., and Sundarara jan, A. (2013). Engineering so cial con tagions: Optimal net work seeding in the presence of homophily . Network Scienc e , 1(2):125–153. Banerjee, A., Chandrasekhar, A. G., Duflo, E., and Jackson, M. O. (2013). The diffusion of microfinance. Scienc e , 341(6144):1236498. Berreman, G. D. (1972). Race, caste, and other in vidious distinctions in so cial stratification. R ac e , 13(4):385–414. Blondel, V. D., Guillaume, J.-L., Lam biotte, R., and Lefebvre, E. (2008). F ast unfolding of communities in large net works. Journal of statistic al me chanics: the ory and exp eriment , 2008(10):P10008. Bokán yi, E., Heemsk erk, E. M., and T akes, F. W. (2023). The anatomy of a population-scale so cial netw ork. Scientific R ep orts , 13(1):9209. Carstensen, L. L. (1992). So cial and emotional patterns in adultho o d: supp ort for so cio emotional selectivity theory . Psycholo gy and aging , 7(3):331. Cen tola, D. (2010). The spread of b ehavior in an online so cial netw ork exp eriment. scienc e , 329(5996):1194–1197. Cen tola, D. (2011). An exp erimental study of homophily in the adoption of health b ehavior. Scienc e , 334(6060):1269– 1272. Christakis, N. A. and F owler, J. H. (2010). So cial netw ork sensors for early detection of con tagious outbreaks. PloS one , 5(9):e12948. Dun bar, R. I. (1992). Neo cortex size as a constraint on group size in primates. Journal of human evolution , 22(6):469–493. F ortunato, S. (2010). Communit y detection in graphs. Physics r ep orts , 486(3-5):75–174. Ghasemian, A. and Christakis, N. A. (2024). The structure and function of antagonistic ties in village so cial net works. Pr o c e e dings of the National A c ademy of Scienc es , 121(26):e2401257121. 15 Girv an, M. and Newman, M. E. (2002). Comm unity structure in so cial and biological netw orks. Pr o c e e dings of the national ac ademy of scienc es , 99(12):7821–7826. Gluc kman, M. (1973). The judicial pr o c ess among the Bar otse of Northern Rho desia . Manchester Univ ersity Press. Harling, G., Morris, K. A., Manderson, L., Perkins, J. M., and Berkman, L. F. (2020). Age and gender differences in so cial netw ork comp osition and so cial support among older rural south africans: Findings from the haalsi study . The Journals of Ger ontolo gy: Series B , 75(1):148–159. Harling, G., W ang, R., Onnela, J.-P ., and De Gruttola, V. (2017). Leveraging con tact netw ork structure in the design of cluster randomized trials. Clinic al T rials , 14(1):37–47. Henry , A. D., Prałat, P ., and Zhang, C.-Q. (2011). Emergence of segregation in ev olving so cial net works. Pr o c e e dings of the National A c ademy of Scienc es , 108(21):8605–8610. Hoff, P . D., Raftery , A. E., and Handco ck, M. S. (2002). Latent space approac hes to so cial net work analysis. Journal of the americ an Statistic al asso ciation , 97(460):1090–1098. Hun ter, R. F., McAneney , H., Da vis, M., T ully , M. A., V alente, T. W., and Kee, F. (2015). “hidden” so cial net works in b ehavior c hange interv entions. A meric an journal of public he alth , 105(3):513–516. Kim, D. A., Hw ong, A. R., Stafford, D., Hughes, D. A., O’Malley , A. J., F owler, J. H., and Christakis, N. A. (2015). So cial net work targeting to maximise population b eha viour change: a cluster randomised controlled trial. The L anc et , 386(9989):145–153. Kumpula, J. M., Onnela, J.-P ., Saramäki, J., Kaski, K., and Kertész, J. (2007). Emergence of communities in w eighted net works. Physic al r eview letters , 99(22):228701. Lungean u, A., McKnight, M., Negron, R., Munar, W., Christakis, N. A., and Contractor, N. S. (2021). Using trellis soft ware to enhance high-quality large-scale net work data collection in the field. So cial Networks , 66:171–184. Lync h, R., Schaffnit, S., Sear, R., Sosis, R., Sha ver, J., Alam, N., Blumenfield, T., Mattison, S., and Shenk, M. (2022). Religiosity is asso ciated with greater size, kin densit y , and geographic dispersal of w omen’s so cial net works in bangladesh. Scientific r ep orts , 12(1):18780. McPherson, M., Smith-Lovin, L., and Co ok, J. M. (2001). Birds of a feather: Homophily in so cial netw orks. A nnual r eview of so ciolo gy , 27(1):415–444. Mon tes, F., Jimenez, R. C., and Onnela, J.-P . (2018). Connected but segregated: so cial netw orks in rural villages. Journal of Complex Networks , 6(5):693–705. Munshi, K. and Rosenzw eig, M. (2006). T raditional institutions meet the mo dern world: Caste, gender, and sc ho oling c hoice in a globalizing economy . A meric an Ec onomic R eview , 96(4):1225–1252. Newman, M. E. (2003). Mixing patterns in netw orks. Physic al r eview E , 67(2):026126. Noldus, R. and V an Mieghem, P . (2015). Assortativity in complex netw orks. Journal of c omplex networks , 3(4):507–542. P atil, R. R. (2014). Caste-, work-, and descent-based discrimination as a determinan t of health in so cial epidemiology . So cial work in public he alth , 29(4):342–349. P erkins, J. M., Subramanian, S., and Christakis, N. A. (2015). So cial netw orks and health: a systematic review of so cio centric net work studies in lo w-and middle-income coun tries. So cial scienc e & me dicine , 125:60–78. P orter, M. A., Onnela, J.-P ., Muc ha, P . J., et al. (2009). Comm unities in net works. Putnam, R. D. (2000). Bow ling alone: The c ol lapse and r evival of A meric an c ommunity . Simon and sch uster. Robins, G., Pattison, P ., Kalish, Y., and Lusher, D. (2007). An introduction to exp onential random graph (p*) mo dels for so cial netw orks. So cial networks , 29(2):173–191. 16 San yal, P . (2015). Group-based microcredit & emergen t inequalit y in social capital: Why so cio-religious comp osition matters. Qualitative So ciolo gy , 38(2):103–137. Shaky a, H. B., W eeks, J. R., and Christakis, N. A. (2019). Do village-lev el normativ e and netw ork factors help explain spatial v ariability in adolescen t childbearing in rural honduras? SSM-Population He alth , 9:100371. Smith, K. P . and Christakis, N. A. (2008). So cial netw orks and health. A nnu. R ev. So ciol , 34(1):405–429. W ang, Y. J. and W ong, G. Y. (1987). Sto chastic blo ckmodels for directed graphs. Journal of the A meric an Statistic al A sso ciation , 82(397):8–19. W o olco ck, M. (1998). So cial capital and economic dev elopment: T o ward a theoretical syn thesis and p olicy framew ork. The ory and so ciety , 27(2):151–208. A Who is connected? - T ables T able 14: F riendship degree (ZINB2, coun t part): estimates, standard errors, and p -v alues. Random in tercepts for village, wa v e, and resp onden t. T erm Estimate SE p In tercept 1.70900 0.02500 < 10 − 100 Health degree ( h c ) 0.04500 0.00100 < 10 − 16 Financial degree ( f in c ) 0.09600 0.00100 < 10 − 16 A dversarial degree ( adv c ) 0.02200 0.00200 < 10 − 16 Age (centered) ( ag e c ) 0.00380 0.00020 < 10 − 16 Education (centered) ( edu c ) 0.00900 0.00150 1 . 2 × 10 − 9 Male ( g ender =1 ) -0.03200 0.00680 2 . 0 × 10 − 6 Income sufficiency ( =1 ) -0.01800 0.00560 1 . 1 × 10 − 3 Married ( = 1 ) 0.06200 0.00690 < 10 − 16 Religion: Protestant 0.05400 0.01100 9 . 4 × 10 − 7 Religion: Catholic 0.03600 0.01100 1 . 6 × 10 − 3 Indigenous ( = 1 ) 0.02600 0.01200 3 . 08 × 10 − 2 A ccess to routes ( access c ) 0.02500 0.02600 3 . 39 × 10 − 1 Village size ( v siz e c ) -0.00096 0.00014 2 . 1 × 10 − 11 T able 15: Health degree (ZINB2, coun t part; W1+W3 p o oled): estimates, standard errors, and p -v alues. Random in tercepts for village, wa v e, and respondent. T erm Estimate SE p In tercept 0.73670 0.03180 < 10 − 100 F riendship degree ( f r c ) 0.05600 0.00100 < 10 − 16 Financial degree ( f in c ) 0.07400 0.00190 < 10 − 16 A dversarial degree ( adv c ) 0.03330 0.00310 < 10 − 16 Age (centered) ( ag e c ) 0.00850 0.00030 < 10 − 16 Education (centered) ( edu c ) 0.01400 0.00210 < 10 − 10 Male ( g ender =1 ) -0.37610 0.01010 < 10 − 16 Income sufficiency ( = 1 ) -0.02150 0.00840 1 . 0 × 10 − 2 Married ( = 1 ) 0.05880 0.01010 < 10 − 7 Religion: Protestant 0.07860 0.01670 < 10 − 5 Religion: Catholic 0.04960 0.01710 3 . 8 × 10 − 3 Indigenous ( = 1 ) 0.10210 0.01670 < 10 − 8 A ccess to routes ( access c ) -0.00680 0.01450 6 . 37 × 10 − 1 Village size ( v siz e c ) -0.00030 0.00010 5 . 9 × 10 − 2 17 T able 16: Financial degree (ZINB2, count part); W1+W3 p o oled): estimates, standard errors, and p -v alues. Random in tercepts for village and resp ondent. T erm Estimate SE p In tercept 0.47770 0.02340 7 . 5 × 10 − 93 F riendship degree ( f r c ) 0.07060 0.00088 < 10 − 16 Health degree ( h c ) 0.03790 0.00128 < 10 − 16 A dversarial degree ( adv c ) 0.03910 0.00306 < 10 − 16 Age (centered) ( ag e c ) 0.00240 0.00033 1 . 75 × 10 − 13 Education (centered) ( edu c ) 0.01410 0.00207 1 . 01 × 10 − 11 Male ( g ender =1 ) 0.21000 0.00938 < 10 − 16 Income sufficiency ( = 1 ) 0.04310 0.00837 2 . 64 × 10 − 7 Married ( = 1 ) 0.08000 0.00991 6 . 95 × 10 − 16 Religion: Protestant 0.06140 0.01580 9 . 79 × 10 − 5 Religion: Catholic 0.04910 0.01620 2 . 42 × 10 − 3 Indigenous ( = 1 ) 0.03930 0.01700 2 . 07 × 10 − 2 A ccess to routes ( access c ) 0.03260 0.02140 1 . 28 × 10 − 1 Village size ( v siz e c ) 0.00006 0.00016 7 . 02 × 10 − 1 T able 17: Adv ersarial degree (ZINB2, count part): estimates, standard errors, and p -v alues. Random in tercepts for village, wa v e, and resp onden t. T erm Estimate SE p In tercept -0.46900 0.15500 2 . 5 × 10 − 3 F riendship degree ( f r c ) 0.02130 0.00213 < 2 × 10 − 16 Financial degree ( f in c ) 0.04280 0.00430 < 2 × 10 − 16 Health degree ( h c ) 0.01920 0.00294 5 . 9 × 10 − 11 Age (centered) ( ag e c ) -0.00190 0.00078 1 . 46 × 10 − 2 Education (centered) ( edu c ) -0.02600 0.00442 4 . 3 × 10 − 9 Male ( g ender =1 ) -0.46300 0.02460 < 2 × 10 − 16 Income sufficiency ( = 1 ) -0.04180 0.01770 1 . 8 × 10 − 2 Married ( = 1 ) 0.03720 0.02170 8 . 6 × 10 − 2 Religion: Protestant -0.00009 0.03370 9 . 98 × 10 − 1 Religion: Catholic -0.05300 0.03480 1 . 28 × 10 − 1 Indigenous ( = 1 ) 0.14200 0.03930 3 . 2 × 10 − 4 A ccess to routes ( access c ) 0.02530 0.05450 6 . 43 × 10 − 1 Village size ( v siz e c ) 0.00052 0.00044 2 . 36 × 10 − 1 T ables 14–17 (ZINB2 count mo dels with random intercepts) sho w a consistent picture of who is connected across the four lay ers. First, degrees are strongly multiplex : having more ties in one la yer is p ositively asso ciated with ha ving more ties in the other la yers (e.g., friendship degree increases with health, financial, and adversarial degree; and adversarial degree also rises with co op erative degrees). Second, standard so cio-demographic gradients are clear: age and education are p ositively associated with degree in all three co op erative la yers (health, friendship, financial), but b oth are negativ ely asso ciated with adversarial degree, suggesting that older and more educated individuals participate more in supportive net works while b eing less in volv ed in conflict. Third, gender roles are la yer-specific: men ha ve few er health and friendship ties, substantially more financial ties, and fewer adv ersarial ties. F ourth, b eing married is asso ciated with higher degree in co op erative la yers, while the asso ciation with adversarial degree is weak er and not statistically robust. Fifth, economic security shifts the t yp e of connectedness: income sufficiency is asso ciated with fewer health and friendship ties and fewer adv ersarial ties, but with more financial ties. Sixth, cultural identit y v ariables matter mainly for co op erative ties: affiliation with the ma jor religions is associated with higher coop erative degree, while religion is not a robust predictor of adversarial degree; indigenous identit y is p ositively asso ciated with degree in each lay er, including adversarial ties. Finally , village/spatial cov ariates con tribute little in these mo dels: access to routes is not significant across lay ers, and village size is most clearly asso ciated with low er friendship degree (with weak er or n ull asso ciations in the other lay ers). 18 B Assortativit y - T ables - Figures Figure 3: Dyad-lev el assortativit y in health ties (W av e 1). F or each village, w e fit dyad-lev el logistic regressions predicting the presence of a health tie from attribute similarit y . P anels rep ort village-sp ecific o dds ratios (p oints) with 95% confidence in terv als for eac h attribute; villages are ordered by the odds ratio within each panel. Red p oints indicate villages where the similarit y coefficient is statistically significant ( p < 0 . 05 ). The dashed horizon tal line marks OR = 1 (no asso ciation). See T able 18 for corresp onding numerical details. 19 T able 18: Health (W av e 1): degree - a ware p ermutation rejections (# villages with p < 0 . 05 ) by attribute and tolerance on group-sp ecific mean degrees ( ± 5% , ± 10% , ± 20% ). A ttribute Category ± 5% ± 10% ± 20% Gender M–M (assort.) 53 136 131 F–F (assort.) 56 111 45 M–F (dissort.) 0 0 0 Religion Catholic–Catholic (assort.) 101 94 66 Protestan t–Protestant (assort.) 100 101 92 Other–Other (assort.) 14 14 12 Differen t Religions (dissort.) 0 0 0 Marital status Married–Married (assort.) 9 11 33 Single–Single (assort.) 6 6 3 Married–Single (dissort.) 4 4 3 Education High–High (assort.) 10 9 18 Lo w–Low (assort.) 4 2 3 High–Lo w (dissort.) 5 6 5 Age Old–Old (assort.) 1 0 0 Y oung–Y oung (assort.) 2 6 32 Old–Y oung (dissort.) 22 20 15 Income sufficiency Sufficien t–Sufficient (assort.) 0 0 0 Insufficien t–Insufficient (assort.) 0 0 0 Sufficien t–Insufficient (dissort.) 0 0 0 Indigenous (binary) Indigenous–Indigenous (assort.) 16 16 17 Non-Indigenous–Non-Indigenous (assort.) 15 9 5 Indigenous–Non-Indigenous (dissort.) 0 0 1 20 Figure 4: Dyad-lev el assortativit y in health ties (W av e 3). F or each village, w e fit dyad-lev el logistic regressions predicting the presence of a health tie from attribute similarit y . P anels rep ort village-sp ecific o dds ratios (p oints) with 95% confidence in terv als for eac h attribute; villages are ordered by the odds ratio within each panel. Red p oints indicate villages where the similarit y coefficient is statistically significant ( p < 0 . 05 ). The dashed horizon tal line marks OR = 1 (no asso ciation). See T able 19 for corresp onding numerical details. 21 T able 19: Health (W av e 3): degree - a ware p ermutation rejections (# villages with p < 0 . 05 ) by attribute and tolerance on group-sp ecific mean degrees ( ± 5% , ± 10% , ± 20% ). A ttribute Category ± 5% ± 10% ± 20% Gender M–M (assort.) 53 136 131 F–F (assort.) 56 111 45 M–F (dissort.) 0 0 0 Religion Catholic–Catholic (assort.) 101 94 66 Protestan t–Protestant (assort.) 100 101 92 Other–Other (assort.) 14 14 12 Differen t Religions (dissort.) 0 0 0 Marital status Married–Married (assort.) 9 11 33 Single–Single (assort.) 6 6 3 Married–Single (dissort.) 4 4 3 Education High–High (assort.) 10 9 18 Lo w–Low (assort.) 4 2 3 High–Lo w (dissort.) 5 6 5 Age Old–Old (assort.) 1 0 0 Y oung–Y oung (assort.) 2 6 32 Old–Y oung (dissort.) 22 20 15 Income sufficiency Sufficien t–Sufficient (assort.) 0 0 0 Insufficien t–Insufficient (assort.) 0 0 0 Sufficien t–Insufficient (dissort.) 0 0 0 Indigenous (binary) Indigenous–Indigenous (assort.) 16 16 17 Non-Indigenous–Non-Indigenous (assort.) 15 9 5 Indigenous–Non-Indigenous (dissort.) 0 0 1 22 Figure 5: Dy ad-level assortativity in friendship ties (W av e 1). F or eac h village, w e fit dyad-lev el logistic regressions predicting the presence of a friendship tie from attribute similarity . Panels report village-sp ecific o dds ratios (p oints) with 95% confidence in terv als for eac h attribute; villages are ordered by the odds ratio within each panel. Red p oints indicate villages where the similarit y coefficient is statistically significant ( p < 0 . 05 ). The dashed horizon tal line marks OR = 1 (no asso ciation). See T able 20 for corresp onding numerical details. 23 T able 20: F riendship (W a ve 1): degree-aw are permutation rejections (# villages with p < 0 . 05 ) b y attribute and tolerance. A ttribute Category ± 5% ± 10% ± 20% Gender M–M 170 0 0 F–F 168 0 0 M–F 0 0 0 Religion Catholic – Catholic 105 96 85 Protestan t – Protestan t 118 112 105 Non – Non 31 27 22 Differen t Religions 0 1 1 Marital status Not Single–Not Single 120 118 130 Single–Single 117 95 51 Not Single–Single 0 0 0 Education High–High 83 88 84 Lo w–Low 64 30 19 High–Lo w 0 0 0 Age Old–Old 93 87 17 Y oung–Y oung 112 141 167 Old–Y oung 0 0 0 Income sufficiency Sufficien t – Sufficient 34 17 17 Non–Non 44 36 35 Sufficien t – Non 1 2 1 Indigenous (binary) Indig.–Indig. 28 32 32 Non–Non 22 17 8 Indig.–Non 1 0 0 24 Figure 6: Dy ad-level assortativity in friendship ties (W av e 3). F or eac h village, w e fit dyad-lev el logistic regressions predicting the presence of a friendship tie from attribute similarity . Panels report village-sp ecific o dds ratios (p oints) with 95% confidence in terv als for eac h attribute; villages are ordered by the odds ratio within each panel. Red p oints indicate villages where the similarit y coefficient is statistically significant ( p < 0 . 05 ). The dashed horizon tal line marks OR = 1 (no asso ciation). See T able 21 for corresp onding numerical details. 25 T able 21: F riendship (W a ve 3): degree-aw are permutation rejections (# villages with p < 0 . 05 ) b y attribute and tolerance. A ttribute Category ± 5% ± 10% ± 20% Gender M–M 53 136 131 F–F 56 111 45 M–F 0 0 0 Religion Catholic – Catholic 109 102 89 Protestan t – Protestan t 118 112 104 Non – Non 27 26 18 Differen t Religions 0 0 0 Marital status Not Single–Not Single 82 92 112 Single–Single 67 50 18 Not Single–Single 0 0 0 Education High–High 66 63 65 Lo w–Low 38 19 13 High–Lo w 0 0 0 Age Old–Old 57 37 3 Y oung–Y oung 87 123 146 Old–Y oung 0 0 0 Income sufficiency Sufficien t – Sufficient 0 0 0 Non–Non 0 0 0 Sufficien t – Non 0 0 0 Indigenous (binary) Indig.–Indig. 23 26 30 Non–Non 20 15 6 Indig.–Non 0 1 1 26 Figure 7: Dyad-lev el assortativit y in financial-help ties (W av e 1). F or eac h village, we fit dy ad-level logistic regressions predicting the presence of a financial-help tie from attribute similarity . Panels rep ort village-sp ecific o dds ratios (p oints) with 95% confidence interv als for eac h attribute; villages are ordered b y the o dds ratio within eac h panel. Red p oints indicate villages where the similarit y co efficient is statistically significan t ( p < 0 . 05 ). The dashed horizontal line marks OR = 1 (no asso ciation). See T able 22 for corresponding n umerical details. 27 T able 22: Financial (W av e 1): degree-a ware permutation rejections (# villages with p < 0 . 05 ) by attribute and tolerance. A ttribute Category ± 5% ± 10% ± 20% Gender M–M 53 136 131 F–F 56 111 45 M–F 0 0 0 Religion Catholic – Catholic 95 91 76 Protestan t – Protestan t 99 93 81 Non – Non 7 7 6 Differen t Religions 1 1 1 Marital status Not Single–Not Single 58 57 65 Single–Single 52 40 18 Not Single–Single 0 0 0 Education High–High 38 31 30 Lo w–Low 27 14 9 High–Lo w 2 1 0 Age Old–Old 40 24 4 Y oung–Y oung 58 72 101 Old–Y oung 0 0 0 Income sufficiency Sufficien t – Sufficient 26 22 13 Non–Non 26 20 20 Sufficien t – Non 4 3 3 Indigenous (binary) Indig.–Indig. 17 20 19 Non–Non 13 12 6 Indig.–Non 0 0 0 28 Figure 8: Dyad-lev el assortativit y in financial-help ties (W av e 3). F or eac h village, we fit dy ad-level logistic regressions predicting the presence of a financial-help tie from attribute similarity . Panels rep ort village-sp ecific o dds ratios (p oints) with 95% confidence interv als for eac h attribute; villages are ordered b y the o dds ratio within eac h panel. Red p oints indicate villages where the similarit y co efficient is statistically significan t ( p < 0 . 05 ). The dashed horizontal line marks OR = 1 (no asso ciation). See T able 23 for corresponding n umerical details. 29 T able 23: Financial (W av e 3): degree-a ware permutation rejections (# villages with p < 0 . 05 ) by attribute and tolerance. A ttribute Category ± 5% ± 10% ± 20% Gender M–M 53 136 131 F–F 56 111 45 M–F 0 0 0 Religion Catholic – Catholic 95 90 81 Protestan t – Protestan t 98 92 84 Non – Non 15 12 13 Differen t Religions 0 0 1 Marital status Not Single–Not Single 33 34 55 Single–Single 27 24 10 Not Single–Single 1 0 0 Education High–High 27 21 18 Lo w–Low 23 10 7 High–Lo w 3 1 4 Age Old–Old 25 7 1 Y oung–Y oung 36 51 79 Old–Y oung 3 1 0 Income sufficiency Sufficien t – Sufficient 0 0 0 Non–Non 0 0 0 Sufficien t – Non 0 0 0 Indigenous (binary) Indig.–Indig. 19 16 16 Non–Non 14 11 5 Indig.–Non 0 1 1 30 Figure 9: Dyad-lev el assortativity in adversarial ties (W a ve 1). F or eac h village, we fit dy ad-level logistic regressions predicting the presence of an adv ersarial tie from attribute similarity . Panels report village-specific o dds ratios (p oints) with 95% confidence in terv als for eac h attribute; villages are ordered by the odds ratio within each panel. Red p oints indicate villages where the similarit y coefficient is statistically significant ( p < 0 . 05 ). The dashed horizon tal line marks OR = 1 (no asso ciation). See T ables 24 for corresp onding numerical details. 31 T able 24: A dversarial 1: degree-aw are p ermutation rejections (# villages with p < 0 . 05 ) by attribute and tolerance. A ttribute Category ± 5% ± 10% ± 20% Gender M–M 76 136 131 F–F 77 111 45 M–F 0 0 0 Religion Catholic – Catholic 6 5 7 Protestan t – Protestan t 4 4 2 Non – Non 1 0 1 Differen t Religions 4 6 7 Marital status Not Single–Not Single 34 33 28 Single–Single 36 35 25 Not Single–Single 1 0 0 Education High–High 15 18 14 Lo w–Low 14 10 3 High–Lo w 2 3 3 Age Old–Old 52 34 20 Y oung–Y oung 54 54 59 Old–Y oung 0 0 0 Income sufficiency Sufficien t – Sufficient 1 1 0 Non–Non 2 2 1 Sufficien t – Non 4 5 5 Indigenous (binary) Indig.–Indig. 3 3 4 Non–Non 4 4 2 Indig.–Non 0 0 0 32 Figure 10: Dy ad-level assortativit y in adv ersarial ties (W av e 3). F or eac h village, we fit dyad-lev el logistic regressions predicting the presence of an adv ersarial tie from attribute similarity . Panels report village-specific o dds ratios (p oints) with 95% confidence in terv als for eac h attribute; villages are ordered by the odds ratio within each panel. Red p oints indicate villages where the similarit y coefficient is statistically significant ( p < 0 . 05 ). The dashed horizon tal line marks OR = 1 (no asso ciation). See T able 25 for corresp onding numerical details. 33 T able 25: A dversarial 3: degree-aw are p ermutation rejections (# villages with p < 0 . 05 ) by attribute and tolerance. A ttribute Category ± 5% ± 10% ± 20% Gender M–M 53 136 131 F–F 56 111 45 M–F 0 0 0 Religion Catholic – Catholic 8 7 5 Protestan t – Protestan t 7 7 6 Non – Non 3 3 2 Differen t Religions 3 4 5 Marital status Not Single–Not Single 16 10 4 Single–Single 16 10 8 Not Single–Single 0 0 1 Education High–High 9 7 11 Lo w–Low 8 7 1 High–Lo w 1 1 2 Age Old–Old 15 13 4 Y oung–Y oung 15 16 15 Old–Y oung 2 1 2 Income sufficiency Sufficien t – Sufficient 5 4 1 Non–Non 5 5 4 Sufficien t – Non 3 3 4 Indigenous (binary) Indig.–Indig. 3 2 3 Non–Non 2 1 1 Indig.–Non 0 0 0 C In terv en tion and Data Collection Timeline Study Region The study region cov ered more than 200 square miles of mountainous terrain near the Guatemala b order, with an estimated p opulation of roughly 92,000 residents. Out of 238 identified towns and villages, 176 were selected on the basis of population size, accessibilit y , and safety . The adult population in these study villages w as estimated at 32,800 individuals. All p ersons aged 12 years or older, living or working in the study villages, w ere eligible at baseline. Individuals unable to provide consen t due to cognitive impairmen t w ere excluded. Recruitmen t Prior to launching fieldw ork, we mapp ed settlemen ts in the region to capture terrain, rainfall patterns, and distances to health facilities. A photographic census w as then conducted using tablet-based softw are. Photos, GPS co ordinates, and demographic details (age, sex, marital status) were recorded for all residents. Out of an estimated 32,800 eligible individuals, 93% (30,422) consented to b e included in the census. Village-level participation ranged from 55 to 627 resp ondents, with households a veraging 2.8 participan ts. Key descriptive characteristics w ere as follows: mean village size was 173 individuals (range 55–627), mean household size w as 2.8 (range 1–13), and mean age w as 33 (range 12–94). Fifty-four percent w ere women and 58% reported b eing married or living as married. 34 T able 26: Baseline Census Demographics, N = 30 , 422 Characteristic Mean Range Village size 173 [55 – 627] Household size 2.8 [1 – 13] Age (years) 33 [12 – 94] W omen 54% — Married / living as married 58% — T able 27: Baseline Cohort Characteristics, N = 24 , 812 Characteristic V alue Age (years) 33 [12 – 93] W omen 58% Married / living as married 58% Less than primary education 70% Religion: Catholic 51% Religion: Protestant 32% No religion 16% Indigenous 12% Self-rep orted general health fair/p o or 44% Self-rep orted mental health fair/po or 40% Timeline of Data Collection W a v es W e describ e the timeline of the data collection and eac h wa ve: • W av e 0 (Jun 2015–Dec 2015): Photographic census of 176 villages; 93% cov erage of residents aged 12+ ( N = 30 , 422 ). • W av e 1 (Oct 2015–Jun 2016): Baseline survey with socio cen tric net work mapping, health attitudes, and b eha viors ( N ≈ 24 , 700 ). • W av e 2 (Jan 2018–Aug 2018): Interim surv ey 12 mon ths into in terven tion; up dated lo cations and statuses ( N ≈ 21 , 500 ). • W av e 3 (Jan 2019–Dec 2019): New census of adults 15+, follow ed b y endline survey with net works, health, and b ehaviors ( N ≈ 22 , 500 ). Field Op erations More than 100 lo cal enumerators w ere trained to (i) build infrastructure and conduct preliminary data collection, (ii) recruit participants and conduct census enumeration, and (iii) administer surveys and interviews. F our field offices w ere established in strategic lo cations to minimize trav el time. Each office was equipp ed with tablets, netb o oks, printers, high-sp eed internet, and lo cal servers for secure data transfer and synchronization. Enumerators receiv ed in tensive training on instrumen ts and soft ware b y U.S.-based project managers and w ere supervised daily b y Honduran co ordinators. Comm unity Engagemen t P artnerships w ere developed with m unicipal and health authorities, and meetings were held with health staff and comm unity health work ers. The Ministry of Health reviewed and appro ved all study protocols, consen t pro cesses, and instrumen ts. Village leaders and indigenous councils were engaged in adv ance to presen t study objectives before recruitmen t and data collection. 35 Missing Data and A ttrition Among the ∼ 32,800 eligible individuals, 93% consented to participate, reducing baseline non-resp onse bias. W e attempted to recontact and track participan ts who mov ed within the region during follo w-ups. Of 5,633 randomized households, 4,861 (86%) had at least one resp ondent complete the endline survey . Attrition did not differ by treatmen t status ( χ 2 (1 , N = 5633) = 0 . 80 , p = 0 . 37 ). D Inclusion Criteria Resp onden ts w ere included in analyses if they met the following criteria: (a) they completed all applicable survey forms, (b) they were enrolled in the census and participated in the questionnaire of either W av e 1 and W a ve 3 surv eys. 36
Original Paper
Loading high-quality paper...
Comments & Academic Discussion
Loading comments...
Leave a Comment