A complete data processing workflow for CryoET and subtomogram averaging
Electron cryotomography (CryoET) is currently the only method capable of visualizing cells in 3D at nanometer resolutions. While modern instruments produce massive amounts of tomography data containing extremely rich structural information, the data …
Authors: Muyuan Chen, James M. Bell, Xiaodong Shi
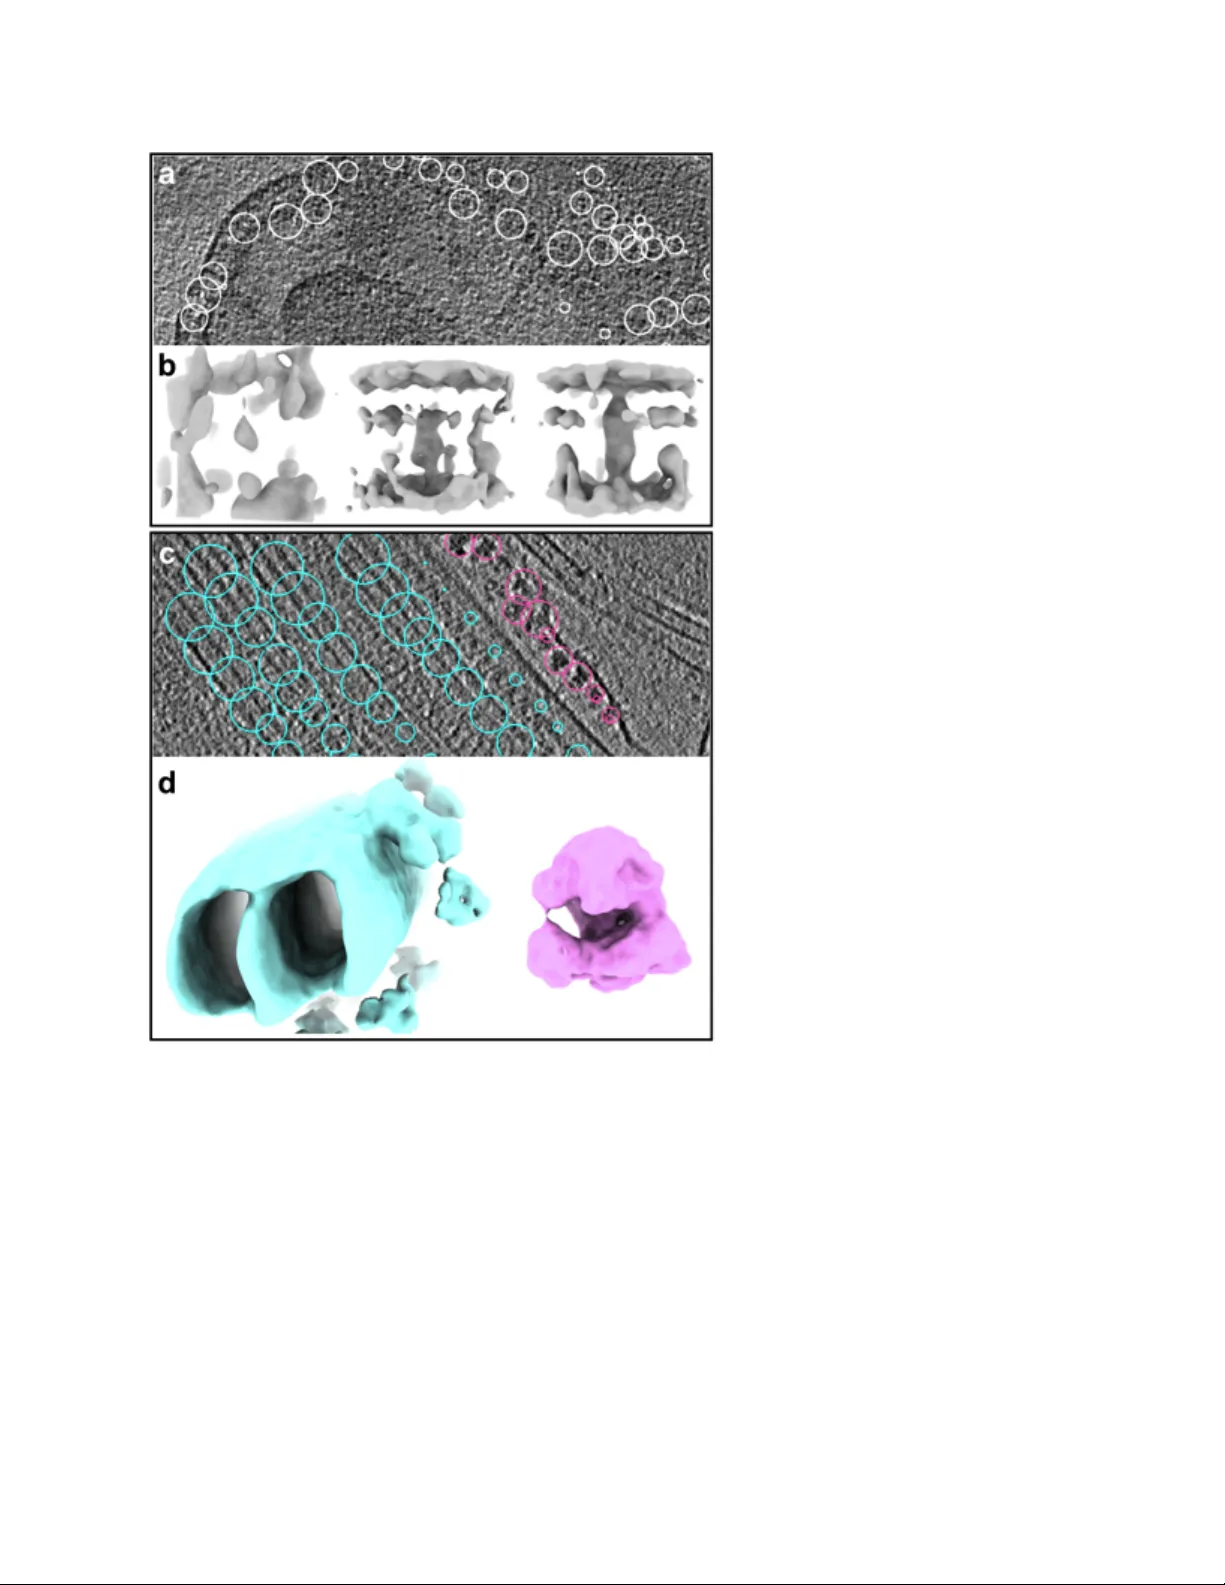
1 A complete data proce ssing workf low for C ryoET and su btomogram averaging Muyuan Che n 1 , Jame s M. Be ll 1,2 , Xiaod ong Sh i 1,3 , Stella Y . Sun 4 , Zhao Wang 1 ,5 , Steve n J. Ludtke 1 ,5 1 Verna Marr s and McL ean Depart ment of Bioc hemistr y and Mol ecular Biol ogy, Baylor Co llege of Medicine, Houston, Texa s, USA 2 Quanti tat ive and Computa tio nal Bios cienc es Gr aduat e Pr ogra m , Bay lor Colleg e of Medic ine, Houston , Te xas, USA 3 Ji angsu Province Key Laboratory of Anesthesi ology and Jiangsu Province Key Laborator y of Anesthesi a and Analgesi a Appl icati on, Xu zhou Medic al Uni versity, Xuzhou, Jiangsu, China 4 Depart ment o f Bioengi neerin g, St anford Univers ity, Stanf ord, Calif ornia , USA 5 CryoEM Co re at Bay lor Coll ege of Medi cine, Hous ton, Texas 77030 , USA. Abstra ct Electr on cry otomograph y (CryoET) is currently t he only method capable of visualizi ng cells in 3D at nanometer resoluti ons. While modern instruments produce massive amounts of tomog raphy data containing extremely rich struct ural information, the data p rocess ing is ve ry labor in t ensive and r esults are often l imited by the ski lls of the per sonnel rather than t he data . W e present an int egrated workfl ow that covers the entire tomography data pr ocessing pi peline, from a utoma ted tilt serie s alignm ent to s ubnan omete r resolu tion sub tomog ram averaging . This workfl ow gr eatl y r educes human eff ort and increases t hroughput, and is capabl e of det ermining protein st ructures at stat e - of - the - art resolutions f or both purifi ed macromolecules and cells. 2 Introdu ction Electr on cry omicrosco py (Cr y oEM) is rapi dly becoming the standard tool f or near atomic resolution struc ture determ ination of purified b iomolecule s over 50 kD a. Howe ver, for studies o f molec ule s wi th in cel ls or pur if ied mol ecul es th at exhi bi t s ign if ica nt conf or mati onal v ari abi li ty, electron cryotomography (CryoET) is t he preferr ed method 1 . In these expe riments , the specimen is tilt ed within the microscope pr oviding 3D information about each molecule and permitting overlapping densities, such as those found in the crowded cellul ar cytosol , to be isolate d . Whil e rec ent micr osc ope and dete cto r advances have greatly boosted the throughput of CryoET data coll ection, substantial human effor t and computat ional r esources are s till required to process recorded imaging data. Especiall y in c ellular tomography proj e cts, data processi ng has become a major bot tleneck i n studying high - resolution pro tein structures. To expedit e cell ular t omography data processi ng, we pr esent a complete t omography workf low as part of the EMAN2 envi ronment that performs al l steps within the standard Cry oET data processing pi peline, from the r aw til t series alignment through subtomogram aver aging. Whil e many of the se tool s are bas ed o n d ecade s o f d evel opmen t by ma ny gro ups 2– 10 , nume rous innov ations h ave b een in troduce d to re duce h uma n interv ention and im prove the re solution of the final a verag e. Thes e includ e a fully a utoma ted tilt - series alignment method not requiri ng fiducials, r apid 3D re construction using direct Fourier methods with t iling, an opt imization - based strategy for per - particle - per - tilt CTF corre ction, ro bust initial m odel g enera tion, and per - particle - per - tilt orienta tion refine ment (F ig. 1a) . In ad dition to a lgorithm deve lopme nt, this proto col also include s a us er - frien dly grap hical inte rface an d a spe cially de signed book - keeping system for cellular tomography that allows users to st udy multiple features within one dataset, and to keep track of p articles to correlate structura l findings w ith the lo cation o f protein s in the ce llular environment. Our i nte grat ed pi pel ine sign ifi cant ly incr eases the th rough put of CryoET data pro cessi ng and i s capable of achieving the state - of - the - art subtomogram averaging results on both puri fied and in situ samples. We demonstrate subnanometer resolution from previ ously published datasets 11 , and cel lular tomo graph y of wh ole e. coli over - expressing a double - layer sp anning mem bran e protein at 14 Å r esolution. Result s Automated til t ser ies alignme nt and tomogr am recon struct ion The fir st st age of t he tomogram pr ocessing workflow is ti lt - series al ignmen t. Our m etho d uses an iterat ive landmark - based appr oach with progressive downsampli ng and outl ier el imination (Fig. 1b) . It wo rks we ll on a w ide rang e of tom ogram s with o r withou t fiducials a nd with out any human intervent ion. The method begi ns wit h a coar se, cross - correlation based ali gnment of a downsampled tilt series, and a rough est imate of the ori entation of the tilt axi s via common line methods. The 3 input tilt s eries a re dow nsam pled to 512x 512 p ixels irre spect ive of th eir origin al size or sampling. B ased on t he coarse ali gnment, an initial tomogram is generated, despite t he likelihoo d of sig nifican t alignm ent er rors, an d 3D la ndm arks a re selec ted fro m the resulting volume to use in the next stage of alignment. These landmarks are si mply the N darkest voxels in the d owns ample d ma p, with a minim um distanc e con straint (F ig. 2b ). W hen fiducia ls are present in the data, they wi ll t end to be selected as landmarks, as long as they are suf fici ently well - separated, but they are explici tly identi fied as such. Th e next st ep is the iterative alignm ent. This includ es two steps: refinem ent of landm ark coordinates and optimizati on of the ti lt images transforms. Fi rst, 3D coordinates of the selected landm arks a re pro jected b ack to the tilt se ries, an d corre spond ing 2D patches are ext racted from th e tilt image s. Loca l subtom ogra ms are recons tructed fro m the s ub - tilt series of each landm ark, to provid e a m ore acc urate c enter o f mas s for ea ch. Th en, 2D patch es are re - extracted from the tilt im ages u sing the refined landm ar k positions, and calculate the translatio nal align ment th at cen ters eac h landm ark in e ach extr acted 2 D patch . A globa l optimizati on algori thm is used to adjust the 3D tilt transfor ms such that center of all landmarks in 2D patches match the proj ected coord inates of th e land marks to the g reates t poss ible ext ent. Wit h t he se imp rov ed al ign ment p ara met ers , a new to mogr am is ge ner at ed wit h bet te r al ign ment which is used d urin g the next ro und of re proje ctio n and ali gnment. To impro ve co nvergen ce an d increa se the speed of alignment, the process begin s with highl y down sampled image s and gradually i ncreases sampli ng as ali gnment error decreases, f inishing with t he unbinned t ilt series in the final it eration. A specif ied fraction of the worst matching l andmarks is nor mal ly excluded in each iter ation, and this is cri tical to obtai ning a sel f - consistent consensus alignment. In mos t tomog rams it is conve nient for s lice - wise vi sual izat ion and ann otat ion if the X - Y plane is parallel to the ice surf ace. It is assume d tha t on average the landmarks will be coplanar wit h the ice, an d thus this plan e is rotate d to be come flat, bas e d on princ ipal component analysis of the landm ark co ordina tes (Fig . 2 e). Tomogram reconstr uction is per formed usi ng direc t Fouri er inve rsion r ather t ha n real - space metho ds such as fi lt ere d ba ck pro ject io n 2 or SIRT 12 . Fourie r metho ds hav e grad ually be come the stan dard in single particle recon struction , but d ue to th e size o f tomo graph ic volu mes a nd concerns about edge effects and image anisotropy, most tomography software still uses real space methods 9,13 . We h ave ad opted a Fourie r recon struction a pproa ch using overlap ping tiles , which signi fi cantl y r educes edge effe cts and memor y r equir ements, whi le s til l r emaini ng computationally effi cient. For conven ience, the t ile size is define d by th e reco nstructio n thickne ss, such that eac h tile is a cu be. Th e overla pping tile s are ind ividually re constru cted, then a verage d toge ther usin g a we ighted a verag e with a G aussia n falloff (Fig . S1). Although the til t ser i es ali gnment is performed using the ori ginal f ull - sized images, the reconstruc ted tomog rams are n ormally dow nsamp led to provide sufficient resolution for visual inspec tion, an notatio n, and particle selectio n, wh ile dram atically impro ving in teractiv ity and decreasing syst em requirements. For subtomogram av eraging, t he parti cle data is automati cally extracted from the or iginal tilt images to take advantage of the full sampling of the ori ginal dat a. The combined a lignment and reconst ructi on algori thm is quite rapid, typically requiring only ~ 10 4 minut es on a 1 2 - core workstation for full - resolution alignme nt of a 60 ima ge 4k x 4k tilt series with a 2k x 2 k x 512 do wnsample d rec onstr ucti on (Table S1) . S ince th is is com parable to the time req uired fo r tilt series a cquisition, it would be feasi ble to incl ude this as an automated process during data col lection. As a t est of thi s pro cess, we recon struct ed a c ellul ar t omogram of e. coli over - expressi ng Tolc - A crAB (F ig. 2 a , Su pplem ent ary video 1 ) 14 . The im prove d alignm ent afte r this iterativ e proce ss c an be observed by compari ng the r econstructi ons of f iducials before and after t he iter ative process. I nternal c ellular features are also clearly visible in the reconstructi on. In fiducial less reconstruc tions, the progra m usually c hooses sm all pieces of ice contamination or other high - densi ty objects a s landm arks (F ig. 2d ). For fidu cialless apoferritin d ata (EMP IAR - 10171) 15 , the program produced hi gh qualit y reconstr uctions where individual protei ns were clear ly visi ble (Fig. 2 c , S upplem enta ry video 2 ). Multi ple metho ds f or parti cle loc ali zati on Earli er ver sions of EMAN2 i nclude d a gr aphical progr am for manuall y sel ecting 3D par ticl es using orthogonal sli ces 16 . In the late st versio n, this pa rticle pickin g interfa ce has b een re worked , enabling users to si multaneously sel ect and visual ize part icles of multipl e types and differ ent sizes withi n eac h to mogram ( Fig. 3 a,c ). Each type is then extra cted into a sep arate stack of 3 D particles and accompanying 2D subtilt series, with t he origi nal locat ion metadata retained f or later pe r- particle processi ng. In add ition to the manu al 3D p icking inte rface, tw o sem i - automatic tools ar e provided f or annotation and selecti on. For pur ified macromolecules imaged by tomography, a template match ing al gor ith m ca n be us ed t o rapi dl y l ocat e part ic les. For m ore c omp lex tom ogram s, ou r convolutional - neural - network - based t omogram annotation tool can be used to identif y feature s 17 , followe d by a s econd stage w hich co nverts a nnota tions into subtom ogram coordinates. For globul ar particles like ribosomes, the pr ogram locates and centers isol ated annotations. For conti nuous struct ures li ke microtubul es and prot ein arrays on membranes, t he program randomly samples coordinates within the set of annotat ed voxels, with a specified mini mum d ist anc e be twee n bo xes. Th e pa ramet er s of t hes e s emi - automati c tasks can then be tuned by visua lizin g results in the manual parti cle picki ng tool. Per - particle - per - tilt CTF correction Accurate CTF measur ement and corr ection is criti cal for obtaini ng hi gh - resolution structu res throug h subto mogra m av eraging . The m ost com mon ly used metho d in tom ograph ic CTF correction is the simple til ed CTF correction of rect angular strips within each til t series 18 . This metho d i s e ff ect ive in get ti ng past t he fi rst CTF ze ro - crossing when wo rking with thin layers of purified macromolecules; however, when worki ng with cel lular data or other thi cker specimens, the erro r in defoc us due to the Z position of the pa rticle within the ice b ecome s significa nt and requires m ore accura te correction on a per - particle per - tilt basis. In the n ew CT F estim ation stra tegy, the entire tilt im age is u sed to d etermin e its cen tral defocu s, by split ting t he image int o til es and summing the informati on from t he entir e im age to estima te the de focus. To do this, we f ind the de focus value 𝑑 that m aximiz es 𝑆 ! ( 𝑝 ! , 𝑑 + 𝑥 ! 𝑠𝑖𝑛 𝜃 ) ! , 5 where 𝑥 ! is the 𝑥 position of t he 𝑖 th tile ( 𝑦 is the tilt a xis), 𝜃 is the tilt an gle, an d 𝑆 ! ( 𝑝 , Δ 𝑧 ) is the score function represented by the normalized dot product between a theoretical CT F curve with defocus Δ 𝑧 and the coherent , background subtracted power spectrum, 𝑝 , o f the 𝑖 th strip of t iles parallel to the tilt axis. With thi s approach, the inf ormation i n the f ull t ilt i mage is used to esti mate one scalar value and ach ieve more robus t defoc us estim ation in low S NR c onditio ns. At hi gh ti lt, the SNR in an indi vidual image is t ypical ly s o low that even us ing al l i nformat ion i n the ima ge is no t sufficien t to provid e an u namb iguous defocu s estima tion. Thu s, for the h igher ti lts, only defoc us valu es with in three stand ard de viation s arou nd the mean defoc us of th e low tilt image s are co nsidere d. With this add itional con straint, re asona bly accu rate defo cus va lues can be determined at high t ilt. After CTF det erminati on, full y samp led CTF c orrecte d sub tomo grams are ge nerate d direc tly from th e raw tilt se ries. Sinc e we h ave the alignm ent pa ramete rs for eac h micro graph in the tilt series and the coordinat es of particl es in the tomogram, we can extract per - particl e til t series , which w e hencefort h refer to as a set of subtil ts from 2D micrographs. The center of each subt ilt is dete rmine d by pr ojecting the 3D coord inates of the p article u sing th e trans form o f the micr ogr aph cal cul ated f rom ti lt ser ie s al ig nment , so each sub ti lt ser ie s c a n be recons tructed t o an unbinned 3D par ticle using the corresponding tilt image transf orms. From t hese defocus values at the center of each tilt, the defocus of each til t for each particl e can be determined f rom the 3D location of the pa rticle and the til t- series geometry (Fig. S2). After subtilt i mages are extracted from the t ilt series, we fli p the phase of each subt ilt according t o its determined defocus befor e reconstruct ing the subtilt into CTF corrected 3D subtomograms. Initial mo del gen eration v ia s tochastic gradient des cent In man y cellula r tomog raphy projects , the iden tities of ex tracted p articles a re unkn own b efore subtomogram averaging. While it is possible to use cat alogs of potential candidate structur es and exhaustivel y compare part icles t o ea ch of these f or purposes of identi fication 19 , there a re many shor tco ming s t o t hi s a ppro ach, i ncl udin g t he need fo r a co mple te cat alo g, the pr obl em o f model bi as, an d t he dif fi cul ty of hand li ng compl exes . An u nbi ased app roac h w ould be to cl ass if y partic les de - novo and generate independent init ial models for each class f rom the raw particles . Our p revi ous subto mogram avera ging metho d of fer ed se veral di ff erent st rat egies fo r ha ndli ng this issue , as the fa ilure rate was su bstantia l. We h ave no w dev eloped a stochastic gr adient descent (SGD) based initi al model gener ation prot ocol 20 , which produc es reliab le initial mo dels even from cel l - derived part icles. SGD is a n opti mizati on tec hnique widely u sed in the training of machine learning models, which offers adv antages in both speed and avoidance of local mini ma. We begin wi th an ef fectivel y random ized map , produced b y averagin g a random subset of pa rticles in random orientations , lowpa ss filtere d to 100 Å. I n each iter ation, a bat ch of randoml y sel ected parti cles a re al igned to the refe rence m ap, an d a ne w ma p is gen erated. T his new map is used to update the refe rence using an adj ustable l earning rat e. To avoi d overfi tting, the ref erence is filt ered to a user - specified resoluti on (usually 30 - 50 Å) af ter each upda te. The ali gnment, average and map update steps are repeated until the ref erence map converges to a consi stent i nitial model. As only a l ow - resolutio n initial model is ne eded, it is not critic al that all partic les be used. The 6 program can typi cally produce good ini tial models withi n 1 hour on a typical workstat ion (Table S1) . In testing , this me thod ha s perfo rmed w ell for stru ctures w ith very distinct sha pes fro m a va riety of sources. This i nc ludes g lobula r structu res like riboso mes, lin ear str ucture s such as micr otu bule s, and eve n do ubl e - membr ane spann ing pr ote ins (F ig. 3b ,d ). Subtomogram ali gnment and a veraging There are two stag es in pr oducing a final high - resolution subtom ogram average: tra ditional subtomogram alignment and averaging 5,16 and per - particle - per - tilt refinemen t (Fig. 1c) . Th e i nitial stage makes use of our exi sting subtomogram alignment and averaging algorithms whi ch automaticall y detect and compensate f or the mis sing wedge 6 . The a lignme nt algorith m employs an extremely effi cient hierarchical method, which scales well wit h particle di mensions. The overall r efinement pr ocess foll ows “gold - standard” procedures similar to si ngle particle analysis 21 , in which even and od d num bered particles are pro cessed com pletely independent ly with uniq ue, p hase - randomize d starting mo dels, with a Fou rier shell correlation (FSC) use d to filter the ev en an d odd m aps, a ssess r esolution , and m easur e iteration - to - iteratio n con verge nce. In the se cond s tage, ra ther than workin g with sub tomog rams , we wo rk instea d with su btilt series. When full frame tilt series are aligned, we assume that each tilt is a project ion of a si ngle rigid body vo lume. W ith beam - induce d mo tion, ch arging and ra diation dama ge affe cts the assumption that the speci men remains global ly ri gid across a 1 - µ m span with the lar gest acceptable moti on <10 Å i s an extr emely stri ngent requir ement. Local deviations are common and can produce signifi cant misali gnments of i ndividual objects in indi vidual t ilts. To compensate for th is resolu tion - lim iting effe ct, we h ave d evelo ped a s trategy for refin eme nt on a per - particle - per - tilt basis, whe re the alig nmen t and q uality ass essm ent of ea ch tilt of ea ch particle are indi vidually refined. Effect ively t his is a hybridi zation of subtomogram averaging approaches with tradit ional si ngle parti cle analy sis. Some of these t echniques are similar to those re cently im plem ented in EMC larity 8 . Our s ubti lt ref ineme nt p roced ure star ts from a n existing 3D su btomo gram refinem ent, pre ferably with a r esolut ion of 25 Å or better . Subt ilt seri es for each parti cle we re al ready e xtract ed as part of the CTF correction process above. The iter ative r efinement pr ocess is a straight forward orientati on optimiz ation for each ti lt i mage of each par ticle. All 5 orientat ion parameter s are refined indep endently pe r - particle - per - tilt. It is quite com mon for som e ima ges in a tilt series to be bad, ei ther due t o excessive motion or charging. To compensate for this, the qua lity of eac h tilt for each particle is assess ed, and weigh ted corr espond ingly, w ith the ve ry wors t exclude d entirely. All of the realigned particles are used t o compute a new weighted average 3D map, which is then used for the next it erati on of the ref inement. The subti lt r efinement protocol signi ficantl y improves map quali ty and resoluti on for purif ied samples in thin ice, where relativel y littl e density is pr esent above and below each particle. In the EM PIAR - 10064 dataset ( purified ribosomes) 11 , withou t subtilt refin emen t, subtom ogra m averaging achi eved 13 Å “gol d - standard” resolution ( FSC >0.143) using 3000 parti cles fr om 4 tomog rams . With su btilt refinem ent, the resolutio n impro v ed dramatical ly, t o 8.5 Å (Fi g. 4a -d , 7 Supplementa ry vi deo 3 ). In the averaged m ap, the pitch of R NA helices is clearly visible an d long a lpha - helices are separated . We d id no t exp ect s ubt il t re fi neme nt to wo rk wel l i n a c ell ul ar co nte xt , due t o t he pr ese nce of s o much conf ound ing cel lu lar mas s p res ent in eac h s ubt ilt i mage . S urpr is ing ly, we fo und tha t a n in situ dataset of the doubl e - membran e s panni ng Tol C - AcrAB co mp lex i n e. coli 14 , reache d 19Å i n initial av eragin g, whic h imp roved to 14 Å resoluti on aft er sub til t ali gnment (Fig. 4e , Supplementa ry vi deo 4 ) . We do n ot yet ha ve suffic ient test c ases to s et expe ctations for how well subt ilt ref inemen t wi ll work in any gi ven cell ular syst em, but based on our pr eliminary studies, it may provide a signifi cant improvement in a wide range of experimental situati ons. Discussi on The entir e prot ocol out lined a bove has been integr ated in to the graphical workfl ow in EMAN2.22 (e2projectm anager.p y). This prese nt s the process as a sequence of st eps (Fig. 1 ), and an online t utorial can be found at htt p://eman2.or g/Tutorial s. Graphic al tool s are also provided f or evaluating tomogram reconstruc tions and subtomogram refinement s, which ar e useful for managi ng pro jec ts involvin g a larg e amo unt of data. U nlike sin gle pa rticle an alysis w here it is possible t o transi tion dat a from other tools into EMAN2 at virtual ly any st age of pr ocessing, t he stringent requir ements for all of the metadata generated at each st age of processing make it challenging to, f or example, import a reconst ructed tomogram from other software, t hen proceed. While some tools will be usable on i mported data, such as t he Deep Learning based annotation and simple subt omogram alignment and averaging, the ne w ap proache s, s uch a s subtilt ref inement, are simply not possible unless the complete EMAN2 pipeline i s followed. Wit h p er pa rt icl e CTF co rr ect io n a nd sub ti lt r ef in ement , i t is no w r el ati ve ly st ra igh tf or ward t o achieve ~10Å resolution using 1000 - 2000 part icles f rom a few good til t series. This met hod can also be used with phase - plate data, t hough the di fficul ty of collect ing Volta phase plate tilt series and determining per - tilt CTF para meters with con tinuou sly varyin g pha se shift is significant. While we do opt imize both the def ocus a nd pha se sh ift , pa rti cular ly at h igh til t, ther e is insuf ficient inf ormat ion ava ilable fo r simu ltaneo us dete rmina tion of b oth pa rame ters. O ur suggested approach is to tar get 0.5 - 1 µ m underfocus with such tilt series, to put the fi rst zer o in a ran ge wh ere co rrecting beyo nd the secon d zero is not n ecess ary to a chiev e slightly better than 1 0Å reso lution. In th is way locating th e first zero accura tely is suffic ient for su bnano meter resolution. One di ff icul ty in subto mogram averaging in situ is m askin g and filtration of the a verag ed ma p after each iterat ion of refinement. In t he cellul ar environment, protei ns of i nterest are often surrounded by other strong densit ies and masking can have a strong impact on the final achieved resolution. To addre ss this issue, w e introduce the option of ma sking the av eraged map wi th a lar ge sof t mask and fi lt er it us ing th e l oca l r eso lut ion det er mined f rom even and od d sub - maps. Thi s a ll ows us to keep hi gh - resolution informa tion of the protein of int erest f or the 8 next round of refi nement and reduces misalignment caused by other densiti es surrounding the protein. The algori thmic i mprovements we have discu ssed make it possi ble to perform d ata - driven cellular - structural biology research wit h CryoET . Rese arche rs can ta ke tom ogram s of cells o r purified organelles, manually sel ect a few featur es of unknown i dentity, and automat ically annotate si milar f eatures in the whole dataset. Reliable, de novo ini tial models of t he featur es of interes t can b e gene rated from raw particles w ithout prior know ledge of the proteins. With p er particle CTF correcti on and subti lt r efinement, averaged maps at 10 - 15 Å resolut ions c an be achieved in a matter of days ( Table S1) wit h a few thousand subtomogram par ticles, so one can make rea sonab le hypo thes es of the i dent it y an d c ompos it ion of t he p rot ein s b ased sol el y o n their struc tural fea tures, an d valida te these hypoth eses w ith bioch emica l experim ents. Furthermore, the p osition and ori entati on of ea ch protei n part icle c an be mapped bac k t o the tomog ram to study th e orga nization o f protein s in cells (Fig. 4 f) . Acknowle dgments This work was part iall y supported by NIH grants R01GM080139, P01GM121203 , Welc h Foundation (Q - 1967 - 20180324), BCM BMB department seed f unds , and a Housto n Area Molec ular Bi ophys ics Program ( HAMBP) training grant fr om the Keck Center of t he Gulf Coast Consort ium (GCC, T 32 GM0082 80 - 30). We also would li ke to t hank early users for testing the workfl ow an d pro vidi ng va luabl e fe edbacks . Author cont ribu tions M. C., J.M.B and S.J.L. designed and i mplemented the prot ocol. X.S., Z. W. and S.Y.S. provided test data sets. M .C., J.M.B . and S .Y.S. tes ted and refined th e proto col. M.C ., J.M.B. a nd S.J.L. wrote the manuscr ipt . Data a vail abili ty The subtomogram averages are depositt ed to EMDatabank. EMD - 0529: averaged struct ure of purified ribosome. EMD - 0530: averaged structur e of AcrAB - TolC from cellular to mogra m. Competing fi nancial i nteres ts The authors declar e no competi ng fi nancial interes ts. 9 Figures Fig 1. Workflow. (a) M ain workf low diagram. (b) W orkflow of t omogram reconstructi on. (c) W orkflow of subtomogram r efinement and subtilt refi nement. Generate tomogram Pick landmarks (3D) Coarse alignment Finish: ! 3D To m o g r a m Bin by 8x 4x 2x 1x Refine landmark coordinates Refine alignent parameters Final map Odd map Even map Even/Odd FSC-filter Odd SPT alignment Even SPT alignment Model A Model B Phase randomize Initial model Odd subtilt alignment Even subtilt alignment Odd subtilt reconstruction Even subtilt reconstruction Av e r ag e d map Even subset tilts Odd ! subset tilts Even subset Odd subset Even SPT averaging Odd SPT averaging Odd map Even map Even/Odd FSC-filter Motion correction CTF Phase Flipping Subtomogram refinement Sub-tilt Refinement Initial Model Generation Map back to tomogram Movie frames T omogram Reconstruction Automated Annotation 3D Particle Extraction 2D Particle Extraction 3D Particle Reconstruction To m o g r a m Annotation Alignment parameters Tilt series stack Particle coordinates 2D particles Defocus values Defocus Estimation CTF corrected 2D particles CTF corrected 3D particles Initial model Av e r ag e d map Particle orientation Subtomogram refinement Subtilt refinement a Data collection b Start: Unaligned tiltseries By-tile tomogram reconstruction c 10 Fig 2 . Results of ite rative tom ogra m align ment a nd reco nstructio n (a) Ce llular tom ogram of e. coli with gol d fiducials. (b) S elected landmark proj ections f rom (a) ( left) x - y plane; (mid) x - z plane aft er the f irst iterat ion of t he iter ative al ignment; ( right) x - z plane after iter ative alignment. (c) Tomo gram of pu rified apoferritin witho ut fiducia ls (EMP IAR - 10171). (d) Selected landmark projecti ons from (c) . (e) Automatic spec imen plane al ignment. Lef t: (t op) x - y slice (bot tom ) x - z slice, both bef ore alignment; right : after al ignment. 11 Fig 3 . Particle extra ction an d initial m odel genera tion. (a ) Slice v iew of a e. coli t o mogra m wi th particles of Tolc - AcrAB pump sel ected. (b) I nitial model generati on from Tol c - AcrAB pump particles . From the left to ri ght are densi ty maps of the i nitial seed, af ter 5 i terati ons with c1 symmetry, and after 5 iterations with c3 symm etry. (c ) A tom ogra m slice v iew of th e flagellu m of an anucleated Trypanosoma bruc ei cell , wit h cya n ci rcle s sel ecti ng mi crot ubule doubl ets, and pink cir cle select ing ri bosomes. (d) I nitial model generated from microtubul e (left) doubles and ribosome s (right) . 12 F ig 4 . Sub tomog ram re fineme nt. (a) Subtomogram aver aging of ri bosome ( EMPIAR - 10064) before subti lt r efinement. (b) Subtomogram aver aging aft er subti lt ref inement. ( c) Zoomed - in view of (b) with yell ow arrows pointing to RNA helices and cyan arrows pointing to resolved alpha - helices. (d) Gold - standard FSC curves of the ribosome subtomogram averaging before (red) and afte r (blue) subtilt refinem ent. (e) S ubtomogram averaging of the tolc - acrAB drug pump. (f) Location and orientat ion of t he drug pump par ticles mapped back to a tomogram. 13 References 1. Asano, S. , Eng el, B. D. & Baumeist er, W. In Situ Cryo - Elect ron To mography: A Post - Reducti onis t App roach to Struc tura l Bi ology . J. Mol. Biol. 428, 332 – 343 (2016). 2. Kreme r, J. R., Mastrona rde, D. N. & M cIntosh, J. R . Compu ter visualization of th ree - dimensional i mage data using IMOD. J. Struct. Biol. 116, 71 – 76 (1996). 3. Frangakis, A. S. et al. Identifica tion of m acrom olecu lar com plexes in cryoele ctron tomog rams of phan tom cells. Proc. Natl. Acad. Sci. 99, 14153 – 14158 (2002). 4. Amat, F. et al. Mark ov rand om f iel d based aut omat ic ima ge ali gnmen t f or el ect ron tomog raphy . J. Struct. Biol. 161, 260 – 75 (2008). 5. Hrabe, T. et al. PyTom: A py thon - based tool box for localizat ion o f macrom olecule s in cryo - electron t omograms and subtomogram analysi s. J. Str uct. Biol. 178, 177 – 188 (2012). 6. Galaz - Mon toy a, J. G. et al . Alignment algo rithms and per - particle CTF correcti on for single particl e cryo - electron tomography. J. Struct. Biol. 1 94, 383 – 394 (2016). 7. Bharat, T. A. M. & Scheres , S. H. W. Resolvi ng macromol ecular str uctures from electr on cryo - tomo graph y data u sing su btomo gram averag ing in R ELION . Nat. Pr otoc. 11, 2054 – 2065 (2016). 8. Himes, B. A. & Zhang, P. emClar ity : s oftwar e f or high - resolution cryo - electron tomog raphy and su btomo gram averag ing. Nat. Methods 15, 955 – 961 (2018). 9. Mastr ona rde, D. N. & Hel d, S. R. Aut omate d t il t seri es al ign ment and to mogr aphi c reconstruc tion in IMOD . J. Struct. Biol. 197, 102 – 113 (2017). 10. Nobl e, A. J. & Stagg, S. M. Automated batch fi ducial - less tilt - series alignment i n Appion using Protomo. J. Struct. Biol. 192, 270 – 278 (2015). 11. Khoshouei, M., Pfeff er, S., Ba umeister , W., Först er, F . & Dan ev, R. Subtomogr am analysis usi ng the Vol ta phase pl ate. J. Struct. Biol. 197, 94 – 101 (2017). 12. Gilb ert, P. It erat ive metho ds f or the thre e - dimensional r econstructi on of an object f rom projecti ons. J. Theor. Biol. 36, 105 – 117 (1972). 13. Chen, Y. et al. FIRT: Filt ered it erativ e reconst ruction techniq ue wi th informa tion restoration. J. Struct. Biol. 195, 49 – 61 (2016). 14. Du, D. et al. Struc ture of th e AcrAB - TolC multidru g effl ux pump. Nat ure 509, 512 – 515 (2014). 15. Noble, A. J. et al. Reducing eff ects of part icl e adso rpti on t o t he ai r - water int erfa ce i n c ryo - EM. Nat. Meth ods 15, 793 – 795 (2018). 14 16. Galaz - Mon toy a, J. G., Fl ana gan, J. , Schmi d, M. F. & Ludt ke, S. J. Si ngl e p art ic le tomog raphy in EMA N2. J. Struct. Biol. 190, 279 – 290 (2015). 17. Chen, M. et al. Convol uti onal neura l ne twork s fo r aut omated annot a tion of cellu lar cryo - electron t omograms. Nat. Meth ods 14, 983 – 985 (2017). 18. Xiong, Q., Morphew, M. K. , Sc hwartz , C. L., Hoenger, A. H. & Mastr onarde, D. N. CTF determination and correct ion for low dose t omographic ti lt ser ies. J. Struct. Biol. 168, 378 – 87 (2009). 19. Bohm, J. et al . Toward detec ting and identi fying macromolecules in a cellul ar conte xt: Template matchi ng appl ied to electr on tomograms. Proc. Natl. Acad. Sci. 97, 14245 – 14250 (2000). 20. Punjani , A., Rubin stein, J. L., Fleet, D. J. & Brubake r, M. A. cryoSPAR C: algorithm s for rapid unsu pervised cry o - EM structu re det erminat ion. Nat. Method s 14, 290 – 296 (2017). 21. Henderso n, R. et al. Outc ome of t he f irs t el ect ron micro scopy val idat ion tas k fo rce meeti ng. St ructur e 20, 205 – 214 (2012). 15 Me thods Tomogram reconstruc tion To seed t he iter ative tilt - series alignment, a coarse al ignment is fir st performed. First , the unaligned t ilt series is downsampled to 512 x 512 pix els, subj ect to a real - space ramp filt er, Fourier bandpass f ilter , and no rmali zed to mean value of zero and standard deviati on of one. A coarse alignment is then performed under a soft Gaussian mask. The ali gnment begins with the center tilt image (typicall y near untitled) and propagates sequentially in both directi ons. After t he co arse transl ational alignment, common lines are used to i dentify the ti lt ax is direct ion. Onl y angles 0 - 180 degrees are permitt ed in t his process to ensure no handedness fl ips occur. Although the handedness is consist ent t hroughout the datase t, i t i s not ne cessarily correct due to the 1 80 - degree ambiguity i n the t ilt axis direc tion. If the correct orientat ion of the til t axi s in t he imag es has alread y bee n deter mined for the micro scope , it can b e spec ified ins tead o f performing t he common - lines searc h. Fina lly, the tilt s eries is recons tructed to pro duce th e preliminary tomogram. The 512 x 512 box si ze is small enough, that di rect Fouri er inver sion can be used without til ing. Si nce higher tilt images incl ude informat ion outsi de the f rame of the zero tilt imag e, higher til ts have a proporti onal soft mask is appl ied at the edges of each image parallel to the tilt axis j ust bef ore reconstr uction. After the i niti al tomogram r econstr uction , an iter ative alig nment - reconstruction p rocess is performed beginni ng with 512 x 512 images gradual ly decreasi ng downsampling unt il the fully sampled images are being used (typicall y 4k x 4k). Each i teration begins wit h landmark selection in t he tomogram from the previous iter ation, foll owed by multiple rounds of landmark locati on refinement and ti lt par ameter refi nement as descr ibed above, and ends with the fi nal downsampled tomogram reconstr uction al ong with the opti mized alignment parameters. By default, we perform 2 iterat ions at 512 x 512, and 1 it eration at 1024 x 1024 , 2048 x 2048 and 4096 x 4096. When the input tilt series is lar ger than 4096 x 4096, such as DE - 64 or K2 super - resolution im ages, we o nly perform alignments from 512x 512 to 4096 x 4096. It is worth noting that in all ite rations, re constru ction of th e full tom ogram is always done using the pre - filtered 512 x 512 til t series. These tomograms are only used for select ion of l andmarks, whose locations are later refi ned in subt omograms using the appropriate downsampling. To select landmarks, the 512 x 512 x 256 tom ogram i s furt her binned by 4 by t aking the minimal value of each 4 x 4 x 4 cube and t he result is highpass f iltered. In thi s stage of pr ocessing, it is impo rtant to n ote tha t highe r dens ities ha ve low er valu es in ra w tom ogram s, wh ich is o pposite from th e n ormal EMAN2 convention. Voxel values in the tomogram are sort ed and the program picks voxels separated by a minimal distance as landmarks. By default, 20 landmarks are selected and the dist ance threshold is 1/ 8 of the longest axis of the t omogram. Mult ip le rounds o f landm ark loc ation re finem ent an d tilt para mete r refine ment a re per forme d after l andmark select ion. In each round, we refine the 3D l ocation of landmarks and one of t he alignment paramet ers, inc luding tr anslation, til t axis rotati on, ti lt angl e and off - axis ti lt. Because there is d ifferent u ncertain ty in the d eterm ination o f each p arame ter, we b egin with refinem ents tilt image translatio n and g lobal tilt ax is rotation , then re fine on an d off - axis tilt angles. 16 In landm ark loc ation re fineme nt, we first e xtract su btilt series o f the lan dmark s from th e tilt series and reconstruct the landmarks at the curr ent level of binning. By default, we use box size of 32 f or bin - by - 8 and bin - by - 4 ti lt ser ies, 1. 5x box size for bi n - by - 2 and 2x box size for unbi nned iteration s. We locate the ce nter of la ndm arks by the co ordina te of the voxe l with m inima l value for bin - by - 8 and bin - by - 4 iter ations and by the cent er of mass for bi n - by - 2 and unbinned iteration s. This use o f center - of - mass rat her th an a li gni ng f eat ure s within each l andmark region might s eem t hat i t coul d r educ e a li gnment a ccur acy. Ho wever , a c ommon pro ble m wi th tomog raphic alignm ents is tha t it is possib le to ha ve self - consistent alignments with an incorrect translatio n ortho gonal to the tilt axis , pro ducing dist orted feat ures in reconstruct ions when viewed along the t ilt axi s. Using of center - of - mass fo r a li gnment s eems to la rgel y avoi d t his problem, part icularl y when combined wit h exclusi on of l andmarks which are outlier s in t he alignment proc ess. To refine the align ment pa rameters, w e first project landm ark coord inates to each tilt using currently determined ali gnment, and extract 2D parti cles of the same box size at current bi nning. The center of each 2D parti cle i s deter mined in the same way that 3 D land marks are c enter ed, and the di stance fr om the center of the 2D partic le to the project ion of 3D coordinat es is computed. For each tilt, the Powell opti mizer from Scipy is used t o refine ali gnment parameters and minimize t he averaged di stance fr om all landm arks. B y defa ult, 10% landm arks with the highest aver aged distance in each t ilt are ignored during t he optimizat ion. The averaged error per til t is also used in the following round of landmark locat ion refi nement and tomogram reconstruc tion where 10 % of tilt images with hi ghest err or are excl uded. After all the r efin ement it erati ons ar e fi nished, the fina l to mogram is reconst ructe d. When reconstruc ting the tomo gram by tiling, w e use a tile leng th of 1/4 the tom ogram len gth and pa d the 3D cube b y an e xtra 40% during reconstructi on. The step si ze between the ti les is 1/8 tomog ram le ngth, an d ove rlapping tiles are s hifted by half tile in x a nd y. 2D tiles are s ubjecte d to an e dge de cay m ask alo ng x - axis like t he mask used i n the f ull t omogram reconstruct ion. After reconst ructi on of each til e, a mask wit h Gaussi an fal loff is appli ed to subvol umes befor e they ar e inserte d into the final reco nstructio n. The m ask is describe d by 𝑓 = 1 + 𝑒 ! !" ( ! ! ! ! ! ) − 𝑒 ! !" ( ( !"# ! ! ! . ! ) ! ! ( !"# ! ! ! . ! ) ! ) , w here 𝑥 , 𝑦 are the coordinate of the vox el from t he center of ti le, r anging from - 1 to 1. This specific shape of mask i s used so the summed weight in each voxel i n the tomogram is 1, and the soft G auss ian falloff re duces the edg e artifacts from the reco nstruction of each ti le. Af ter reconstruc tion, the tiles are clippe d and add ed to the final volu me to prod uce the final tomog ram. T his entire proces s require s on the ord er of 10 minut es per t omogram (Table S1). Initial mo del gen eration fo r subtom ogram ave raging In the sto chastic gradien t desce nt base d initial m odel ge neration proce ss, we u se a ve ry sma ll batch size (12 parti cles per batch by default) and a lear ning rate of 0.1 to int roduce enough fluctuatio ns into th e syste m. The list of inpu t particles is shuffled before grouping into batches. Partic les may be opt ional ly downs ampled an d lowpas s fi lter ed befo re al ignment. Parti cles in t he first batch are ave raged in rand om orie ntations to produ ce a m ap wh ich is then filtered to 100Å 17 and used as t he init ial al ignment refer ence, which will have roughly t he correct radial density profile, but meaningl ess azimuthal infor mation. I n each subsequent batch, par ticles are ali gned to the re ference and a n avera ge is ge nerate d. Any e mpty re gions re mainin g in Fou rier spa ce is filled with in forma tion from corresp ondin g Fourie r regions in the cu rrent refe rence. W e calcu late the pe r voxel d ifference betwe en the r eferenc e and th e new avera ged m ap and update the reference to ward the av erage by the learning rate. T he program go es through only 10 batches in eac h iteratio n by d efault, e xcept the num ber o f batch es is d oubled in the f irst iteratio n. The first iteration is longe r becau se wh en sym metry is specifie d, the pro gram a ligns the referenc e to the sym metry axis afte r each ite r ation, and it is necessary to have a map with cor rect l ow resolution fea tures to perform a symm etry searc h stably. Subtilt refine ment The fir st st ep of sub tilt refi nement is to compute the or ientati on of each subti lt using th e orientati on of t he subtomogram and t he alignment of ti lt i mages in the tomogram. The refinemen t starts from 32 randomly distributed orienta tions centere d around the previous orientati on. One of the ini tial positions is al ways the previ ously det ermined orient ation so the worst - case answer i s no change. From these positions, an iterati ve search is performed star ting from F ourier bo x size 6 4 to full bo x size, sim ilar to the subtom ogram refinem ent. D uring th e refinemen t, the reference map is proje cted using Fo urier space s licing with Gau s sian interpo lation. T he co mpar ison be tween the pr ojection and th e 2D p article is score d with C TF weight ed Fou rier ri ng co rrel atio n fo r co mparis on. We r ef ine e ven/ od d p art i cle s ets i nde pend ent ly i n the s ubt il t re fi neme nt. B y d ef aul t, t he pr ogr am uses all tilt image s and re move s the 50 % of p articles w ith the w orst scor e, gene rally correla ting with ti lt angles . Th ere i s al so an opt ion provi ded to ex pli citl y ex clude high angl e t ilt imag es. We also remove subt ilt particl es with sc ores beyond 2 - sigma around the mean , b ecau se p rac ti call y, particles with ver y high al ignment scores often cont ain high contrast objects such as gold fiducials, a nd low score p articles a re often at the ed ge of th e microg raph a nd has little signal. Before insert ing the i mages to the 3 D F ourier volume, we nor malize thei r scores to (0, 1) and weight th e par ticl es b y th eir score s when reco nstru cti ng th e 3D averag e. Th e 3D volume is padded by 2 t o avoid edge artifac ts, and reconstructi on is performed with Gaussian int erpolati on with vari able w idth with respec t of Fo urier rad ii. The a verag ed m ap is filte red by the “go ld - standard” FSC. Processing of example data set s We p roc ess ed th e 4 “ mix edCT EM” f rom th e EMPI AR - 10064 puri fied ri bosome dataset. The tomog rams were re constru cted from the tilt s eries automatical ly using default parameters. 3239 particles were select ed via t emplate matchi ng followed by manual bad - particl e removal. Defocus val ues we re ca lcul ated using def ault opt ions and t he r esult ing defo cus v alues range from 2 .4 to 3.7 µ m . CTF - co rrected sub tomogra ms were generated with a box size of 180. An initial m odel w as pro duced using all partic les as in put, w ith 3x d owns amplin g and a targe t resolution of 50 Å. Next, 4 rou nds of subto mogram refineme nt and 3 roun ds of subtilt refinem ent were p erformed to arrive at the final map, which was shar pened using a 1 - D struc ture fac tor 18 calculated from EMD - 5592, masked via EMAN2 auto - maskin g, and fi lt ere d by t he l oca l gold - standard FSC. Tomograms of t he AcrAB - TolC pump i n E. coli c ells wer e coll ected on a JEOL3200 equi pped with a Gat an K2 camera . To mogram r econst ruct ion and CTF det erminat ion were perf ormed in EMAN2 using defaul t par ameters. The un binned parti cle d ata had an Å/ pix of 3.36 5, and a box size of 140 was used during particle extract ion. 25 hig h SNR particles were used f or init ial model ge nera tio n. For st ruc tur es wit h s ymmet ry, ap plyi ng the sy mmetr y b efor e the in iti al mod el generation conv erges tends to trap the SGD in a local minimum and not achi eve the opt imal result. So here a two - step approach was used to build the init ial model. First 5 iterati ons of our SGD routi ne were perf ormed impos ing C1 symmetry. Afte r al igning the result to the sy mmetry axis, we per formed 5 more iterati ons with C3 symmetry. Subtomogram av eraging was t hen performed using 1321 parti cles fr om 9 tomograms whil e applying c3 symmetry. To focus on t he protein whi le preservi ng infor mation fr om the membrane for improved ali gnment, a mask with values ranging f rom 0.5 - 1 around the pump and 0 - 0.5 coveri ng a larger cylinder was app lied to the ma p eac h iteration before alignm ent. The final ma p was filtered by local FS C and sharpe ned using a 1 - D s truc ture fact or obtai ned f rom a hig h - resolution s ingle - particle str ucture of the purified AcrAB - TolC complex. Renderi ng of den sity maps is perfor med with UCSF ChimeraX . 19 Supplementar y Figure Fig S1. Tilin g strat egy for tomogram reco nstructi on. ( a) Reconstr uction of in dividual til es. Each tile is pad ded to th e size o f the das hed b ox durin g the rec onstruc tion, and clipped to the size of the solid box. (b) Overlapping ti les to reduce edge eff ects. (c) Result ing by - tile recon struction. 20 Fig S2. Subtilt CTF determinat ion. We mea sur e CTF in e ach t il t ima ge by ti li ng t he ti lt image s and calculat ing coherent power spectr a along st rips paral lel t o the t ilt axis. These power spectra, geometric inf ormation from the ti lt angle, and t he 3D position of each extracted particl e are used to determine per - particle def oci. Once CTF curves have been fit to the data, t he parameters are used to phase flip individual parti cle subti lt i mages for subsequent processing . 21 Table S1 Task Program name # Cores Wall time (m in) Iteration s Raw data import e2import.py 1 Tomographic reco nstruction e2 tomogr am.py † 12 9 2,1,1,1 Reference - based particle picking e2spt_tempmatch.py 7 CTF corr ection e2spt_tomoctf.py 2 Subtomogram extr action e2spt_extract. py † 1 31 Initial mo del gen eration e2spt_sgd.py † 12 41 3 Subtomogram refi nement e2spt_refine.py † 12 181 3 Subtilt refine ment e2spt_tilt refine.py † * 96 308 6 Table S1. Program run times. Par allel ism: * = MPI, † = Thread. Note, e2spt_sgd. py is par allel ized by batch, so running the program wi th a bat ch size of 12 will use 12 t hreads.
Original Paper
Loading high-quality paper...
Comments & Academic Discussion
Loading comments...
Leave a Comment