Data-Driven Participation Factors for Nonlinear Systems Based on Koopman Mode Decomposition
This paper develops a novel data-driven technique to compute the participation factors for nonlinear systems based on the Koopman mode decomposition. Provided that certain conditions are satisfied, it is shown that the proposed technique generalizes …
Authors: Marcos Netto, Yoshihiko Susuki, Lamine Mili
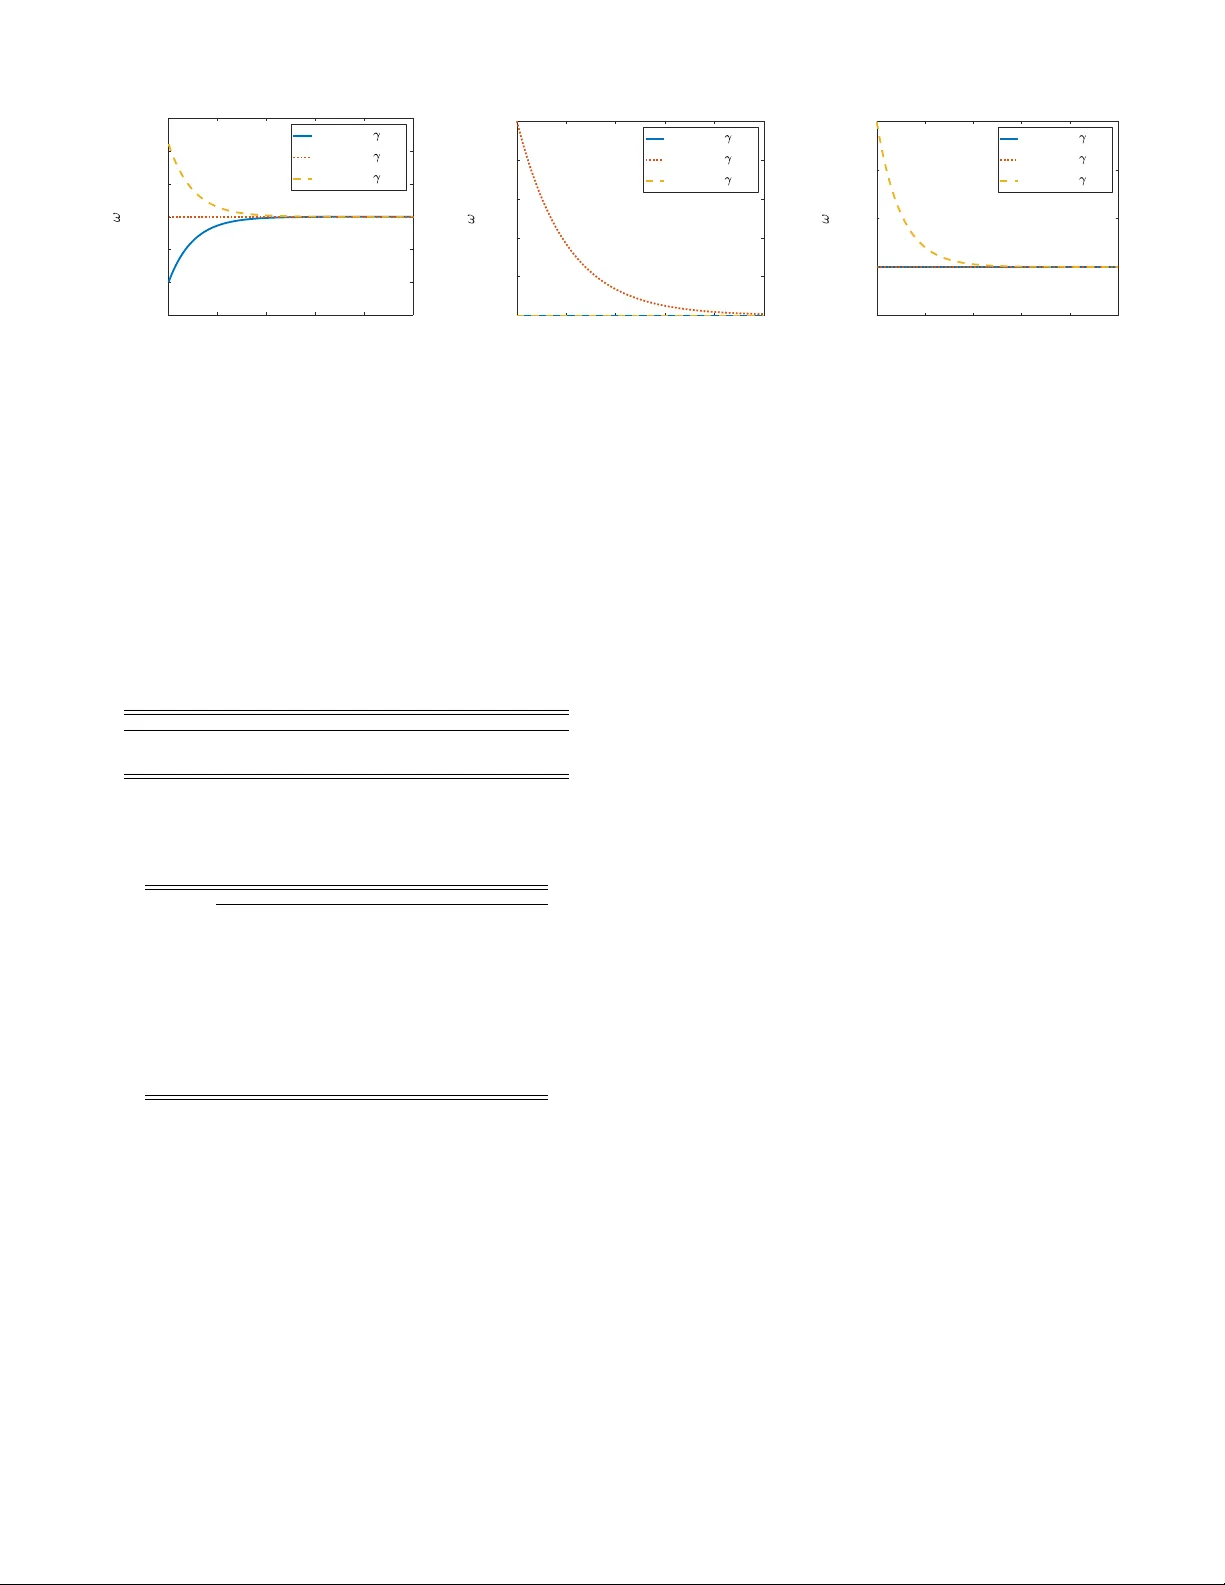
Data-Dri v en P articipation F actors for Nonlinear Systems Based on K oopman Mode Decomposition Marcos Netto, Student Member , IEEE, Y oshihiko Susuki, Member , IEEE, and Lamine Mili, Life F ellow , IEEE Abstract —This paper de velops a novel data-driven technique to compute the participation factors for nonlinear systems based on the Koopman mode decomposition. Pr ovided that certain conditions ar e satisfied, it is shown that the proposed technique generalizes the original definition of the linear mode-in-state participation factors. T wo numerical examples are provided to demonstrate the performance of our approach: one r elying on a canonical nonlinear dynamical system, and the other based on the two-area f our-machine po wer system. The Koopman mode decomposition is capable of coping with a large class of nonlinearity , thereby making our technique able to deal with oscillations arising in practice due to nonlinearities while being fast to compute and compatible with r eal-time applications. Index T erms —K oopman mode decomposition, modal analysis, modal participation factors, nonlinear systems, stability . I . I N T RO D U C T I O N T HE participation factors are an important component of the so-called selective modal analysis proposed by P ´ erez- Arriaga et al. [1]. They are widely used in the po wer industry as they pro vide a measure of the relativ e contribution of modes to system states and vice versa. Applications include stability analysis [2], dynamic model reduction [3], and placement of po wer system stabilizers [4]. Alternativ e [5] and comple- mentary [6] perspectiv es to the original definition of linear participation factors have also been proposed in the literature. For instance, Hashlamoun et al. [5] advocate that the initial states are uncertain, thereby casting the problem of computing the participation factors as a stochastic one, as opposed to a deterministic one; then, by relying on the definition of the mathematical expectation and by assuming that the initial states follow a uniform probability distrib ution, a dichotomy between mode-in-state and state-in-mode participation factors is suggested. Despite the existence of different vie ws, the participation factors are a well-accepted metric of the dynamic performance of linear systems; therefore, its extension to non- linear models is of practical interest since it is known that the analysis of power systems through model linearization does not provide an accurate picture of the modal characteristics when the system is operating under stressed conditions [7]. An attempt to go beyond the linear paradigm was made by Lesieutre et al. [8] by applying a transformation from state variables to harmonic variables to gain insight on the state- in-mode participation factors at the Hopf bifurcation point. Although interesting, their approach ultimately computed the participation factors of a transformed linear model associated with the stable limit cycle. A different approach was taken by V ittal et al. [7], with the intent of studying inter-area This work was supported by CAPES F oundation, Ministry of Education of Brazil, under grant BEX13594/13-3, and by the JSPS KAKENHI #15H03964. M. Netto and L. Mili are with the Bradley Department of Electrical and Computer Engineering, V irginia Polytechnic Institute and State University , V A 22043 USA (e-mail: { mnetto, lmili } @vt.edu). Y . Susuki is with the Department of Electrical and Information Systems, Osaka Prefecture University , Sakai, Osaka, Japan (e-mail: susuki@ieee.org). modes of oscillation in stressed power systems following large disturbances, when nonlinearities play an important role. The idea in [7] is to compute the participation factors by considering up to the second-order terms in the T aylor series expansion of the nonlinear model and then applying the method of normal forms. The inclusion of third-order terms has also been exploited in [9]. Due to the importance of this line of research, the shortcomings of the method of normal forms hav e been in vestigated in [10]. Firstly , this method suffers from a heavy computational burden that will make it inapplicable to large-scale systems even if second-order terms are considered only . Secondly , it inv olves a highly nonlinear numerical problem that needs to be solved to retrieve the initial conditions. In an attempt to overcome these weaknesses, Pariz et al. [11] proposed the modal series method, which has the advantages of being valid under resonance conditions and not requiring nonlinear transformations. Howe ver , their approach is also restricted to polynomial nonlinearities, as is the case with the method of normal forms. Furthermore, the aforementioned approaches do not consider the state-in-mode participation factors, which are accounted for in this paper . In face of the exposed challenges, it has been suggested in [10] and in [12] that the computation of the participation factors from measurements could either pro vide a solution to the aforementioned issues directly , or be complementary to model-based techniques such as the ones that rely on the T aylor series e xpansion of the po wer systems nonlinear model. The problem thus becomes one of estimating linear and nonlin- ear participation factors from the measurements. In this paper , this problem is addressed via the Koopman operator -theoretic framew ork [13]. Recently , following the work of Mezi ´ c et al. [14], [15] and of Ro wley et al. [16], this framework based on the point spectrum of the K oopman operator, and henceforth referred to as the Koopman mode decomposition (KMD), has gained momentum as a powerful data-driv en tool to analyze nonlinear dynamical systems. Our solution of data-driven participation factor is also based on the spectral properties of the K oopman operator , precisely the point spectrum and associated eigenfunctions, and the so-called Koopman modes [16]. T o approximate the spectral objects, we resort to the extended dynamic mode decomposition (EDMD) [17], [18]. Then, we demonstrate how to compute linear and nonlinear participation factors from the measurements. T o the authors’ best of knowledge, this is the first comprehensi ve application of the EDMD algorithm in po wer systems. Sako et al. [19], and Netto and Mili [20], [21] adopt the EDMD but did not con- sider nonlinear observ ables, which con versely are accounted for in the present work, thereby exploring the full potential of the KMD. The computation of the participation factors with the proposed technique is not restricted by the form of the underlying dynamical system. Furthermore, provided that certain conditions are satisfied, it is shown that our approach generalizes the one proposed by P ´ erez-Arriaga et al. [1] to nonlinear dynamical systems, in the case of mode-in-state participation factors. The paper proceeds as follows. Section II briefly revisits the formulation of the linear participation factors. Section III introduces the proposed data-driven technique to compute linear and nonlinear participation factors based on the KMD. Section IV discusses some numerical results. Conclusions and ongoing work are provided in Section V . I I . P R E L I M I NA R I E S Consider a continuous-time autonomous nonlinear system defined on an n -dimensional Euclidean space R n as follo ws: ˙ x = f ( x ) , (1) where x ∈ R n is the system state vector , and f : R n → R n is a vector -valued nonlinear function. By performing a T aylor series expansion of (1) around a stable equilibrium point (SEP), and considering only the first-order term, we have ˙ x = Ax , (2) where A ∈ R n × n is a Jacobian matrix, i.e., A := ∇ f ( x ) = ∂ f ( x ) ∂ x > , and x > denotes the transpose of x . By assuming that all the eigen values λ i , i = 1 , ..., n , of A are distinct, the eigendecomposition of A is giv en by A = [ u 1 ... u n ] λ 1 . . . λ n v > 1 . . . v > n = U Λ V , (3) where U and V are matrices containing, respectively , the right and the left eigenv ectors of A , and V = U − 1 . By applying a similarity transformation expressed as z = V x , (4) and using (3), the solution to (2) is given by x ( t ) = n X j =1 ( v > j x 0 ) u j e λ j t , (5) where x 0 is the initial state. The time ev olution of the i -th state in (5) is written as x i ( t ) = n X j =1 ( v > j x 0 ) u ij e λ j t = n X j =1 σ ij e λ j t . (6) Here we introduce the so-called contribution factors [22]. Definition 1: The contribution factors of the linear system (2) are defined as σ ij := ( v > j x 0 ) u ij . (7) They measure the contribution of mode j to the oscillations of state i for the initial state x 0 . Notice that besides the characteristics of the linear system (2) giv en by the eigendecomposition of A , the contribution factors are also dependent on the initial state x 0 . For power systems, this implies that the contrib ution factors are depen- dent on the network topology , the SEP around which (1) is linearized, as well as the location and duration of a given disturbance [22]. The nonlinear counterpart of (7) based on the KMD was pinpointed by Susuki and Mezi ´ c in [23], although they do not make reference to the term contribution factor . Whereas the contribution factors provide valuable information about the contribution of a mode to the dynamics of a state, a measure of the system performance that depends only on the characteristics of (2), and not on the system initial condition, x 0 , is advantageous for capturing inherent system characteristics. A. P articipation factors as originally pr oposed in [1] Now we introduce the original notion of participation factors based on [1]. Definition 2: The mode-in-state participation factors of the linear system (2) are defined as p ij := v ij u ij . (8) They pro vide a r elative measure of the magnitude of the modal oscillations in a state when only that state is perturbed initially . T o deri ve (8), one makes use of (7) and selects x 0 = e i , where e i is the unit vector along the i -th coordinate axis. Definition 3: The state-in-mode participation factors of the linear system (2) are defined as p ij := v ij u ij . (9) They measure the r elative participation of the j -th state in the i -th mode. T o deri ve (9), one substitutes (4) into (2) and finds ˙ z = Λ z , yielding to z i ( t ) = z i 0 e λ i t = v > i x 0 e λ i t . Then, by selecting x 0 = u i , z i ( t ) = P n j =1 v ij u ij e λ i t . Notice that as proposed in [1], (8) and (9) hav e the same expression. B. Alternative definition of the participation factors [5] As sho wn above, P ´ erez-Arriaga et al. [1] put x 0 = e i in (7) to define the mode-in-state participation factors. Instead, Hashlamoun et al. [5] start by considering that the initial state x 0 in (7) is uncertain and proceed from there. Definition 4: In the set-theoretic formulation, the mode-in- state participation factors of the linear system (2) measuring r elative influence of a given mode on a giv en state can be defined as p ij := avg x 0 ∈S v > j x 0 u ij x i 0 , (10) whenev er (10) exists, x i 0 = P n j =1 ( v > j x 0 ) u ij is the value of x i ( t ) at t = 0 , and avg x 0 ∈S is an operator that computes the av erage of a function over a set S ⊂ R n . The average in (10) is an estimator of the mean of a random variable, which tends to the true mean of that random variable when it exists, which is represented by the expectation operator . That is, we hav e p ij := E " v > j x 0 u ij x i 0 # . (11) By assuming that the components of the initial state vector , x 0 , are independent with zero mean, (11) reduces to (8) [5]. W e refer to (11) as the probabilistic mode-in-state participation factors of the linear system (2). Definition 5: The pr obabilistic state-in-mode participation factors of the linear system (2) are defined as π ij := E h v ij x i 0 z i 0 i , if λ j is real , E ( v ij + v ∗ ij ) x i 0 z i 0 + z ∗ i 0 , if λ j is complex , (12) whenev er the expectation e xists, z i 0 := z i ( t = 0) = v > j x 0 , and ∗ denotes complex conjugation. By assuming that the units of the state variables are scaled to ensure that the probability density function is such that the components of x 0 are jointly uniformly distributed over the unit sphere in R n centered at the origin, yields π ij = ( <{ v ij } ) 2 ( <{ v j } ) > <{ v j } , (13) where <{ v ij } stands for the real part of v ij . Notice that (13) dif fers from (9). The interested reader is referred to [5] for more details on the deriv ation of (13). Hereafter , we consider the definition of participation factors giv en by Hashlamoun et al. [5], namely Definitions 4 and 5. I I I . P A RT I C I P A T I O N FAC TO R S F O R N O N L I N E A R S Y S T E M S BA S E D O N K O O P M A N M O D E D E C O M P O S I T I O N W e have considered a continuous-time formulation in the previous section. If instead of (2), a discrete-time autonomous system of the form x k = A x k − 1 is assumed, we can sho w that x k = n X j =1 ( v > j x 0 ) u j µ k j , (14) implying that (5) and (14) are equiv alent with µ k j = e λ j t for fixed t . W e consider a discrete-time formulation to introduce the KMD motiv ated by the fact that our approach is data- driv en. Hence, let us consider a discrete-time autonomous nonlinear system giv en by x k = F ( x k − 1 ) , where x ∈ M , M is the state space, and F : M → M . The K oopman operator is a linear operator K that acts on functions defined on M in the follo wing manner: K g ( x k ) = g ( F ( x k )) , (15) where g : M → R . The eigenv alues, µ j , and eigenfunctions, ϕ j , of K are defined as K ϕ j ( x k ) = µ j ϕ j ( x k ) , j = 1 , 2 , ... (16) The set containing all µ j is called the point spectrum of the K oopman operator . Now , consider a vector-v alued observable g : M → C q . As in [16], if all the elements of g lie within the span of the eigenfunctions, ϕ j , we have g ( x k ) = ∞ X j =1 ϕ j ( x k ) φ j = ∞ X j =1 ϕ j ( x 0 ) φ j µ k j , (17) where φ j ∈ C q are the K oopman modes [16], and ( µ j , ϕ j , φ j ) are referred to as the K oopman tuples. As stated by Susuki and Mezi ´ c [23], “the real part of ϕ j ( x 0 ) φ j determines the initial amplitude of modal dynamics”, and in fact define a nonlinear generalization of the linear contribution factors based on the KMD. A. Extended Dynamic Mode Decomposition (EDMD) Follo wing Klus et al. [18], consider a set of snapshots pairs of the system states x k , k = 0 , ..., m . Also, consider X = [ x 0 ... x m − 1 ] , X 0 = [ x 1 ... x m ] , (18) X , X 0 ∈ R n × m . In addition, consider a vector of observ able functions, i.e. lifted states, defined as γ ( x k ) = [ γ 1 ( x k ) ... γ q ( x k )] > , (19) where γ : R n → R q , and define Γ X = [ γ ( x 0 ) ... γ ( x m − 1 )] , Γ X 0 = [ γ ( x 1 ) ... γ ( x m )] . A finite-dimensional approxima- tion to the Koopman operator K is estimated as K = Γ X 0 Γ † X , (20) where † denotes the Moore-Penrose pseudoin verse. A finite set of K oopman eigen values is approximated by the eigen v alues of K , whereas the eigenfunctions ϕ j are gi ven by ϕ ( x k ) = Ξ γ ( x k ) , (21) where Ξ = [ ξ > 1 ; ... ; ξ > q ] contains the left eigen vectors of K , and ϕ ( x k ) = [ ϕ 1 ( x k ) ... ϕ q ( x k )] > . Finally , in order to obtain the K oopman modes for the full-state observable, x k , let B ∈ R n × q be a matrix defined as follows: x k = B γ ( x k ) . (22) From (21), we have that γ ( x k ) = Ξ − 1 ϕ ( x k ) and x k = B γ ( x k ) = B Ξ − 1 ϕ ( x k ) , (23) where Ξ − 1 contains the right eigen vectors of K . Therefore, the Koopman modes are the column vectors φ j , j = 1 , ..., q , of Φ = B Ξ − 1 , Φ ∈ C n × q , and x k = q X j =1 ϕ j ( x k ) φ j = q X j =1 ϕ j ( x 0 ) φ j µ k j . (24) Remark 1: By adopting the KMD, we trade a finite- dimensional nonlinear system by an infinite-dimensional lin- ear one. From the numerical standpoint, (24) is a finite- dimensional approximation of (17). Now we are in the position to state the main result of this paper . B. Data-Driven P articipation F actors for Nonlinear Systems Definition 6: The data-driven mode-in-state participation factors for nonlinear systems based on the EDMD are defined as p ij := ξ ij φ ij + q X r =1 ,r 6 = i ξ rj φ ij E γ r 0 γ i 0 , (25) where i = 1 , ..., n and j = 1 , ..., q . Notice that as opposed to the linear case, q ≥ n and the matrix of the mode-in-state participation factors is in general not square. Now , we deriv e (25) and show that it is equiv alent to (8) under certain conditions. T o do that, we start from the definition (11) and apply the KMD (24) instead of the eigen- decomposition gi ven by (14). Let us define p ij as p ij := E ϕ j ( x 0 ) φ ij γ i 0 = E " ( ξ > j γ 0 ) φ ij γ i 0 # , (26) whenev er the e xpectation exists, γ 0 = [ γ 1 ( x 0 ) ... γ q ( x 0 )] > , and γ i 0 is the value of γ i ( x ( t )) at t = 0 . Then, p ij = E " q X r =1 ( ξ rj γ r 0 ) φ ij γ i 0 # = E " ( ξ ij γ i 0 ) φ ij γ i 0 # + E " q X r =1 ,r 6 = i ( ξ rj γ r 0 ) φ ij γ i 0 # = ξ ij φ ij + q X r =1 ,r 6 = i ξ rj φ ij E γ r 0 γ i 0 . (27) Case 1: Suppose that the observables are the identity map, i.e., γ ( x k ) = x k . By assuming that the components of the initial state vector , x 0 , follow a uniform probability density function and are statistically independent with zero mean, the second term on the right-hand side in (27) vanishes and the resultant expression p ij = ξ ij φ ij + q X r =1 ,r 6 = i ξ rj φ ij E x r 0 x i 0 = ξ ij φ ij , (28) implies that (25) leads to (8). Notice that we rely on Lemma 1 stated in [24] to derive (28). In the nonlinear setting, the finite- dimensional approximation of the K oopman operator provides a data-driv en approach for the computation of the mode-in- state participation factors. Case 2: Suppose that the quotient between γ r 0 and γ i 0 , r 6 = i , is an odd function. By assuming that the components of the initial state vector , x 0 , are independent with zero mean, and by virtue of the law of the unconscious statistician [25], the second term in (27) vanishes and the following expression same as above holds: p ij = ξ ij φ ij + q X r =1 ,r 6 = i ξ rj φ ij E γ r 0 γ i 0 = ξ ij φ ij . (29) Definition 7: The data-driven state-in-mode participation factors for nonlinear systems based on the EDMD are defined as π ij := ( <{ ξ ij } ) 2 ( <{ ξ j } ) > <{ ξ j } , (30) For this, we hav e assumed that the observ ables γ 1 ( x 0 ) , ..., γ q ( x 0 ) are jointly uniformly distributed o ver the unit sphere in R q centered at the origin. Notice that, in power systems, one can often normalize the acquired measurements or estimates, and their corresponding functions, to comply with this assumption. W e now sketch the deriv ation of (30). Suppose that γ ( x k − 1 ) = ˜ x k − 1 , and γ ( x k ) = ˜ x k . By making use of (20), ˜ x k = K ˜ x k − 1 . (31) Now , by defining a similarity transformation z k := Ξ ˜ x k and substituting it into (31), we hav e z k = Ξ K Ξ − 1 z k − 1 = Ω z k − 1 , (32) where Ω = diag ( µ 1 , ..., µ q ) . W e reach the final result (30) under the aforementioned assumption that follows [5]; here due to space limitation, the detailed deri v ation is omitted. C. Example: A Canonical Nonlinear Dynamical System Consider the autonomous dynamical system expressed as ˙ x 1 ˙ x 2 = λ 1 ( x 1 − x 2 2 ) λ 2 x 2 , (33) with λ 1 = − 1 , λ 2 = − 0 . 05 , and x 0 = [ − 1; 2] > , and assume that x 0 follows a uniform probability density function. This system (33) has been studied by Brunton et al. in [26]. By selecting w 1 = x 1 , w 2 = x 2 , and w 3 = x 2 2 , we have ˙ w 1 = ˙ x 1 = λ 1 ( x 1 − x 2 2 ) = λ 1 w 1 − λ 1 w 3 , ˙ w 2 = ˙ x 2 = λ 2 x 2 = λ 2 w 2 , ˙ w 3 = 2 x 2 ˙ x 2 = 2 λ 2 x 2 2 = 2 λ 2 w 3 , (34) where [ w 1 ; w 2 ; w 3 ] > is the vector of the observ able func- tions. Notice that this particular choice allo ws us to trans- form the two-dimensional nonlinear system (33) into a three- dimensional linear system (34) without any linearization. Al- though such a finite-dimensional transformation only exists for certain classes of nonlinear dynamical systems [26], this example elucidates the key idea of the Koopman operator- theoretic approach. In what follows, we first integrate (33) numerically with a time step of 0.01 seconds and use the results to build (18). Then, we select γ = [ x 1 ; x 2 ; x 2 2 ] > , with γ 0 = [ − 1; 2; 4] > . By applying the EDMD, we obtain µ = [ − 1; − 0 . 05; − 0 . 1] > , Ξ = " 1 0 − 1 . 1111 0 1 0 0 0 1 . 4948 # , and Φ = 1 0 0 . 7433 0 1 0 . Finally , by making use of (29) and (30), we find P = 1 0 0 . 8259 0 1 0 , Π = " 0 . 4475 0 0 0 1 0 0 . 5525 0 1 # . Notice that the sum of all the entries of a single row or column of P is not necessarily equal to 1. Ho we ver , if the first two columns of P related to the linear modes 1 and 2 are taken into consideration, the proposed matrix of linear and nonlinear participation factors reduces to the one proposed by P ´ erez-Arriaga et al. [1]. It is important to mention that the choice of the vector of observ ables giv en by (19) plays a key role. Furthermore, the nonlinear participation factors are not necessarily restricted to the unit interval; in fact, if for instance we choose λ 1 = − 1 and λ 2 = − 0 . 4 , we get p 13 = 4 . 9029 , i.e., the participation factor associated with the nonlinear mode 3 is equal to 4 . 9029 > 1 . Conv ersely , the state-in-mode participation factors are always restricted to the interval (0 , 1) ; see (30). W e compute the time e volution of each modal variable w i ( t ) for the follo wing set of initial conditions: γ 0 = [0 . 1; 0; 0] > , γ 0 = [0; 0 . 1; 0] > , and γ 0 = [0; 0; 0 . 1] > , which allows us to distinguish the influence of each observ able function on each mode. The results depicted in Fig. 1 are in good agreement with Π . I V . N U M E R I C A L R E S U LT S I N P OW E R S Y S T E M S W e carry out simulations on the two-area four-machine power system [10]. All the generators are represented by the sub-transient model equipped with an automatic voltage regulator and a fast-response exciter; the loads are modeled as constant admittances. The system operating condition is a highly stressed one, close to the point of voltage collapse, 0 2 4 6 8 10 Time (seconds) -0.15 -0.1 -0.05 0 0.05 0.1 0.15 Re{ 1 (t)} change in 1 (x 0 ) change in 2 (x 0 ) change in 3 (x 0 ) (a) 0 20 40 60 80 100 Time (seconds) 0 0.02 0.04 0.06 0.08 0.1 Re{ 2 (t)} change in 1 (x 0 ) change in 2 (x 0 ) change in 3 (x 0 ) (b) 0 20 40 60 80 100 Time (seconds) -0.05 0 0.05 0.1 0.15 Re{ 3 (t)} change in 1 (x 0 ) change in 2 (x 0 ) change in 3 (x 0 ) (c) Fig. 1. Evolution of the modal variables w i , i = 1 , ..., q , in (34). Evolution of (a) mode 1, w 1 ( t ) ; (b) mode 2, w 2 ( t ) ; (c) mode 3, w 3 ( t ) . characterized by a power flow of 457 MW from Area 1 to Area 2. A three-phase short-circuit is applied at Bus 5 and cleared after 10 milliseconds with no line switching. W e rely on time-domain simulations only to emulate synchrophasor measurements, with a reporting rate of 120 frames/second. From the small-signal stability analysis, the system has one inter-area and two local electromechanical linear modes of oscillation, as presented in T able I. T ABLE I E L EC T RO M E CH A N I CA L L I NE A R M O D E S O F O S C IL L A T I ON Mode Eigen value Freq. (Hz) Damp. (%) Inter-area − 0 . 0614 ± j1 . 6522 0 . 2629 3 . 71 Local (Area 1) − 1 . 2452 ± j8 . 0146 1 . 2756 15 . 35 Local (Area 2) − 1 . 7390 ± j7 . 6730 1 . 2212 22 . 10 T ABLE II M O DE S F R EQ U E NC Y A N D D A M P IN G R A T I O <{ µ i } ={ µ i } Freq. (Hz) Damp. (%) µ 1 , 2 − 63 . 64 ± 37 . 17 5 . 92 86 . 35 µ 3 − 7 . 26 0 . 00 0 . 00 100 . 00 µ 4 , 5 − 1 . 91 ± 7 . 82 1 . 24 23 . 74 µ 6 , 7 − 1 . 17 ± 7 . 94 1 . 26 14 . 54 µ 8 , 9 − 0 . 58 ± 5 . 23 0 . 83 11 . 09 µ 10 , 11 − 0 . 25 ± 4 . 15 0 . 66 6 . 04 µ 12 , 13 − 0 . 44 ± 3 . 43 0 . 55 12 . 86 µ 14 , 15 − 1 . 44 ± 1 . 99 0 . 32 58 . 73 µ 16 0 . 00 0 . 00 0 . 00 100 . 00 µ 17 , 18 − 0 . 15 ± 1 . 95 0 . 31 7 . 73 µ 19 , 20 − 0 . 03 ± 1 . 47 0 . 23 1 . 95 µ 21 , 22 − 0 . 52 ± 0 . 94 0 . 15 48 . 70 µ 23 , 24 − 0 . 32 ± 0 . 10 0 . 02 95 . 12 In order to estimate the Koopman tuples via EDMD, we select γ = [ δ > ; ω > ; E > f d ; (sin( δ )) > ; (cos( δ )) > ; P > g en ] > , where δ , ω , E f d , and P g en are v ectors containing the gen- erators’ rotor angle, rotor speed deviation, field voltage, and real power injection, respectiv ely . Although this particular set of observables led to good results in all of the extensi ve tests that we have performed, we note that the choice of the observable functions for power systems, and in general [26], remains as an open problem and is out of the scope of the present work. W e also remark that the generators’ rotor angle is not directly measured in practice, and should be estimated via a dynamic state estimator [20], [21], [27], [28]. Like wise, brushless excitation systems are commonly found in practice and they do not allow us to directly measure the field voltage, which in this case shall be estimated as well. W e assume that x 0 follows a uniform probability density function. T o assess the estimation error ε , we apply the Frobenius norm on the matrices containing the snapshots of the system state vector , x , obtained from the time-domain simulation and from the EDMD, ˆ x . W e find an adequate v alue ε = k ˆ x − x k F / k x k F = 0 . 04% . The EDMD eigenv alues are shown in T able II. W e notice that the pair of eigen values µ 4 , 5 is similar to the local (linear) mode of Area 2. Likewise, µ 6 , 7 refer to the local mode of Area 1, and µ 19 , 20 to the inter-area mode. Notice that, since the system has 4 generators and 6 observable functions are being selected, this results in 24 modes. Furthermore, because we adopt the center of angle reference frame, one eigen value is equal to zero, µ 16 = 0 , which helps us to validate the estimation results. T able III displays the mode-in- state participation factors computed using (29). Notice that the results are not in the unit interv al as is the case for the model- based participation factors. In the model-based approach, if the eigen v alues are non-degenerate, each left eigenv ector is orthogonal to all right eigen vectors except its corresponding one, and vice versa. This property does not hold for Ξ , the matrix containing the left eigen vectors of K , and Φ , the matrix containing the Koopman modes. W e recommend to normalize the matrix containing the mode-in-state participation factors by row . From T able II, we can see that µ 1 , 2 is a control mode with frequency equal to 5 . 92 Hz. From T able III, we observe that µ 1 , 2 has the highest participation on the state E f d 2 , which is expected since generator 2 is electrically the closest to Bus 5 where a three-phase short-circuit has been applied to. Although the participation factors are supposedly independent of the disturbance duration and location, the proposed technique is data-driven and relies on the most excited modes in the dataset. The modes µ 8 , 9 , µ 14 , 15 , and µ 17 , 18 respectiv ely hav e the first, second and third highest participation on the states { δ 1 , δ 2 , δ 3 , δ 4 } . From T able II, we observ e that f 8 , 9 = 0 . 83 Hz, f 14 , 15 = 0 . 32 Hz, and f 17 , 18 = 0 . 31 Hz, i.e., these are inter- area modes. Their frequency , ho wever , differ from the linear inter-area mode in T able I due to transient dynamics apart form a steady-state condition. W e claim that µ 8 , 9 , µ 14 , 15 , and µ 17 , 18 are nonlinear modes not re vealed by the linear analysis. The linear inter -area mode µ 19 , 20 appears immediately after the nonlinear inter-area modes with a significant participation. In a similar manner , the nonlinear local modes in Areas 1 and 2 show up in sequence, after the linear inter-area mode, with a high participation on the states { δ 1 , δ 2 } and { δ 3 , δ 4 } , respectively . Finally , follo wing [10], the most excited nonlinear modes are usually those that are combinations of the linear inter-area modes. In this sense, the frequency of µ 12 , 13 is approximately twice the frequency of the linear inter-area mode. T ABLE III M O DE - I N -S TA T E P A RT IC I PA T I O N F AC TO R S B A SE D O N T H E K OO P M A N M O DE D E C OM P O S IT I O N µ 1 µ 2 µ 3 µ 4 µ 5 µ 6 µ 7 µ 8 µ 9 µ 10 µ 11 µ 12 µ 13 µ 14 µ 15 µ 16 µ 17 µ 18 µ 19 µ 20 µ 21 µ 22 µ 23 µ 24 δ 1 0 . 5 0 . 6 20 . 8 74 . 9 52 . 7 36 . 4 208 . 3 858 . 7 2 . 0 0 . 4 6 . 8 5 . 1 44 . 3 634 . 9 191 . 6 39 . 0 357 . 7 184 . 0 138 . 7 205 . 3 2 . 1 3 . 7 3 . 0 9 . 2 δ 2 0 . 5 0 . 6 25 . 9 53 . 9 37 . 9 86 . 4 494 . 3 877 . 8 2 . 0 0 . 3 5 . 0 4 . 0 34 . 8 645 . 3 194 . 8 15 . 2 372 . 7 191 . 8 145 . 6 215 . 5 2 . 1 3 . 7 3 . 5 10 . 4 δ 3 0 . 0 0 . 0 3 . 5 4 . 8 12 . 0 0 . 7 7 . 0 39 . 8 0 . 1 0 . 0 1 . 4 1 . 2 4 . 1 30 . 2 20 . 8 2 . 5 24 . 1 22 . 0 15 . 2 26 . 7 0 . 5 0 . 3 0 . 1 0 . 3 δ 4 0 . 0 0 . 0 0 . 6 1 . 0 2 . 7 1 . 1 7 . 9 28 . 0 0 . 0 0 . 0 0 . 4 0 . 4 2 . 2 7 . 5 2 . 4 0 . 5 9 . 7 4 . 5 2 . 5 3 . 7 0 . 0 0 . 0 0 . 3 0 . 4 ω 1 0 . 0 0 . 0 0 . 0 0 . 0 0 . 0 0 . 0 0 . 4 0 . 4 0 . 0 0 . 0 0 . 0 0 . 0 0 . 0 0 . 0 0 . 0 0 . 6 0 . 0 0 . 0 0 . 0 0 . 0 0 . 0 0 . 0 0 . 0 0 . 0 ω 2 0 . 0 0 . 0 0 . 0 0 . 0 0 . 1 0 . 3 0 . 1 0 . 1 0 . 0 0 . 0 0 . 0 0 . 0 0 . 0 0 . 1 0 . 0 0 . 4 0 . 0 0 . 0 0 . 0 0 . 0 0 . 0 0 . 0 0 . 0 0 . 0 ω 3 0 . 0 0 . 0 0 . 0 0 . 0 0 . 2 0 . 0 0 . 0 0 . 1 0 . 0 0 . 0 0 . 0 0 . 0 0 . 0 0 . 1 0 . 0 0 . 4 0 . 1 0 . 0 0 . 0 0 . 0 0 . 0 0 . 0 0 . 0 0 . 0 ω 4 0 . 0 0 . 0 0 . 0 0 . 0 0 . 0 0 . 0 0 . 0 0 . 1 0 . 0 0 . 0 0 . 0 0 . 0 0 . 1 0 . 1 0 . 0 0 . 9 0 . 1 0 . 1 0 . 0 0 . 0 0 . 0 0 . 0 0 . 0 0 . 0 E f d 1 45 . 5 44 . 8 17 . 8 6 . 4 6 . 9 3 . 8 10 . 5 15 . 8 0 . 0 0 . 0 0 . 3 0 . 3 4 . 9 15 . 8 3 . 1 1 . 5 16 . 4 7 . 7 1 . 6 2 . 7 0 . 0 0 . 0 0 . 0 0 . 2 E f d 2 383 . 3 349 . 7 50 . 6 24 . 6 22 . 9 35 . 0 98 . 6 17 . 3 0 . 0 0 . 1 2 . 4 2 . 2 30 . 4 58 . 0 2 . 4 1 . 5 87 . 5 37 . 8 2 . 7 3 . 4 0 . 0 0 . 1 0 . 2 0 . 9 E f d 3 19 . 3 17 . 6 4 . 2 4 . 1 3 . 8 5 . 6 15 . 7 65 . 8 0 . 0 0 . 0 1 . 8 2 . 0 28 . 4 59 . 1 2 . 5 0 . 8 75 . 2 32 . 5 2 . 8 3 . 6 0 . 0 0 . 1 0 . 1 0 . 4 E f d 4 26 . 2 22 . 4 4 . 7 4 . 8 11 . 0 5 . 7 15 . 9 46 . 5 0 . 0 0 . 0 2 . 2 2 . 6 26 . 6 51 . 0 5 . 9 4 . 8 73 . 7 30 . 0 1 . 9 4 . 1 0 . 1 0 . 1 0 . 2 0 . 9 V . C O N C L U S I O N S A nov el data-driv en technique that rev eals both linear and nonlinear participation factors based on the Koopman mode decomposition has been proposed. Numerical simulations car- ried out on a canonical nonlinear dynamical system, and on the two-area four-machine power system, demonstrated the performance of our technique. Since the K oopman mode decomposition is capable of coping with a large class of nonlinearity , the proposed technique is applicable to complex oscillatory responses arising in practice due to nonlinearities, as is the case in power systems. T o demonstrate the broadness of our technique, its performance under particular phenomena such as bifurcations will be ev aluated and reported in future publications. AC K N OW L E D G M E N T The authors are very grateful to Professor Eyad H. Abed for his insightful comments on this work. W e also would like to thank the anonymous revie wers for their careful reading of the manuscript and helpful suggestions. R E F E R E N C E S [1] I. J. P ´ erez-Arriaga, G. C. V erghese, and F . C. Schweppe, “Selective Modal Analysis with Applications to Electric Po wer Systems, Part I: Heuristic Introduction, ” IEEE T ransactions on P ower Apparatus and Systems , v ol. P AS-101, no. 9, pp. 3117–3125, Sept 1982. [2] G. C. V erghese, I. J. P ´ erez-Arriaga, and F . C. Schweppe, “Selective Modal Analysis W ith Applications to Electric Po wer Systems, Part II: The Dynamic Stability Problem, ” IEEE T ransactions on P ower Apparatus and Systems , v ol. P AS-101, no. 9, pp. 3126–3134, Sept 1982. [3] J. H. Chow , P ower System Coherency and Model Reduction . Springer, 2013. [4] Y . Y . Hsu and C. L. Chen, “Identification of optimum location for stabiliser applications using participation factors, ” IEE Pr oceedings C - Generation, T ransmission and Distribution , vol. 134, no. 3, pp. 238– 244, May 1987. [5] W . A. Hashlamoun, M. A. Hassouneh, and E. H. Abed, “New Results on Modal Participation Factors: Revealing a Previously Unknown Di- chotomy , ” IEEE T ransactions on Automatic Contr ol , vol. 54, no. 7, pp. 1439–1449, July 2009. [6] S. N. V assilyev , I. B. Y adykin, A. B. Iskakov , D. E. Katae v , A. A. Grobov oy , and N. G. Kiryanov a, “Participation factors and sub-Gramians in the selective modal analysis of electric power systems, ” IF AC- P apersOnLine , vol. 50, no. 1, pp. 14 806–14 811, 2017. [7] V . V ittal, N. Bhatia, and A. A. Fouad, “ Analysis of the inter -area mode phenomenon in po wer systems following large disturbances, ” IEEE T ransactions on P ower Systems , vol. 6, no. 4, pp. 1515–1521, Nov 1991. [8] B. C. Lesieutre, A. M. Stankovic, and J. R. Lacalle-Melero, “A study of state variable participation in nonlinear limit-cycle behavior , ” in Pr oceedings of International Confer ence on Control Applications , Sep 1995, pp. 79–84. [9] T . Tian, X. Kestelyn, O. Thomas, H. Amano, and A. R. Messina, “An Accurate Third-Order Normal Form Approximation for Power System Nonlinear Analysis, ” IEEE T ransactions on P ower Systems , vol. 33, no. 2, pp. 2128–2139, March 2018. [10] J. J. Sanchez-Gasca, V . V ittal, M. J. Gibbard, A. R. Messina, D. J. V owles, S. Liu, and U. D. Annakkage, “Inclusion of higher order terms for small-signal (modal) analysis: committee report-task force on assessing the need to include higher order terms for small-signal (modal) analysis, ” IEEE T ransactions on P ower Systems , vol. 20, no. 4, pp. 1886–1904, Nov 2005. [11] N. Pariz, H. M. Shanechi, and E. V aahedi, “Explaining and v alidating stressed power systems behavior using modal series, ” IEEE T ransactions on P ower Systems , vol. 18, no. 2, pp. 778–785, May 2003. [12] B. Hamzi and E. H. Abed, “Local mode-in-state participation factors for nonlinear systems, ” in 53r d IEEE Confer ence on Decision and Control , Dec 2014, pp. 43–48. [13] M. Budi ˇ si ´ c, R. Mohr, and I. Mezi ´ c, “Applied Koopmanism, ” Chaos: An Inter disciplinary Journal of Nonlinear Science , vol. 22, no. 4, p. 047510, 2012. [14] I. Mezi ´ c and A. Banaszuk, “Comparison of systems with complex behavior , ” Physica D: Nonlinear Phenomena , vol. 197, no. 1, pp. 101 – 133, 2004. [15] I. Mezi ´ c, “Spectral Properties of Dynamical Systems, Model Reduction and Decompositions, ” Nonlinear Dynamics , vol. 41, no. 1, pp. 309–325, Aug 2005. [16] C. W . Rowley , I. Mezi ´ c, S. Bagheri, P . Schlatter , and D. S. Henningson, “Spectral analysis of nonlinear flo ws, ” Journal of Fluid Mechanics , vol. 641, p. 115127, 2009. [17] M. O. Williams, I. G. Ke vrekidis, and C. W . Rowle y , “A Data–Driven Approximation of the Koopman Operator: Extending Dynamic Mode Decomposition, ” Journal of Nonlinear Science , vol. 25, no. 6, pp. 1307– 1346, Dec 2015. [18] S. Klus, P . K oltai, and C. Sch ¨ utte, “On the numerical approximation of the Perron-Frobenius and Koopman operator, ” Journal of Computational Dynamics , v ol. 3, no. 1, pp. 51–79, 2016. [19] K. Sako, Y . Susuki, and T . Hikihara, “An Analysis of V oltage Dynamics in Power System Based on Koopman Operator , ” in Proc. Joint Conven- tion of SICE Kansai Section and ISCIE , January 2016, pp. 36–41 (in Japanese). [20] M. Netto and L. Mili, “Rob ust Koopman Operator-based Kalman Filter for Power Systems Dynamic State Estimation, ” in 2018 IEEE P ower and Ener gy Society Gener al Meeting (PESGM) , August 2018, pp. 1–5. [21] M. Netto and L. Mili, “Robust Data-Dri ven K oopman Kalman Filter for Power Systems Dynamic State Estimation, ” IEEE T ransactions on P ower Systems , pp. 1–1, 2018. [22] S. K. Starret, V . V ittal, A. A. Fouad, and W . Kliemann, “A methodology for the analysis of nonlinear , interarea interactions between power system natural modes of oscillation utilizing normal forms, ” in Pr oc. Int. Symp. Nonlinear Theory Application , vol. 2, Dec. 1993, pp. 523– 538. [23] Y . Susuki and I. Mezi ´ c, “Nonlinear Koopman Modes and Coherency Identification of Coupled Swing Dynamics, ” IEEE T ransactions on P ower Systems , vol. 26, no. 4, pp. 1894–1904, Nov 2011. [24] E. H. Abed, D. Lindsay , and W . A. Hashlamoun, “On participation factors for linear systems, ” A utomatica , vol. 36, no. 10, pp. 1489 – 1496, 2000. [25] S. M. Ross, Applied Pr obability Models with Optimization Applications . Dover , 1992. [26] S. L. Brunton, B. W . Brunton, J. L. Proctor , and J. N. Kutz, “K oopman In variant Subspaces and Finite Linear Representations of Nonlinear Dynamical Systems for Control, ” PLOS ONE , vol. 11, no. 2, pp. 1– 19, 02 2016. [27] M. Netto, J. Zhao, and L. Mili, “A robust extended Kalman filter for power system dynamic state estimation using PMU measurements, ” in 2016 IEEE P ower and Energy Society General Meeting (PESGM) , July 2016, pp. 1–5. [28] J. Zhao, M. Netto, and L. Mili, “A Robust Iterated Extended Kalman Filter for Po wer System Dynamic State Estimation, ” IEEE Tr ansactions on P ower Systems , vol. 32, no. 4, pp. 3205–3216, July 2017.
Original Paper
Loading high-quality paper...
Comments & Academic Discussion
Loading comments...
Leave a Comment