A Gradual Takeover Strategy of the Active Safety System
A gradual takeover strategy is proposed, in which the dynamic driving privilege assignment in real-time and the driving privilege gradual handover are realized. Firstly, the driving privilege assignment based on the risk level is achieved. The natura…
Authors: Rui Liu, Xichan Zhu, Xuan Zhao
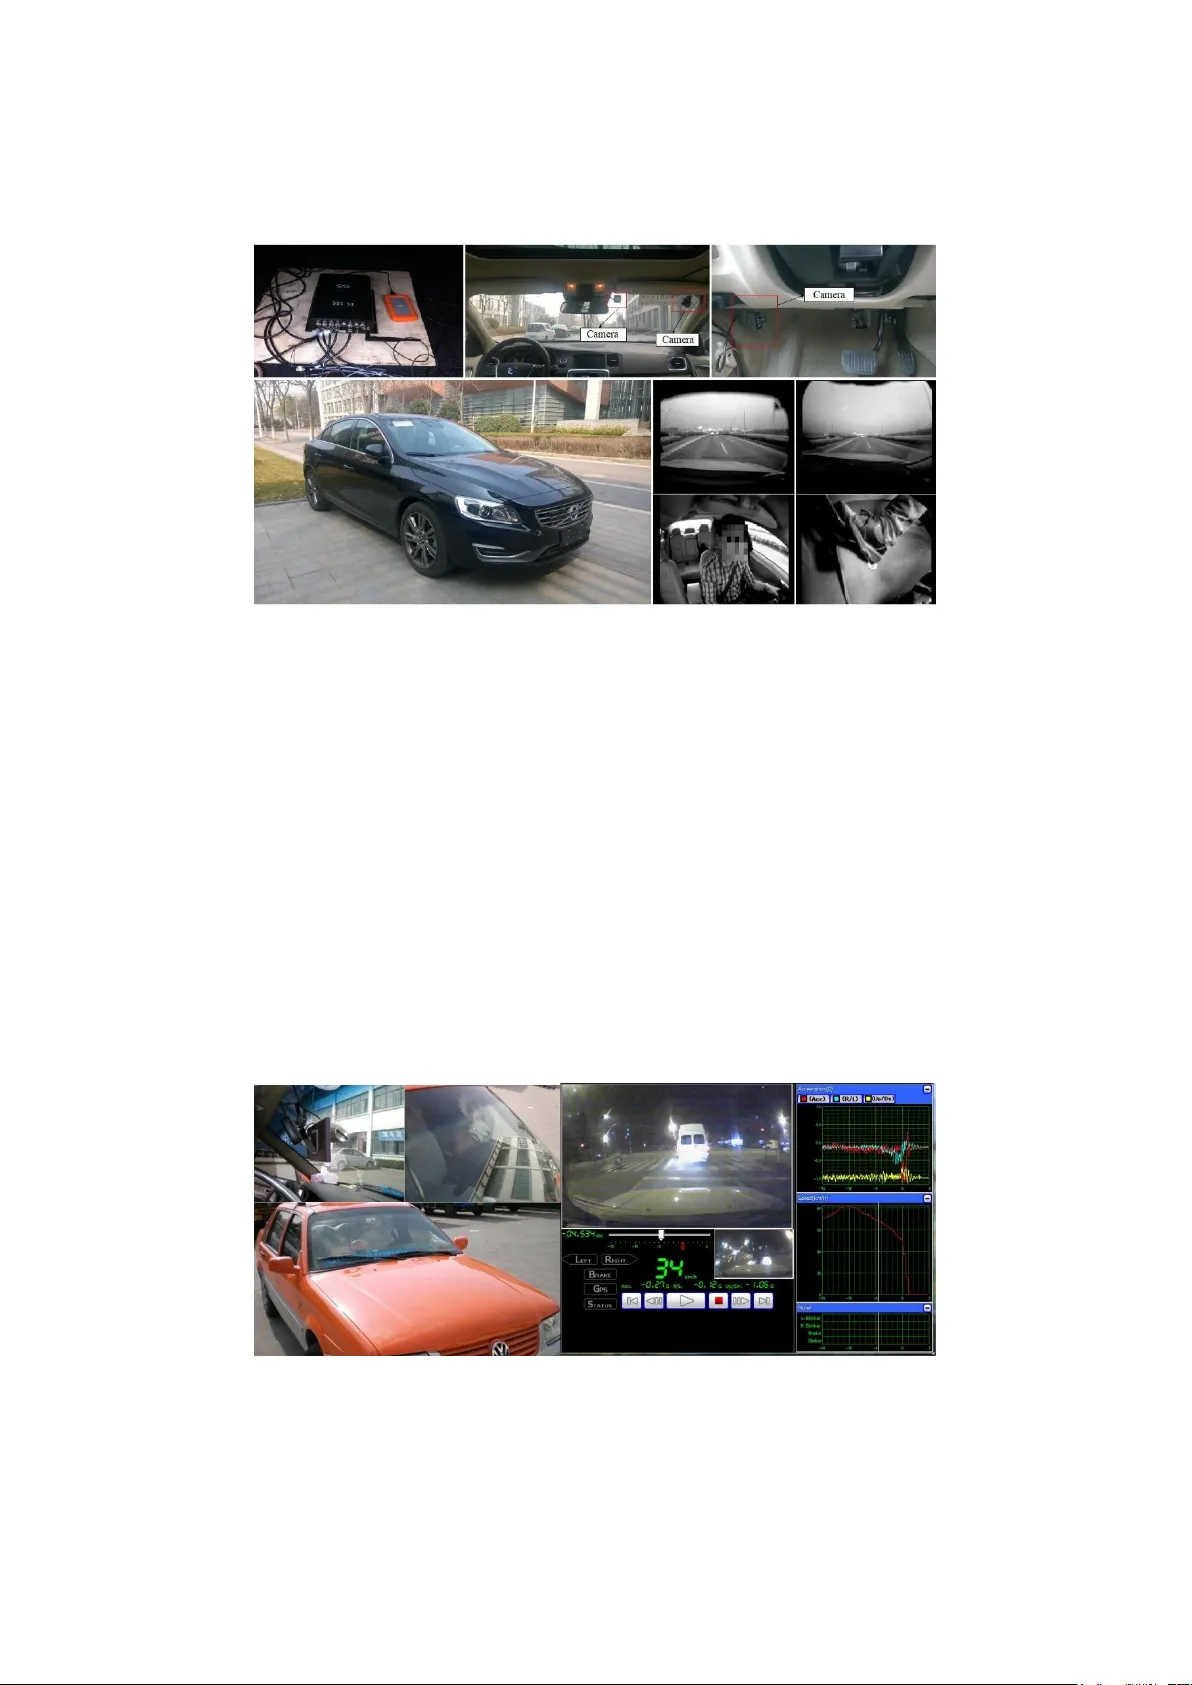
Corresponding Author: Prof. Xuan Zhao. Address: No. 33, Mid d le Chang'an Road, Xi ’an 710064, China. E-mail: zhaoxuan@chd.edu.cn. Phone: (+86) 13572219879. A Gradual T akeover Strategy of the Active S afety System Rui Li u 1 , Xichan Zhu 2 , Xuan Z hao 1* , Jian Ma 1 1. School of Autom obile, Chang’an Univ ersity , Xi’an 710064, China 2. School of Autom otive Studies, T ongji University , Shanghai 201804, China Abstract: A gradual takeover strategy is propose d, in which the dynam ic driv ing privi l ege as signment in real-tim e and the driv ing privilege gradual handover are realized. Firstly , the driving pri vilege assignment based on the risk level is achieved. The naturalist ic driving data is applied to study the driver behav ior during danger . TTC (tim e to collisi on) is defined as an ob vious risk measure, w hereas the tim e before the host v ehicle has to brake assum ing that the tar get vehicle is braking is defined as the potential risk measur e, i.e. the tim e margin (TM). A risk assessm ent algorithm is proposed based on the obv ious risk and potent ial risk. Secondly , the driv i ng privil ege gradual handover is realized. The non-cooperati ve MPC (model predictiv e control) is empl o yed to reso lve the conflicts betw een the driver and active safety s ystem. The naturalist ic driving data are applied to ver ify the effecti veness of the ri sk assessm ent algorit h m, and the risk assessm ent algorithm perfor ms better than TTC in the ROC ( receiver operating characterist ic). I t is identified that the Nash equil ibrium of the non- cooperative MPC can be achi eved by using a non- iterativ e method. The driving priv ilege gradual handover is realized by using the confidence matri xes updating. The sim ula tion verification shows that the gradual takeover strategy can achieve the driving privil ege gradual handover between the dri ver and active s afety system. Key words: v ehicle active s afety , risk assessment , game theory , naturali stic driving data 1. In troducti on Automoti ve intel ligence has played an important role in r educing traf fic accidents and reducing driver operating load[1]. The hi gh-level automated driv ing system has made great progress in recent years. However , m an y accidents related to in telligent vehicle have shown that it is very i mportant to keep the driver in the control loop before the drivi ng automation syst e m is fully m ature[2, 3], i.e. driver assi stance and cooperativ e driving. The entire driving process c an be divided into 4 states according to the risk level[4, 5], i.e. norm al drivi ng, risk, pre-cras h, and crash. The boundary between the normal driving and the risk is the subject ive safety domai n limit, which is related to the driver' s subject ive perception of danger . The boundary between the risk and the pre-crash is the physical safety domain l imit, which is the last m o ment at whi ch colli sion avoi danc e can be completed by braking through m aximum braking decel eration or emer gency steering w ith maxim u m peak later al acceleration[6]. In the traditional active safety system, the warning syst e m s tarts to work when encountering the risk state , and the AEB (a utonomous emer gency braking ) starts to work when entering the pre-crash state. However , the development of the danger is a gradual process. The suddenly interv ention of the AEB will di s turb t h e driv e r , and t he intervention strategy of AEB is usually ver y conservative. Moreover , it will be di f ficult for the driver to take over when the driving automat ion s yst e m suddenly withdraws. If the active safety system can gradual ly intervene as the risk level incr eases, it will great ly increase the safety benefits of the acti ve safety system . When the driving privilege i s delivered gradually , the vehicle is jointly controlled by the driv er and active safety system , i.e. cooperative driving. The prerequisite for the realization of gradual takeover is risk assessm ent. The drivi ng privilege is assigned between the driv er and activ e safety system according to the risk level. Driver’s subjectiv e judgm ent of danger is particular ly important for the definit ion of the risk lev el, i.e. the subj ective safety domain. In order to accuratel y define the boundary of the subjective safety domain, it is necessary to stud y the driving behavior characterist ics of the driver in dangerous scenario. Hence, the Naturalistic Driv ing Data (NDD) is appli ed to achiev e the driver behavi o r during danger . Fig 1. Gradual t akeover strategy during danger The com mon r isk assessm en t m ethod is t o define a measure that characteri zes the risk lev el in each scenario. TTC (time to collision) is a widely used risk meas ure[7-10], wh ich is defined as the relativ e distance divided by the relative velocity . When the relativ e velocity is very small, TTC wi ll be infini t y . Hence, the reci procal of TTC ( 1/TTC) is al so used in risk assessm ent[ 11 , 12]. However , TTC or 1/TTC c an not represent the risk level in all circumstances. Let’ s consider 2 car -follow ing cases. In case 1, the velocity of the host vehicle and tar get vehicle are 31m /s and 30m/s, respectiv ely . And the relative distance is 10m. In case 2, the velocity of the host vehicle and tar get vehicle are 6m/s and 5m/s, respectiv ely . And the relativ e distance is 10m. The TTC in these two case s are all 10s, but the driver will feel m ore dangerous in cas e 1. If the rel ative distance i s too small, t he braking of the t arget vehicle will cause a rear- end collision risk, even if TTC is very large. T oo small r elativ e distance and insuffi cient braking force are the main factors leadi ng to danger in the car - following scenario [1 3]. Therefore, TTC cannot be used to eval uate the risk level when the relativ e velocity is small. THW (tim e headway) is also a comm only used risk measure [1 4], which is defined as the relative distance divided by the velocity of the host vehicle. However , the velocity of the target vehicl e is n ot considered in THW , which is easy to obtain and is very important in ri sk asse ssment. Furthermore, the driv er's choi ce of THW is aff ected by m any other factors including the tar get vehi cle ty pe and road condition[15]. Hence, THW also cannot describe the danger in car -following accurate ly . Some new measure are introduced to describe the risk level, e.g. the weighted s um of 1/TTC and 1/ THW[16], T lab [1 7]. The drivi ng intention during driving privil ege gradual handover come from the driver and active safety system . Therefore, the vehicle control according to the intentions of the two has become a p roblem. The non-cooperative dynam ic game can be used to describe the problem that mult iple decision makers act on the same dynam ic system[18 ]. Hence, the non-cooperativ e d ynamic game can be app lied to deal w ith the conflict during dri ving privilege handover . The a pplication of dy namic game in vehi cle system is relatively limited. T he dy namic game i s employ ed to study the vehicle evaluation m ethod under worst -case [1 9, 20]. The vehicle contr ol strategies which take t he driver behavior in to consideration are constructed based on the closed- loop game[21, 22]. The game theory i s used to m odel the control behavior of the driver and the acti ve front steeri ng controller [2 3]. 2. Naturalist ic Driving Data The natural drivi ng data used in this paper come from 3 databases, i.e. the China-FOT (China field operational test), the danger ous scenario dat abase, and the OEM F OT . 2.1 China-F OT Fig 2. The test vehicl e, data acquisition sy stem and camera in the China- FOT China-F OT is collected by usi ng 8 test v ehicles. The test vehicles are all V olvo S60L. The v ehicle state informat ion come from the CAN bus, and the surroundi ng traf fic information are obtained by 4 cameras. Thirty- two drivers participat e in the test, including 25 m en and 7 women. The age of driver is between 28 and 39 (m ean: 32.25; SD : 2.84). All drivers ha ve their own vehicles before the test. The mileage ranges from 15,000km to 240,000km (mean : 108,375; SD : 63,598). Henc e, all drivers in China-F OT are not newbie. Each driver use s the test vehicle for about 3 months. Drivers can drive the t est car to any place at any time during the t est. China-FOT have collect ed 7,402 t rips . The travel distance is 129,93 5 km. 2.2 Dangerous Scenario Database The dangerous scenari o database is coll ected by using video driv e recorder (VDR) inst alled on the v ehicle. The VDR of Horiba with built-in veloci ty sensor and accele ration sensor is used. Brake deceleration equal to 0.4 g is chosen as a trigger value, and the VDR only records the data within the period from 15s before to 5s after a trigger . About 4,000 trigger cases are collected during 4 year s. The minimum TTC less than 2s is used to select the dangerous cases. And 1200 cases are obtained. The 1200 cases are manually screened, and the cases which may not be dangerous are elimi nated. In the end, 500 danger ous case s with high risk level are obt ained. Fig 3. The test vehicl e, VDR and dat a processing sy stem in the dangerous sce nario database 2.3 OEM F OT The OEM FOT is derived from the field operational test of an anonym ous OEM (original equipment manufactur er) . All test vehicles are production passenger cars of the OEM. The vehicle state inform a tion come from the CAN bus, and the surrounding traf fic inform ation are obtained by using Mobiey e EyeQ3. The Mobieye EyeQ3 provides inform ation of 5 targets in front, including tar get type, target width, relative distance, relative speed, relative acceleration, et c. Only par t o f the data in t he OEM FOT are available. The travel distance is 1,220 km. Fig 4. The Mobiley e E yeQ3 v ideo information in t he OEM FOT 2.4 Scenario E xtraction Each of the 3 dat abases has its ow n advantages and disadvant ages. The driving pr ocess of the driver is com ple tely undisturbed in China-F OT . And China-FOT has long acquisition time, rich driving scenarios, and complete vehicle state informat ion and video information. However , the surroundi ng traf fic envir on ment parameter s i n China-F OT are obtained through image identification. Hence, t he accuracy is not high. The danger ous scenari o databas e mai nly collects dangerous cases. The risk level of the dangerous case is high. However , the dangerous scenario database only records data wi thin 20s for each case. The OEM FOT has hi gh quality surrounding traf fic environm ent information, but the amount of data is lim ited. Theref ore, dif ferent scenarios are extract ed by using dif ferent databases according to the features of t hese 3 databases. a) The cut-in cases are extract ed by using China-FOT , and 326 cut - in cases are obtained. These cut- in case s are classifi ed into norm al cut-in and dangerous cut- in by using t he autom atic detection method intr oduced in [ 24]. In the last, 249 norm al cut-in cases and 77 dangerous cut -i n cases are obtained. b) The dangerous car -follow ing cases are extracted by using the dangerous scenario database. The 500 dangerous cases are classi fi ed, and 75 dangerous c ar- following cases with high r isk level are obtai ned. c) The normal car - following cases are extracted by using the OEM FOT . T h is FOT is a control test for cer tain ADAS functions. H ence, the ADAS is working at certain times during the test. First ly , the manual driving data are picked out by using the variables in the CAN bus which indicate the on/off of the ADAS. Next, the car - following cases are extracted by using the information collected by the Mobiey e EyeQ3, including the tar get type, lateral and longitudinal relati ve distance, longitudinal relative veloci ty . In the last, manual screening is applied to remove the car - following cases whi ch may be dangerous. And 822 no rmal car - following cases are obtai ned. 3. Driving Privi lege A ssignm ent based on Risk L evel 3.1 Obvious Ri sk and Potenti al Risk As have mentioned before, TTC or 1/TTC cannot accurately represent the risk level when the relative velocity is small. It will be helpful to take the possible future braking operations of the tar get vehic le into account, e.g. the Mazda avoidance logic [2 5], the safety mar gin[26], and the responsibi lity sensitive safet y (RSS )[2 7]. In this paper , TTC is defined as an obvious risk m easure, whereas the time b efore the host vehicle has to brake assum ing that the target vehicle i s braking is defined as the potential risk m easure, i.e. the ti me mar gin (TM). Fig 5. The collision av oidance process The collisi on avoidance pro cess when the target vehicle brakes to stop with a constant decelerat ion is shown in Fig 5. x h , v h , a h are the position, vel ocity , and brake decel eration of the host vehicl e, respectively . x t , v t , and a t are the position, velocity , and brake deceleration of the target vehi cle, respecti vely . a h and a t take the absolute value of the brake deceler ation. D is the rel ative distance. t i s the time from the current tim e until the host vehicl e starts to decelerate. t should contain 3 parts, i.e. the driver braking reaction time τ 1 , the braking system reaction time τ 2 , and the tim e t 0 which the driver can freely use. In order to av oid the colli sion when t he tar get vehicle brakes, it should be 22 t t h h h 22 + + D v a v t v a (1) That is 22 t t h h 0 1 2 h 22 ++ +− D v a v a t τ τ v (2) When the tar get v ehicle brakes with a constant decelerat ion, the maximum v a lue of the sum of τ 1 , τ 2 and t 0 is defined as the ti me mar gin (TM), i.e. 22 t t h h h 22 TM +− = D v a v a v (3) The brake decel eration of the host vehicle and the tar get vehicl e is selected according to the friction limit of the vehicle, i.e. a h = a t =7m/s 2 . TM indicates the reaction ti me left to the driver of the host veh icle if the t arget vehicl e st arts to brake. TTC indicates the risk lev el in the current state, where as TM indicates the risk lev el if the tar get vehicle suddenly brakes. Therefore, TTC is defined as a obvious r isk measure, and TM is defin ed as a pot ential risk m easure. TM is m ainly used to charact erize the risk level when the relative v elocity is small. 3.2 Risk Assessment in Car- f ollowing A risk assessment algorithm is proposed by using the 7 5 dan gerous car - following cases. In the dangerous car - followi ng cases, the moment when the vehicl e starts to decelerate is the time when the driv er feels the danger and reacts to the it . And this moment is defined as the break starting time. Therefore , the dangerous threshold is determ ined by using the TTC and TM at the braking star ting time. Since TTC may become very lar ge when the risk level is low , 1/TTC is applied to define the obvious risk level. The 1/ TTC at the braki ng start time is used to deter mine the obvious risk thres hold. It is found that t he 1/TTC at last- second braking onset is related to the velocity of the host vehicle[28]. Hence, it is necessary to discuss whether the velocity of the host vehicle has a significant influence on the 1/TTC at the braking start time. The relationship between the 1/TTC and velocity is shown in Fig 6. The regression coef ficient test is used to verify whet her the 1/TTC has a significant regression relationship with the velocity . The results are shown in T able 1. The Durbin-W atson test indicates that the residual has no significant autocorrelation. And the data is suitable for regression analysis. The regression coeffici ent test shows that 1/TTC and velocity have a signifi cant regression relationship. Therefore, the impact of the velocity should be considered when 1/TTC is used to classify the risk level. The empirical regression coef ficient between 1/TT C and velocity is -0.0717. T able 1 The results of regres sion coeff icient test Durbin-W atson test Regression c oefficient test D.W . value p value t value p value 1/TTC 2.022 p <0.01 t (73)=-3.850 p <0.001 TM 1.867 p <0.01 t (73)=-1.193 p =0.237 Fig 6. The 1/TTC at the brake starting tim e and the velocity of the host vehi cle The 5th, 50th, a nd 95th percent iles of the 1/TTC at t he braking start tim e in 75 dangerous car -follow ing cases are 95 50 5 0.07 17 1.73 0.07 17 1.18 0.07 17 0 .49 −+ = = = −+ −+ x x x ittc ittc it v tc v v (4) These 3 percentil es indicate that 5%, 50%, and 95% of the drivers brake when the 1/TTC reaches the correspondi ng threshold. When the obvious risk level is divided by using the threshold associated with the velocity , the thresholds will reach 0 as the velocity increases. A m inimum value of the 1/TTC is set for each obvious risk level. Consequently , the obvious r isk level is 51 5 1 50 2 50 2 95 3 95 3 OR 0 : 1 / TTC max ( , ); OR 1 : m ax( , ) 1 / TTC m ax( , ); OR 2 : max ( , ) 1 / T TC max ( , ); OR3 : 1 / TTC max( , ). ittc thr ittc thr ittc thr ittc thr ittc thr ittc thr (5) Where OR0 m eans no obvious ri sk. OR1, OR2 and OR3 i ndicate the level 1, level 2 and level 3 obv ious risk level . thr 1 , thr 2 , and thr 3 are the 1/TTC minimum values in the 3 risk levels, respectively . Referring to [29], the 1/TT C minim um values are set as thr 1 =0.33s -1 , thr 2 =0.66s -1 , and thr 3 =1s -1 . The TM at the brake startin g tim e is used to determ ine the potenti al risk threshold . Similarly , the regression coef ficient h ypothes is test is used to discuss whether TM has a signi ficant regression relationship with the velocity . The relationship between the TM and velocity is shown in Fig 7. The regression coef ficient test is used to verify whether TM has a si gnificant regression relationship with the v elocity . The r esults are shown in T able 1. The D urbin- W atson test indicates that t he residual has no signi ficant autocorrel ation. And the data is suitable for regres sion analysi s. The regression coef ficient t est shows that TM and velocity have no si gnificant regression relationship. Therefore, the influence of the velocity i s not considered in the potential risk lev el. And the horizontal lines ar e employ ed to divide the TM threshold s. Fig 7. The TM at t he brake start ing time and the v elocity of the host v ehicle The 5th, 50th, and 95th percenti les of TM at the brake starting time in 75 dangerous car -following case s are 1.4s, 0.5s, and 0, respect ively . These 3 percent iles indicate that 5%, 50%, and 95% of the dri vers brake when TM reaches the correspondin g threshold. These 3 percentil es are applied to be t he thresholds for th e potential risk l evel, i.e. PR 0 TM 1.4 s; PR 1 : 0.5s
Original Paper
Loading high-quality paper...
Comments & Academic Discussion
Loading comments...
Leave a Comment