Differentiated Backprojection Domain Deep Learning for Conebeam Artifact Removal
Conebeam CT using a circular trajectory is quite often used for various applications due to its relative simple geometry. For conebeam geometry, Feldkamp, Davis and Kress algorithm is regarded as the standard reconstruction method, but this algorithm…
Authors: Yoseob Han, Junyoung Kim, Jong Chul Ye
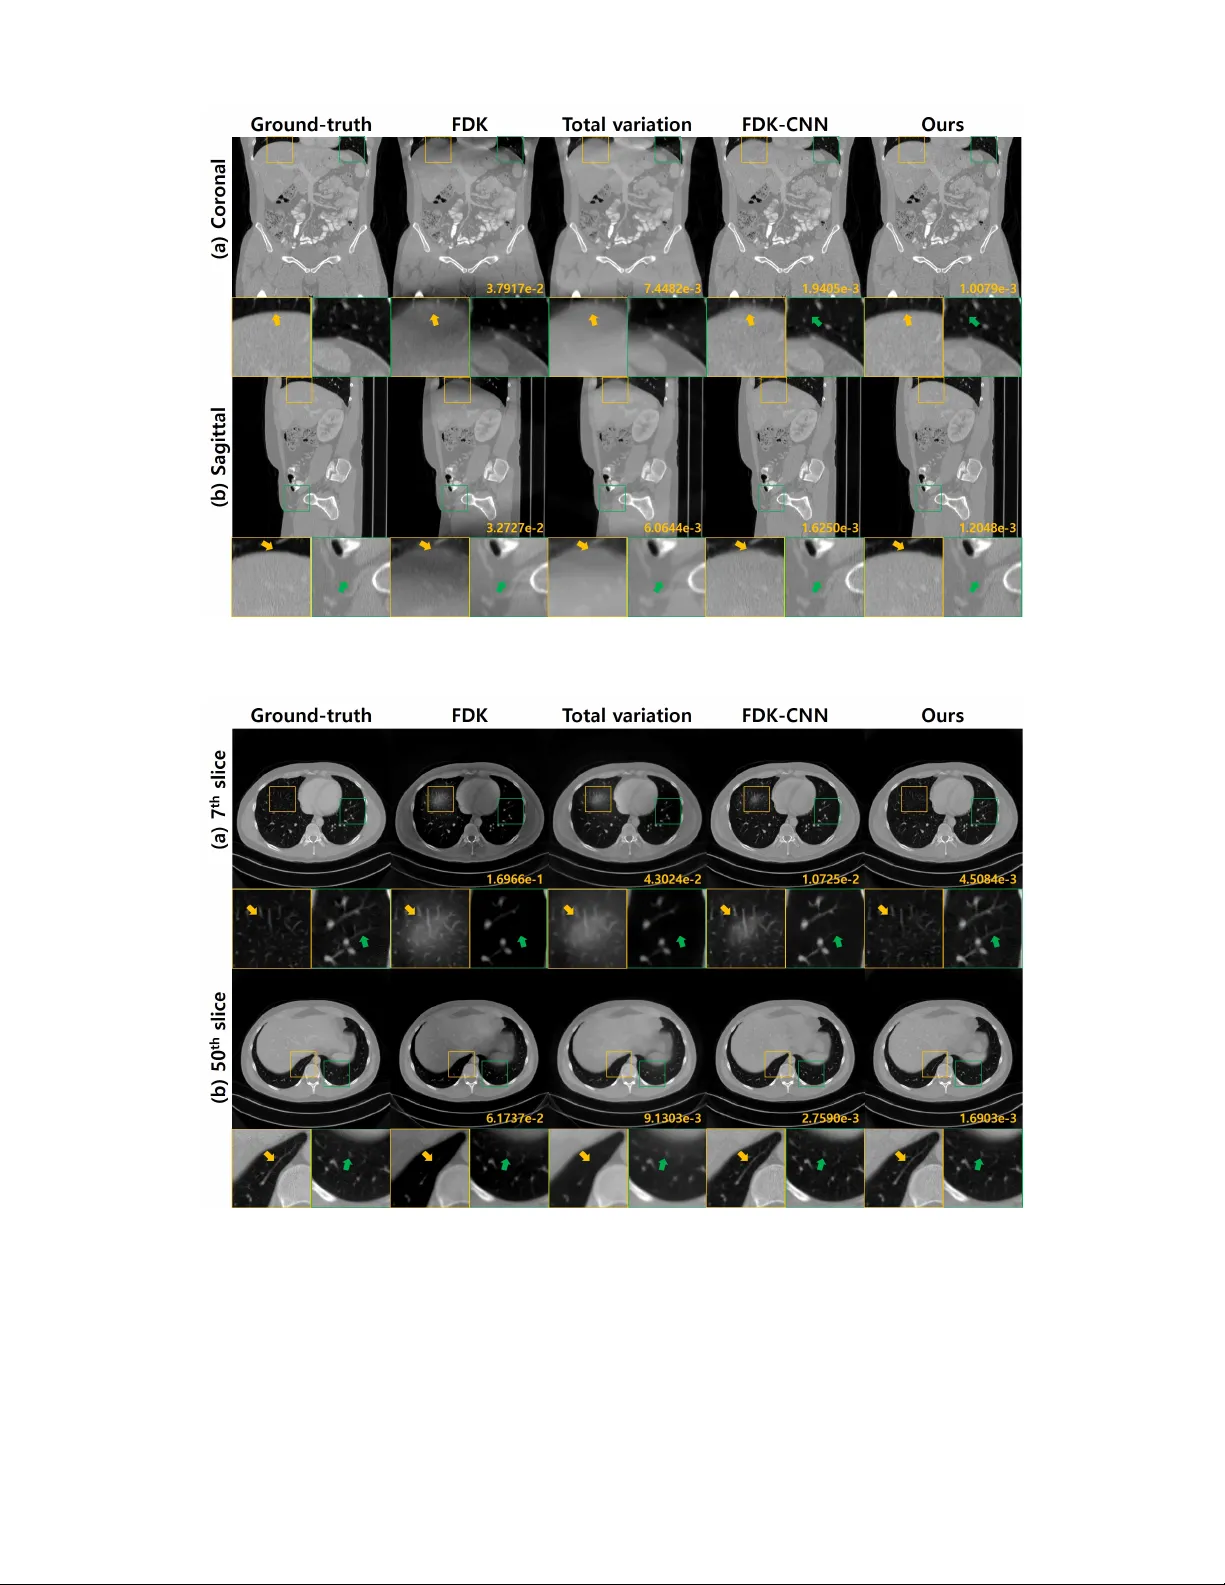
1 Dif ferentiated Backprojection Domain Deep Learning for Conebeam Artifact Remo v al Y oseob Han, Junyoung Kim, and Jong Chul Y e, F ellow , IEEE Abstract —Conebeam CT using a cir cular trajectory is quite often used for v arious applications due to its relati ve simple geometry . For conebeam geometry , Feldkamp, Davis and Kress algorithm is regarded as the standard reconstruction method, but this algorithm suffers from so-called conebeam artifacts as the cone angle increases. V arious model-based iterative reconstruc- tion methods hav e been dev eloped to reduce the cone-beam arti- facts, b ut these algorithms usually r equire multiple applications of computational expensiv e f orward and backprojections. In this paper , we develop a novel deep learning approach for accurate conebeam artifact remo val. In particular , our deep network, designed on the differentiated backprojection domain, performs a data-driven inversion of an ill-posed deconv olution problem associated with the Hilbert transform. The reconstruction results along the coronal and sagittal directions are then combined using a spectral blending technique to minimize the spectral leakage. Experimental results under various conditions confirmed that our method generalizes well and outperforms the existing iterative methods despite significantly reduced runtime complexity . Index T erms —Computed T omography , cone-beam artifact, deep learning, spectral blending I . I N T R O D U C T I O N C ONEBEAM X-ray CT with a large number of detector rows is often used for interventional imaging, dental CT , etc, due to the capability of obtaining high-resolution projection images with a relative simple scanner geometry . For the conebeam geometry , Feldkamp, Davis and Kress (FDK) al- gorithm [1] has been extensi vely used as a standard reconstruc- tion method. Unfortunately , the FDK algorithm for conebeam CT usually suf fers from conebeam artifacts as the cone-angle increases. T o address this problem, some researchers ha ve proposed modified FDK algorithms by introducing angle- dependent weighting on the measured projection data [2]–[4]. Howe ver , these methods usually work only for small cone angles. Mathematically , conebeam artifacts arise from inherent de- fects in the circular trajectory that does not satisfy the Tuy’ s condition [5]. In Fourier domain, this is manifested as the Y . Han is with the Theoretical Division, Los Alamos National Laboratory , Los Alamos, NM 87545, USA (e-mail: yoseobhan@lanl.go v). J. Kim, and J. C. Y e are with the Department of Bio and Brain Engineering, Korea Adv anced Institute of Science and T echnology (KAIST), Daejeon 34141, Republic of K orea (e-mail: { junyoung.kim, jong.ye } @kaist.ac.kr). J.C. Y e is also with the Department of Mathematical Sciences, KAIST . This work was performed when the first author was at KAIST . The first two authors contributed equally to this work. This work was supported by the T echnology de velopment Program (1425117734) funded by the Ministry of SMEs and Startups (MSS, K orea). Copyright (c) 2019 IEEE. Personal use of this material is permitted. Howe ver, permission to use this material for any other purposes must be obtained from the IEEE by sending a request to pubs-permissions@ieee.org. missing spectral components at the specific frequencies that are determined by the scanner geometry [6]–[8]. Accordingly , without the use of additional prior information, accurate re- mov al of the conebeam artifacts may not be feasible. T o address this issue, several model-based iterativ e recon- struction (MBIR) methods [9]–[12] hav e been proposed by imposing total variation (TV) and other penalties. The role of the penalty function is to impose the constraint to compensate for the missing frequency . Unfortunately , these algorithms are computationally expensiv e due to the iterative applications of 3-D projection and backprojection. In recent years, deep learning approaches have been suc- cessfully used for a variety of applications from image clas- sification to medical image reconstruction [13]–[22]. In X- ray CT , various deep learning reconstruction methods have been developed for low-dose CT [16]–[18], sparse-vie w CT [15], [19], [20], interior tomography [21], [22], and so on. In addition, in recent theoretical works [23], [24], the authors showed that a deep conv olutional neural network with an encoder-decoder structure is related to a nov el frame expansion using combinatorial con volutional frames. More specifically , thanks to the rectified linear unit (ReLU) nonlinearities, the input space is partitioned into large number of non-overlapping regions so that input images for each region share the same linear frame representation [24]. Therefore, once a neural network is trained, each input image can automatically choose the appropriate linear representation. Inspired by these findings, here we propose a deep neural network for conebeam artifact remov al. Instead of using stan- dard image domain implementation of deep neural networks, we are aiming for a further step. Specifically , we hav e sho wn in our prior work [25] that the conebeam reconstruction problem can be solved by successiv e 2-D reconstruction in the differentiated backprojection (DBP) domain and subsequent spectral mixing to minimize spectral loss. This was due to the the e xact factorization of the initial 3-D conebeam reconstruction problem into a set of independent 2-D in version problems as proposed by [26]. Furthermore, in our recent paper [22] for interior tomography problem, we hav e also demonstrated that deep neural networks on the DBP domain generalize better than the image domain approaches [21]. By synergistically combining these findings, we propose a DBP domain deep learning frame work for cone-beam artifact remov al. Specifically , as shown in Fig. 1, the input of our neural networks is the DBP images either in the coronal and sagittal directions, and our deep neural network is trained to solve a decon volution problem inv olving Hilbert transform. Finally , the reconstructed 3-D volumes along the coronal and 2 Fig. 1. Overvie w for differentiated backrpoejction domain deep learning. (a) shows the differentiated backprojection parts of coronal and sagittal directions, respectiv ely . (b) illustrates the neural network part, and (c) shows the spectral blending. sagittal directional DBP are blended into a one 3-D volume using spectral mixing techniques. Similar to our prior observation from ROI tomography [21], this paper shows that the neural network trained on the DBP domain generalizes better and can remov e conebeam artifact accurately under various conditions that are not considered during the training phase. For example, a neural network trained on a specific cone-angle can be used for dif ferent cone-angles without retraining the neural network, and the neural network trained on the noiseless simulation data can be successfully used for noisy real measurements. The origin of such improved generalization will be discussed. This paper is structured as follo ws. In Section II, the mathematical preliminaries for conebeam CT using a circular trajectory are provided. Section III then discusses our main contributions: the DBP domain deep neural network and spectral blending. The experimental data set and the neural network training are explained in Section IV. The experimental results are given in Section V, which is followed by discussion and conclusions in Sections VI and VII, respectiv ely . I I . M AT H E M A T I C A L P R E L I M I NA R I E S A. Notation Let x = ( x, y, z ) denote the point in R 3 , where x, y and z are the Cartesian coordinates with respect to the patient. For the circular trajectory , the X-ray source rotates around the object f ( x ) such that the source trajectory is represented by a ( λ ) = R cos λ R sin λ 0 > , λ ∈ [0 , 2 π ] , (1) where R denotes the radius of the circular scan. In this paper , the symbol > denotes the transpose of a matrix or vector . The X-ray transform D f , which maps f ( x ) into the set of its line integrals, is defined as D f ( a , θ ) = Z ∞ −∞ dt f ( a + t θ ) , (2) where θ denote a vector on the unit sphere S ∈ R 3 . The 3-D in verse Fourier transform is defined by f ( x ) = 1 (2 π ) 3 Z d ω ˆ f ( ω ) e ι ω > x , (3) where ˆ f ( ω ) denotes the Fourier transform of f ( x ) , ω ∈ R 3 refers to the angular frequency , and ι = √ − 1 . B. Differ entiated Backpr ojection (DBP) For a given X-ray source trajectory a ( λ ) , the differentiated backprojection (DBP) on a point x ∈ R 3 using the projection data from x-ray source trajectory a ( λ ) , λ ∈ [ λ − , λ + ] is defined as [27]–[29]: g ( x ) = Z λ + λ − dλ 1 k x − a ( λ ) k ∂ ∂ µ D f ( a ( µ ) , θ ) µ = λ , (4) where 1 / k x − a ( λ ) k is the magnification factor dependent weighting. One of the most fundamental properties of the DBP is its relationship to Fourier transform (3). Specifically , the DBP data in (4) can be represented as [25], [29]: g ( x ) = 1 (2 π ) 3 Z d ω ˆ f ( ω ) e ι ω > x σ ( x , ω , λ ± ) , (5) where σ ( x , ω , λ ± ) = ιπ [sgn( ω > d − ( x )) − sgn( ω > d + ( x ))] , (6) and d + ( x ) = x − a ( λ + ) k x − a ( λ + ) k , d − ( x ) = x − a ( λ − ) k x − a ( λ − ) k (7) Compared to the Fourier formulation in (3), the main differ - ence of (5) is the additional term σ ( x , ω , λ ± ) . This suggests that DBP provides a filtered version of f ( x ) . Since the spectrum of the filter σ ( x , ω , λ ± ) also depends on x , the corresponding filter is a spatially varying filter . C. F actorized Representation of Conebeam Geometry Inspired by the relationship in (5), Dennerlein et al [26] proposed a factorization method for the conebeam CT with the circular trajectory . Similar idea was proposed by Y u et Fig. 2. Coordinate system on a factorized conebeam geometry . 3 Fig. 3. Source geometry and filtering directions on the plane of interests. al [30], so we introduce the key ideas of these factorization methods. Figure 2 illustrates the geometry of conebeam CT with circular trajectories. Here, consider a plane that is parallel to the z -axis and intersects the source trajectory at two locations a ( λ − ) and a ( λ + ) . Let P denote such a plane of interest. Then, the main goal of the factorization methods [26], [30] is to con vert the 3-D reconstruction problem to a successive 2- D problems on the planes of interest. Specifically , on a plane of interest P , we define virtual chord lines and virtual source locations. The virtual chord line coordinate system is defined by the virtual chord line direction e , the z -axis e z , and their perpendicular axis e ⊥ . The virtual sources a v ( λ + ) , a v ( λ − ) can be simply computed as a v ( λ ) = a ( λ ) + z e z . Then, Cartesian coordinate x is now conv erted to a new coordinate ( t, s, z ) such that x = t e + s e ⊥ + z e z . (8) On a giv en plane of interest P with a fixed s , with a slight abuse of notation, the object density and the DBP data can be represented by the following 2-D functions f ( t, z ) := f ( x ( t, z )) , g ( t, z ) := g ( x ( t, z )) . Since the first and the second term in σ ( x , ω , λ ± ) in (6) corresponds to the Hilbert transform along d − ( x ) and d + ( x ) direction, respectiv ely , the authors in [26] showed that (5) can be simply represented as g ( t, z ) = π Z ∞ −∞ h H ( t − τ ) ( f ( τ , z 1 ( τ )) + f ( τ , z 2 ( τ )) dτ , (9) where h H ( t ) denotes the Hilbert transform, and z 1 ( τ ) and z 2 ( τ ) refer to the coordinate along L 1 and L 2 lines as sho wn in Fig. 3. This implies that the conebeam reconstruction problem can be addressed by solving a deconv olution problem in the DBP domain. I I I . M A I N C O N T R I B U T I O N A. Encoder-Decoder CNNs for Decon volution on P Although (9) suggests that a decon volution algorithm can recov er the original image f ( t, z ) from g ( t, z ) on each plane of interest P , there are two technical difficulties. First, the grid for the unknown image is not a standard cartesian grid due to the t dependent z 1 ( t ) and z 2 ( t ) coordinates. In fact, f ( t, z 1 ( t )) and f ( t, z 2 ( t )) can be regarded as deformed images of f ( t, z ) on ne w coordinate systems. Therefore, the con volution filter is spatially varying, so standard deconv olution methods do not work. Second, the deconv olution problem is highly ill- posed, since each DBP data g ( t, z ) has contribution from two deformed images, f ( t, z 1 ( t )) and f ( t, z 2 ( t )) . Accordingly , the authors in [26] proposed a re gularized matrix in version ap- proach after the discretization of the intergration with respect to the original fixed cartesian grid for the unknown images. This makes the decon v olution algorithm by Dennerlein et al [26] computationally expensi ve and sensitive to many hyper- parameters. On the other hand, once the neural network is trained, the inference stage of the neural network does not require any computationally expensi ve optimization method, which makes the algorithm significantly faster . In general, a decon volution algorithm for (9) can be repre- sented as a mapping: T : g 7→ f , g ∈ X , f ∈ Y (10) where X denotes the input space where DBP data g ( t, z ) liv es, and Y refers to the space that the image f ( t, z ) belongs. For the case of T ikhonov regularization, T has a closed form expression; but for general regularization functions such as l 1 or total variation (TV), the in verse mapping T is generally nonlinear , and should be found using computationally expen- siv e iterative methods. A quick remedy to reduce the run-time computational complexity would be precalculating nonlinear mapping T . Unfortunately , as the mapping T depends on the input, storing T for all inputs will require huge amount of memory and is not even feasible. In this regard, an encoder-decoder CNNs (E-D CNN) using ReLU nonlinearities provides an ingenious way of addressing this issue. Specifically , in our recent theoretical work [24], we showed that an encoder-decoder CNN with ReLU nonlinearity is a piecewise linear approximation of a nonlinear mapping, which is composed of lar ge number of locally linear mappings. More specifically , the input space X is partitioned into non- ov erlapping regions where input for each region shares the common linear representation. Then, the switching to the corresponding linear representation for each input can be done instantaneously based on the ReLU acti v ation patterns. W e further sho wed that although the piecewise linear property of CNN may provide a limitation to approximate arbitrary nonlinear functions, it also provides good architectural prior known as inducti ve bias, which results in inherent regular- ization effects. As will be shown in experimental results, we found that this inductiv e basis works fa v orable for conebeam artifact removal by providing more generalization power . Another unique aspect of deep neural network is that these exponentially many linear representations can be deri ved from a small set of filter sets thanks to the combinatorial nature of the ReLU nonlinearities. Specifically , the network training is to estimate the filter set Θ : min Θ N X i =1 k f ( i ) − T Θ g ( i ) k 2 2 , (11) where { ( f ( i ) , g ( i ) ) } N i =1 denotes the training data set composed 4 (a) (b) (c) (d) Fig. 4. The missing frequency region. (a) The top view of a point x = ( x, y, z ) and an source trajectory . The blue line indicates the coronal directional plane of interest, and the red line denotes the sagittal directional plane of interest. (b)(c) The missing frequency region for coronal and sagittal directional processing, respectively . (d) The dark region denotes a common missing frequency region, respectiv ely . of ground-truth image and DBP image, and T Θ : g 7→ f , g ∈ X , f ∈ Y refers to the in verse mapping parameterized by Θ . Usually , filter parameters Θ require much smaller memory and space. On the other hand, the number of associated linear represen- tations increases exponentially with the network depth, width, and skipped connection. This exponential expressi vity and the input adaptability make the neural network po werful in approximating nonlinear function with relativ ely small number of parameters. B. Spectral Blending Although the factorization method leads to 2-D deep learn- ing approach for each plane of interest, Theorem 2.2 in our previous work [25] sho wed that the missing frequency region depends on the direction of the plane of interest. Howe ver , we also showed in our prior work [25] that at any point x , if the missing frequency regions for different filtering directions are appropriately combined, we can minimize the artifacts from the missing frequency regions. Accordingly , this section describes this in detail. Suppose that we are interested in recov ering a vox el at x = ( x, y , z ) from the DBP data. Figure 4(a) illustrates the top vie w of a point x and a source trajectory . In Figure 4(a), a v ( λ ) denotes the corresponding virtual source location. Now , consider the image reconstruction along the coronal direction where the plane of interest P is aligned in the horizontal direc- tion (for example, between a v ( λ − 1 ) and a v ( λ + 1 ) ). According to the spectral analysis in [25], the resulting DBP data has missing frequency regions along sagittal direction as illustrated in Figure 4(b). Therefore, any decon volution algorithm using the coronal directional DBP data may ha ve noise boosting along the sagittal direction due to the ill-posedness in the missing frequency regions. Similarly , for the DBP data along sagittal direction (for example, between a v ( λ − 2 ) and a v ( λ + 2 ) ), the corresponding missing frequency region is gi ven by Figure 4(c), which results in the noise-boosting after the deco volution. This leads to an important question: which directional plane we should choose? For the case of full scan conebeam CT , there are redundancy in the 2-D factorization of the 3-D data, which can be exploited to answer the question. More specifically , we can perform reconstruction for both coronal and sagittal directions, and combine them. Figure 4(d) is the resulting missing frequency regions by combining the reconstruction results from two directions. In particular , the common missing frequency region is a dark square centered at the origin, which is the intersection of the two missing frequency regions in coronal and sagittal processing. This implies that except for the common frequency regions, the missing spectral components in coronal directional processing can be compensated by the results from the sagittal processing, and vice versa. Fig. 5 shows a flowchart for the spectral blending that was proposed in [25] to achie ve this synergistic combination. In particular , the axial images f cor and f sag from coronal and sagittal reconstructed 3-D volumes are first con verted to the spectral domain using the 2-D Fourier transform. Due to the ill-posedness along the missing frequency regions, streak pattern artifacts, as indicated by the yellow arrows in Fig. 5(b), are usually visible in the Fourier domain along the miss- ing frequency region. Then, we apply the bow-type spectral weighting to suppress the signal in the missing frequency regions and combined them together . This process can be mathematically represented by f com = F − 1 { w F { f cor } + (1 − w ) F { f sag }} . where F and F − 1 denote the Fourier and in verse Fourier transforms, respectively; w and 1 − w are the bow-tie spectral masks as shown in Fig. 5 (b), and denotes the element-wise multiplication. I V . M E T H O D A. Numerical Experiments The proposed neural network is formulated in a supervised learning framew ork, so we need many matched input and output pairs. T o deal with the data issues, the proposed neural network is basically trained using simulated noiseless conebeam projection data from ground-truth 3-D volume data. Specifically , the conebeam projection data and its processed version (such as DBP data) are used as the neural network input, and the ground-truth 3-D volume data are used as the label data for supervised training. 5 Fig. 5. Flowchart for the spectral blending. (a) sho ws axial images from the coronal and sagittal directional processed 3-D reconstruction by neural networks. (b) illustrates spectral blending, and (c) shows reconstruction result from spectral blending. Fig. 6. Disk phantom. (a) sho ws the disk image on the axial plane. (b) and (c) illustrates cut-views from coronal and sagittal planes, respectiv ely . 1) Data Set: More specifically , to train the neural network using simulated projection data, simulated projection data from ten subject data sets from American Association of Physicists in Medicine (AAPM) Lo w-Dose CT Grand Challenge were used. The data set was selected from the abdominal scans that include liv er regions. The x − y size of images is 512 × 512 and the z size ranges from 400 to 600, but varies from the patient to the patient. The voxel size is 1 mm 3 . Out of ten patient, eight patient data were used as training sets, one patient data was used as validation set, and the other patient data was used for test set. T o inv estigate the dependency on the training data size, we also performed separate neural network training by reducing the number of training sets. Additionally , we also conducted the experiments using the numerical phantoms in Fig. 6, whose CT number are either 5,108 Hounsfield Unit (HU) or -1,000 HU. Specifically , Fig. 6 sho ws a typical example of numerical phantom composed of disks with the same thickness and the spacing between the adjacent disks. The radius of disk is 80 mm. By changing the size, radius, the number , thickness, and spacing as shown in T able I, we created various phantoms. As we know the ground-truth values, these data set were used to in vestigate the network performance in a more quantitati ve way . T ABLE I S P EC I FI C A T I ON O F D I S K P H AN T O M PA R AM E T E RS . ( A ) ( B ) ( C ) W ER E U SE D F O R FI N E - TU N I N G , A N D ( D ) WAS U S ED F O R T E ST . (a) (b) (c) (d) Thickness [mm] 10 14 20 16 Spacing [mm] 10 14 20 16 Number of disks 9 7 5 7 2) Conebeam Pr ojection Data Generation: From the vol- ume data set from AAPM and the numerical phantoms,i conebeam CT sinogram data are numerically generated using numerical cone-beam projection. No noise is added in this simulated data generation. For the numerical projector , the following geometric parameters were used. The number of detectors was assumed to be 1440 × 1440 elements with a pitch of 1 mm 2 . The number of views was set to 1200. The distance from source to origin (DSO) was 500 mm, and the distance from source to detector (DSD) was 1000 mm. The maximum cone angle was set to 35 . 8 ◦ , and the projection data were generated accordingly . Since our neural network is trained on the plane of interest along the coronal and sagittal slices, the training dataset also consists of coronal and sagittal slices. This corresponds to 8192 (512 × 8 × 2) and 1024 (512 × 1 × 2) coronal/sagittal slices for training and validation, respectiv ely . B. Real Data Experiments W e also obtained the real projection data from a real head phantom to validate the generalization po wer of the proposed method that is trained with the simulation data. The head phantom data was acquired from a conebeam CT with circular trajectory with X-ray of 140kVp-9mA. The detector was 1024 × 1024 array matrix with detector pitch of 0 . 4 × 0 . 4 mm 2 and the number of vie ws was 360. The distance from source to rotation axis is 1700 mm, and the distance from source to detector is 2250 mm. The cone-angle of the geometry is 10 . 32 ◦ . The reconstruction resolution of the real head phantom was 512 × 512 × 512 voxels with vox el size 0 . 703 × 0 . 703 × 0 . 703 mm 3 . C. Neural Network T raining Fig. 7 illustrates the input and output of the proposed deep learning methods. Both coronal and sagittal vie w DBP images are used as inputs, and the artifact-free coronal and sagittal view images are used as labels. For the full scan conebeam CT , the DBP images on the plane of interest P can be obtained using the two complementary source trajectories, i.e. a ( λ ) for λ ∈ [ λ − , λ + ] and λ ∈ [0 , 2 π ] \ [ λ − , λ + ] , respectiv ely , where \ denotes the set complement, i.e. A \ B = A ∩ B c . In this case, we use both DBP images as inputs as sho wn in Fig. 7. 6 Fig. 7. Proposed network input/output for conebeam artifact remo val. Fig. 8. U-Net backbone for our method and FDK-CNN. For data augmentation, the whole data set were performed with vertical flipping. The size of the mini-batch was 4 and the size of input patch is 256 × 256. Since con volution operations can be applied for different size images, the trained neural network were used for 512 × 512 images at the inference phase. The network backbone corresponds to a modified architec- ture of U-Net [14] as sho wn in Fig. 8. A yello w arrow in Fig. 8 is the basic operator and consists of 3 × 3 con volu- tions follo wed by a rectified linear unit (ReLU) and batch normalization. The yellow arrows between the separate blocks at each stage are not shown for simplicity . A red arro w is a 2 × 2 av erage pooling operator and located between the stages. A verage pooling operator reduces the size of the layers by four . In addition, a blue arro w is 2 × 2 average unpooling operator , reducing the number of channels by half and increasing the size of the layer by four . A violet arrow is the skip and concatenation operator . A green arro w is the simple 1 × 1 con volution operator generating final reconstruction image. The total number of trainable parameters is about 22,000,000. MatCon vNet toolbox (ver .24) [31] was used to implement FDK and DBP domain networks in MA TLAB R2015a envi- ronment. Processing units used in this research are Intel Core i7-7700 (3.60 GHz) central processing unit (CPU) and GTX 1080 T i graphics processing unit (GPU). The l 2 loss was used as the objectiv e function of the training, and the number of epochs for training networks were 300. Stochastic gradient descent (SGD) method was used as an optimizer to train the network. The initial learning rate was 10 − 4 , which gradually dropped to 10 − 5 at each epoch. The regularization parameter was 10 − 4 . Since the numerical phantoms have different pixel distribu- tion from those of the AAPM data set, the neural networks should suffer from domain shift. Thus, fine-tuning using different disk phantoms is necessary to deal with the domain shift [32]. Specifically , the disk phantoms using the parameters in (a)(b)(c) of T able I was used for fine-tuning, and a disk phantom of T able I(d) was used at the test phase. D. Comparative Experiments As for comparison, we implemented two additional algo- rithms: a deep con volutional neural network using FDK re- construction (FDK-CNN), and TV penalized MBIR algorithm. The FDK-CNN was trained to learn the artifact-free images from the reconstructed images of the FDK algorithm using the incomplete projection data due to the cone angle. The input images were FDK images corrupted with the cone- beam artifact, whereas the artifact-free data was used as the ground truth. For a fair comparison, the coronal and sagittal views images are used as the network input similar to our DBP domain network. Note that FDK reconstruction combines projections from all full scan angle, so we cannot obtain the two different FDK images for each processing direction. This is why only two images along coronal and sagittal views are provided as inputs. The same U-Net architecture was also used for FDK domain neural networks. Accordingly , only dif ference from the proposed DBP domain deep network is the input images. Fig. 9 shows the con vergence plot for each network. The plots illustrate the loss curves calculated after spectral blending at the v alidation phase. Since the validation curves con verge closely , we concluded that the networks are well- trained without over -fitting. Fig. 9. Conver gence plots for the objectiv e function on v alidation set. The total variation (TV) penalized reconstruction is also implemented by solving the following optimization problem: min x 1 2 k y − Af k 2 2 + λ ( k∇ x f k 1 + k∇ y f k 1 + k∇ z f k 1 ) , where y and f are measured sinogram data and its 3-D image, A denotes a system matrix, ∇ x,y ,z denotes differentiated operator along ( x, y , z ) -axes, and λ is a regularization factor . For quantitativ e ev aluation, the normalized mean square error (NMSE) value was used, which is defined as NMSE = P M i =1 P N j =1 [ f ∗ ( i, j ) − f ( i, j )] 2 P M i =1 P N j =1 [ f ∗ ( i, j )] 2 , (12) where f and f ∗ denote the reconstructed images and ground truth, respectiv ely . M and N are the number of pixel for row and column. W e also use the peak signal to noise ratio (PSNR), which is defined by PSNR = 20 · log 10 N M k f ∗ k ∞ k f − f ∗ k 2 . (13) 7 Fig. 10. (a) and (b) are the ground-truth image and cone-beam reconstruction by FDK. Disk phantom reconstruction results from (c) FDK-CNN, and (d) proposed method. (e) shows the profiles along the gray line of the images. The number written to the images is the NMSE value. The values of the black and white part of the images are 0 and 1 respecti vely except (f). The windo w range of (f) is set to [0.48, 0.6] for better visualization. W e also use the structural similarity (SSIM) index [33], defined as SSIM = (2 µ f µ f ∗ + c 1 )(2 σ f f ∗ + c 2 ) ( µ 2 f + µ 2 f ∗ + c 1 )( σ 2 f + σ 2 f ∗ + c 2 ) , (14) where µ f is an a verage of f , σ 2 f is a v ariance of f and σ f f ∗ is a cov ariance of f and f ∗ . There are two variables to stabilize the division such as c 1 = ( k 1 L ) 2 and c 2 = ( k 2 L ) 2 . L is a dynamic range of the pixel intensities. k 1 and k 2 are constants by default k 1 = 0 . 01 and k 2 = 0 . 03 . V . E X P E R I M E N T A L R E S U LT S A. Numerical phantom r esults First, the reconstruction results using numerical phantom is illustrated in Fig. 10. In the FDK reconstruction result in Fig. 10(b), sev ere cone-beam artifacts were observ ed es- pecially in the regions far from the mid-plane. FDK-CNN reconstruction results in Fig. 10(c) can significantly improv e the reconstruction quality , but the shape of the disc gradually bends as it moves away from the midplane. Howe ver , our reconstruction method pro vided near perfect reconstruction without any bending artifacts as observed in Fig. 10(d). Quantitativ e NMSE value on each figure clearly confirmed that the proposed method significantly outperform other methods. When FDK-CNN and our neural network trained with AAPM data were directly used for the binary data without fine tuning, the results in Fig. 10(f) sho ws that the data is not correctly recov ered. This is as expected since the data distribution of the numerical phantom in Fig. 10(a) is binary with piecewise constant regions, which was nev er seen in AAPM data. Accordingly , the domain adaptation with fine- tuning using binary data was necessary . T ABLE II Q UA N TI TA T I V E C O MPA R IS O N F O R V A RI O U S A L G OR I T HM S . Metric FDK TV FDK-CNN Ours half Ours PSNR [dB] 32.05 34.39 39.99 41.76 42.49 NMSE ( × 10 − 3 ) 35.73 7.32 1.80 1.26 0.94 SSIM 0.78 0.78 0.91 0.97 0.97 T ime [sec/slice] - 14.06 0.10 0.12 0.12 B. AAPM data r esults Fig. 11 shows the reconstruction images of AAPM data along the coronal and sagittal planes. As sho wn in Fig. 11, the FDK reconstructions around the midplane are similar to the ground-truth images, b ut poor intensity and the cone-beam artifact are visible in the off-midplanes such as top and bottom areas. Although TV and FDK-CNN methods can improve the image quality , there are still remaining conebeam artifacts, and the reconstruction do not preserve the detailed structures and textures. On the other hand, our method clearly removes the artifact, maintains sophisticated structures and textures. Fig. 12 shows the axial view of the reconstruction results. The FDK image shows poor intensity and produces cone-beam artifacts due to the higher cone angles. While the TV and FDK-CNN methods compensate for the poor intensity , the cone-beam artifact still remained. In addition, the TV method does not preserve the detail texture, and the FDK-CNN ov erestimates in Fig. 12(a) or underestimates in Fig. 12(b). Ho wev er , the ours method preserved the detailed texture and clearly removed the cone-beam artifacts as shown in the enlar ged images of Fig. 12. T able II shows the quantitati ve comparisons of average PSNR, NSME, and SSIM and their computation times. Our method produces the best quantitativ e values in all metrics. In addition, we sho w the quantitative metric when our network was trained with dataset with only 50% of training data set. Even though the training set size was halved, our network shows superior result to FDK-CNN in various quantitativ e meaures. The computation time of the our network is slightly slower than that of FDK-CNN because the input size of our method is twice that of the FDK-CNN, but the neural network methods are much faster than TV method. C. Real Experimental Data Finally , we applied the proposed neural network, which was trained using only simulation data, to the real measurement to in vestigate its robustness to real system imperfections. Unlike the e xperiment for disk phantom, here we did not perform any fine-tuning, since we do not hav e ground-truth data. Despite this, the structure is well preserved by our method as sho wn in Fig. 13(a). Aside from conebeam artifact, the FDK-CNN produces additional artifacts inside of head. This issues will be discussed in more detail later . Although the conebeam artifact from FDK is not significant as in the simulation due to the small cone-angle, the zoomed areas at the top of the skull and the bottom of the the last lower vertebrae in the coronal direction still show conebeam artifact. Specifically , as shown in Fig. 13(a)(b) the tissue boundary at the lower vertebrae is a bit blurry in the FDK reconstruction 8 Fig. 11. (a) Coronal and (b) sagittal reconstruction results from cone-beam geometry . Y ellow and green boxes illustrate the enlarged views of different parts. The number written to the images is the NMSE value. Intensity range of the CT image is (-1000, 800) [HU]. Fig. 12. Ground-truth and reconstruction results from FDK, T otal variation, FDK-CNN, and proposed method. Y ellow and green boxes illustrate the enlarged views of different parts. The number written to the images is the NMSE value. The z-location of (a) is +236.6mm and (b) is +193.5mm and the intensity range of the CT image is (-1000, 800) [HU]. due to the conebeam artifacts, whereas the boundary is clear in our method. Additionally , in Fig. 13(a)(c) the crack and the space between the bones in the top skull was not visible in FDK and FDK-CNN due to the conebeam artifacts, whereas they are clearly visible in the proposed method. In order to confirm that this crack and space are really present, we conducted additional experiments by placing the suspected region (the top of the skull) at the mid-plane of a high resolution circular conebeam scanner . The detector array was 654 × 664 with the pitch of 250 µm , and the reconstructed image size is 512 × 512 with the pixel pitch of 310 µm . As shown in the bottom figure of Fig. 13, the resulting high resolution image clearly sho ws the crack and space of the skull which coincides with our reconstruction. The results 9 Fig. 13. (a) Results of head phantom without fine-tuning the network trained on AAPM datasets. The intensity range of the images is (-1000, 800)[HU]. Magnified views of (b) green box area, and (c) yellow-box area in tw o window lev els (top: (-1000,800)[HU], bottom: (300,700)[HU]). (d) A high resolution CT image is also illustrated as a ground-truth image. confirmed that the proposed method produces high resolution image with less conebeam artifacts compared to the standard FDK reconstruction. V I . D I S C U S S I O N A. Effects of spectral blending T o demonstrate the importance of spectral blending, the reconstruction results by separate processing along the coronal and the sagittal direction are sho wn in Fig. 14(c)(d), whereas the results from the spectral blending is shown in Fig. 14(e). The horizontal and vertical streaking artifacts patterns are visible in the axial vie w images in Fig. 14(c)(d), respectiv ely , where the artifact patterns appears along the direction of plane of interests. On the other hand, the spectral blending removes the streaking patterns as shown in Fig. 14(e). In the coronal and sagittal view reconstruction results, the results without the spectral blending exhibited remaining streaking patterns, whereas our method with spectral blending has successfully remov ed them. The PSNR v alues in T able III also confirmed that the spectral blending improves the reconstruction quality . T ABLE III Q UA N TI TA T I V E C O MPA R IS O N T O V A LI DAT E T H E I M P O RT A N C E O F S P EC T R A L B L E N DI N G . Metric Ours sagittal Ours coronal Ours PSNR [dB] 40.88 39.54 42.49 NMSE ( × 10 − 3 ) 1.30 1.73 0.94 SSIM 0.96 0.94 0.97 B. Effects of training data set size T o inv estigate the performance degradation with respect to the training data size, we also trained our neural network using various training data set size. Specifically , among the 8 patient data set that were originally assigned for the training data set, we randomly chose 1 ∼ 8 patient data set to train the proposed method and the FDK-CNN approach. As shown in T able IV(a), the proposed method outperformed the FDK-CNN across all training data set size. Moreover , the proposed method trained with 3 data set outperformed the FDK-CNN trained with 8 data set. This again confirms the superior generalization capability of the proposed method. C. Effects of unmatched cone-angles at the test phase Although we trained the neural network using the projection data from the cone-angle of 35.8 ◦ , at the test phase the trained neural network was applied for the projection data from various cone-angles from 16.7 ◦ to 35.8 ◦ . This experiment was to verify the generalization capability of the proposed method for cone-angle variations. As shown in T able IV(b), although the proposed method and FDK-CNN were trained using the T ABLE IV Q UA N TI TA T I V E C O MPA R IS O N F O R V A RI O U S E X P ER I M EN TA L C O ND I T I ON S PSNR [dB] NMSE( × 10 − 3 ) SSIM 1 FDK-CNN 34.00 7.31 0.76 Ours 38.62 2.41 0.92 (a) Number of 3 FDK-CNN 37.18 3.30 0.90 training Ours 40.43 1.57 0.94 data sets 5 FDK-CNN 39.64 2.11 0.91 Ours 41.76 1.21 0.96 8 FDK-CNN 39.99 1.80 0.91 Ours 42.49 0.94 0.97 16.1 ◦ FDK 37.28 7.83 0.89 FDK-CNN 39.11 2.15 0.92 Ours 39.74 1.39 0.94 19.8 ◦ FDK 36.92 9.89 0.88 FDK-CNN 39.51 1.73 0.93 (b) Cone Ours 40.33 1.22 0.95 angle 25.6 ◦ FDK 35.92 14.45 0.87 FDK-CNN 40.23 1.41 0.94 Ours 41.47 0.96 0.97 35.8 ◦ FDK 32.05 35.73 0.78 FDK-CNN 39.99 1.80 0.91 Ours 42.49 0.94 0.97 15.0dB FDK 25.90 4.68 0.55 FDK-CNN 26.50 3.95 0.66 Ours 31.29 0.97 0.69 (c) Measurement 16.5dB FDK 27.42 4.13 0.62 SNR FDK-CNN 30.46 1.24 0.73 Ours 34.23 0.48 0.80 19.2dB FDK 30.09 3.69 0.75 FDK-CNN 36.20 0.33 0.86 Ours 38.69 0.18 0.93 10 Fig. 14. Reconstruction results with and without spectral blending. The number written to the images is the NMSE value. (a) and (b) are the ground-truth image and FDK reconstructed result. (c) is reconstructed into a single network of sagittal DBP input, but (d) is reconstructed from coronal DBP input. (e) is reconstructed from spectral blending between (c) and (d). Intensity range of the CT image is (-1000, 800) [HU]. projection data from the cone-angle of 35 . 8 ◦ , our method outperforms the FDK-CNN for other cone-angle than FDK- CNN. This again confirms the generalization capability of the proposed method, which is particular useful for interventional imaging set-up, where the maximum cone-angle can be con- trolled by a beam blocking filter . Although in this experiment the neural network was trained only using larger cone angle data, the results could be further improved by training the network by combining the smaller angle data as training data. D. Noise r obustness Recall that our network was trained without adding noises. T o demonstrate the noise robustness of our method, we added noises to the projection data at the test phase using the Poisson noise models. The noise level was selected to result in 15.0, 16.5, and 19.2dB in SNR. Five realization of noises were generated and the resulting reconstruction results were av eraged. W e compare the result from our network to FDK- CNN. Fig. 15 shows typical reconstruction results by various algorithms. In particular , the FDK-CNN produces more no- ticeable artifacts compared to the FDK reconstruction. On the other hand, the proposed network trained on the DBP domain was very robust for different noise lev els. The quantitati ve comparison in T able IV(c) also confirmed that the proposed method outperforms other methods. This again confirms the generalization po wer of the proposed method. E. Generalization to real data Recall that FDK-CNN produces severe artifacts in Fig. 13. Now , the simulation results in Fig. 15 clearly explains the origin of the artifacts from FDK-CNN in Fig. 13. Specifically , the real projection measurements contain noises that are not considered during the training. Therefore, when a trained FDK-CNN neural network, which does not generalize well, was applied to the real projection measurement, this limited generalization power may have produced the artifacts. On the other hand, the proposed neural network trained using the DBP data is less sensiti ve to the noises as discussed before, so that when it is applied to the real measurement we did not observe any artifacts. It proves that the network trained on the DBP domain generalize well so that it works even on the data with unseen anatomical region and noise patterns. F . Limitations of the curr ent study While the paper pro vides promising results for conebeam artifact remo v al, the current study has sev eral limitations. First, as sho wn in disk phantom experiments in Fig. 10(e), the domain shift for unseen anatomical regions that has different CT number distribution could be a potential issue in practice, which deserves further in vestigation. Although the generating training dataset in simulation setup is relati vely simple, and in real clinical setting it is very difficult to obtain the matched reference data set. T o address this problem, we need an unsupervised training scheme, where the artif act-free images are obtained from other person or scans from complete trajectory (such as spiral scan in medical CT). In fact, our pre vious work [34] demonstrated that unsupervised learning using CycleGAN architecture provides excellent re- construction results for the low-dose CT applications and we believ e that similar unsupervised learning approach may be possible for conebeam artifact remov al. This is beyond the 11 Fig. 15. Reconstruction results for noise simulation. The number written to the images is the NMSE value. Initial X-ray intensity is 5 × 10 5 which result in 15.0dB of SNR and the intensity range of the CT image is (-1000, 800) [HU]. scope of the current paper , and will be reported in a separate paper . Finally , in real conebeam acquisition scenario using circular trajectory , there are additional sources of artifacts, among which scatter artifacts from the lack of scatter grid is one of the most dominating artifacts. In the current study , the simulated projection data does not assume any scatter ev ents, which may lead to another difficulty in applying the proposed method in clinical settings. Therefore, more systematic study using unmatched data set is necessary to validate the proposed network architecture for real clinical en vironment. V I I . C O N C L U S I O N S In this paper , we de veloped a novel DBP domain deep learning approach for conebeam artifacts removal. Inspired by the existing factorization approach that con verts 3-D problem into a successi ve 2-D decon volution along the plane of interest, our neural network is designed as a 2-D neural network for each plane of interest and was trained to learn the mapping between DBP data and the artifact-free images. Furthermore, spectral blending technique, which mixes the spectral compo- nents of the coronal and sagittal reconstruction, was employed to mitigate the missing frequency occurred along the plane of interest direction. Experimental results showed that the our method generalizes much better than CNN approach using FDK and is quantitati vely and qualitativ ely superior to the existing methods, despite significantly reduced computational runtime. V I I I . A C K N OW L E D G E M E N T The authors would like to thanks Dr . Cynthia MaCollough, the Mayo Clinic, the American Association of Physicists in Medicine (AAPM), and grant EB01705 and EB01785 from the National Institute of Biomedical Imaging and Bioengineering for providing the Low-Dose CT Grand Challenge data set. The authors would like to thank Prof. Seungryoung Cho and Mr . Jaehong Hwang to providing the real skull phantom experimental data. R E F E R E N C E S [1] L. A. Feldkamp, L. Davis, and J. W . Kress, “Practical cone-beam algorithm, ” J osa a , vol. 1, no. 6, pp. 612–619, 1984. [2] M. Grass, T . K ¨ ohler , and R. Proksa, “ Angular weighted hybrid cone- beam ct reconstruction for circular trajectories, ” Physics in Medicine & Biology , vol. 46, no. 6, p. 1595, 2001. [3] X. T ang, J. Hsieh, A. Hagiwara, R. A. Nilsen, J.-B. Thibault, and E. Drapkin, “A three-dimensional weighted cone beam filtered back- projection (CB-FBP) algorithm for image reconstruction in volumetric CT under a circular source trajectory , ” Physics in Medicine & Biology , vol. 50, no. 16, p. 3889, 2005. [4] S. Mori, M. Endo, S. K omatsu, S. Kandatsu, T . Y ashiro, and M. Baba, “ A combination-weighted feldkamp-based reconstruction algorithm for cone-beam ct, ” Physics in Medicine & Biology , vol. 51, no. 16, p. 3953, 2006. [5] H. K. T uy , “ An inv ersion formula for cone-beam reconstruction, ” SIAM Journal on Applied Mathematics , vol. 43, no. 3, pp. 546–552, 1983. [6] S. Bartolac, R. Clackdoyle, F . Noo, J. Siewerdsen, D. Moseley , and D. Jaffray , “ A local shift-variant Fourier model and experimental vali- dation of circular cone-beam computed tomography artifacts, ” Medical Physics , vol. 36, no. 2, pp. 500–512, 2009. [7] J. D. Pack, Z. Y in, K. Zeng, and B. E. Nett, “Mitigating cone-beam artifacts in short-scan CT imaging for large cone-angle scans, ” Fully 3D Image Reconstruction in Radiology and Nuclear Medicine , pp. 307– 310, 2013. [8] F . Peyrin, M. Amiel, and R. Goutte, “ Analysis of a cone beam x- ray tomographic system for different scanning modes, ” Journal of the Optical Society of America A , vol. 9, no. 9, pp. 1554–1563, 1992. [9] E. Y . Sidky and X. Pan, “Image reconstruction in circular cone-beam computed tomography by constrained, total-variation minimization, ” Physics in Medicine & Biology , v ol. 53, no. 17, p. 4777, 2008. [10] E. Y . Sidky , J. H. Jørgensen, and X. Pan, “Conv ex optimization problem prototyping for image reconstruction in computed tomography with the chambolle–pock algorithm, ” Physics in Medicine & Biology , vol. 57, no. 10, p. 3065, 2012. [11] Z. Zhang, X. Han, E. Pearson, C. Pelizzari, E. Y . Sidky , and X. Pan, “ Artifact reduction in short-scan cbct by use of optimization-based reconstruction, ” Physics in Medicine & Biology , vol. 61, no. 9, p. 3387, 2016. [12] D. Xia, D. A. Langan, S. B. Solomon, Z. Zhang, B. Chen, H. Lai, E. Y . Sidky , and X. Pan, “Optimization-based image reconstruction with artifact reduction in c-arm cbct, ” Physics in Medicine & Biology , vol. 61, no. 20, p. 7300, 2016. [13] A. Krizhevsky , I. Sutske ver , and G. E. Hinton, “Imagenet classification with deep con volutional neural networks, ” in Advances in neural infor- mation processing systems , 2012, pp. 1097–1105. [14] O. Ronneberger , P . Fischer, and T . Brox, “U-net: Con volutional netw orks for biomedical image segmentation, ” in International Confer ence on Medical Image Computing and Computer-Assisted Intervention - MIC- CAI 2015 . Springer, 2015, pp. 234–241. [15] Y . Han, J. Y oo, and J. C. Y e, “Deep residual learning for compressed sensing CT reconstruction via persistent homology analysis, ” arXiv pr eprint arXiv:1611.06391 , 2016. [16] E. Kang, J. Min, and J. C. Y e, “ A deep con volutional neural network using directional wav elets for low-dose x-ray ct reconstruction, ” Medical physics , vol. 44, no. 10, 2017. [17] H. Chen, Y . Zhang, M. K. Kalra, F . Lin, Y . Chen, P . Liao, J. Zhou, and G. W ang, “Low-dose ct with a residual encoder-decoder conv olutional neural network, ” IEEE transactions on medical imaging , vol. 36, no. 12, pp. 2524–2535, 2017. 12 [18] E. Kang, W . Chang, J. Y oo, and J. C. Y e, “Deep conv olutional framelet denosing for low-dose CT via wav elet residual network, ” IEEE T rans- actions on Medical Imaging , vol. 37, no. 6, pp. 1358–1369, 2018. [19] K. H. Jin, M. T . McCann, E. Froustey , and M. Unser , “Deep con- volutional neural network for in verse problems in imaging, ” IEEE T ransactions on Image Processing , vol. 26, no. 9, pp. 4509–4522, 2017. [20] Y . Han and J. C. Y e, “Framing U-Net via deep conv olutional framelets: Application to sparse-vie w CT, ” IEEE Tr ansactions on Medical Imaging , vol. 37, no. 6, pp. 1418–1429, 2018. [21] Y . Han, J. Gu, and J. C. Y e, “Deep learning interior tomography for region-of-interest reconstruction, ” in Proceedings of The Fifth Interna- tional Conference on Image F ormation in X-Ray Computed T omography , 2018. [22] Y . Han and J. C. Y e, “One network to solve all R OIs: Deep learning ct for any ROI using differentiated backprojection, ” Medical Physics (in pr ess), Also available as arXiv pr eprint arXiv:1810.00500 , 2018. [23] J. C. Y e, Y . Han, and E. Cha, “Deep con volutional framelets: A general deep learning framework for inv erse problems, ” SIAM Journal on Imaging Sciences , vol. 11, no. 2, pp. 991–1048, 2018. [24] J. C. Y e and W . K. Sung, “Understanding geometry of encoder-decoder CNNs, ” in Pr oceedings of the 36th International Conference on Machine Learning , ser . Proceedings of Machine Learning Research, K. Chaudhuri and R. Salakhutdinov , Eds., vol. 97. Long Beach, California, USA: PMLR, 09–15 Jun 2019, pp. 7064–7073. [25] M. Lee, Y . Han, J. P . W ard, M. Unser , and J. C. Y e, “Interior tomography using 1d generalized total v ariation. part ii: Multiscale implementation, ” SIAM Journal on Imaging Sciences , vol. 8, no. 4, pp. 2452–2486, 2015. [26] F . Dennerlein, F . Noo, H. Schondube, G. Lauritsch, and J. Hornegger, “ A factorization approach for cone-beam reconstruction on a circular short-scan, ” IEEE T ransactions on Medical Imaging , vol. 27, no. 7, pp. 887–896, 2008. [27] J. D. Pack and F . Noo, “Cone-beam reconstruction using 1D filtering along the projection of M-lines, ” Inver se Problems , vol. 21, no. 3, p. 1105, 2005. [28] Y . Zou and X. Pan, “Exact image reconstruction on PI-lines from minimum data in helical cone-beam CT, ” Physics in Medicine and Biology , vol. 49, no. 6, p. 941, 2004. [29] ——, “Image reconstruction on pi-lines by use of filtered backprojection in helical cone-beam ct, ” Physics in Medicine & Biology , vol. 49, no. 12, p. 2717, 2004. [30] L. Y u, Y . Zou, E. Y . Sidky , C. A. Pelizzari, P . Munro, and X. Pan, “Region of interest reconstruction from truncated data in circular cone- beam ct, ” IEEE transactions on medical imaging , vol. 25, no. 7, pp. 869–881, 2006. [31] A. V edaldi and K. Lenc, “MatCon vNet: Con volutional neural networks for MA TLAB, ” in Pr oceedings of the 23r d ACM International Confer- ence on Multimedia . A CM, 2015, pp. 689–692. [32] E. Tzeng, J. Hoffman, N. Zhang, K. Saenko, and T . Darrell, “Deep domain confusion: Maximizing for domain in variance, ” arXiv preprint arXiv:1412.3474 , 2014. [33] Z. W ang, A. C. Bovik, H. R. Sheikh, and E. P . Simoncelli, “Image quality assessment: from error visibility to structural similarity , ” IEEE transactions on image pr ocessing , vol. 13, no. 4, pp. 600–612, 2004. [34] E. Kang, H. J. Koo, D. H. Y ang, J. B. Seo, and J. C. Y e, “Cycle- consistent adversarial denoising network for multiphase coronary CT angiography , ” Medical physics , vol. 46, no. 2, pp. 550–562, 2019.
Original Paper
Loading high-quality paper...
Comments & Academic Discussion
Loading comments...
Leave a Comment