Robust Power System Dynamic State Estimator with Non-Gaussian Measurement Noise: Part I--Theory
This paper develops the theoretical framework and the equations of a new robust Generalized Maximum-likelihood-type Unscented Kalman Filter (GM-UKF) that is able to suppress observation and innovation outliers while filtering out non-Gaussian measure…
Authors: Junbo Zhao, Lamine Mili
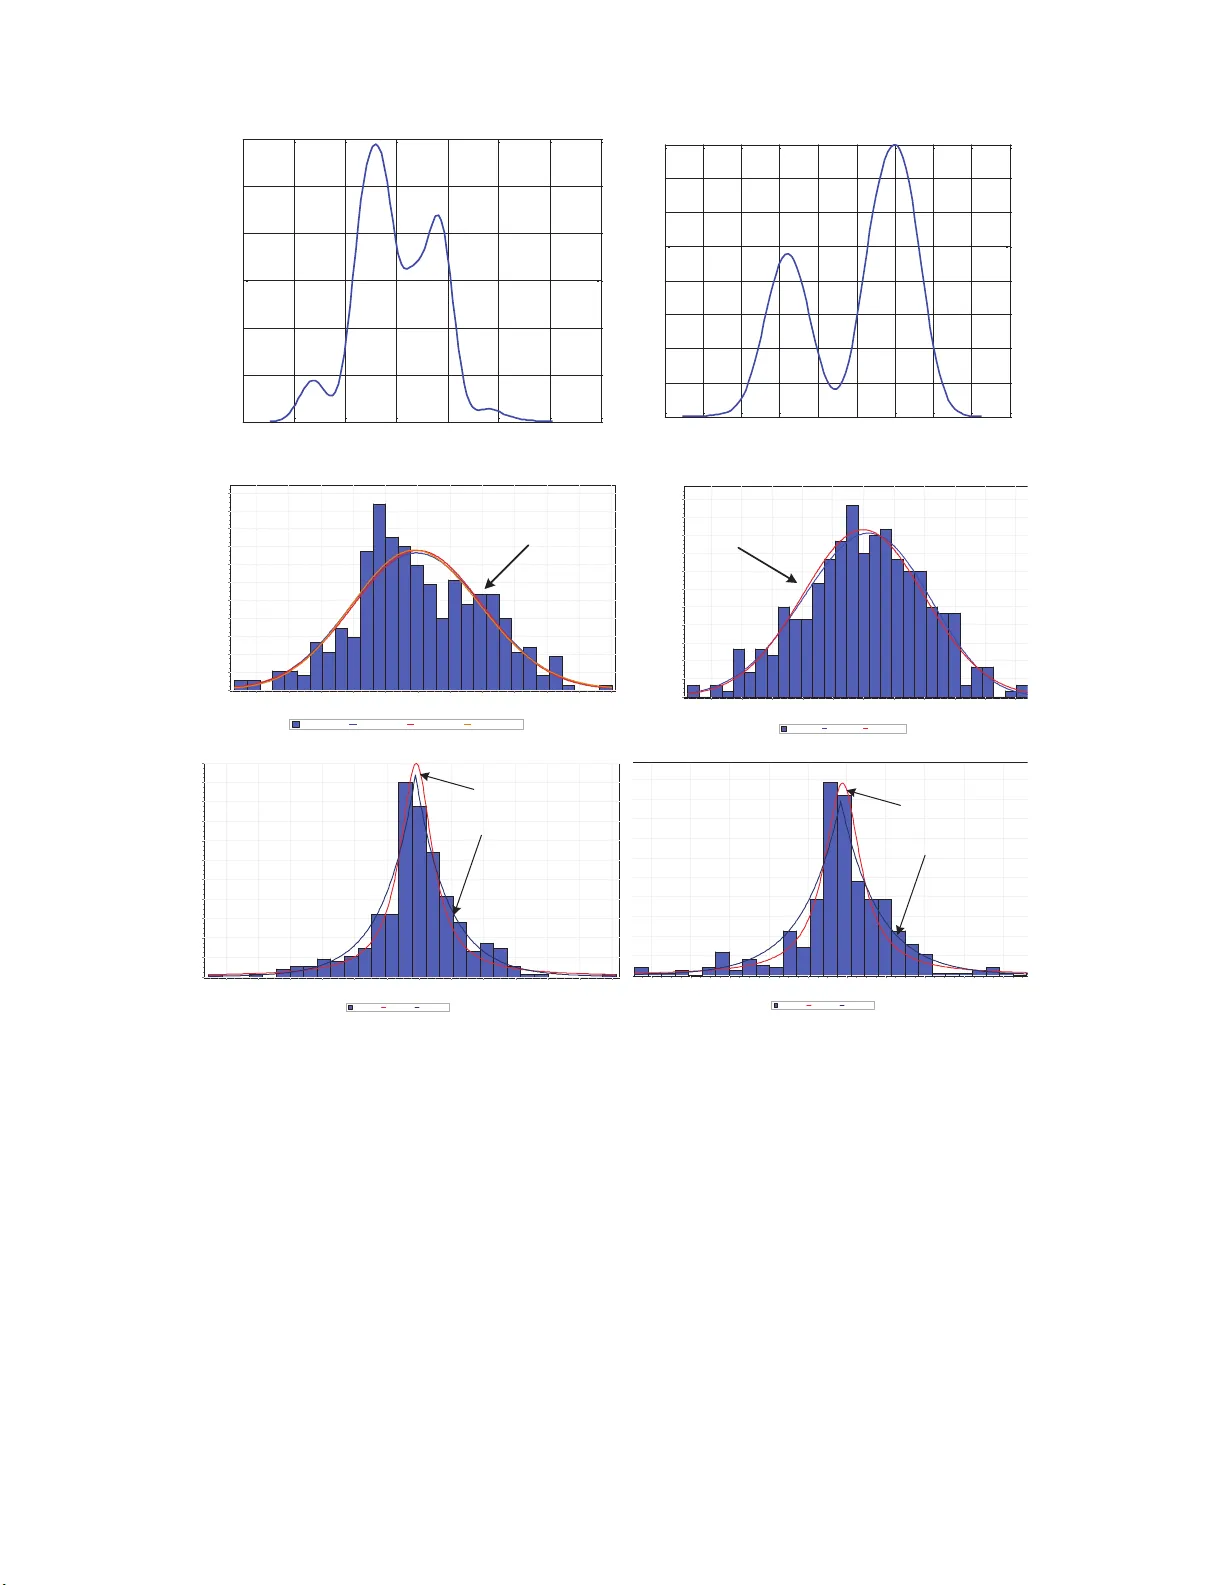
IEEE TRANSACTIONS ON PO WER SYSTEMS, VOL. , NO. , 2017 1 Rob ust Po wer System Dynamic State Estimator with Non-Gaussian Measurement Noise: P art I–Theory Junbo Zhao, Studen t Member , IEEE , Lamine Mili, F ell ow , IEEE Abstract —This paper de velops the theoretica l framework and the equations of a new r obust Generalized Maximum-likelihood- type Unscented Kalma n F ilter (GM-UKF) that is able to sup press observ ation and innovation o utl i ers while filtering out non- Gaussian measurement noise. Because t he erro rs of the real and reacti ve power measurements calculated using Phasor Measure- ment Unit s (PMUs) follow long-tailed probability distributi ons, the con ventional UKF pro vides strongly biased s tate estimates since it relies on the weighted least squares estimator . By contrast, the state estimates and residuals of our GM-UKF are prov ed to b e ro ughl y Gaussian, allowing the sigma points to reliably approximate th e mean a nd the covariance matrices of the predicted and c orrected state vector s. T o dev elop our GM- UKF , we first deriv e a batch-mode r egression form b y processing the pr edi cti ons and observ ations simultan eousl y , where the sta- tistical linearization approach is used. W e sho w th at the set of equations so derived are equivalent to those of the u nscented transfo rmation. Then, a r obust GM-estimator that mini mizes a con vex Huber cost function while using weights calculated via Projection Statistics (PS’s) is proposed. The PS’ s are applied to a two-dimensional matrix that consists of serially correlated predicted state and innovation vectors to detect obser vation and innovation outl i ers. These outliers are suppressed by the GM- estimator using the iterativ ely reweighted least squares alg orithm. Finally , the asymptotic error cov ariance matrix of the GM-UKF state estimates is derived from the total in fluence function. In the companion paper , extensive simulation results will be sho wn to verify the effectiv eness and ro bustness of the proposed meth od. Index T erms —Dynamic state estimation, robust estimation, unscented Kalman filter , non - Gaussian noise, total influence function, outliers, cyber attacks, power system d ynamics. I . I N T RO D U CT I O N T HE widespread deployment of syn chro-Ph asor Measure- ment Units (PMUs) on power transmission grids has made possible the real-time mon itoring and control of power system d y namics. Howe ver, these fu nctions can not be reli- ably a chieved withou t the development of a fast and robust Dynamic State Estimato r (DSE). Ind eed, the state variable estimates o f the synchro nous machines can be utilized b y power system stabilizers, au tomatic voltage regu la to rs, and under-frequ e ncy relays to enh ance small sign al stab ility an d to initiate generation outages and lo ad shedding during transient instabilities, am ong other actio n s [1], [ 2]. T o date, a variety of dynamic state estimators have been propo sed in the literature; they are based on the Extended Kalman Filter (EK F) [ 3], [ 4], the Iterated E KF (IEKF) [5], [6], th e unscen te d K a lm an filter (UKF) [7]–[9], to cite a few . However , all these methods suffer from se veral impo r- tant sho rtcoming s, p r ecluding them fr om being ado pted by power utilities fo r p ower system real-time applicatio ns. T o Junbo Z hao and Lamine Mili are with the Bra dley De partment of Elec- trical Computer Enginee ring, V irginia Polytechn ic Institute and State Uni- versi ty , Northern V irginia Center , Falls Church, V A 22043, US A (e-mail: zjunbo@v t.edu, lmili @vt.edu). be specific, they cannot ha n dle i) no n-Gaussian pr ocess and observation n oise of the system no n linear dyna mic models and ii) inn ovation, observation and structu ral outliers . There are se veral reason s for these shortco mings. Firstly , the current DSE approac h es assum e th a t both the pro cess and the ob servation noise o f the system no nlinear dynam ic m odels are Gaussian. Howe ver , two r e cent in vestigations cond ucted b y PNNL [10], [ 11] revealed that the PMU measu r ement er rors of the v oltage and cu rrent magnitudes obey non-Gaussian pr ob- ability distributions. This is d emonstrated in Fig.1 using real PMU data pr ovided to us b y PNNL. This figu re displays his- tograms and pa rametric p robability d ensity estimates of PMU errors on noda l voltage mag nitudes and a n gles, line curren t magnitud es an d angles, and line real and reactiv e powers. As observed in Fig.1, excep t for the measurem ent err ors on nod al voltage an d line cu rrent angles, which are rou ghly Gaussian, the measu r ement erro rs on both nodal voltage an d line cu r rent magnitud es o b ey a bimodal Gaussian mixture distribution. As for the measu rement errors of line real and reactive powers calculated from voltage and cu rrent phasor s, they fo llow a thick tailed distribution th at may be appro ximated by either the Laplacian or th e Cauchy distribution. Recall tha t in co ntrast to the Ga u ssian distribution, which is a short-ta iled distrib ution , a th ic k -tailed d istribution is the one that allows the associated random variable to take, as compared to a scale parameter, large v alue s with a non- negligible probability . Evid ently , the presence of non-Gau ssian n oise calls for new resear ch and development in ro bust po wer system DSE based on robust statistics. Secondly , thr ee types of outliers associated with a given dynamica l system model ha ve b een defin ed by Gan dhi an d Mili [12], nam e ly ob servation outliers, which affect the me- tered v alue s; innovation outliers, which corrupt the p redicted state estimates; and structur al o utliers, which affect the system dynamic states and the o b servation functio ns. Observation ou t- liers may result fr om large b iases in PMU measu rements due to infrequen t calibration, o r instrumen t f ailure s, or impulsi ve commun ication noise [ 13], [14]. As for innovation outlier s, they may o ccur in s everal different ways. For example, some of the generato r mod e ls may no t be well calib rated, resulting in h ig hly inacc u rate model o utputs that are incon sistent w ith the measur ements. This was precisely th e case in the 1996 blackout, whe re the mod el being used pr edicted system sta- bility while in r e ality the system was und ergoing numer ous cascading failure s, which resulted in a ra p id system collap se that occurred within minutes [15], [16]. Innovation outliers may also be induc ed by the app roximatio ns in the state prediction model or by a system process impulsiv e noise. By contrast, struc tu ral o utliers are indu ced by w r ong circuit IEEE TRANSACTIONS ON POWER SYSTEMS, V OL. , NO. , 2017 2 !"#$%$ &'&( )* +,-.&()*/0-1( &#- 2&. (#3"% 4 5#6-. # -*78 9#"4 %' :#3- #"4 %' *; < ?@A ? B@A B C@A C DC@A DB DB@A D? D?@A C@BB C@B C@CE C@CF C@CG C@CH C@CA C@CI C@C< C@C? C@CB C !"#$%$&'&()*+,-.&()* /0-1(&#- 2&. (#3"%4 5#6-. #- *78 9# "4% ' > ?@A ? B @A B C@A C DC@A DB DB@A D? D?@A J; > = C@CFF C@CF C@CG? C@CHI C@CAH C@CIF C@CI C@C C@CCI C@CC< C@CC? C@CCB C DC@CCB DC@CC? DC@CC< DC@CCI DC@CCA J ; > = C @ ? C @ B F C @ B H C @ B I C @ B ? C @ B C @ C F C @ C H C @ C I C @ C ? C !"#$%$&'&()*+,-.&()* /0-1(&#-*#J*K,%'*!#M, "*N ""#" 2&. (#3"%4 O% 016) :%P' %1, > C@CCH C@CCA C @CCI C@CC < C@CC? C@CCB C DC@CCB DC @CC? DC@CC< DC@CCI DC @CCA DC@CC H ? ? C @? BF BH BI B? C @B C F C H C I C ? C DC@H DC@I DC@? C C@? C@I C@H C@F C C@A B B@A ? ?@A < !"#$% $&'&( ) *Q,-.&( )* #J * (6,*P6%.#"*L # '( %3,*4%3- &( 0Q,*," "#" > !"#$% $&'&( ) *Q,-.&( )* L %'0, DC@CA DC@CI DC@C< DC@C? DC@CB C C@CB C@C? C@C< C@CI C A BC BA ?C ?A !"#$% $&'&( ) *Q,-.&() * L%'0, 4/)3,5 $%&'"%()'%#* 6/.1/3- $%&'"%()'%#* 4/)3,5 $%&'"%()'%#* 6/.1/3- $%&'"%()'%#* Fig. 1. Error distributi ons of the phasor volt age angle and magnitude, the phasor current angle and magnitude, the real and reacti ve power using field PMU data. breaker statuses o r gro ss errors in the m odel param eters of the transmission lines, or of the automatic voltage regulator s, or of the synch ronou s mach in es. In [1 7], it is repor ted tha t wrong estimates of the p arameters of the sync h ronou s machine models may r esult from the use of erroneo us metered values. It tur ns out th at the conv en tional filters, namely the EKF , the IEKF , the UKF , and the Particle Filter (PF) are not robust to any type of outliers. For instance, it is d emonstrated in [18] that their performan ces are significantly degraded in the p resence of observation outliers. T o add r ess this issue, Rouhani and Abur [9] de velope d a robust UKF-based DSE using the Lea st-Absolute-V alue (LA V) estimator . Howe ver , the authors d o not ad d ress th e vu lnerability of the DSE to innovation outliers. In [6], a ro bust IEKF was proposed to handle observation and in novation outlier s, but it may suffer from di vergence problem s if the nonlinearity of the system model is stron g. In add ition, bo th [6], [9] d o not a ddress the non-Gau ssianity of the m easurement no ise. In this p aper, a r obust Gener alized M a ximum-L ikelihood- type UKF (GM -UKF) metho d is p roposed to supp ress obser- vation and innovation o utliers while filtering ou t non -Gaussian measuremen t noise. Our choice of the UKF is motivated by the f act that, consider in g the real- tim e implemen tation requirem ents for nonlinea r DSE, it achieves a mo re b alanced perfor mance betwe en comp utational efficiency and ab ility to cope with strong system nonlinea r ities th an the EKF , o r the IEKF , o r the PF . Howe ver, the UKF is based on th e sigma points, which re liably appr oximate the mean and th e covari- ance matrices of the state estimates only unde r the Gaussian assumption of the process and o bservation noises. W e sh ow IEEE TRANSACTIONS ON POWER SYSTEMS, V OL. , NO. , 2017 3 that this a ssum ption is fu rther stressed by the reliance of the UKF on the weighted least squ ares estimator . Interesting ly , the state estimates calculated by our GM-UKF are shown to be asympto tica lly Gaussian even when the noises obey thick-tailed distributions, which is p r ecisely th e case when using PMU measurements. Further more, we show that the state estimates obtained fro m the application of statistical linearization to the non linear discrete-time state space system model are equivalent to tho se of the un scented transfo rmation. Therefo re, our filter allows the sigma po in ts to provide good results. It is developed accor ding to the following steps. W e first derive a redund ancy batch-mode regression form by pr ocessing the p redictions and observations simu ltaneously; this overde- termined system of equations p r ovides the data redund ancy needed for the detection an d sup pression of the innovation and o b servation o utliers. This is achiev ed by m eans of a robust GM-e stimator defined as the minimu m of the Huber conv ex cost fu n ction while using weigh ts calculated via the Projection Statistics (PS’ s). The latter are app lied to a two- dimensiona l matrix co nsisting o f serially co rrelated pred icted state and innovation vectors. Then, a statistical test is a pplied to them to flag the outlier s. Finally , the GM-estimato r is solved via the iteratively reweighted least square s algor ithm and the asymptotic error covariance ma trix of the state estimates is calculated f r om the total influen ce functio n. The rest of the pap er is organized as follows. Section II presents th e problem for mulation. Section I II develops th e theory of the p roposed GM- UKF and fin ally Section IV conclud e s the pape r . I I . P R O B L E M F O R M U L A T I O N A. Non linear Discr ete-T ime Dy namical S ystem Model A discr e te - time state space re p resentation of a g eneral nonlinear d ynamical system is expre ssed as x k = f ( x k − 1 , u k ) + w k , (1) z k = h ( x k , u k ) + v k , (2) where x k ∈ R n × 1 and z k ∈ R m × 1 are the state vector and the measurement/ob servation vector at time sample k , respectively; f and h are vector-v alu ed n onlinear f unctions; w k and v k are the system process and obser vation noise, re- spectiv ely ; they are assumed to be in depend e nt and id entically distributed with zero mean and covariance m a trices Q k and R k , re sp ectiv ely; u k is the system inp ut vector . B. Dyn amic State Estimation u sing UKF The main idea u nderlyin g the UKF is the application of a d eterministic samp ling techn ique known as th e u nscented transform ation, which allows us, und er th e Gaussian no ise assumption, to cho ose a set of sample p oints, termed sigma points, that hav e the same mean and covariance matrix as those of the a prio ri state vector [19]. Th ese sigma po ints are then propag ated throu gh th e non -linear function s f and h , yieldin g an estimatio n o f the a posteriori state statistics by usin g the Kalman filter app r oach, i.e., the sample mean and the sample covariance ma tr ix. Con sequently , n o calculation of Jacobian matrices is r equired , which c an be b y itself a difficult task to achieve in some ca ses or comp utationally costly . T o be specific, gi ven a state estimate at tim e step k -1, b x k − 1 | k − 1 ∈ R n × 1 , h aving a covariance matrix given by P xx k − 1 | k − 1 , its statistics are ca ptured by 2 n weighted sigma points defin ed as χ i k − 1 | k − 1 = b x k − 1 | k − 1 ± q n P xx k − 1 | k − 1 i , (3) with weig hts w i = 1 2 n , i = 1 , ..., 2 n . The n , each sigm a po int is pr opagated th rough the no nlinear system pr o cess mode l (1 ), yielding a set o f transfor med samples expressed as χ i k | k − 1 = f χ i k − 1 | k − 1 . (4) Next, the pred icted sample mean and sam ple cov arian ce matrix of the state vector are calculated by b x k | k − 1 = 2 n X i =1 w i χ i k | k − 1 , (5) P xx k | k − 1 = 2 n X i =1 w i ( χ i k | k − 1 − b x k | k − 1 )( χ i k | k − 1 − b x k | k − 1 ) T + Q k . (6) Finally , the measuremen t upd ating is perfo rmed and the fil- tered state b x k | k with the covariance matrix P xx k | k are calculated by K k = P xz k | k − 1 P z z k | k − 1 − 1 , (7) b x k | k = b x k | k − 1 + K k z k − b z k | k − 1 , (8) P xx k | k = P xx k | k − 1 − K k P z z k | k − 1 K T k , (9) where b z k | k − 1 = 2 n P i =1 w i z i k | k − 1 is the predicted measure m ent vector and z i k | k − 1 = h ( χ i k | k − 1 ) ; th e self a n d cro ss-covariance matrices, P z z k | k − 1 and P xz k | k − 1 , are respectively ca lculated by P z z k | k − 1 = 2 n X i =1 w i ( z i k | k − 1 − b z k | k − 1 )( z i k | k − 1 − b z k | k − 1 ) T + R k , (10) P xz k | k − 1 = 2 n X i =1 w i ( χ i k | k − 1 − b x k | k − 1 )( z i k | k − 1 − b z k | k − 1 ) T . (11) C. Motivatio n of the Use of a Robust UKF If the system process an d measur ement noises obey a Gaussian probab ility d istribution, the filtered state, b x k − 1 | k − 1 , will follow a Gaussian distribution as well. In that case, the sample m ean and the sample covariance m atrix o f b x k − 1 | k − 1 will be captu red by the sigma p oints and the UKF will pro duce reliable state estimates. Howe ver, the Gaussianity assump tion may not ho ld true in practice. This is precisely the case in power systems; for instan ces, impulsive process noise m a y occur du e to system model inaccur a cy at a certain time window and the PMU me asurement n oise m ay n ot follow a Gau ssian distribution a s sho wn in Fig. 1. Conseq uently , the sigma p oints may not capture the com plete statistics of the state vector, resulting in poo r or even diverged estimatio n s. Furth ermore, since the UKF lacks statistical robustness, it is sensitiv e to any IEEE TRANSACTIONS ON POWER SYSTEMS, V OL. , NO. , 2017 4 type of outliers, includin g o bservation, innovation an d struc- tural outliers. In power system DSE, observation ou tliers ref er to the phase biases an d g r oss erro rs in PMU measure ments [14]; innovation ou tliers may be in duced by incorre c t gener a tor parameter values, failure of br ushless exciter r o tating diodes, or impulsive system pro c e ss noise; and structur al outlier s may be caused by transmission p arameter err ors or to pology errors. In the f ollowing sectio n, we will pr opose a robust GM-U K F that is ab le to supp ress observation and innovation outliers and to filter out various types of thic k -tailed measurem ent n oises. Note that the problem o f the identification and suppre ssion of structur al outliers is outside the scope o f this p aper since it r equires a d ifferent for m ulation; it will be ad dressed in a future work. I I I . T H E P RO P O S E D G M - U K F Our GM- UKF consists of fou r major step s, namely a b atch- mode regression form step, a ro bust pr e-whitening step, a robust regression state estimation step, and a ro bust er ror covariance matrix upda tin g step. They are described next. A. Deriva tion of th e Ba tch-Mode Re gr ession F o rm In this sub sectio n, we first sh ow the equ iv alence of statistical linearization and th e unscented transfo rmation using sigma points. W e then derive the proposed batch-mod e regression form. The fo rmer claim is presen ted in the following T heorem: Theorem 1. Given the state estimate vecto r b x k − 1 | k − 1 and its a ssociated covariance matrix P xx k − 1 | k − 1 , statistical linear r e gression applied to an arbitrary nonlinear functio n g ( x ) yields r esults tha t are equivalent to those of the unscente d transformation using the sigma points generated accor ding to (3). Pr oof. Consider a no nlinear f unction y = g ( x ) ev aluated in 2 n points, i. e ., ( χ i , γ i ) , where γ i = g ( χ i ) for i = 1,..., 2 n . Assuming that th e non linear fu nction is statistically linearized as y = Ax + b + ζ , the o b jectiv e is to find b A and b b so that the p oint-wise linearization er ror ζ i is m inimized, i.e., n b A, b b o = arg min 2 n X i =1 w i ζ i T ζ i , (12) where ζ i = γ i − ( Aχ i + b ) . By taking the derivati ve of the objective functio n with respect to A and b and let them equal to zer o, respectively , we obtain b = y − b Ax , (13) b A = P T xy P − 1 xx , (14) where x = 2 n P i =1 w i χ i ; y = 2 n P i =1 w i g ( χ i ) = 2 n P i =1 w i γ i ; P xx = 2 n P i =1 w i ( χ i − x )( χ i − x ) T ; P xy = 2 n P i =1 w i ( χ i − x )( γ i − y ) T . Then, the estimation error covariance matrix is calculated as P ζ ζ = 2 n P i =1 w i b ζ i b ζ T i = 2 n P i =1 w i γ i − y − b A ( χ i − x ) γ i − y − b A ( χ i − x ) T = P y y − b AP xx b A T = P y y − P T xy P − 1 xx P xy , (15) where P y y = 2 n P i =1 w i ( γ i − y )( γ i − y ) T . Now , by taking the expectation and the outer produ ct of the statistical lin e a rized model, respectively , we obtain the posterior statistics gi ven b y b y = b A x + 2 n X i =1 w i χ i − b A x = 2 n X i =1 w i χ i , (16) P y y = b AP xx b A T + P ζ ζ = P T xy P − 1 xx P xy + 2 n P i =1 w i ( γ i − y )( γ i − y ) T − P T xy P − 1 xx P xy = 2 n P i =1 w i ( γ i − y )( γ i − y ) T , (17) which are the sam e expr essions as those ob tained b y applyin g the unscented transfo rmation to the n onlinear func tio n y = g ( x ) . T hus, the pro of is com pleted. Remark. In statistical linearization, b A is no longer the J acob ian matrix of g ( x ) at a given po in t. Th e err or covariance matrix P ζ ζ is used to compensate the linearization err o rs of the high e r order T aylo r series expansion terms. This is however explicitly c o ntained in th e un scented transformation pr ocess. By ap plying statistical linearization to the n o nlinear system process mode l, we obtain th e p redicted state vector b x k | k − 1 along with its covariance m atrix P xx k | k − 1 . W e define b x k | k − 1 = x k − δ k , wh ere x k is the tru e state vector; δ k is the pr ediction error; and E δ k δ T k = P xx k | k − 1 . Th en, statistical line a rization can be applied to the nonlinear ob servation equ ation, yieldin g z k = H k x k − b x k | k − 1 + h b x k | k − 1 + ν k + ε k , (18) where H k = ( P xz k | k − 1 ) T ( P xx k | k − 1 ) − 1 , which is no long er a Jacobian ma tr ix. Here, the covariance of the statistical linearization error term is e R k = E ν k ν T k = P z z k | k − 1 − ( P xz k | k − 1 ) T P xx k | k − 1 P xz k | k − 1 , wher e P z z k | k − 1 and P xz k | k − 1 are two covariance matrice s that are calculated by following th e same steps as those of the UKF . By pr ocessing the pr edictions and the observations simultan eously , we get the following b a tc h - mode regression for m: z k + H k b x k | k − 1 − h ( b x k | k − 1 ) b x k | k − 1 = H k I x k + ν k + ε k − δ k (19) which can be rewritten in a compact for m as e z k = f H k x k + e e k , (20) and the error covariance matrix is g i ven by W k = E e e k e e T k = Σ k | k − 1 0 0 P xx k | k − 1 = S k S T k , (21) where Σ k | k − 1 = E [( ν k + ε k )( ν k + ε k ) T ] = R k + e R k ; I is an iden tity matrix; S k is calculated by th e Cholesky decomp o sition technique. Theorem 2 . The weighted least squar es e stimator of the batch-mode r egr ession form (20) yields a n estimated state vector b x k | k and its associated covariance matrix P xx k | k that ar e equ ivalent to those of the UKF . IEEE TRANSACTIONS ON POWER SYSTEMS, V OL. , NO. , 2017 5 Out l ie r s M e d i a n v a l u e Proj e c t ion Pr oj e c t e d val u e s Co n f i d e n c e e lli p se med j (l j2 ) M l j med j (l j1 ) l j1 l j2 l j2 l j1 Fig. 2. Application of the projection statistics to the matrix Z k for detecting outliers in a two-dimen sional dataset that consists of the innov ation vector s and the predicte d state vectors. Pr oof. It is well-kn own that th e state estimate of (2 0) using the we ig hted least squ ares estimator is g iv en by b x k | k = f H T k W k f H k − 1 f H T k W k e z k , (22) with the covariance matrix P xx k | k = f H T k W k f H k − 1 . By ap - plying an alg ebraic substitution and using the m atrix in version lemma, we get P xx k | k = H T k R − 1 k H k + P xx k | k − 1 − 1 − 1 = P xx k | k − 1 − P xx k | k − 1 H T k H k P xx k | k − 1 H T k + R k − 1 H k P xx k | k − 1 = ( I − K k H k ) P xx k | k − 1 = P xx k | k − 1 − K k P z z k | k − 1 K T k , (23) where the gain m a trix is expr essed as K k = P xx k | k − 1 H T k ( H k P xx k | k − 1 H T k + R k ) − 1 = P xz k | k − 1 ( P z z k | k − 1 ) − 1 (24) Thus, we can co nclude that the estimation error covariance is identical to that of the UKF in (9). By applying similar substitutions and using the matrix in version lem ma, we can also show that the estimated state vector is given by b x k | k = b x k | k − 1 + K k z k − b z k | k − 1 , (25) which com pletes the p roof. Remark. I n the literatur e, a few Hub er estimato r -b ased r obust UKF method s have been pr opo sed a nd app lied to various applicatio ns in sig n al pr ocessing, targ et trac kin g, to name a few [20]–[22]. However , in th eir develop ed r egr ession models, ν k that co mpensates higher order T a ylor series expansion err o r terms is neglected comp letely . As a co nsequen ce, the estimation r esults ar e b iased. In a d dition, they are unable to handle innovation outliers and filter o ut n on-Ga u ssian measur emen t noise. B. R o bust Pr ewhitening Before carryin g out a robust regre ssion , we uncor relate the state p rediction er r ors of the batch -mode regression fo rm. T his is achieved by pre-m u ltiplying S − 1 k on bo th sides of (20), yielding S − 1 k e z k = S − 1 k f H k x k + S − 1 k e e k , (26) which can be fu rther organized to the com pact form y k = C k x k + ξ k , (27) where E [ ξ k ξ k T ] = I . However , if o utliers occur, the app lica- tion of S − 1 k will corrup t the pr ewhitening [1 2]. T o overcome this problem , we first detect th e outliers and calculate th e weights using the p rojection statistics (PS) [12], [23]. T h ose weights w ill be incorpo rated in th e objective function tha t is defined in the propo sed GM -estimator shown in Section III-C. Now , we describe the proce d ures used to ca lculate the weights. W e apply the PS to a 2-dimen sional matrix Z k that contains serially co rrelated samples of th e innovations and o f the pred icted state variables. Note that the inn ovation vector is defined as th e d ifference b etween th e o bservations an d their associated predicted values at th e pr evious step . Formally , we have Z k = z k − 1 − h ( b x k − 1 | k − 2 ) z k − h ( b x k | k − 1 ) b x k − 1 | k − 2 b x k | k − 1 , (28) where z k − 1 − h ( b x k − 1 | k − 2 ) and z k − h ( b x k | k − 1 ) are the innova- tion vectors while b x k − 1 | k − 2 and b x k | k − 1 are the predicte d state vectors at tim e instan ts k -1 and k , respectively . W e may also apply the PS to h igher dimensional samp les, but we foun d that 2 d imensions are en ough to iden tify outliers. The PS values of th e pred ictions and of the innovations ar e separately calculated because the values taken by the fo rmer a nd the latter are center e d around different poin ts. The PS of the j th row vector, l T j , of the pred ic tio ns (resp ec- ti vely the innovations) in Z k is defined as the maximu m of the standardized projec tions o f all the l T j ’ s on every directio n ℓ that o riginates from the coo rdinatewise med ian s of the pr e- dictions (respectively th e innovations) and th at p asses thro ugh ev ery da ta po in t, and wh ere the standard ize d p r ojections are based o n the sample med ian and the median-ab solute-deviation [23]. The implemen tation of the PS to d etect outliers in matrix Z k is displaye d in Fig. 2 , while its mathem atical expre ssion is defined as [ 23]. P S j = max k ℓ k =1 l T j ℓ − med i l T i ℓ 1 . 4826 med κ l T κ ℓ − me d i l T i ℓ , (29) where i, j, κ = 1 , 2 , ..., m + n . Once the PS values are calcu lated, they are co m pared to a statistical thre shold to identify outliers. Exten si ve Monte Carlo simulations and Q-Q plots re veal that the probability IEEE TRANSACTIONS ON POWER SYSTEMS, V OL. , NO. , 2017 6 0 2 4 6 8 10 12 0 2 4 6 8 10 12 Theoretical quantile− χ 2 2 distribution Sample quantile 0 5 10 15 20 25 0 5 10 15 20 25 Theoretical quantile− χ 4 2 distribution Sample quantile Fig. 3. Q-Q plots of the sample quantiles of the PS vs. the corresponding quantiles of the χ 2 2 and χ 2 4 distrib utions, where (a) and (b) represent Q-Q plots of PS with Gaussian and Laplace noise, respecti vely . distributions of the PS ap plied to Z k , whose data points obey bivariate Gau ssian and L aplace probability distributions, follow chi-squ a re distributions with degree of freedo m 2 an d 4, respe c ti vely (See Fig. 3). This investigation allows u s to apply statistical tests to the PS and to flag all the data points that satisfy PS i > η as o utliers. The latter a r e downweigh ted via i = min 1 , d 2 P S 2 i , (30) where the p arameter d is set equal to 1.5 to yield g ood statis- tical efficiency at different distributions without increasing to o much the bia s in duced by ou tliers. As an example, wh en the noise is assum ed to be Laplacian, the PS o beys a ch i-square distribution with 4 degrees of freed om. In that case, we can choose the statistical detectio n threshold η as χ 2 4 , 0 . 975 at a significance level of 97. 5 %. C. Robust F iltering and Solutio n T o suppress the ou tliers and fi lter out thick-tailed no n - Gaussian measur ement n oise, we d ev elop a ro bust GM- estimator that minim izes the following objective f u nction: J ( x k ) = m + n X i =1 2 i ρ ( r S i ) , (31) where i is calcula ted by (30); r S i = r i / s i is the standard- ized resid ual; r i = y i − c T i b x is the residua l, where c T i is the i th row vector of the matrix C k ; s = 1 . 4826 · b m · median i | r i | is the robust scale estimate; b m is a co r rection factor to achieve unbiasedn ess for a finite samp le of size m + n at a given probab ility distribution; ρ ( · ) is the nonlin ear fun ction of r S i . In this p aper, th e conve x Hu ber- ρ functio n [24] is adopted , that is ρ ( r S i ) = 1 2 r 2 S i , for | r S i | < λ λ | r S i | − λ 2 2 , el sew her e , (32) where the param eter λ between the quad ratic and the linear segment of ρ ( · ) is ty pically chosen b e tween 1.5 to 3 in the literature. T o m in imize (31), one takes its partial deriv ative with respect to x k and sets it equal to zer o , yielding ∂ J ( x k ) ∂ x k = m + n X i =1 − i c i s ψ ( r S i ) = 0 , (33) where ψ ( r S i ) = ∂ ρ ( r S i )/ ∂ r S i is the so-called ψ -fu n ction. By dividing and multiplying the stand ardized residual r S i to both sides of (33) and putting it in a matrix fo rm, we g et C T k b Q ( y k − C k x k ) = 0 , (34) where b Q = diag ( q ( r S i )) and q ( r S i ) = ψ ( r S i )/ r S i . By using the IRLS algorith m [ 25], [26], the state vector correction at the j iter ation is calculated th rough ∆ b x ( j +1) k | k = C T k b Q ( j ) C k − 1 C T k b Q ( j ) y k , (35) where ∆ b x ( j +1) k | k = b x ( j +1 ) k | k − b x ( j ) k | k . The algo rithm con verges when ∆ b x ( j +1) k | k ∞ ≤ 10 − 2 . D. Asymp totic Err o r Covarian ce Ma trix of th e GM-UKF S tate Estimates Upon conver gen ce o f the iterati ve algorithm , the erro r covariance matrix P xx k | k is updated so that the state prediction for the next step can be p erform ed. T o th is en d, con sider th e ǫ -contam ination model G = (1 − ǫ ) Φ + ǫ ∆ r , wher e G and Φ are the contam inated and the tru e cumu lati ve pro bability distribution fun ction of the residu al, resp e c ti vely; ∆ r is the point mass to model outliers o r u nknown no n-Gaussian distri- butions. The err o r covariance m a tr ix is u pdated based on the following theorem: Theorem 3 . Let T ( · ) be th e fun c tional form of th e GM- estimator with a bou nded ψ ( · ) fun ction and Φ α be the empirical cumu lative pr obability d istrib utio n functio n, then √ α ( T (Φ α ) − T (Φ)) d → N ( 0 , P xx k | k ) , (36 ) wher e α = m + n ; d → means co n verg en ce in pr obab ility distribution; P xx k | k = E [ I F ( x ; Φ , T ) · I F ( x ; Φ , T ) T ] with the influenc e fun ction I F ( x ; Φ , T ) evaluated at Φ . Pr oof. By taking a first-order T a y lor series expansion o f the function al form of the estimator T with respective to Φ , we get T (Φ α ) = T (Φ) + T ′ (Φ α − Φ) + Rem(Φ α − Φ) , (37) IEEE TRANSACTIONS ON POWER SYSTEMS, V OL. , NO. , 2017 7 which can b e reorganized into the following fo rm by multi- plying √ α on bo th sides of the equ ality: √ α ( T (Φ α ) − T (Φ)) = √ α T ′ (Φ α − Φ) + √ α Rem (Φ α − Φ) (38) = √ α Z I F ( x ; Φ , T ) d (Φ α − Φ) + √ α Rem(Φ α − Φ) (39) = √ α Z I F ( x ; Φ , T ) d Φ α + √ α Rem(Φ α − Φ) (40) = 1 √ α α X i =1 I F ( x i ; Φ , T ) + √ α Rem (Φ α − Φ) , (41 ) where the definition o f th e influ ence fu nction is ap plied to yield (38) to (3 9); by virtue o f Fisher co nsistency at the distribution Φ , that is, R I F ( x ; Φ , T ) d Φ = 0 , (39) red uces to (40); finally , b y using the prop erty of the empirical cu m ulative probab ility d istribution function , we have Z I F ( x ; Φ , T ) d Φ α = 1 α α X i =1 I F ( x i ; Φ , T ) , (42) yielding (40 ) to (4 1). Follo wing th e work of Fern h olz [27], we can sh ow that √ α Re m (Φ α − Φ) p → 0 , (43) where p → means prob ability conver g e nce. Ther efore, b y ap- plying the central limit theor em and Slutsky’ s lemma to (41), it follows that √ α ( T (Φ α ) − T (Φ)) d → N ( 0 , P xx k | k ) , (44) where P xx k | k = E [ I F ( x ; Φ , T ) · I F ( x ; Φ , T ) T ] . Discussion : Th e UKF is ab le to provide go od results o nly when the process and observation noises o bey a Gaussian distribution [1 9]. Indeed , in that c ase the filter e d state vector b x k | k is Gaussian and the mean and covariance matrix of b x k | k can be accu rately estimated by the sample mean a nd the sample c ov ar ia n ce m atrix o f th e sigma po in ts. Howev er, this proper ty no longer h olds tr u e if the Gaussianity assumption of the no ises is violated. In that case, the state estimate vector b x k | k obtained f rom the UKF is significantly biased d ue th e filter lac k of statistical ro bustness to thick-tailed non-Ga u ssian noise. By contrast, ou r GM-UKF gu arantees the asymptotic Gaussianity of b x k | k for thick -tailed non-G a ussian n o ises and yields reliable state estimates with good statistical efficiency . Corollary 3. 1 . A ssume that the system pr ocess noise is contamina ted a bout a Ga u ssian distribution. Then, th e data points defi ned by the r ow ve c to rs of the matrix Z k follow asymptotically a Gaussian distribution. Pr oof. From the defin ition of the matrix Z k giv en by (28) and Theor em 3, w e can see th at the predicted state vector is r oughly Gaussian. Further m ore, und e r the assumption that the m inority of the measuremen ts obey a thick -tailed no n- Gaussian distribution, th e innovation vectors can be shown to be appr oximately Gaussian. From this, we con c lude that Z k is asymp totically Gaussian. Let’ s n ow d eriv e th e I F ( x ; Φ , T ) of our GM-UKF at the cumulative prob ability distribution Φ . Corollary 3.2 . The to ta l infl u ence fun ction of the GM-UKF defined by (33) u sing the re g r ession mode l (27) is expr essed as I F ( x ; Φ , T ) = Z 1 s ψ ′ ( r S i ) C C T T (Φ) d Φ − 1 C ψ ( r S i ) . (45) Pr oof. In our p revious work [6], the total influence f unction of a GM- e stima to r based on a non linear regression model given by y = ϕ ( x ) + ξ is expr essed as I F ( x ; Φ , T ) = R ψ ′ ( r S i ) s ∂ ϕ ( x ) ∂ x ∂ ϕ ( x ) ∂ x T − ψ ( r S i ) D T (Φ) d Φ − 1 · ∂ ϕ ( x ) ∂ x ψ ( r S i ) , (46) where D = ∂ 2 ϕ ( x ) ∂ x i ∂ x j is the Hessian matr ix o f ϕ ( x ) . Since we have ϕ ( x ) = C x for th e GM-UKF , ( 4 6) reduce s to I F ( x ; Φ , T ) = Z 1 s ψ ′ ( r S i ) C C T T (Φ) d Φ − 1 C ψ ( r S i ) . (47) Now , we ar e in a position to derive th e covariance matrix P xx k | k from ( 44). First, let us prove the following theore m: Theorem 4 . The sample varia n ce of the r obust scale estimator s of the GM-stan dar dized r esidu als tend s to o ne as the numb er of observatio n tends to infi nity . Pr oof. By the law o f lar ge n umbers, th e d istribution of the residua ls tends to th e Gau ssian distribution, i.e., Φ ∼ N ( µ, σ 2 ) . Since the m edian absolute deviation (MAD= s 1 . 4826 · b m ) is a consistent estimato r f or the standard deviation σ of a Gau ssian distribution, we get 1 2 = P | X − µ | ≤ s 1 . 4826 · b m = P | X − µ | σ ≤ s 1 . 4826 · b m · σ = 2Φ s 1 . 4826 · b m · σ − 1 . (48) Therefo re, we o btain s/σ = 1 . 482 6 · b m · Φ − 1 3 4 = b m → 1 as m tend s to infinity , where Φ is th e cumulative prob ability function of the standard Gaussian distribution. On the other hand, from the equ ation (27) and the fact that E [ ξ k ξ k T ] = I , the residua ls can be sh own to actually fo llow the stan dard Gaussian distribution. There f ore, E F [ s 2 ] = s 2 → 1 . Finally , by Theo r ems 3 an d 4, th e asym ptotic error covari- ance matrix of o ur GM-UKF at time sample k is up dated by P xx k | k = E [ I F ( x ; Φ , T ) · I F ( x ; Φ , T ) T ] = E Φ [ ψ 2 ( r S i )] { E Φ [ ψ ′ ( r S i )] } 2 C T k C k − 1 C T k Q C k C T k C k − 1 (49) where Q = diag 2 i . IEEE TRANSACTIONS ON POWER SYSTEMS, V OL. , NO. , 2017 8 E. Discu ssion s on the Sta tistical Efficiency of th e GM-UKF In th is section, we discuss the statistical efficienc y of our propo sed GM-UKF unde r various pr obability distributions of the noise. Firstly , un der Gaussian m easurement no ise, the outliers d etected b y the PS will be downweighted by the linear segment of the ρ -functio n while all the good measuremen ts will be assigned weights equal or clo se to one since most of them will be pro cessed by the quadr atic segment of the ρ -functio n. As a result, the state estimato r exhibits a hig h statistical efficiency . Secon dly , if the mea surement no ise obeys a Laplac e distribution, those m e asurements associated with the thick tails of that distribution will have standardize d residuals correspo n ding to the linear segment of the ρ -func tion. T his means that f or them , the GM-estimator beh av es like the least absolute value estimato r; since the latter is th e maximum - likelihood estima to r at that distribution, it will have a high asymptotic statistical efficiency . On th e oth er hand , when the estimation error covariance matrix is up dated, all the o utliers with respect to the Gaussian distribution, which include the measuremen ts associated with th e tails of the Laplacian or the Cauchy distribution, will be heavily downweighted thro ugh the m atrix Q , yielding bou nded biases and variances in the state estimates. I V . C O N C L U S I O N In this first p a r t o f a two-part series paper , we presen t the fu ndamen tal theory of the p roposed GM- UK F . W e show first th at th e UKF estimates the state vector via a weig hted least squ ares estimato r un der the Gaussianity assumption of the system pro c ess or measurement no ises; consequen tly , it yields strong ly b iased state estimates wh en the noises fo llow non-Gau ssian probability distributions, wh ich is precisely the case when proce ssing PMU measurem ents. By con trast, the state estimates and residu als of our GM- UKF are proved to be a symptotically Gaussian, allowing the sigma points to reliably appr o ximate the mean and the cov ar ia n ce matrices of the pr edicted an d co rrected st ate vectors. Furth ermore, by relying on the p rojection statistics and the GM-estimator, the proposed GM-UKF is able to suppr ess observation and innovation outliers while exhibiting high statistical efficiency of th e state estimates. I n add ition, we derive the exp r ession of the a sy mptotic error covariance matrix of the GM- UKF state e stima te s from the total in fluence functio n of the GM- estimator . In the comp anion paper, we will discuss the im- plementation of o ur GM-UKF in power systems an d analyz e its pe rforman ce by car rying out extensiv e simulations un der various scenarios. R E F E R E N C E S [1] I. Kamwa, R. Grondin, and Y . Hebert, “Wide -area measurement based stabili zing control of larg e powe r systems-a decentrali zed/hierarchical approac h, ” IEEE T rans. P ower Syst ., v ol. 16, no. 1, pp. 136–153, Feb . 2001. [2] H. Ni, G. T . Heydt, L. Mili, “Powe r system stability using robust wide area control, ” IE EE T rans. P ower Syst. , V ol. 17, No. 4, pp. 1123–1131, Nov . 2002. [3] E . Ghahremani , I. Kamwa, “Dynamic state estimation in power system by applying the ext ended Kalman filter with unknown inputs to phasor measurement s, ” IEEE T rans. P ower Syst. , vol. 26, no. 4, pp. 2556–25 66, Nov . 2011. [4] Z . H uang, K. Schneider , and J. Niepl ocha, “Feasibil ity studies of apply- ing Kalman filter techniqu es to power system dynamic state estimation, ” in Pr oc. 8th Int. P ower E ng. Conf. , Singapore , Dec. 2007, pp. 376–382. [5] L . Fan and Y . W ehbe, “Exte nded Kalman filteri ng based real- time dynamic state and parameter estimation using PMU data, ” Elect. P ower Syst. Res. , vol. 103, pp. 168–177, Oct. 2013. [6] J. B. Zhao, M. Netto, L. Mili, “ A robust itera ted extended Kalman filter for power system dynamic state estima tion, ” IEEE T rans. P ower Syst. , DOI: 10.1109/TPWRS.2016.2628344, 2016. [7] A. K. Singh, B. C. Pal, “Dece ntralized dynamic state estimation in po wer systems using unscented transformatio n, ” IEEE T rans. P ower Syst. , vol. 29, no. 2, pp. 794–804, Sep 2014. [8] S. W ang, W . Gao, A. P . S . Meliopoulos, “ An alternati vemet hod for po wer system dynamic s tate estimat ion based on unscented tran sform, ” IEEE T rans. P ower Syst. , vol. 27, no. 2, pp. 942–950, May 2012. [9] A. Rouhani, A. Abur , “Linear phasor estimator assisted dynamic state estimati on, ” IEEE T rans. Smart Gr id , 2016. [10] Z. Huang, N. Z hou, R. Diao, S. W ang, S. Elbert, D. Meng, S. Lu, “Cap- turing real-time power system dynamics: opportuniti es and challen ges, ” Pr oc. IEE E P ower E ng. Soc. General Meeting , July 2015. [11] N. Zhou, Z. Huang, D. Meng, “Capturin g dynamics in the power grid: formulation of dynamic state estimation through data assimilat ion. T echnical Report PNNL-23213, Pacific Northwest National Laboratory , 2014. [12] M. Gandhi, L. Mili, “Robust Kalman fi lter based on a genera lized maximum-lik elihood-typ e estimator , IEE E T rans. Signal Pr ocessing , vol. 58, no. 5, pp. 2509–2520, 2010. [13] K. Martin, J. Hauer , T . Faris, “PMU testing and installa tion considera- tions at the Bonnev ille power administration, ” P r oc. IEEE P ower E ng. Soc. General Meeting , Jun. 2007, pp. 1–6. [14] K. D. J ones, A. Pal, J. S. Thorp, “Methodology for performing syn- chrophasor data conditioning and valid ation, ” IEEE T rans. P ower Syst. , vol. 30, no. 3, pp. 1121–1130, May . 2015. [15] D. N. Kostere v , C. W . T aylor , W . A . Mittel stadt, ”Model V alidati on for the August 10, 1996 WSCC System O utage, ” IE EE T rans. P ower Syst. , vol. 14, no. 3, pp. 967–979, 1999. [16] Z. Huang, P . Du, D. Kost erev , S. Y ang, “Genera tor dynamic model v alidation and paramete r calibratio n using phasor m easuremen ts at the point of connec tion, ” IEE E T rans. P ower Syst. , V ol. 28, no. 2, pp. 1939– 1949, 2013. [17] M. A. M. Arif f, B. C. Pal, A. K. Singh, “Estimat ing Dynamic Model Parame ters for Adapti ve Protectio n and Control in Power System, ” IEEE T rans. P ower Syst ., vol. 30, no. 2, pp. 829–839, Mar . 2015. [18] N. Zhou, D. Meng, Z. Huang, G. W elch, “Dynamic state estimation of a synchronous machine using PMU data: A comparati ve study , ” IEEE T rans. Smart Grid. , V ol. 6, no. 1, pp: 450–460, 2015. [19] S. Julier , J. Uhlmann, and H . F . Durrant-Whyte, “ A ne w method for the nonline ar transformation of m eans and cov ariances in filters and estimato rs, ” IEEE T rans. Aut om. Contr ol , vol. 45, no. 3, pp. 477–482, Mar . 2000. [20] L. Y . Chang, B. Hu, G. K. Chang, et al, “Huber-base d nov el robust unscente d Kalman filter , ” IET Scienc e, Measure ment & T echnol ogy , vol. 6, no. 6, pp. 502–509, 2012. [21] L. B. Chang , B. Hu, G. K. Chang , et al, “Robu st deriv ati ve-free Kalman filter based on Huber’ s M-estimation methodology , ” J ournal of Pr ocess Contr ol , V ol. 23, no. 10, pp. 1555-1561, 2013. [22] L. Y . Chang, K. Li, B. Hu, “Huber’ s M-estimation based process uncerta inty robust filter for inte grated INS/GPS, ” IEEE Sensors Journal , V ol. 15, no. 6, 2015. [23] L. Mili, M. Cheniae, N. V ichare, and P . Rousseeuw , “Rob ust state estimati on based on projection statisti cs, ” IEE E T rans. P ower Syst. , vol. 11, no. 2, p. 1118–1127, 1996. [24] P . J. Huber , R obust Statist ics . New Y ork: Wi ley , 1981. [25] L. Thomas, L. Mili, “ A robust GM-estimator for the automated detec tion of e xternal defects on barked hardwood logs and stems, ” IEEE T rans. Signal Proc essing , vol. 55, no. 7, pp. 3568–3576, 2007. [26] F . R. Hampel, E. M. Ronchet ti, P . J . Rousseeuw , and W . A. Stahel, Robust Statistics: The Appr oach Based on Influence Functions . Ne w Y ork: John Wil ey & Sons, Inc., 1986. [27] L. Fernholz, “V on mises calculus for statisti cal functionals, ” L ecture Notes in Statistics. New Y ork: Springer -V erlag, 1983, vol. 19.
Original Paper
Loading high-quality paper...
Comments & Academic Discussion
Loading comments...
Leave a Comment