Characterizing the Google Books corpus: Strong limits to inferences of socio-cultural and linguistic evolution
It is tempting to treat frequency trends from the Google Books data sets as indicators of the "true" popularity of various words and phrases. Doing so allows us to draw quantitatively strong conclusions about the evolution of cultural perception of a…
Authors: Eitan Adam Pechenick, Christopher M. Danforth, Peter Sheridan Dodds
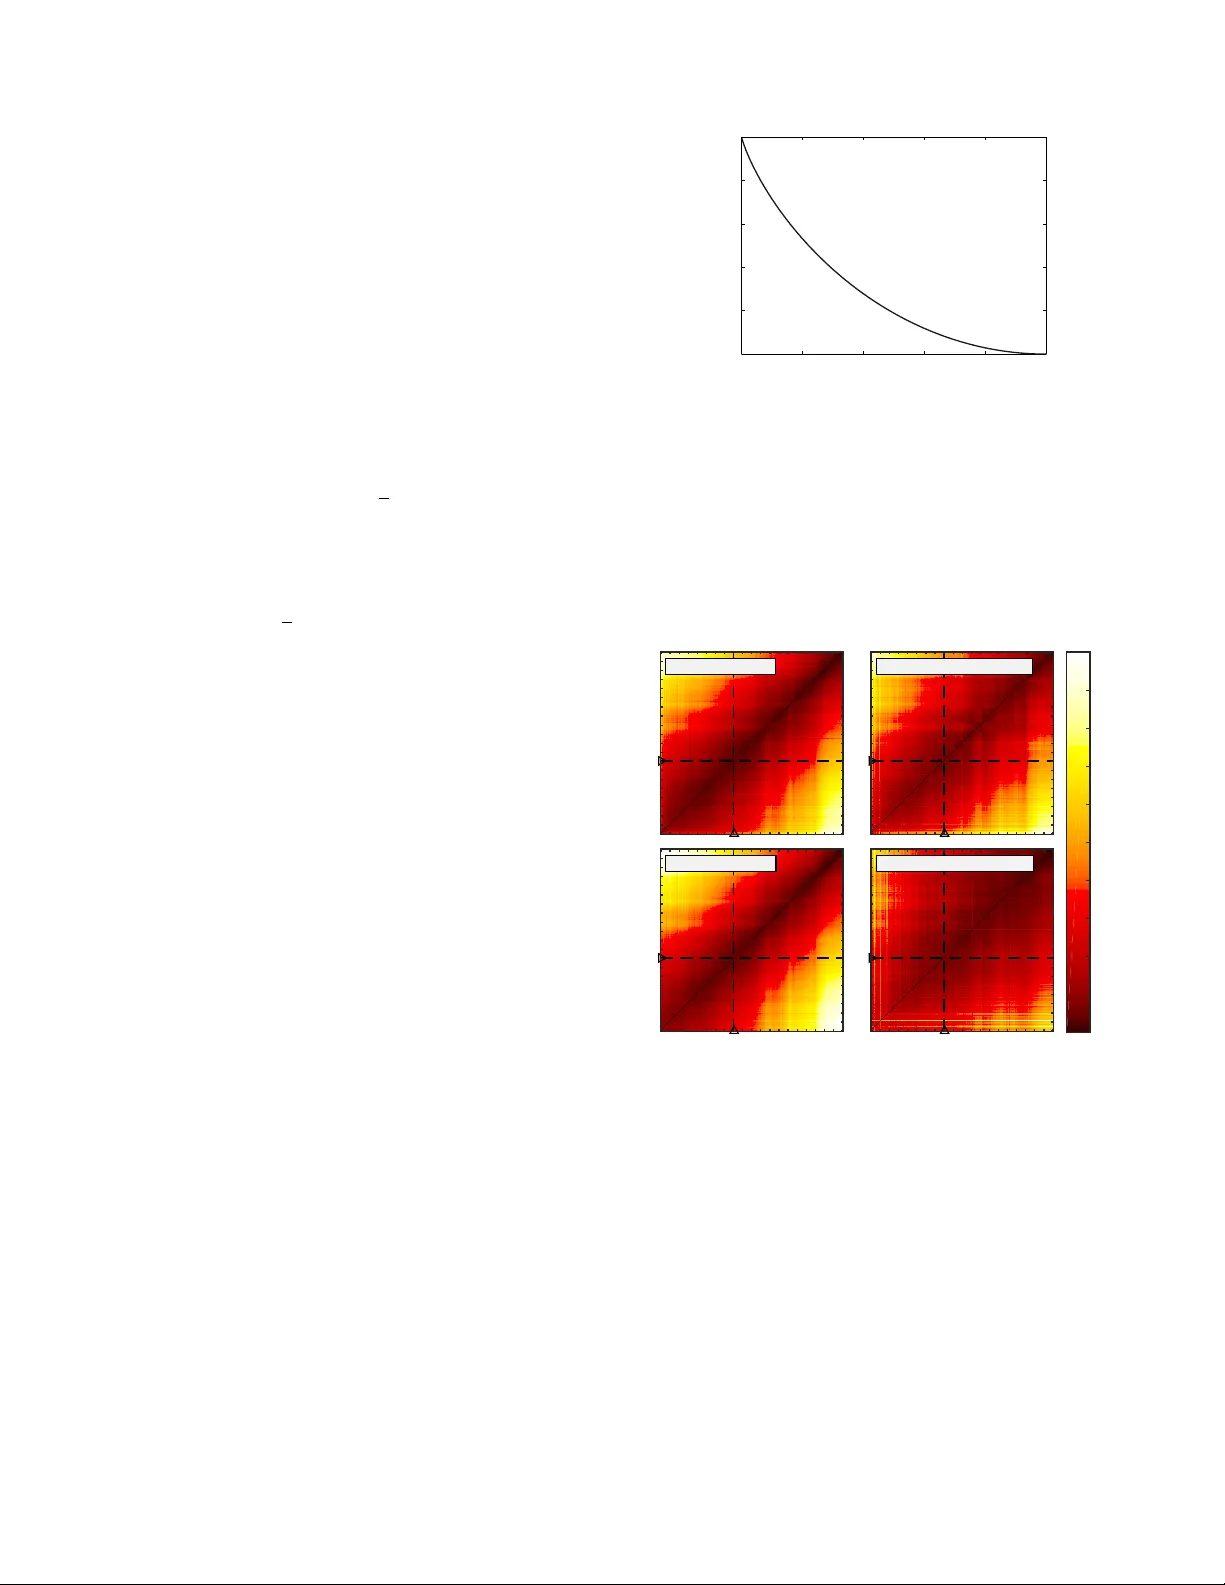
Characterizing the Go ogle Bo oks corpus: Strong limits to inferences of so cio-cultural and linguistic ev olution Eitan Adam P echenic k, 1 , ∗ Christopher M. Danforth, 1 , † and P eter Sheridan Do dds 1 , ‡ 1 Computational Story L ab, V ermont Complex Systems Center, V ermont A dvanc e d Computing Cor e, & the Dep artment of Mathematics and Statistics, University of V ermont, Burlington, VT, 05401 (Dated: May 28, 2020) It is tempting to treat frequency trends from the Go ogle Bo oks data sets as indicators of the “true” p opularit y of v arious words and phrases. Doing so allo ws us to draw quan titativ ely strong conclusions ab out the ev olution of cultural p erception of a given topic, such as time or gender. Ho wev er, the Google Books corpus suffers from a num b er of limitations which mak e it an obscure mask of cultural p opularity . A primary issue is that the corpus is in effect a library , containing one of each b ook. A single, prolific author is thereby able to noticeably insert new phrases into the Go ogle Books lexicon, whether the author is widely read or not. With this understo od, the Go ogle Bo oks corpus remains an important data set to be considered more lexicon-like than text-lik e. Here, w e sho w that a distinct problematic feature arises from the inclusion of scientific texts, which ha ve b ecome an increasingly substan tive p ortion of the corpus throughout the 1900s. The result is a surge of phrases typical to academic articles but less common in general, such as references to time in the form of citations. W e use inf ormation theoretic metho ds to highlight these dynamics by examining and comparing ma jor contributions via a div ergence measure of English data sets b etw een decades in the perio d 1800–2000. W e find that only the English Fiction data set from the second v ersion of the corpus is not heavily affected by professional texts. Ov erall, our findings call into question the v ast ma jority of existing claims drawn from the Go ogle Bo oks corpus, and p oin t to the need to fully characterize the dynamics of the corpus b efore using these data sets to draw broad conclusions ab out cultural and linguistic ev olution. P A CS num b ers: I. INTR ODUCTION T he Go ogle Bo oks data set is captiv ating b oth for its a v ailability and its incredible size. The first ver- sion of the data set, published in 2009, incorporates o ver 5 million b o oks [1]. These are, in turn, a subset selected for quality of optical character rec ognition and metadata—e.g., dates of publication—from 15 million digitized b o oks, largely provided by univ ersity libraries. These 5 million b o oks con tain ov er half a trillion words, 361 billion of which are in English. Along with sep- arate data sets for American English, British English, and English Fiction; the first version also includes Span- ish, F renc h, German, Russian, Chinese, and Hebrew data sets. The second version, published in 2012 [2], contains 8 million b o oks with half a trillion w ords in English alone, and also includes b ooks in Italian. The conten ts of the sampled b o oks are split in to case-sensitive n -grams whic h are t ypically blo c ks of text separated into n = 1, . . . , 5 pieces by whitespace—e.g., “I” is a 1-gram, and “I am” is a 2-gram A central if subtle and deceptiv e feature of the Go ogle Bo oks corpus, and for others comp osed in a similar fash- ion, is that the corpus is a reflection of a library in which only one of each b o ok is a v ailable. Ideally , w e would b e ∗ Electronic address: eitan.p echenic k@uvm.edu † Electronic address: chris.danforth@uvm.edu ‡ Electronic address: p eter.do dds@uvm.edu able to apply different popularity filters to the corpus. F or example, w e could ask to ha v e n -gram frequencies adjusted according to b ook sales in the UK, library usage data in the US, or how often each page in eac h b o ok is read on Amazon’s Kindle service (all ov er defined p eriods of time). Eviden tly , incorp orating p opularit y in any use- ful fashion would b e an extremely difficult undertaking on the part of Go ogle. W e are left with the fact that the Google Bo oks library has ultimately been furnished b y the efforts and c hoic- es of authors, editors, and publishing houses, who col- lectiv ely aim to an ticipate or dictate what p eople will read. This adds a further distancing from “true culture” as the abilit y to predict cultural success is often rendered fundamen tally imp ossible due to so cial influence pro cess- es [3]—we hav e one seed for each tree but no view of the real forest that will emerge. W e therefore observe that the Go ogle Bo oks corpus enco des only a small-scale kind of p opularit y: ho w often n -grams appear in a library with all b ooks given (in prin- ciple) equal imp ortance and tied to their y ear of publi- cation (new editions and reprin ts allow some bo oks to app ear more than once). The corpus is thus more akin to a lexicon for a collection of texts, rather than the col- lection itself. But problematically , because Google Books n -grams do ha ve frequency of usage associated with them based on this small-scale p opularity , the data s et readily con veys an illusion of large-scale cultural p opularity . An n -gram which declines in usage frequency ov er time may in fact b ecome more often read by a particular demo- graphic fo cused on a sp ecific genre of b o oks. F or exam- T yp eset by REVT E X 2 ple, “F ro do” first appears in the second Go ogle Books English Fiction corpus in the mid 1950s and declines thereafter in p opularit y with a few resurgent spikes [4]. While this limitation to small-scale p opularit y tempers the kinds of conclusions w e can draw, the ev olution of n -grams within the Go ogle Bo oks corpus—their relative abundance, their gro wth and deca y—still giv es us a v alu- able lens into how language use and culture has c hanged o ver time. Our contribution here will b e to show: 1. A principled approac h for exploring word and phrase evolution; 2. How the Go ogle Bo oks corpus is c hallenged in other resp ects orthogonal to its library-like nature, par- ticularly by the inclusion of scientific and medical journals; and 3. How future analyses of the Go ogle Books corpus should b e considered. F or ease of comparison with related w ork, w e fo cus primarily on 1-grams from selected English data sets b et w een the y ears 1800 and 2000. In this work, w e will use the terms “word” and “1-gram” interc hangeably for the sake of conv enience. The total volume of (non- unique) English 1-grams grows exp onen tially b et ween these y ears, as shown in Fig. 1, except during ma jor conflicts—e.g., the American Civil W ar and b oth W orld W ars—when the total volume dips substan tially . W e also observe a slight increase in volume b etw een the first and second v ersion of the unfiltered English data set. Bet ween the tw o English Fiction data sets, ho wev er, the total volume actually decreases considerably , which indi- cates insufficient filtering was used in pro ducing the first v ersion, and immediately suggests the initial English Fic- tion data set ma y not b e appropriate for an y kind of analysis. The simplest p ossible analysis in v olving any Go ogle Bo oks data set is to track the relativ e frequencies of a sp ecific set of words or phrases. Examples of suc h anal- yses inv olv e words or phrases surrounding individuali- t y [5], gender [6], urbanization [7], and time [1, 8], all of whic h are of profound interest. Ho wev er, the strength of all conclusions dra wn from these must take into accoun t b oth the num b er of words and phrases in question (an y- where from t wo [7] to tw ent y [5] or more at a time) and the sampling metho ds used to build the Go ogle Bo oks corpus. Man y researchers ha v e carried out broad analyses of the Google Bo oks corpus, examining prop erties and dynamics of entire languages. These include analyses of Zipf ’s and Heaps’ laws as applied to the corpus [9], the rates of v erb regularization [1], rates of word in tro duction and obsolescence and durations of cultural memory [8], as w ell as an observed decrease in the need for new words in several languages [10]. Ho wev er, these studies also app ear to take for gran ted that the data sets sample in a consisten t manner from w orks spanning the last t wo cen turies. Year 1800 1850 1900 1950 2000 log 10 Number of 1-grams 6 6.5 7 7.5 8 8.5 9 9.5 10 10.5 Total 1-gram counts in English datasets Version 1, all Version 2, all Version 1, fiction Version 2, fiction FIG. 1: The logarithms of the total 1-gram counts for the Go ogle Books English data sets (dark gray) and English Fic- tion data sets (light gray). The dashed and solid curv es denote the 2009 and 2012 versions of the data sets. In all four exam- ples, an exp onen tial increase in volume is apparen t ov er time with notable exceptions during wartime when the total vol- ume decreases, clearest during the American Civil W ar and b oth W orld W ars. While the total v olume for English increas- es b et ween versions, the volume for English fiction decreases drastically , suggesting a more rigorous filtering pro cess. Analysis of the emotional conten t of b o oks suggests a lag of roughly a decade betw een exogenous even ts and their effects in literature [11], complicating the use of the Go ogle Bo oks data sets directly as snapshots of cultural iden tity . As we will demonstrate, an assumption of un biased sampling of b ooks is not reasonable during the last cen- tury and esp ecially during recent decades, which is of par- ticular imp ortance to all analyses concerned with recent so cial change. Since parsing in the data sets is case- sensitiv e, we can giv e a suggestive illustration of this observ ation in Fig. 2, whic h displa ys the relativ e (nor- malized) frequencies of “figure” v ersus “Figure” in b oth v ersions of the corpus and for b oth English and English Fiction. In both v ersions of the English data set, the cap- italized v ersion, “Figure,” surpasses its lo wercase coun- terpart during the 1960s. Since the ma jority of b ooks in the corpus originated in universit y libraries [1], a ma jor effect of scientific texts on the dynamics of the data set is quite plausible. This trend is also apparent—albeit dela yed—in the first version of the English Fiction data set, which again suggests insufficient filtering during the compilation pro cess for that version. Because of Go ogle Bo oks library-like nature, authors are not represented equally or b y an y measure of popular- it y in a n y given data set but are instead roughly by their o wn prolificacy . This leav es ro om for individual authors to hav e notew orthy effects on the dynamics of the data sets, as w e w ill demonstrate in Section I I I. Lastly , due to copyrigh t laws, the public data sets 3 1800 1850 1900 1950 2000 0 0.005 0.01 0.015 0.02 0.025 0.03 Version 1, all Frequency (%) figure Figure 1800 1850 1900 1950 2000 0 0.005 0.01 0.015 0.02 0.025 0.03 Version 1, fiction figure Figure 1800 1850 1900 1950 2000 0 0.005 0.01 0.015 0.02 0.025 0.03 Version 2, all Year Frequency (%) figure Figure 1800 1850 1900 1950 2000 0 0.005 0.01 0.015 0.02 0.025 0.03 Version 2, fiction Year figure Figure FIG. 2: Relative frequencies of “Figure” vs “figure” in b oth v ersions of the Go ogle Books corpus for b oth English (all) and English Fiction. In the English data sets, the capitalized term rapidly surpasses the uncapitalized term in the 1960s. F or the first English Fiction data set, this effect is delay ed un til the 1970s. As shown later, only the second version of the English Fiction data set demonstrates a filtering of scien- tific terminology . These trends strongly suggest an increase starting around 1900 in the sampling of scien tific texts in both English data sets and the first English Fiction data set. do not include metadata (see supp orting online mate- rial [1]), and the data are truncated to av oid inference of authorship, which severely limits any analysis of censor- ship [1, 12] in the corpus. Under these conditions, we will sho w that muc h caution must b e used when employing these data sets—with a p ossible exception of the second v ersion of English Fiction—to draw cultural conclusions from the frequencies of wor ds or phrases in the corpus. W e structure the remainder of the pap er as follows. In Sec. I I, w e describ e ho w to use Jensen-Shannon diver- gence to highlight the dynamics o v er time of b oth ver- sions of the English and English Fiction data sets, pay- ing particular attention to k ey contributing w ords. In Sec. I II, we displa y and discuss examples of these high- ligh ts, exploring the extent of the scien tific literature bias and issues with individual authors; we also provide a detailed insp ection of some example decade–decade com- parisons. W e offer concluding remarks in Section IV. I I. METHODS A. Statistical divergence b etw een y ears W e examine the dynamics of the Go ogle Bo oks cor- pus b y calculating the statistical div ergence b et ween the distributions of 1-grams in tw o given y ears. A commonly used measure of statistical div ergence is Kullback-Leibler (KL) divergence [13], based on which we use a b ounded, symmetric measure. Giv en a language with N unique w ords and 1-gram distributions P in the first year and Q in second, the KL divergence b et ween P and Q can b e expressed as D K L ( P || Q ) = N X i =1 p i log 2 p i q i , (1) where p i is the probabilit y of observing the i th 1-gram random chosen from the 1-gram distribution for first y ear, and q i is the probabilit y of observing the same w ord in the second year. The units of KL divergence is bits, and may b e interpreted as the a verage num ber of bits wasted if a text from the first year is enco ded effi- cien tly , but according to the distribution from the latter, incorrect year. T o demonstrate this, w e ma y rewrite the previous equation as D K L ( P || Q ) = − N X i =1 p i log 2 q i − H ( P ) , (2) where H ( P ) = − P i p i log 2 p i is the Shannon en tropy [14], also the a verage num b er of bits required per w ord in an efficient enco ding for the original distribution; and the remaining term is the av erage num ber of bits required p er word in an efficient, but mistak en, enco d- ing of a giv en text. Ho wev er, if a single (sa y , the j th ) 1-gram in the language exists in the first year, but not in the second, then q j = 0, and the div ergence diverges. Since this scenario is not extraordinary for the data sets in question, w e instead use Jensen-Shannon divergence (JSD) [15] giv en by D JS ( P || Q ) = 1 2 D K L ( P || M ) + D K L ( Q || M ) , (3) where M = 1 2 ( P + Q ) is a mixed distribution of the tw o y ears. This measure of divergence is bounded betw een 0 when the distributions are the same and 1 bit in the extreme case when there is no ov erlap b et ween the 1- grams in the tw o distributions. If we b egin with a uni- form distribution of N sp ecies and replace k of those sp ecies with k en tirely new ones, the JSD betw een the original and new distribution is k / N , the prop ortion of sp ecies replaced. The JSD is also symmetric, which is an added conv enience. The JSD may b e expressed as D JS ( P || Q ) = H ( M ) − 1 2 H ( P ) + H ( Q ) , (4) 4 from which it is apparen t that a similar waste analogy holds as with KL divergence, with the mixed distribution taking the place of the appro ximation regardless of the y ear a text was written. B. Key contributions of individual w ords The form for Jensen-Shannon div ergence giv en in Eq. 4 can b e brok en down into contributions from individual w ords, where the con tribution from the i th w ord to the div ergence b etw een tw o years is given by D JS ,i ( P || Q ) = − m i log 2 m i + 1 2 p i log 2 p i + q i log 2 q i . (5) Some rearrangement giv es D JS ,i ( P || Q ) = m i · 1 2 r i log 2 r i +(2 − r i ) log 2 (2 − r i ) , (6) where r i = p i /m i , so that contribution from an individu- al word is prop ortional to the av erage probability of the w ord, and the prop ortion dep ends on the ratio b etw een the smaller probability (without loss of generalit y) and the a verage. Namely , w e ma y reframe the equation abov e as D JS ,i ( P || Q ) = m i C ( r i ) . (7) W ords with larger av erage probability yield greater con- tributions as do those with smaller ratios, r , b etw een the smaller and av erage probabilit y . So while a common 1-gram—suc h as “the,” “if,” or a p eriod—changing sub- tly can ha ve a large effect on the divergence, so can an uncommon (or en tirely new) word given a sufficient shift from one year to the next. The size of the contribution relativ e to the av erage probability is display ed in Fig. 3 for ratios ranging from 0 to 1. C ( r i ) is symmetric ab out r i = 1 (i.e., no c hange), so no nov el b eha vior is lost by omitting the case where r i > 1 (i.e., when p i is the larg- er probability). The maximum p ossible contribution (in bits) is precisely the av erage probability of the word in question, which o ccurs if and only if the smaller prob- abilit y is 0. No contribution is made if and only if the probabilit y remains unchanged. W e coarse-grain the data at the level of decades—e.g., b et w een 1800-to-1809 and 1990-to-1999—by a v eraging the relative normalized frequency of each unique w ord in a given decade ov er all years in that decade. (Each year is weigh ted equally .) This allo ws conv enien t calculation and sorting of contributions to divergence of individual 1-grams b etw een any tw o time p eriods. 0 0.2 0.4 0.6 0.8 1 0 0.2 0.4 0.6 0.8 1 Normalized Contribution to Divergence Ratio of Smaller to Average Frequency Ratio of Cont. to Avg. Freq. FIG. 3: F or the ratio r b etw een the smaller relative proba- bilit y of an elemen t and the a verage, C ( r ) is the prop ortion of the av erage contributed to the Jensen-Shannon divergence (see Eqs. 6 and 7). In particular, if r = 1 (no change), then the contribution is zero; if r = 0, the contribution is half its probabilit y in the distribution in whic h it o ccurs with nonzero probabilit y . A) English 2009 1800 1850 1900 1950 2000 B) English Fiction 2009 C) English 2012 1800 1850 1900 1950 2000 1800 1850 1900 1950 2000 D) English Fiction 2012 1800 1850 1900 1950 2000 0% 10% 20% 30% 40% 50% 60% 70% 80% 90% 100% FIG. 4: Heatmaps sho wing the JSD b et ween every pair of y ears b etw een 1800 and 2000, contributed by words app ear- ing ab o ve a normalized frequency threshold of 10 − 5 . The dashed lines highlight the divergences to and from the year 1880, which are featured in Fig. 5. The off-diagonal elements represen t divergences b et ween consecutive years, as in Fig. 6. The color represents the p ercentage of the maximum diver- gence observed in the given time range for each data set. The div ergence betw een a y ear and itself is zero. F or an y giv- en year, the divergence increases with the distance (num ber of years) from the diagonal—sharply at first, then gradual- ly . In teresting features of the maps are the presence of tw o cross-hairs in the first half of the 20th cen tury , which strongly suggests a wartime shift in the language, as well as an asym- metry that suggests a particularly high divergence b etw een the first half century and the last quarter century observed. 5 JSD (bits) 0 0.05 0.1 0.15 A) English 2009 B) English Fiction 2009 1800 1850 1900 1950 JSD (bits) 0 0.05 0.1 0.15 C) English 2012 1800 1850 1900 1950 2000 D) English Fiction 2012 FIG. 5: JSD b et w een 1880 and each display ed year for given data set, corresponding to dashed lines from Fig. 4. Con- tributions are counted for all words app earing ab o ve a 10 − 5 threshold in a giv en y ear; for the dashed curv es, the threshold is 10 − 4 . Typical b ehavior in each case consists of a relatively large jump b etw een one year and the next with a more grad- ual rise afterw ard (in both directions). Exceptions include w artime, particularly the tw o W orld W ars, during which the div ergence is greater than usual; ho wev er, after the conclu- sion of these p eriods, the cumulativ e divergence settles back to the previous trend. Initial spikiness in (D) is likely due to lo w v olume. I II. RESUL TS AND DISCUSSION A. Broad view of language evolution within Go ogle Bo oks Fig. 4 sho ws the JSD b etw een the 1-gram distribu- tions for every pair of y ears b etw een 1800 and 2000 con- tributed by 1-grams present ab o ve a threshold normal- ized frequency of 10 − 5 for b oth versions of the English and English Fiction data sets (i.e., w ords that app ear with normalized frequency at least 1 in 10 5 ). A ma jor qualitativ e aspect apparent from the heatmaps is a gradual increase in divergence with dif- ferences in time—the lexicon underlying Go ogle steadi- ly evolv es—though this is strongly curtailed for the sec- ond English Fiction corpus. W e see the heatmaps are “pinc hed” tow ard the diagonal in the vicinities of the t wo world w ars. Also visible is an asymmetry that sug- gests a particularly high div ergence b et w een the first half cen tury and the last quarter cen tury observed. W e examine these effects more closely in Figs. 5 and 6 b y taking t wo slices of the heatmaps. W e sp ecifically con- sider the divergences of eac h y ear compared with 1880 (dashed lines), and the div ergences b etw een consecutive y ears (off-diagonal). T o v erify qualitative consistency , w e also include analogous contribution curves using the more restrictive threshold of 10 − 4 . While the initial divergence b etw een any tw o consecu- tiv e years is noticeable, the divergence increases (for the most part) steadily with the time difference. The cross- hairs from the heatmap resolve in to war-time bumps in div ergence, which quickly settle in p eacetime. The larg- er b o ost to the divergence in recent decades, ho wev er, is log 10 (JSD) -3 -2.5 -2 -1.5 -1 -0.5 A) English 2009 B) English Fiction 2009 1800 1850 1900 1950 log 10 (JSD) -3 -2.5 -2 -1.5 -1 -0.5 C) English 2012 1800 1850 1900 1950 2000 D) English Fiction 2012 FIG. 6: Consecutiv e year (b et ween eac h year and the fol- lo wing y ear) base-10 logarithms of JSD, corresp onding to off-diagonals in Fig. 4. F or the solid curv es, contributions are counted for all words app earing ab ov e a 10 − 5 thresh- old in a given year; for the dashed curves, the threshold is 10 − 4 . Divergences b et ween consecutive years typically decline through the mid-19th century , remain relatively steady until the mid-20th century , then contin ue to decline gradually o ver time. more p ersistent suggesting a more fundamen tal change in the data set, whic h we will examine in more depth later in this section. Div ergences b et ween consecutive y ears typ- ically decline through the mid-19th century . Div ergences then remain relatively steady un til the mid-20th century , then contin ue to decline gradually o ver time, whic h may b e consistent with previous findings of decreased rates of w ord in troduction and increased rates of w ord obsoles- cence in many Go ogle Bo oks data sets ov er time [8] and a slowing down of linguistic ev olution o ver time as the v o cabulary of a language expands [10]. The initial spikes in divergence in the second version of the fiction data set are lik ely due to the low er initial v olume observed in Fig. 1. B. Decade-decade comparisons using JSD word shifts 1. Gener al observations W e present “w ord shifts” [16] for a few examples of in ter-decade divergences in Figs. 7 – 12, sp ecifically com- paring the 1940s to the 1930s and the 1980s to the 1950s for the second unfiltered English data set (Figs. 7 –8) and b oth English Fiction data sets (Figs. 9 – 12). W e pro vide a full set of such comparisons in the supplemen tary S1–S4 Files. F or each of the four data sets, the largest contri- butions to all divergences generally appear to b e from increased relative frequencies of use of w ords b etw een decades. F or the unfiltered data sets, these are in turn hea vily influenced by increased mention of years, which is less pronounced for English Fiction. The 1940s literature, unsurprisingly , features more ref- erences to Hitler and w ar than the 1930s, along with other W orld W ar I I-related military and p olitical terms. 6 Contribution (% of total JSD = 0.00364 bit) 0.4 0.2 0 0.2 0.4 0.6 0.8 1 Rank 1 5 10 15 20 25 30 35 40 45 50 55 60 1940 1941 1942 1939 1943 1944 1945 1946 1938 1947 war his ) ( 1948 her , Hitler - he 1937 him ; aircraft I Nazi upon Army U.S. was ml Germans Soviet 1949 1929 ' Axis job 1928 American King planes she my basic Nazis Air wartime Lanny bombers radio air Japs Negro Fig program which Mr. Obj 1927 Top JSD contributions: 1930s to 1940s English All V2 FIG. 7: (English, all; V ersion 2.) T op 60 individual con tribu- tions of 1-grams to the JSD betw een the 1930s and the 1940s. Eac h contribution is given as a p ercen tage of the total JSD (see horizontal axis label) betw een the tw o given decades. All con tributions are p ositive; bars to the left of center represen t w ords that w ere more common in the earlier decade, whereas bars to the right represen t words that b ecame more common in the later decade. Contribution (% of total JSD = 0.0145 bit) 0.5 0 0.5 1 Rank 1 5 10 15 20 25 30 35 40 45 50 55 60 ) ( the : 1980 1979 1978 of 1977 1981 1976 1982 1975 / 1983 which 1974 1973 1984 1972 1970 1985 1971 he his al 1969 1986 1968 was ' computer U.S. model data upon percent 1967 % Figure 1966 it ; 1965 1987 had shall cent great 1964 technology 's Mr. . women information 1963 [ ] 1950 Top JSD contributions: 1950s to 1980s English All V2 FIG. 8: (English, all; V ersion 2.) T op 60 individual con tribu- tions of 1-grams to the JSD b et w een the 1950s and the 1980s. Eac h contribution is given as a p ercen tage of the total JSD (see horizontal axis label) betw een the tw o given decades. All con tributions are p ositive; bars to the left of center represen t w ords that w ere more common in the earlier decade, whereas bars to the right represen t words that b ecame more common in the later decade. 7 Contribution (% of total JSD = 0.0045 bit) 0.2 0 0.2 0.4 0.6 Rank 1 5 10 15 20 25 30 35 40 45 50 55 60 1940 1941 1942 1939 1943 " 1944 Lanny 1945 1946 1938 war 1947 ; her his American upon aircraft Germans him I 1948 """" my Hitler he Nazi 1937 radio German Air Sir Negro Army ) ( ! me Mr around planes Soviet New United that she program Nazis very patient 1928 British 1929 ml Japs Axis And The bombers Top JSD contributions: 1930s to 1940s English Fiction V1 FIG. 9: (English Fiction, V ersion 1.) T op 60 individual con tributions of 1-grams to the JSD b et ween the 1930s and the 1940s. Eac h contribution is given as a percentage of the total JSD (see horizontal axis lab el) b etw een the tw o given decades. All con tributions are p ositiv e; bars to the left of cen ter represent words that w ere more common in the earlier decade, whereas bars to the right represent words that b ecame more common in the later decade. Contribution (% of total JSD = 0.0132 bit) 0 0.5 1 Rank 1 5 10 15 20 25 30 35 40 45 50 55 60 ) ( : 1980 1979 1978 1977 1976 1981 1975 1982 - patients 1974 1983 ; 1973 al / he 1972 the 1984 which 1970 1971 1985 percent 1969 1968 his 1967 % it Mr upon 1966 1965 was et 1964 1986 J had role levels shall 1963 model drug him of said response therapy 1962 great Press 1961 Top JSD contributions: 1950s to 1980s English Fiction V1 FIG. 10: (English Fiction, V ersion 1.) T op 60 individual con tributions of 1-grams to the JSD b et ween the 1950s and the 1980s. Eac h contribution is given as a percentage of the total JSD (see horizontal axis lab el) b etw een the tw o given decades. All con tributions are p ositiv e; bars to the left of cen ter represent words that w ere more common in the earlier decade, whereas bars to the right represent words that b ecame more common in the later decade. 8 Contribution (% of total JSD = 0.00443 bit) 0.2 0 0.2 0.4 0.6 0.8 Rank 1 5 10 15 20 25 30 35 40 45 50 55 60 " Lanny . said ; of upon v. , around Budd Studs Hitler -- Dinny 1940 Wang B.M. Robbie Pierre which Saburov 'd 1941 Jeffrey Sir Germans Johnny ? He Scarlett 1942 Weigand na 1943 London Yuan Proust war Nazis Francie 're Cinda 1944 Diederich 's not Mama 1939 Trav toward Laskell You Shelley ! Marcel ) o.p. Whit by Top JSD contributions: 1930s to 1940s English Fiction V2 FIG. 11: (English Fiction, V ersion 2.) T op 60 individual con tributions of 1-grams to the JSD b et ween the 1930s and the 1940s. Eac h contribution is given as a percentage of the total JSD (see horizontal axis lab el) b etw een the tw o given decades. All con tributions are p ositiv e; bars to the left of cen ter represent words that w ere more common in the earlier decade, whereas bars to the right represent words that b ecame more common in the later decade. Contribution (% of total JSD = 0.00779 bit) 1 0.5 0 0.5 1 Rank 1 5 10 15 20 25 30 35 40 45 50 55 60 ; . her which she She of , 'd Mr. " and around upon 's shall Mrs. ? he .... ' ... anymore 're the phone little great that - back onto shit round / computer 'm very Her ! just said all 1980 1978 okay 1979 himself must : fucking 1976 1977 may is 1975 in by someone de Top JSD contributions: 1950s to 1980s English Fiction V2 FIG. 12: (English Fiction, V ersion 2.) T op 60 individual con tributions of 1-grams to the JSD b et ween the 1950s and the 1980s. Eac h contribution is given as a percentage of the total JSD (see horizontal axis lab el) b etw een the tw o given decades (see title). All contributions are p ositive; bars to the left of center represen t words that were more common in the earlier decade, whereas bars to the right represent w ords that b ecame more common in the later decade. 9 This is seen regardless of the sp ecific data set used and is fairly encouraging. Curiously , regardless of the sp ecific data set, a noticeable contribution is giv en b y an increase in relative use of the words “Lanny” and “Budd,” in ref- erence to one character (Lanny Budd) frequen tly written ab out by Upton Sinclair during that decade. In the fic- tion data sets, this char acter dominates the c harts. 2. Se cond unfilter e d English data set: 1930s versus 1940s A comparison of the 1930s and 1940s for the second v ersion of the unfiltered English data set (Fig. 7) shows dynamics dominated by references to y ears. (The first v ersion is similar. F or analogous figures, see the sup- plemen tary S1–S4 Files.) Eigh t of the top ten contribu- tions to the div ergence b etw een those decades are due to increased relativ e frequencies of use of each of years b et w een 1940 and 1949, their con tribution decreasing c hronologically , and the other tw o top ten w ords are the last t wo years of the previous decade (“1948” and “1949” app ear at ranks 15 and 34, resp ectiv ely). The last three y ears in the 1920s also app ear by w ay of decreased rela- tiv e frequency of use in the top 60 contributions. Other notable differences include: • The 11th highest con tribution is from “w ar,” which increased in relativ e frequency . • “Hitler” and “Nazi” (increased relative frequencies) are ranked 18th and 26th, resp ectively . • Paren theses (13th and 14th) show increased rela- tiv e frequencies of use. • Personal pronouns sho w decreased relative frequen- cies of use. • The word “King” (41st) also sho ws a decreased rel- ativ e frequency , p ossibly due to the British line of succession. 3. Se cond unfilter e d English data set: 1950s versus 1980s • The top tw o contributions b etw een the 1950s and the 1980s (see Fig. 8) in the English data set are b oth paren theses, which sho w dramatically increased relative frequencies of use. • Combined with increased relativ e frequencies for the colon (4th), solidus/virgule (or forward slash) (14th), “computer” (32nd), and square brack ets (58th and 59th), this suggests that the primary c hanges b et w een the 1950s and the 1980s are due sp ecifically to computational sources. • Other technical words showing noticeable increas- es include “mo del” (34th), “data” (35th), “p er- cen t” and the p ercen tage sign (37th and 39th), “Figure” (40th), “technology” (51st), and “infor- mation” (56th). • Similarly to the divergence b etw een the 1930s and 1940s, 19 out of the top 30 places are accoun ted for b y increased relative frequencies of use in years b et w een 1968 and 1980. • The w ords “the” (3rd), “of ” (8th), and “whic h” (16th) all decrease noticeably in relative frequency and are the highest rank ed alphab etical 1-grams. • Unlike the div ergence b et w een the 1930s and 1940s, only masculine pronouns show decreases in the top 60, while “w omen” (55th) increases. 4. First English fiction data set: 1930s versus 1940s The first v ersion of English Fiction shows similar dynamics to the second v ersion of the unfiltered data set betw een the 1930s and the 1940s (see Fig. 9) with y early mentions dominating the ranks. Some exceptions include: • “Lanny” rising in rank from 49th to 8th. • Paren theses falling from 13th and 14th to 36th and 37th. “ml” (increased relative frequency of use in the 1940s) falling from 31st to 55th. • “radio” (with increased relative frequency) rising from 51st to 30th. • “King” is no longer in the top 60 con tributions. • “patient” enters the top 60 (ranked 51st). 5. First English fiction data set: 1950s versus 1980s This similarity b etw een the original English Fiction data set and the unfiltered data set also app ears in the divergence b et w een the 1950s and the 1980s (see Fig. 10) with parentheses and y ears dominating. More- o ver, “patien ts” ranks 13th (with increased relative fre- quency of use) despite not app earing in the top 60 for the unfiltered data set. These observ ations, combined with increases in “lev els” (47th), “drug” (51st), “resp onse” (55th), and “therapy” (56th) demonstrate the original fiction data set is strongly influenced by medical jour- nals. Therefore, this data set cannot be considered as primarily fiction despite the lab el. 6. Se cond English fiction data set: 1930s versus 1940s F ortunately , the same is not true for the second version of the English Fiction data set. This is quickly apparent up on insp ection of the tw o greatest contributions to the 10 Year 1930 1935 1940 1945 1950 1955 1960 Frequency (%) 0 0.002 0.004 0.006 0.008 0.01 0.012 0.014 Lanny vs. Hitler Lanny Hitler FIG. 13: Upton Sinclair wrote 11 Lanny Budd nov els set during W orld W ar I I. The first of these w as published in 1940, and the last was published in 1953. The net effect of Sinclair’s efforts is that his character app ears muc h more frequently in the English Fiction (V ersion 2) data set than Hitler during most of the war. This demonstrates the potential impact of a single prolific author on the corpus. div ergence betw een the 1930s and the 1940s (see Fig. 11). The first of these is due to a dramatic increase in the rela- tiv e frequencies of use of quotation marks, which implies increased dialogue. The second is the name “Lanny” in reference to the recurring character Lanny Budd from 11 Upton Sinclair no vels published betw een 1940 and 1953. “Budd” ranks 11th in the chart ahead of “Hitler” (13th). The normalized frequency series for “Lanny” and “Hitler” pro vided in Fig. 13 demonstrate that Lan- n y receiv ed more men tion than Hitler during this time p eriod. The chart is littered with the names of fictional c haracters: • Studs Lonigan, the 1930s protagonist of a James T. F arrel trilogy , secures the 12th sp ot. (Naturally , he is mentioned few er times during the 1940s.) • Dinny Cherrel from the 1930s The F orsyte Saga by John Galsworth y secures rank 15. • W ang Y uan from the 1930s The House of Earth trilogy by P earl S. Buck ranks 17th and 37th. • Detective Bill W eigand, a recurring c haracter creat- ed by Richard Lo c kridge in the 1940s, secures rank 33. • The eponymous, original Asimov rob ot from the 1940 short story , “Robbie,” ranks 19th. • “Mama” (ranked 48th) is none other than the sub- ject of Mama’s Bank A c c ount , published in 1943 b y Kathryn F orb es. • “Saburov” (rank ed 22nd) from Days and Nights b y Konstantin Simonov and “Diederich” (rank ed 45th) from Der Untertan by Heinrich Mann are Year 1950 1960 1970 1980 1990 2000 Frequency (%) 0 0.1 0.2 0.3 0.4 0.5 0.6 0.7 0.8 0.9 1 All All Fiction Fiction Gender he she FIG. 14: Time series for “he” and “she” for V ersion 2. The unfiltered normalized frequencies are giv en by the sol- id curve. Normalized frequencies in fiction are given by the dashed curve. These personal pronouns are more common in fiction. The pronoun “she” gains p opularity through the 1990s in b oth data sets, with a more pronounced growth in fiction. sub jects of w orks translated into English in the 1940s. W e note that while Marcel Proust (56th and 33rd), who died in 1922 may b e present in the 1940s due to letters translated by Mina Curtiss in 1949 or other ref- erences not technically fiction. Similarly , “B.M.” (18th) ma y refer to the author B. M. Bo wer. Thus, the v ast ma jority of prominen t w ords in the w ord shift may b e traced not only to authors of fiction, but to the con- ten t of their work. Moreov er, the greatest contributions to divergence app ear to corresp ond to the most prolific authors, particularly Upton Sinclair. 7. Se cond English fiction data set: 1930s versus 1940s While there are no names of c haracters in the top diver- gences b et w een the 1950s and the 1980s, the up dated fic- tion data set (Fig. 12) displays far more v ariety than the original version, including: • Decreases in relative frequencies of masculine pronouns—e.g., “he” (rank 19) and “himself ” (rank 48)—and corresp onding increases for femi- nine pronouns—e.g., “her” (3rd), “she” (5th), and “She” (6th). W e present times series for “he” and “she” in Fig. 14. • An increase in relative frequencies of contractions (see ranks 9, 15, and 21). • A decrease in “shall” (16th) and “m ust” (49th), and a v ariet y of increased profanity (particularly ranks 33 and 51). 11 1950 1960 1970 1980 1990 2000 Frequency (%) 0 0.01 0.02 0.03 0.04 A Figure percent data computer Year 1950 1960 1970 1980 1990 2000 Frequency (%) × 10 -3 0 1 2 3 4 5 6 B Figure percent data computer FIG. 15: Time series of technical terms from V ersion 2: (a) English all, (b) English fiction. In the unfiltered data set, these technical terms appear frequently and increase in usage though the 1980s. In fiction, technical terms show up far less frequently and remain relatively stable in usage with the notable exception of “computer,” which has b een gradually gaining p opularity since the 1960s. • Decreases in “Mr.” (10th) and “Mrs.” (17th). • V arious shifts in punctuation, particularly fewer semicolons (1st) and more p erio ds (2VD). Quo- tation (11th) and question (18th) marks b oth see increased relative frequencies of use in the 1980s, and the four-p erio d ellipsis (20th) loses ground to the three-p erio d version (22TD). C. The rise of scien tific literature in the Go ogle Bo oks corpus As our JSD analysis has shown ab ov e, the unfiltered English data sets feature more general scientific terms and we compare “percent,” “data,” “Figure,” and “mo d- el” in Fig. 15. The original fiction data set also features these, but also places “patients,” “drug,” “response,” and “therap y” among the top 60 contributions. The prima- ry difference b et ween the unfiltered and original fiction data sets in the 1980s (compared to the 1950s) appears to consist of the nature of journals sampled. The unfiltered comp onen ts predicted and observed for this particular data set seem to b e dominated by medical journals. As well as ha ving more mentions of time and tech- nical terms (and parentheses) in the 1980s than in the 1950s, b oth unfiltered versions and the first fiction data set include b oth “et” and “al” with greater relative fre- quency in the 1980s. Perhaps more importantly , years do not hav e a large effect on the dynamics in the second English Fiction data set. W e see in Fig. 16 that while 1850 1900 1950 2000 Frequency (%) 0 0.005 0.01 0.015 0.02 References to Time E. all 1883 1910 1950 Year 1850 1900 1950 2000 Frequency (%) × 10 -3 0 0.5 1 1.5 2 2.5 3 E. Fiction FIG. 16: Normalized frequencies of references to years. The top panel resembles a figure from [1] using unfiltered data from English V ersion 2. (The cited pap er uses V ersion 1.) Note the c haracteristic rapid rises and gradual declines, as w ell as the increasing peaks in yearly references. How ever, while the characteristic shap e is still present in fiction (V ersion 2, b ottom)—at muc h reduced lev els—the peaks do not rise. The rising effect is likely due to citations from scientific texts. p eaks for years rise in the unfiltered data, they do not in fiction. The absence of rising p eaks in fiction strongly suggests the rise in p eak relative frequencies of years in the larger data set is due to a citation bias in the unfil- tered data set from high sampling of scientific journals. This bias casts strong doubt on conclusions that we as a culture forget things more quickly than w e once did based on the observ ation that half-lives for mentions of a given y ear dec line o ver time [1]. The exponential rise in scien tific literature is not a new phenomenon, and as de Solla Price stated in 1963 [17] (p. 81) when discussing the half-liv es for citations of scien tif- ic literature, “In fields embarrassed b y an inundation of literature there will be a tendency to bury as muc h of the past as possible and to cite older pap ers less often than is their statistical due.” It would seem that an explanation for declining half-lives in the mentions of y ears lies in the dynamics of the memory of scientific discov eries rather than that of culture. F or the second fiction data set, we observ e in Fig. 15B, that “computer” gains p opularit y in the fiction data set despite other technical w ords remaining relatively steady in usage, as we might exp ect. This should b e encourag- ing for any one attempting to analyze collo quial English, despite the prolificacy bias apparent from the authors 12 suc h as Upton Sinclair. In the supplementary S1–S4 Files, we include the top 60 contributions to divergences b etw een eac h pair of the 20 decades in each of the four data sets analyzed in this pap er. In total, 760 figures are included (190 per data set) for a grand total of 45,600 contributions. W e high- ligh t some of these here. • F or divergences to and from the first decade of the 1800s, many of the con tributions are due to a reduction of optical c haracter recognition confusion b et w een the letters ‘f ’ and ‘s’. F or example, in the second unfiltered data set b etw een the 1800s and 1810s, the top tw o contributions are due to reduc- tions in “fame” and “os,” respectively . The w ord “same” (ranked 11th) is the first increasing con- tribution. Decreased relative frequencies of “os,” “sirst,” “thofe,” “fo,” “fay ,” “cafe,” “fa ys,” “fome,” and “faid” (ranks 3 through 10, resp ectively) and “lise” (12th) all suggest digital misreadings of b oth ’f ’ and the long ‘s’. (The 13th contribution is “Nap oleon,” who is mentioned with greater rela- tiv e frequently in the 1810s.) • Contributions b et ween the 1830s and the 1860s in the second unfiltered data set highlight the Amer- ican Civil W ar and its aftermath. “State” (11th), “General” (19th), “States” (20th), “Union” (37th), “Confederate” (48th), “Gov ernmen t” (52nd), “F ed- eral” (56th), and “Constitution” (59th) all show increased relativ e frequency of use. Religious terms tend to decline during this p erio d—e.g., “ch urc h” (14th), “Go d” (24th), and “religion” (58th). • Betw een the 1940s and 1960s, the second unfil- tered dataset shows increases for “nuclear” (43rd), “Vietnam” (47th), and “Communist” (50th). The relativ e frequency of “war” (25th) decreases sub- stan tially . Mean while in fiction, “Lann y” (5th) declines, while “television” (38th) and the Hardy Bo ys (“Hardy” ranks 51st) appear with greater rel- ativ e frequencies. • Betw een the 1960s and 1970s, the second fiction data set is strongly affected by “Garp” ( The World A c c or ding to Garp by John Irving, 1978) at rank 19, increased relativ e frequencies of profanit y (ranks 27, 33, and 38), and increased mentions of “Nixon” (41st) and “Sp o c k” (47th, lik ely due to “Star T rek” no vels). • Betw een the 1980s and 1990s, the second fiction set shows increased relative frequencies of use of the words “gay” (15th), “lesbian” (19th), “AIDS” (24th), and “gender” (27th). F emale pronouns (2nd, 8th, and 9th) show increased relative frequen- cies of use in contin uance of Fig. 12. IV. CONCLUDING REMARKS Based on our introductory remarks and ensuing detailed analysis, it should now be clear that the con- ten ts of the Go ogle Bo oks corpus do not represent an un biased sampling of publications. Bey ond being library- lik e, the evolution of the corpus throughout the 1900s is increasingly dominated b y scien tific publications rather than p opular works. W e hav e shown that even the first data set sp ecifically lab eled as fiction app ears to b e sat- urated with medical literature. When examining these data sets in the future, it will therefore b e necessary to first identify and distinguish the p opular and scientific comp onents in order to form a picture of the corpus that is informative ab out cul- tural and linguistic evolution. F or instance, one should ask how muc h of any observed gender shift in language reflects word choice in popular works and ho w m uch is due to c hanges in scientific norms, as well as which might precede the other if they are somewhat in balance. Ev en if we are able to restrict our fo cus to p opu- lar works b y appropriately filtering scientific terms, the library-lik e nature of the Go ogle Bo oks corpus will mean the resultant normalized frequ encies of w ords cannot be a direct measure of the “true” cultural p opularity of those w ords as they are read (again, F ro do). Secondarily , not only will there b e a dela y b et w een c hanges in the public p opularit y of words and their app earance in print, nor- malized frequencies will also b e affected by the prolifica- cy of the authors. In the case of Upton Sinclair’s Lan- n y Budd, a fictional character was v aulted to the upp er ec helons of words affecting div ergence (even surpassing Hitler) b y virtue of app earing as the protagonist in 11 no vels b et w een 1940 and 1953. Go ogle Bo oks is at b est a limited pro xy for so cial information after the fact. The Go ogle Bo oks corpus’s b eguiling pow er to imme- diately quan tify a v ast range of linguistic trends warran ts a very cautious approach to any effort to extract scien- tifically meaningful results. Our analysis provides a p os- sible framework for impro vemen ts to previous and future w orks which, if p erformed on English data, ought to fo cus solely on the second version of the English Fiction data set, or otherwise prop erly account for the biases of the unfiltered corpus. Ac knowledgmen ts PSD was supp orted by NSF CAREER Aw ard # 0846668. 13 [1] J.-B. Mic hel, Y. K. Shen, A. P . Aiden, A. V eres, M. K. Gra y , J. P . Pick ett, D. Hoib erg, D. Clancy , P . Norvig, J. Orwan t, et al. , science 331 (6014), 176 (2011). [2] Y. Lin, J.-B. Michel, E. L. Aiden, J. Orwan t, W. Bro ck- man, and S. Petro v, in Pr oc e e dings of the ACL 2012 System Demonstr ations (Asso ciation for Computational Linguistics, 2012), pp. 169–174. [3] M. J. Salganik, P . S. Do dds, and D. J. W atts, Science 311 , 854 (2006). [4] Goo gle Ngr am Viewer: ‘F r odo’, 1800–2000 in English Fiction. , https://books.google.com/ngrams/graph? content=Frodo&year start=1800 &year end=2000&corpus=16&smoothing=1 ; Accessed April 25, 2015. [5] J. M. Twen ge, W. K. Campbell, and B. Gentile, PloS one 7 (7) (2012). [6] J. M. Tw enge, W. K. Campb ell, and B. Gentile, Sex roles 67 (9-10), 488 (2012). [7] P . M. Greenfield, Psychological science 24 (9), 1722 (2013). [8] A. M. P etersen, J. T enen baum, S. Ha vlin, and H. E. Stan- ley , Scientific rep orts 2 (2012). [9] M. Gerlac h and E. G. Altmann, Ph ysical Review X 3 (2), 021006 (2013). [10] A. M. Petersen, J. N. T enen baum, S. Havlin, H. E. Stan- ley , and M. Perc, Scientific rep orts 2 (2012). [11] R. A. Bentley , A. Acerbi, P . Ormero d, and V. Lamp os, PloS ONE 9 (1), e83147 (2014). [12] A. Koplenig, Digital Scholarship in the Humanities (2015), in press. [13] S. Kullback and R. A. Leibler, The Annals of Mathemat- ical Statistics pp. 79–86 (1951). [14] C. E. Shannon, A CM SIGMOBILE Mobile Computing and Communications Review 5 (1), 3 (2001). [15] J. Lin, Information Theory , IEEE T ransactions on 37 (1), 145 (1991). [16] P . S. Do dds, K. D. Harris, I. M. Kloumann, C. A. Bliss, and C. M. Danforth, PLoS ONE 6 , e26752 (2011), arXiv v ersion a v ailable at [17] D. J. de Solla Price, Little Scienc e, Big Scienc e (Colum bia Univ ersity Press, New Y ork, 1963).
Original Paper
Loading high-quality paper...
Comments & Academic Discussion
Loading comments...
Leave a Comment