Emergence of functional and structural properties of the head direction system by optimization of recurrent neural networks
Recent work suggests goal-driven training of neural networks can be used to model neural activity in the brain. While response properties of neurons in artificial neural networks bear similarities to those in the brain, the network architectures are …
Authors: Christopher J. Cueva, Peter Y. Wang, Matthew Chin
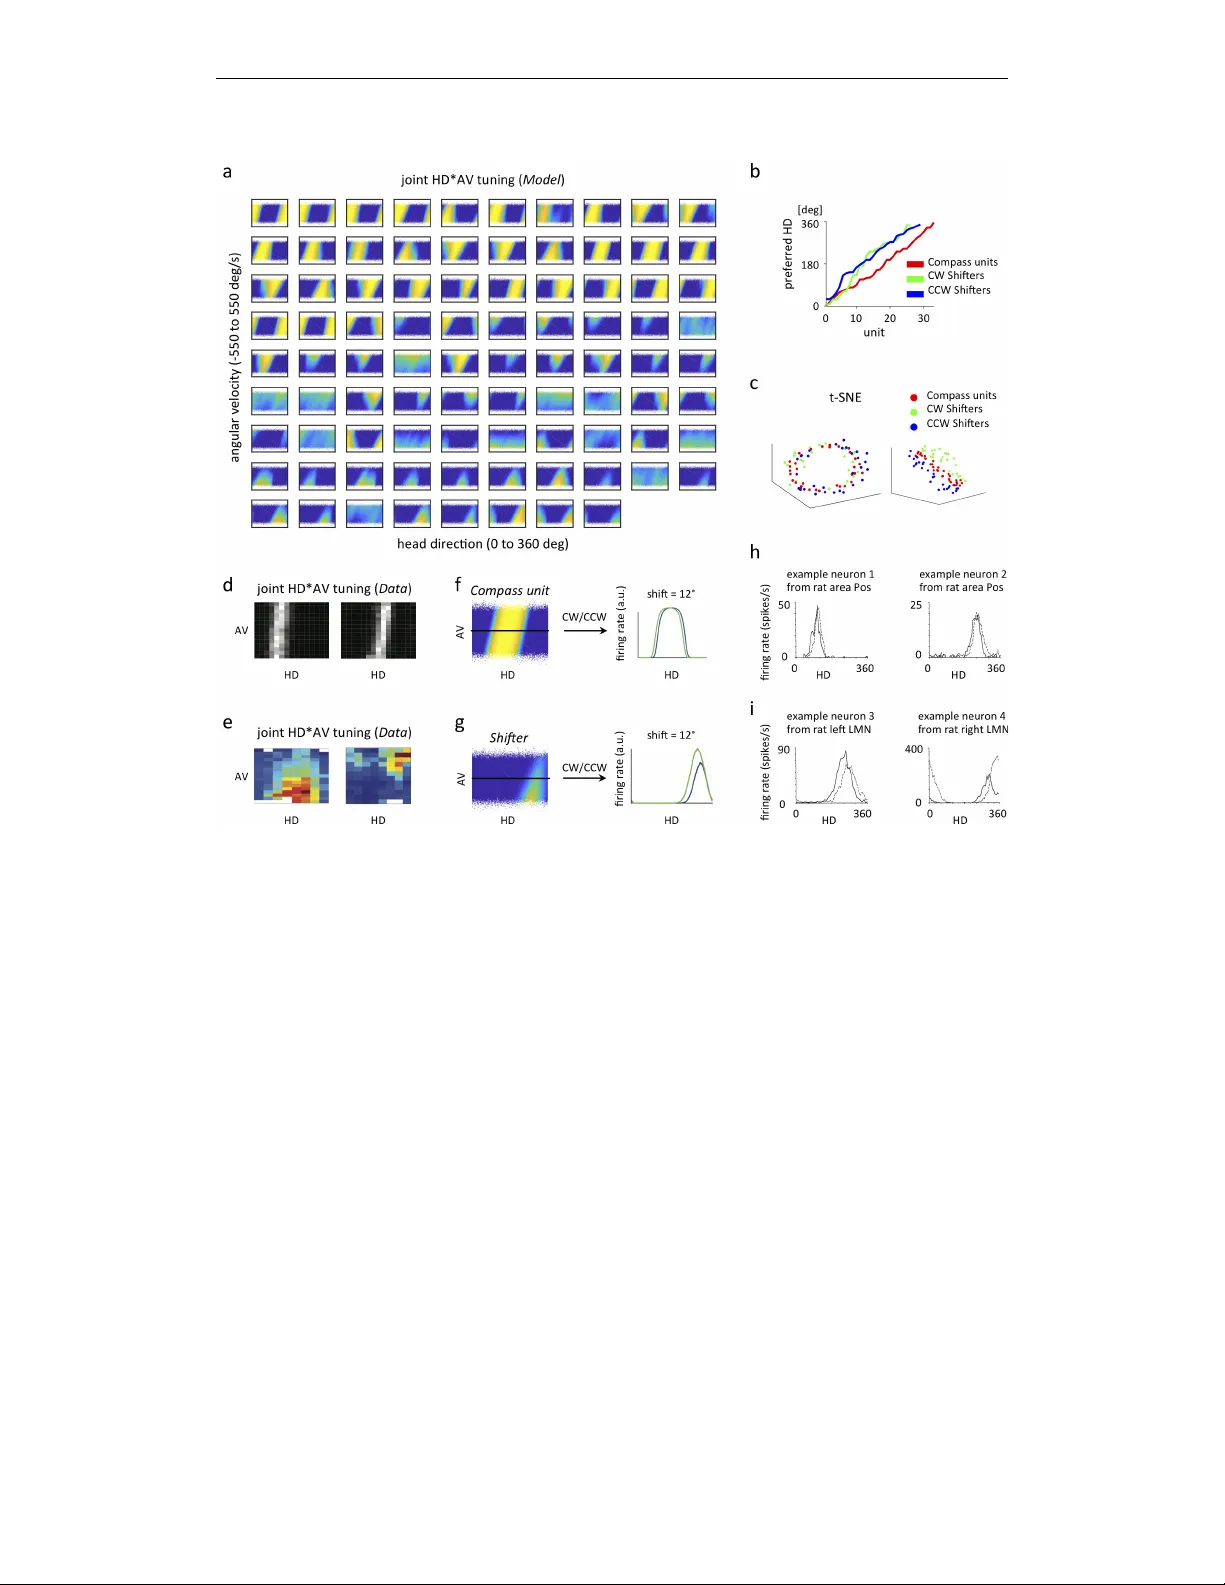
Published as a conference paper at ICLR 2020 E M E R G E N C E O F F U N C T I O N A L A N D S T R U C T U R A L P R O P E RT I E S O F T H E H E A D D I R E C T I O N S Y S T E M B Y O P - T I M I Z A T I O N O F R E C U R R E N T N E U R A L N E T W O R K S Christopher J. Cue va ∗† , Peter Y . W ang ∗ , Matthew Chin ∗ , Xue-Xin W ei † Columbia Univ ersity New Y ork, NY 10027, USA A B S T R A C T Recent work suggests goal-dri ven training of neural netw orks can be used to model neural acti vity in the brain. While response properties of neurons in artificial neural networks bear similarities to those in the brain, the network architectures are often constrained to be different. Here we ask if a neural network can recov er both neural representations and, if the architecture is unconstrained and optimized, the anatomical properties of neural circuits. W e demonstrate this in a system where the connectivity and the functional or ganization ha ve been characterized, namely , the head direction circuits of the rodent and fruit fly . W e trained recurrent neural networks (RNNs) to estimate head direction through inte gration of angular v elocity . W e found that the two distinct classes of neurons observed in the head direction system, the Compass neurons and the Shifter neurons, emer ged naturally in artificial neural networks as a result of training. Furthermore, connectivity analysis and in-silico neurophysiology re vealed structural and mechanistic similarities between artificial networks and the head direction system. Overall, our results show that optimization of RNNs in a goal-dri ven task can recapitulate the structure and function of biological circuits, suggesting that artificial neural networks can be used to study the brain at the lev el of both neural acti vity and anatomical organization. 1 I N T R O D U C T I O N Artificial neural netw orks hav e been increasingly used to study biological neural circuits. In particular , recent work in vision demonstrated that con volutional neural networks (CNNs) trained to perform visual object classification provide state-of-the-art models that match neural responses along various stages of visual processing (Y amins et al., 2014; Khaligh-Raza vi & Kriegeskorte, 2014; Y amins & DiCarlo, 2016; Cadieu et al., 2014; Güçlü & van Gerven, 2015; Kriegesk orte, 2015). Recurrent neural networks (RNNs) trained on cogniti v e tasks ha ve also been used to account for neural response characteristics in various domains (Zipser, 1991; Fetz, 1992; Moody et al., 1998; Mante et al., 2013; Sussillo et al., 2015; Song et al., 2016; Cuev a & W ei, 2018; Banino et al., 2018; Remington et al., 2018; W ang et al., 2018; Orhan & Ma, 2019; Y ang et al., 2019). While these results provide important insights on how information is processed in neural circuits, it is unclear whether artificial neural networks ha ve con v erged upon similar architectures as the brain to perform either visual or cognitive tasks. Answering this question requires understanding the functional, structural, and mechanistic properties of artificial neural networks and of rele vant neural circuits. W e address these challenges using the brain’ s internal compass - the head direction system, a system that has accumulated substantial amounts of functional and structural data over the past fe w decades in rodents and fruit flies (T aube et al., 1990a;b; T urner-Ev ans et al., 2017; Green et al., 2017; Seelig & Jayaraman, 2015; Stone et al., 2017; Lin et al., 2013; Fink elstein et al., 2015; W olff et al., 2015; Green & Maimon, 2018). W e trained RNNs to perform a simple angular velocity (A V) inte gration task (Etienne & Jef fery, 2004) and asked whether the anatomical and functional features that ha ve emerged as a result of stochastic gradient descent bear similarities to biological netw orks sculpted ∗ equal contribution † Correspondence: ccuev a@gmail.com, weixxpku@gmail.com 1 Published as a conference paper at ICLR 2020 by long e volutionary time. By lev eraging existing kno wledge of the biological head direction (HD) systems, we demonstrate that RNNs exhibit striking similarities in both structure and function. Our results suggest that goal-dri ven training of artificial neural netw orks provide a frame work to study neural systems at the lev el of both neural acti vity and anatomical organization. angular v elocit y head dir ec tion P r ot oc er ebr al br idge (PB) Ellipsoid body (EB) c d e f 50 2000 timestep 0 180 head direction [deg] target RNN output a head dir ec tion (HD ) tuning angular v elocit y ( A V ) tuning b angular v elocit y g initial dir ec tion + 0 120 HD 180 0 360 0 100 -100 AV HD 0 10 AV 0 600 -600 0 50 c en tr al c omple x in y br ain 180 0 360 [deg/s] [deg] c d spikes/second spikes/second neur on 1 neur on 2 neur on 3 neur on 4 360 Figure 1: Overvie w of head direction system in rodents, fruit flies, and the RNN model. a, c) tuning curve of an example head direction (HD) cell in rodents (a, adapted from T aube (1995)) and fruit flies (c, adapted from T urner -Evans et al. (2017)). b, d) T uning curve of an e xample angular velocity (A V) selecti ve cell in rodents (b, adapted from Sharp et al. (2001)) and fruit flies (d, adapted from T urner -Evans et al. (2017)). e) The brain structures in the fly central complex that are crucial for maintaining and updating heading direction, including the protocerebral bridge (PB) and the ellipsoid body (EB). f) The RNN model. All connections within the RNN are randomly initialized. g) After training, the output of the RNN accurately tracks the current head direction. 2 M O D E L 2 . 1 M O D E L S T RU C T U R E W e trained our networks to estimate the agent’ s current head direction by integrating angular velocity ov er time (Fig. 1f). Our network model consists of a set of recurrently connected units ( N = 100 ), which are initialized to be randomly connected, with no self-connections allowed during training. The dynamics of each unit in the network r i ( t ) is gov erned by the standard continuous-time RNN equation: τ dx i ( t ) dt = − x i ( t ) + X j W rec ij r j ( t ) + X k W in ik I k ( t ) + b i + ξ i ( t ) (1) for i = 1 , . . . , N . The firing rate of each unit, r i ( t ) , is related to its total input x i ( t ) through a rectified tanh nonlinearity , r i ( t ) = max(0 , tanh( x i ( t ))) . Every unit in the RNN receiv es input from all other units through the recurrent weight matrix W rec and also receiv es external input, I ( t ) , through the weight matrix W in . These weight matrices are randomly initialized so no structure is a priori introduced into the network. Each unit has an associated bias, b i which is learned and an associated noise term, ξ i ( t ) , sampled at ev ery timestep from a Gaussian with zero mean and constant variance. The network was simulated using the Euler method for T = 500 timesteps of duration τ / 10 ( τ is set to be 250ms throughout the paper). Let θ be the current head direction. Input to the RNN is composed of three terms: two inputs encode the initial head direction in the form of sin( θ 0 ) and cos( θ 0 ) , and a scalar input encodes both clockwise (CW , negativ e) and counterclockwise, (CCW , positive) angular v elocity at ev ery timestep. The RNN 2 Published as a conference paper at ICLR 2020 is connected to two linear readout neurons, y 1 ( t ) and y 2 ( t ) , which are trained to track current head direction in the form of sin( θ ) and cos( θ ) . The activities of y 1 ( t ) and y 2 ( t ) are giv en by: y j ( t ) = X i W out j i r i ( t ) (2) 2 . 2 I N P U T S T A T I S T I C S V elocity at every timestep (assumed to be 25 ms) is sampled from a zero-inflated Gaussian distrib ution (see Fig. 5). Momentum is incorporated for smooth mov ement trajectories, consistent with the observed animal beha vior in flies and rodents. More specifically , we updated the angular velocity as A V( t ) = σ X + momentum ∗ A V( t − 1 ), where X is a zero mean Gaussian random variable with standard deviation of one. In the Main condition, we set σ = 0 . 03 radians/timestep and the momentum to be 0.8, corresponding to a mean absolute A V of ∼ 100 deg/s. These parameters are set to roughly match the angular v elocity distrib ution of the rat and fly (Stackman & T aube, 1998; Sharp et al., 2001; Bender & Dickinson, 2006; Raudies & Hasselmo, 2012). In section 4, we manipulate the magnitude of A V by changing σ to see how the trained RNN may solv e the integration task dif ferently . 2 . 3 T R A I N I N G W e optimized the network parameters W rec , W in , b and W out to minimize the mean-squared error in equation (3) between the target head direction and the network outputs generated according to equation (2), plus a metabolic cost for large firing rates ( L 2 regularization on r ). E = X t,j ( y j ( t ) − y target j ( t )) 2 (3) Parameters were updated with the Hessian-free algorithm (Martens & Sutske ver, 2011). Similar results were also obtained using Adam (Kingma & Ba, 2015). 3 F U N C T I O N A L A N D S T RU C T U R A L P R O P E RT I E S E M E R G E D I N T H E N E T W O R K W e found that the trained network could accurately track the angular velocity (Fig. 1g). W e first examined the functional and structural properties of model units in the trained RNN and compared them to the experimental data from the head direction system in rodents and flies. 3 . 1 E M E R G E N C E O F H D C E L L S ( C O M PA S S U N I T S ) A N D H D × A V C E L L S ( S H I F T E R S ) Emergence of different classes of neurons with distinct tuning properties W e first plotted the neural acti vity of each unit as a function of HD and A V (Fig. 2a). This re vealed two distinct classes of units based on the strength of their HD and A V tuning (see Appendix Fig. 6a,b,c). Units with essentially zero activity are excluded from further analyses. The first class of neurons exhibited HD tuning with minimal A V tuning (Fig. 2f). The second class of neurons were tuned to both HD and A V and can be further subdi vided into two populations - one with high firing rate when animal performs CCW rotation (positi ve A V), the other f av oring CW rotation (negati ve A V) (CW tuned cell sho wn in Fig. 2g). Moreov er , the preferred head direction of each sub-population of neurons tile the complete angular space (Fig. 2b). Embedding the model units into 3D space using t-SNE rev eals a clear compass-like structure, with the three classes of units being separated (Fig. 2c). Mapping the functional architectur e of RNN to neuroph ysiology Neurons with HD tuning b ut not A V tuning ha ve been widely reported in rodents (T aube et al., 1990a; Blair & Sharp, 1995; Stackman & T aube, 1998), although the HD*A V tuning profiles of neurons are rarely shown (b ut see Lozano et al. (2017)). By re-analyzing the data from Peyrache et al. (2015), we find that neurons in the anterodorsal thalamic nucleus (ADN) of the rat brain are selecti vely tuned to HD but not A V (Fig. 2d, also see Lozano et al. (2017)), with HD*A V tuning profile similar to what our model predicts. Preliminary e vidence suggests that this might also be true for ellipsoid body (EB) compass neurons in the fruit fly HD system (Green et al., 2017; T urner -Evans et al., 2017). 3 Published as a conference paper at ICLR 2020 Figure 2: Emergence of dif ferent functional cell types in the trained RNN. a) Joint HD*A V tuning plots for indi vidual units in the RNN. Units are arranged by functional type (Compass, CCW Shifters, CW Shifters). The activity of each unit is sho wn as a function of head direction (x-axis) and angular velocity (y-axis). For each unit, A V ranges from -550 to 550 deg/s, and HD ranges from 0 to 360 deg. b) Preferred HD of each unit within each functional type. Approximately uniform tiling of preferred HD for each functional type of model neurons is observed. c) 3D embedding of model neurons using t-SNE, with the distance between two units defined as one minus their firing rate correlation, exhibits a compass-like structure from one vie w angle (left) and are segre gated according to A V in another view angle (right). Each dot represents one unit. d) Joint HD*A V tuning plots for two e xample HD neurons in the rat anterodorsal thalamic nucleus, or ADN (plotted based on data from Peyrache et al. (2015), downloaded from CRCNS website). White indicates high firing rate. e) Joint HD*A V tuning plots for two example neurons from the PB of of the fly central complex, adapted from Turner -Ev ans et al. (2017). Red indicates high firing rate. (f,g,h,i) Detailed tuning properties of model neurons match neural data. f) HD tuning curves for model Compass units exhibit shifted peaks at high CW (green) and CCW rotations (blue). g) HD tuning curves for model Shifters exhibit peak shift and g ain changes when comparing CW (green) and CCW (blue) rotations. h) HD tuning curv es for CW (solid) and CCW (dashed) conditions for tw o example neurons in the postsubiculum of rats, adapted from Stackman & T aube (1998). i) HD tuning curv es for CW (solid) and CCW (dashed) conditions for two example neurons in the lateral mammillary nuclei of rats, adapted from Stackman & T aube (1998). Neurons tuned to both HD and A V tuning hav e also been reported previously in rodents and fruit flies (Sharp et al., 2001; Stackman & T aube, 1998; Bassett & T aube, 2001), although the joint HD*A V tuning profiles of neurons ha ve only been documented anecdotally with a fe w cells (T urner-Ev ans et al. (2017)). In rodents, certain cells are also observed to display HD and A V tuning (Fig. 2e). In addition, in the fruit fly heading system, neurons on the two sides of the protocerebral bridge (PB) (Pfeiffer & Homber g, 2014) are also tuned to CW and CCW rotation, respecti vely , and tile the complete angular space, much like what has been observ ed in our trained netw ork (Green et al., 2017; 4 Published as a conference paper at ICLR 2020 T urner -Evans et al., 2017). These observations collectiv ely suggest that neurons that are HD but not A V selectiv e in our model can be tentati vely mapped to "Compass" units in the EB, and the tw o sub-populations of neurons tuned to both HD and A V map to "Shifter" neurons on the left PB and right PB, respectiv ely . W e will correspondingly refer to our model neurons as either ‘Compass’ units or ‘CW/CCW Shifters’ (Further justification of the terminology will be giv en in sections 3.2 & 3.3) T uning properties of model neurons match experimental data W e next sought to e xamine the tuning properties of both Compass units and Shifters of our network in greater detail. First, we observe that for both Compass units and Shifters, the HD tuning curve varies as a function of A V (see example Compass unit in Fig. 2f and example Shifter in Fig. 2g). Population summary statistics concerning the amount of tuning shift are shown in Appendix Fig. 7a. The preferred HD tuning is biased to wards a more CW angle at CW angular velocities, and vice versa for CCW angular v elocities. Consistent with this observation, the HD tuning curv es in rodents were also dependent upon A V (see example neurons in Fig. 2h,i) (Blair & Sharp, 1995; Stackman & T aube, 1998; T aube & Muller, 1998; Blair et al., 1997; 1998). Second, the A V tuning curves for the Shifters exhibit graded response profiles, consistent with the measured A V tuning curves in flies and rodents (see Fig. 1b,d). Across neurons, the angular velocity tuning curves sho w substantial diversity (see Appendix Fig. 6b), also consistent with experimental reports (T urner-Ev ans et al., 2017). In summary , the majority of units in the trained RNN could be mapped onto the biological head direction system in both general functional architecture and also in detailed tuning properties. Our model unifies a div erse set of experimental observations, suggesting that these neural response properties are the consequence of a network solving an angular integration task optimally . 3 . 2 C O N N E C T I V I T Y S T R U C T U R E O F T H E N E T W O R K 20 40 60 80 Unit (33 ring, 29 shiftpos, 26 shiftneg 10 20 30 40 50 60 70 80 Unit (33 ring, 29 shiftpos, 26 shiftneg Training epoch 415, 2000 trials, 1000 timesteps in simulation errormain = 0.0014384, normalized error overall = 0.57538% -1.5 -1 -0.5 0 0.5 1 1.5 Whh after removing 12 unresponsive and 0 weakly tuned units sorted by preferred integrated-angle !" #" P r ot oc er ebr al br idge Ellipsoid body angular v elocit y -180 -90 0 90 180 Preferred integrated-angle relative to shiftpos unit (degrees) -0.5 0 0.5 Mean connection strength (Whh) From 29 shiftpos units to 33 ring units Training epoch 415, 2000 trials, 1000 timesteps in simulation normalized error overall = 0.57538%, 10° bins slid by 1° $%&'!((")*+,(" $$-"./+012(" $-"./+012(" $%&'!((")*+,(" $$-"./+012(" $-"./+012(" 3" 45" 5" -180 -90 0 90 180 Preferred integrated-angle relative to ring unit (degrees) -0.5 0 0.5 Mean connection strength (Whh) From 33 ring units to 33 ring units Training epoch 415, 2000 trials, 1000 timesteps in simulation normalized error overall = 0.57538%, 10° bins slid by 1° $%&'!((")*+,(" $$-"./+012(" $-"./+012(" 4563" 563" 3" 3" 378" 4378" 3" 378" 4378" 3" 378" 4378" $%**19:;+,<" =+>121*91"+*"'21?1221@"/1!@"@+219:%*"A @1B C" 3" 3" 563" 4563" 563" 4563" w ould be interesting for future w ork to understand ho w such tuning di v ersity can f acilitate the angular 108 inte gration. 109 3.3 Structural pr operties of the netw ork 110 20 40 60 80 Unit (33 ring, 28 shiftpos, 24 shiftneg 10 20 30 40 50 60 70 80 Unit (33 ring, 28 shiftpos, 24 shiftneg Training epoch 415, 2000 trials, 1000 timesteps in simulation errormain = 0.0014384, normalized error overall = 0.57538% -1.5 -1 -0.5 0 0.5 1 1.5 Whh after removing 12 unresponsive and 3 weakly tuned units sorted by preferred integrated-angle !" # $ % # & ' ( ) # * % ++, %*-". & ( *% +, %*-". & ( *% !" # $ % # & ' ( ) # * % ++, %*-". & ( *% +, %*-". & ( *% /% 0% 1% 23% 3% -180 -90 0 90 180 Preferred integrated-angle relative to ring unit (degrees) -0.5 0 0.5 Mean connection strength (Whh) From 33 ring units to 33 ring units Training epoch 415, 2000 trials, 1000 timesteps in simulation normalized error overall = 0.57538%, 10° bins slid by 1° !" # $ % # & ' ( ) # * % ++, %*-". & ( *% +, %*-". & ( *% 23415% 3415% 15% 1% 16 7% 2167% -180 -90 0 90 180 Preferred integrated-angle relative to ring unit (degrees) -1 -0.5 0 Mean connection strength (Whh) From 33 ring units to 24 shiftneg units Training epoch 415, 2000 trials, 1000 timesteps in simulation normalized error overall = 0.57538%, 10° bins slid by 1° 267% 1% 23% -180 -90 0 90 180 Preferred integrated-angle relative to shiftneg unit (degrees) -0.5 0 0.5 Mean connection strength (Whh) From 24 shiftneg units to 33 ring units Training epoch 415, 2000 trials, 1000 timesteps in simulation normalized error overall = 0.57538%, 10° bins slid by 1° 1% 16 7% 2167% -180 -90 0 90 180 Preferred integrated-angle relative to shiftneg unit (degrees) -0.5 0 0.5 Mean connection strength (Whh) From 24 shiftneg units to 24 shiftneg units Training epoch 415, 2000 trials, 1000 timesteps in simulation normalized error overall = 0.57538%, 10° bins slid by 1° 1% 16 7% 2167% -180 -90 0 90 180 Preferred integrated-angle relative to ring unit (degrees) -0.5 0 0.5 Mean connection strength (Whh) From 33 ring units to 28 shiftpos units Training epoch 415, 2000 trials, 1000 timesteps in simulation normalized error overall = 0.57538%, 10° bins slid by 1° 1% 16 7% 2167% -180 -90 0 90 180 Preferred integrated-angle relative to shiftpos unit (degrees) -0.5 0 0.5 Mean connection strength (Whh) From 28 shiftpos units to 33 ring units Training epoch 415, 2000 trials, 1000 timesteps in simulation normalized error overall = 0.57538%, 10° bins slid by 1° 1% 16 7% 2167% -180 -90 0 90 180 Preferred integrated-angle relative to shiftpos unit (degrees) -0.5 0 0.5 Mean connection strength (Whh) From 28 shiftpos units to 28 shiftpos units Training epoch 415, 2000 trials, 1000 timesteps in simulation normalized error overall = 0.57538%, 10° bins slid by 1° 1% 16 7% 2167% -180 -90 0 90 180 Preferred integrated-angle relative to shiftneg unit (degrees) -1 -0.5 0 0.5 Mean connection strength (Whh) From 24 shiftneg units to 28 shiftpos units Training epoch 415, 2000 trials, 1000 timesteps in simulation normalized error overall = 0.57538%, 10° bins slid by 1° 1% 16 7% 2167% -180 -90 0 90 180 Preferred integrated-angle relative to shiftpos unit (degrees) -1 -0.5 0 0.5 Mean connection strength (Whh) From 28 shiftpos units to 24 shiftneg units Training epoch 415, 2000 trials, 1000 timesteps in simulation normalized error overall = 0.57538%, 10° bins slid by 1° 1% 16 7% 2167% Figure 4: Connecti vity of the trained netw ork are structured, and e xhibit similarity to the connecti vity in fly central comple x. a) the connecti vity of the netw ork trained with mid-speed. W e sort the neuron according to the functional classes, and further arrange them according to the preferred HD with each class. There is visible s tructural connecti vity within and across dif ferent cell types. b) mapping the connecti vity structure onto fly central comple x. Inserted panels represent the a v erage connecti vity (shading area for one s.d.) as a function of the dif ference between preferred HD for within and between dif ferent class of neurons. Netw ork with highly structured connecti vity ha v e been proposed to perform inte gration. It’ s sho wn 111 that these models with hand-crafted connecti vity can gi v e rise to the head direction tuning curv es [ 17 , 112 14 , 18 ]. Ho we v er , it is uncle ar whether less structured netw ork may also lead to rob ust angular 113 v elocity inte gration, and what connecti vity structure w ould achie v e best performance in inte gration 114 of inputs. 115 T o address these issues, we ana lyze the structural properties of the trained RNN. W e took adv antage 116 of di vision of the functional neural types in the trained netw ork, and e xamined the structure of the 117 connecti vity matrix with and across each types of cells. Ov erall, we found that the basic connecti vity 118 in the netw ork is highly structured albeit with v ariability , and is qualitati v ely consistent across the 119 dif ferent simulations with the same input statistics. Fig. 5 sho w the detailed connecti vity structure. 120 Belo w we highlight some features of the connecti vity in light of pre vious e xperimental and theoretical 121 w ork. 122 First of all, we found the HD neurons e xhibit local e xcitation and long-range inhibition. Second, 123 the connecti vity from the CW (or CCW) shifters to the ring neurons e xhibit an asymmetric pattern, 124 which e xcite the HD neurons which tuned to more CW (CCW) head direc tion. This is reminiscent of 125 the connecti vity pattern disco v ered in fly between the PB and the Ellipsoid Body , which has been 126 proposed to implement a shifting mechanism [ 18 ]. Ho we v er , our pattern dif fer from the pre vious 127 proposal in that, not only e xcitation, b ut there is also inhibition that’ s lagging in the direction of the 128 mo v ement. No w mention something about the P-EN2 neurons here. Furthermore, the connecti vity 129 between tw o sets of shifters also e xhibit a specific connecti vity structure. In the fly , this might be 130 implemented by 7 neurons of the PB. Ho we v er , in general, lateral connection in the PB as well 131 as within the EB are not well studied and documented so f ar . Based on our modeling results, we 132 speculate that systematic EM studies m ight re v eal much richer pattern of connecti vity compared to 133 the simple connecti vity structure which has been proposed/re v ealed pre viously . 134 5 -180 -90 0 90 180 Preferred integrated-angle relative to shiftneg unit (degrees) -0.5 0 0.5 Mean connection strength (Whh) From 26 shiftneg units to 33 ring units Training epoch 415, 2000 trials, 1000 timesteps in simulation normalized error overall = 0.57538%, 10° bins slid by 1° Figure 3: Connecti vity of the trained network is structured and exhibits similarities with the con- nectivity in the fly central comple x. a) Pixels represent connections from the units in each column to the units in each row . Excitatory connections are in red, and inhibitory connections are in blue. Units are first sorted by functional classes, and then are further sorted by their preferred HD within each class. The black box highlights recurrent connections to the Compass units from Compass units, from CCW Shifters, and from CW Shifters. b) Ensemble connecti vity from each functional cell type to the Compass units as highlighted in a), in relation to the architecture of the PB & EB in the fly central complex. Plots show the average connectivity (shaded area indicates one s.d.) as a function of the difference between the preferred HD of the cell and the Compass unit it is connecting to. Compass units connect strongly to units with similar HD tuning and inhibit units with dissimilar HD tuning. CCW Shifters connect strongly to Compass units with preferred head directions that are slightly CCW -shifted to its own, and CW Shifters connect strongly to Compass units with preferred head directions that are slightly CW -shifted to its o wn. Refer to Appendix Fig. 8b for the full set of ensemble connectivity between dif ferent classes. 5 Published as a conference paper at ICLR 2020 Previous experiments ha ve detailed a subset of connections between EB and PB neurons in the fruit fly . W e next analyzed the connectivity of Compass units and Shifters in the trained RNN to ask whether it recapitulates these connectivity patterns - a test which has never been done to our knowledge in an y system between artificial and biological neural networks (see Fig. 3). Compass units exhibit local excitation and long-range inhibition W e ordered Compass units, CCW Shifters, and CW Shifters by their preferred head direction tuning and plotted their connection strengths (Fig. 3a). This re vealed highly structured connectivity patterns within and between each class of units. W e first focused on the connections between indi vidual Compass units and observed a pattern of local e xcitation and global inhibition. Neurons that have similar preferred head directions are connected through positi ve weights and neurons whose preferred head directions are anti-phase are connected through negati ve weights (Fig. 3b). This pattern is consistent with the connecti vity patterns inferred in recent work based on detailed calcium imaging and optogenetic perturbation e xperiments (Kim et al., 2017), with one cav eat that the connecti vity pattern inferred in this study is based on the ef fecti ve connecti vity rather than anatomical connecti vity . W e conjecture that Compass units in the trained RNN serve to maintain a stable activity bump in the absence of inputs (see section 3.3), as proposed in previous theoretical models (T uring, 1952; Amari, 1977; Zhang, 1996). Asymmetric connectivity from Shifters to Compass units W e then analyzed the connecti vity between Compass units and Shifters. W e found that CW Shifters excite Compass units with preferred head directions that are clockwise to its o wn, and inhibit Compass units with preferred head directions counterclockwise to its o wn (Fig. 3b). The opposite pattern is observed for CCW Shifters. Such asymmetric connections from Shifters to the Compass units are consistent with the connecti vity pattern observed between the PB and the EB in the fruit fly central complex (Lin et al., 2013; Green et al., 2017; T urner -Evans et al., 2017), and also in agreement with previously proposed mechanisms of angular integration (Skaggs et al., 1995; Green et al., 2017; T urner -Evans et al., 2017; Zhang, 1996) (Fig. 3b). W e note that while the connecti vity between PB Shifters and EB Compass units are one-to-one (Lin et al., 2013; W olff et al., 2015; Green et al., 2017), the connecti vity profile in our model is broad, with a single CW Shifter e xciting multiple Compass units with preferred HDs that are clockwise to its own, and vice v ersa for CCW Shifters. In summary , the RNN de veloped several anatomical features that are consistent with structures reported or hypothesized in previous experimental results. A fe w nov el predictions are worth mentioning. First, in our model the connectivity between CW and CCW Shifters exhibit specific recurrent connecti vity (Fig. 8). Second, the connections from Shifters to Compass units e xhibit not only excitation in the direction of heading motion, but also inhibition that is lagging in the opposite direction. This inhibitory connection has not been observed in experiments yet but may facilitate the rotation of the neural bump in the Compass units during turning (W olff et al., 2015; Francon ville et al., 2018; Green et al., 2017; Green & Maimon, 2018). In the future, EM reconstructions together with functional imaging and optogenetics should allow direct tests of these predictions. 3 . 3 P R O B I N G T H E C O M P U TA T I O N I N T H E N E T W O R K W e hav e segregated neurons into Compass and Shifter populations according to their HD and A V tuning, and hav e sho wn that the y e xhibit dif ferent connecti vity patterns that are suggestiv e of different functions. Compass units putatively maintain the current heading direction and Shifter units putati vely rotate acti vity on the compass according to the direction of angular v elocity . T o substantiate these functional properties, we performed a series of perturbation experiments by lesioning specific subsets of connections. Perturbation while holding a constant head direction W e first lesioned connections when there is zero angular velocity input. Normally , the network maintains a stable b ump of acti vity within each class of neurons, i.e., Compass units, CW Shifters, and CCW Shifters (see Fig. 4a,b). W e first lesioned connections from Compass units to all units and found that the acti vity b umps in all three classes disappeared and were replaced by dif fuse activity in a large proportion of units. As a consequence, the network could not report an accurate estimate of its current heading direction. Furthermore, when the connections were restored, a bump formed 6 Published as a conference paper at ICLR 2020 Figure 4: Probing the functional role of different classes of model neurons. a-j) Perturbation analysis in the case of maintaining a constant HD. a) Under normal conditions, the RNN output matches the target output. b) Population activity for the trial shown in a), sorted by the preferred HD and the class of each unit, i.e., Compass units, CCW Shifters, CW Shifters. c-j) RNN output and population acti vity when a specific set of connections are set to zero during the period indicated by blue arro ws in i) and j). k-v) Perturbation analysis in the case of a shifting HD. For each manipulation, CW rotation and CCW rotation are tested, resulting in two trials. k-n) Normal case without any perturbation. o-v) RNN output and population activity when connections from CW Shifters (o-r) and CCW Shifters (s-v) are set to zero. Refer to the main text for the interpretation of the results. again without any e xternal input (Fig. 4d), suggesting the network can spontaneously generate an activity b ump through recurrent connections mediated by Compass units. W e then lesioned connections from CW Shifters to all units and found that all three bumps e xhibit a CCW rotation, and the read-out units correspondingly reported a CCW rotation of heading direction (Fig. 4e,f). Analogous results were obtained with lesions of CCW Shifters, which resulted in a CW drifting bump of acti vity (Fig. 4g,h). These results are consistent with the hypothesis that CW and CCW Shifters simultaneously activ ate the compass, with mutually cancelling signals, ev en when the heading direction is stationary . When connections are lesioned from both CW and CCW Shifters to all units, we observe that Compass units are still capable of holding a stable HD acti vity bump (Fig. 4i,j), consistent with the predictions that while CW/CCW Shifters are necessary for updating heading during motion, Compass units are responsible for maintaining heading. Perturbation while integrating constant angular velocity W e next lesioned connections during either constant CW or CCW angular velocity . Normally , the network can inte grate A V accurately (Fig. 4k-n). As expected, during CCW rotation, we observ e a corresponding rotation of the activity b ump in Compass units and in CCW Shifters, but CW Shifters display low le vels of acti vity . The conv erse is true during CW rotation. W e first lesioned connections from CW Shifters to all units, and found that it significantly impaired rotation in the CW direction, 7 Published as a conference paper at ICLR 2020 and also increased the rotation speed in the CCW direction. Lesioning of CCW Shifters to all units had the opposite effect, significantly impairing rotation in the CCW direction. These results are consistent with the hypothesis that CW/CCW Shifters are responsible for shifting the bump in a CW and CCW direction, respecti vely , and are consistent with the data in Green et al. (2017), which sho ws that inhibition of Shifter units in the PB of the fruit fly heading system impairs the integration of HD. Our lesion experiments further support the segre gation of units into modular components that function to separately maintain and update heading during angular motion. Figure 5: Representations in the trained RNN v ary as the input statistics change. a) The A V distribution used to train the RNN in the lo w angular velocity condition. b) A histogram of the slopes of the A V tuning curves for indi vidual units in the lo w A V condition. c) Heatmaps of the joint A V and HD tuning for each unit in the lo w A V condition. Units are arranged by functional type (Compass, CCW Shifters, CW Shifters). The activity of each unit is shown as a function of head direction (x-axis) and angular velocity (y-axis). d,e,f) Same con vention as a-c, b ut for the main condition (f is the same as Fig. 2a). g,h,i) Same con vention as a-c, b ut for the high angular velocity condition. 4 A D A P T A T I O N O F N E T W O R K P R O P E RT I E S T O I N P U T S T A T I S T I C S Optimal computation requires the system to adapt to the statistical structure of the inputs (Barlow, 1961; Attneav e, 1954). In order to understand ho w the statistical properties of the input trajectories affect ho w a network solv es the task, we trained RNNs to integrate inputs generated from lo w and high A V distributions. When networks are trained with small angular velocities, we observe the presence of more units with strong head direction tuning but minimal angular velocity tuning. Conv ersely , when networks are trained with large A V inputs, fewer Compass units emerge and more units become Shifter -like and exhibit both HD and A V tuning (Fig. 5c,f,i). W e sought to quantify the ov erall A V tuning under each velocity re gime by computing the slope of each neuron’ s A V tuning curve at its preferred HD angle. W e found that by increasing the magnitude of A V inputs, more neurons dev eloped strong A V tuning (Fig. 5b,e,h). In summary , with a slowly changing head direction trajectory , it is advantageous to allocate more resources to hold a stable activity bump, and this requires more Compass units. In contrast, with quickly changing inputs, the system must rapidly update the activity b ump to integrate head direction, requiring more Shifter units. This prediction may be rele vant for understanding the div ersity of the HD systems across different animal species, as different species exhibit different ov erall head turning behavior depending on the ecological demand (Stone et al., 2017; Seelig & Jayaraman, 2015; Heinze, 2017; Finkelstein et al., 2018). 8 Published as a conference paper at ICLR 2020 5 D I S C U S S I O N Previous work in the sensory systems hav e mainly focused on obtaining an optimal representation (Barlow, 1961; Laughlin, 1981; Linsker, 1988; Olshausen & Field, 1996; Simoncelli & Olshausen, 2001; Y amins et al., 2014; Khaligh-Razavi & Kriegeskorte, 2014) with feedforward models. Studies hav e also probed the importance of recurrent connections in understanding neural computation by training RNNs to perform tasks ( e.g ., Zipser (1991); Fetz (1992); Mante et al. (2013); Sussillo et al. (2015); Cuev a & W ei (2018)), but the relation of these trained networks to the anatomy and function of brain circuits are not mapped. Using the head direction system, we demonstrate that goal-dri ven optimization of recurrent neural networks can be used to understand the functional, structural and mechanistic properties of neural circuits. While we hav e mainly used perturbation analysis to rev eal the dynamics of the trained RNN, other methods could also be applied to analyze the network. For example, in Appendix Fig. 10, using fixed point analysis (Sussillo & Barak, 2013; Maheswaranathan et al., 2019), we found evidence consistent with attractor dynamics. Due to the limited amount of experimental data av ailable, comparisons regarding tuning properties and connectivity are lar gely qualitativ e. In the future, studies of the relev ant brain areas using Neuropixel probes (Jun et al., 2017) and calcium imaging (Denk et al., 1990) will pro vide a more in-depth characterization of the properties of HD circuits, and will facilitate a more quantitativ e comparison between model and experiment. In the current work, we did not impose any additional structural constraint on the RNNs during training, asides from prohibiting self-connections. W e hav e chosen to do so in order to see what structural properties would emerge as a consequence of optimizing the network to solv e the task. It is interesting to consider how additional structural constraints af fect the representation and computation in the trained RNNs. One possibility would to be to ha ve the input or output units only connect to a subset of the RNN units. Another possibility would be to freeze a subset of connections during training. Future work should systematically e xplore these issues. Recent work suggests it is possible to obtain tuning properties in RNNs with random connec- tions (Sederberg & Nemenman, 2019). W e found that training was necessary for the joint HD*A V tuning (see Appendix Fig. 9) to emerge. While Sederberg & Nemenman (2019) consider a simple binary classification task, our integration task is computationally more complicated. Stable HD tuning requires the system to keep track of HD by accurate integration of A V , and to stably store these values o ver time. This computation might be difficult for a random network to perform and, more generally , completely random networks may lead to different memory representations than the attractor geometry we observe in Fig. 10 (Cuev a et al., 2019). Our approach contrasts with pre vious network models for the HD system, which are based on hand- crafted connecti vity (Zhang, 1996; Skaggs et al., 1995; Xie et al., 2002; Green et al., 2017; Kim et al., 2017; Knierim & Zhang, 2012; Song & W ang, 2005; Kakaria & de Biv ort, 2017; Stone et al., 2017). Our modeling approach optimizes for task performance through stochastic gradient descent. W e found that dif ferent input statistics lead to different heading representations in an RNN, suggesting that the optimal architecture of a neural network v aries depending on the task demand - an insight that would be dif ficult to obtain using the traditional approach of hand-crafting network solutions. Although we have focused on a simple integration task, this frame work should be of general relev ance to other neural systems as well, providing a new approach to understand neural computation at multiple lev els. Our model may be used as a building block for AI systems to perform general na vigation (Pei et al., 2019). In order to ef fecti vely na vigate in complex en vironments, the agent would need to construct a cognitive map of the surrounding en vironment and update its own position during motion. A circuit that performs heading integration will likely be combined with another circuit to integrate the magnitude of motion (speed) to perform dead reck oning. T raining RNNs to perform more challenging navigation tasks such as these, along with multiple sources of inputs, i.e., vestibular , visual, auditory , will be useful for b uilding robust na vigational systems and for impro ving our understanding of the computational mechanisms of navigation in the brain (Cue va & W ei, 2018; Banino et al., 2018). 9 Published as a conference paper at ICLR 2020 A C K N OW L E D G M E N T S Research supported by NSF NeuroNex A ward DBI-1707398 and the Gatsby Charitable F oundation. W e would like to thank K enneth Kay for careful reading of an earlier version of the paper , and Rong Zhu for help preparing panel d in Figure 2. R E F E R E N C E S Shun-ichi Amari. Dynamics of pattern formation in lateral-inhibition type neural fields. Biological cybernetics , 27(2):77–87, 1977. Fred Attneav e. Some informational aspects of visual perception. Psyc hological re view , 61(3):183, 1954. Andrea Banino, Caswell Barry , Benigno Uria, Charles Blundell, T imothy Lillicrap, Piotr Miro wski, Alexander Pritzel, Martin J Chadwick, Thomas Degris, Joseph Modayil, et al. V ector-based navigation using grid-lik e representations in artificial agents. Natur e , 557(7705):429, 2018. Horace B Barlo w . Possible principles underlying the transformation of sensory messages. Sensory communication , pp. 217–234, 1961. Joshua P Bassett and Jef frey S T aube. Neural correlates for angular head velocity in the rat dorsal tegmental nucleus. J ournal of Neur oscience , 21(15):5740–5751, 2001. John A Bender and Michael H Dickinson. A comparison of visual and haltere-mediated feedback in the control of body saccades in drosophila melanogaster . Journal of Experimental Biology , 209 (23):4597–4606, 2006. Hugh T Blair and Patricia E Sharp. Anticipatory head direction signals in anterior thalamus : evidence for a thalamocortical circuit that integrates angular head motion to compute head direction. J ournal of Neur oscience , 15(9):6260–6270, 1995. Hugh T Blair , Brian W Lipscomb, and P atricia E Sharp. Anticipatory time interv als of head-direction cells in the anterior thalamus of the rat: implications for path integration in the head-direction circuit. Journal of neur ophysiology , 78(1):145–159, 1997. Hugh T Blair, Jeiwon Cho, and Patricia E Sharp. Role of the lateral mammillary nucleus in the rat head direction circuit: a combined single unit recording and lesion study . Neur on , 21(6): 1387–1397, 1998. Charles F Cadieu, Ha Hong, Daniel LK Y amins, Nicolas Pinto, Diego Ardila, Ethan A Solomon, Najib J Majaj, and James J DiCarlo. Deep neural networks riv al the representation of primate it cortex for core visual object recognition. PLoS computational biology , 10(12):e1003963, 2014. Christopher J Cuev a and Xue-Xin W ei. Emergence of grid-like representations by training recurrent neural networks to perform spatial localization. ICLR , 2018. Christopher J Cue va, Alex Saez, Encarni Marcos, Aldo Geno vesio, Mehrdad Jazayeri, Ranulfo Romo, C Daniel Salzman, Michael N Shadlen, and Stefano Fusi. Lo w dimensional dynamics for working memory and time encoding. bioRxiv doi: 10.1101/504936 , 2019. W infried Denk, James H Strickler , and W att W W ebb. T wo-photon laser scanning fluorescence microscopy . Science , 248(4951):73–76, 1990. Ariane S Etienne and Kathryn J Jeffery . Path integration in mammals. Hippocampus , 14(2):180–192, 2004. Eberhard Fetz. Are movement parameters recognizably coded in the activity of single neurons? Behavioral and Brain Sciences , 1992. Arseny Finkelstein, Dori Derdikman, Alon Rubin, Jakob N Foerster , Liora Las, and Nachum Ulanovsk y . Three-dimensional head-direction coding in the bat brain. Nature , 517(7533):159, 2015. 10 Published as a conference paper at ICLR 2020 Arseny Fink elstein, Nachum Ulanovsk y , Misha Tsodyks, and Johnatan Aljadeff. Optimal dynamic coding by mixed-dimensionality neurons in the head-direction system of bats. Nature communica- tions , 9(1):3590, 2018. Romain Francon ville, Celia Beron, and V i vek Jayaraman. Building a functional connectome of the drosophila central complex. Elife , 7:e37017, 2018. Jonathan Green and Gaby Maimon. Building a heading signal from anatomically defined neuron types in the drosophila central complex. Curr ent opinion in neurobiolo gy , 52:156–164, 2018. Jonathan Green, Atsuko Adachi, K unal K Shah, Jonathan D Hirokaw a, Pablo S Magani, and Gaby Maimon. A neural circuit architecture for angular inte gration in drosophila. Nature , 546(7656): 101, 2017. Umut Güçlü and Marcel AJ van Gerv en. Deep neural networks re veal a gradient in the complexity of neural representations across the v entral stream. Journal of Neur oscience , 35(27):10005–10014, 2015. Stanley Heinze. Unrav eling the neural basis of insect navigation. Curr ent opinion in insect science , 24:58–67, 2017. James J Jun, Nicholas A Steinmetz, Joshua H Siegle, Daniel J Denman, Marius Bauza, Brian Barbarits, Albert K Lee, Costas A Anastassiou, Alexandru Andrei, Ça ˘ gatay A ydın, et al. Fully integrated silicon probes for high-density recording of neural activity . Natur e , 551(7679):232, 2017. K yobi S Kakaria and Benjamin L de Biv ort. Ring attractor dynamics emerge from a spiking model of the entire protocerebral bridge. F r ontiers in behavioral neuroscience , 11:8, 2017. Seyed-Mahdi Khaligh-Raza vi and Nikolaus Kriegesk orte. Deep supervised, but not unsupervised, models may explain it cortical representation. PLoS computational biology , 10(11):e1003915, 2014. Sung Soo Kim, Hervé Rouault, Shaul Druckmann, and V iv ek Jayaraman. Ring attractor dynamics in the drosophila central brain. Science , 356(6340):849–853, 2017. D P Kingma and J L Ba. Adam: a method for stochastic optimization. International Conference on Learning Repr esentations , 2015. James J Knierim and Kechen Zhang. Attractor dynamics of spatially correlated neural activity in the limbic system. Annual r eview of neur oscience , 35:267–285, 2012. Nikolaus Kriegesk orte. Deep neural networks: a new frame work for modeling biological vision and brain information processing. Annual Review of V ision Science , 1:417–446, 2015. Simon Laughlin. A simple coding procedure enhances a neuron’ s information capacity . Zeitschrift für Naturforschung c , 36(9-10):910–912, 1981. Chih-Y ung Lin, Chao-Chun Chuang, Tzu-En Hua, Chun-Chao Chen, Barry J Dickson, Ralph J Greenspan, and Ann-Shyn Chiang. A comprehensiv e wiring diagram of the protocerebral bridge for visual information processing in the drosophila brain. Cell r eports , 3(5):1739–1753, 2013. Ralph Linsker . Self-organization in a perceptual network. Computer , 21(3):105–117, 1988. Y ave Roberto Lozano, Hector Page, Pierre-Yves Jacob, Eleonora Lomi, James Street, and Kate Jeffery . Retrosplenial and postsubicular head direction cells compared during visual landmark discrimination. Brain and neuroscience advances , 1:2398212817721859, 2017. Niru Maheswaranathan, Alex H W illiams, Matthew D Golub, Surya Ganguli, and David Sussillo. Univ ersality and indi viduality in neural dynamics across lar ge populations of recurrent networks. arXiv pr eprint arXiv:1907.08549 , 2019. V alerio Mante, David Sussillo, Krishna V Shenoy , and William T Newsome. Context-dependent computation by recurrent dynamics in prefrontal cortex. Natur e , 503(7474):78–84, 2013. 11 Published as a conference paper at ICLR 2020 James Martens and Ilya Sutske v er . Learning recurrent neural networks with hessian-free optimization. pp. 1033–1040, 2011. Sohie Lee Moody , Steven P . W ise, Giuseppe di Pellegrino, and David Zipser . A model that accounts for acti vity in primate frontal cortex during a delayed matching-to-sample task. Journal of Neur oscience , 18(1):399–410, 1998. ISSN 0270-6474. doi: 10.1523/JNEUR OSCI.18- 01- 00399. 1998. URL https://www.jneurosci.org/content/18/1/399 . Bruno A Olshausen and David J Field. Emergence of simple-cell recepti v e field properties by learning a sparse code for natural images. Natur e , 381(6583):607, 1996. A Emin Orhan and W ei Ji Ma. A di verse range of factors af fect the nature of neural representations underlying short-term memory . Nature neur oscience , 22(2):275, 2019. Jing Pei, Lei Deng, Sen Song, Mingguo Zhao, Y ouhui Zhang, Shuang W u, Guanrui W ang, Zhe Zou, Zhenzhi W u, W ei He, et al. T ow ards artificial general intelligence with hybrid tianjic chip architecture. Nature , 572(7767):106–111, 2019. Adrien Peyrache, Marie M Lacroix, Peter C Petersen, and György Buzsáki. Internally organized mechanisms of the head direction sense. Natur e neur oscience , 18(4):569, 2015. Keram Pfeiffer and Uwe Homber g. Organization and functional roles of the central comple x in the insect brain. Annual re view of entomology , 59:165–184, 2014. Florian Raudies and Michael E Hasselmo. Modeling boundary vector cell firing giv en optic flow as a cue. PLoS computational biology , 8(6):e1002553, 2012. Ev an D Remington, De vika Narain, Eghbal A Hosseini, and Mehrdad Jazayeri. Flexible sensorimotor computations through rapid reconfiguration of cortical dynamics. Neur on , 2018. Audrey J Sederberg and Ilya Nemenman. Randomly connected networks generate emergent selecti vity and predict decoding properties of large populations of neurons. arXiv pr eprint arXiv:1909.10116 , 2019. Johannes D Seelig and V iv ek Jayaraman. Neural dynamics for landmark orientation and angular path integration. Natur e , 521(7551):186, 2015. Patricia E Sharp, Hugh T Blair , and Jeiwon Cho. The anatomical and computational basis of the rat head-direction cell signal. T r ends in neur osciences , 24(5):289–294, 2001. Eero P Simoncelli and Bruno A Olshausen. Natural image statistics and neural representation. Annual r evie w of neur oscience , 24(1):1193–1216, 2001. W illiam E Skaggs, James J Knierim, Hemant S Kudrimoti, and Bruce L McNaughton. A model of the neural basis of the rat’ s sense of direction. In Advances in neural information pr ocessing systems , pp. 173–180, 1995. H Francis Song, Guangyu R Y ang, and Xiao-Jing W ang. Training excitatory-inhibitory recurrent neural networks for cogniti ve tasks: a simple and fle xible frame work. PLoS computational biology , 12(2):e1004792, 2016. Pengcheng Song and Xiao-Jing W ang. Angular path integration by moving “hill of activity”: a spiking neuron model without recurrent excitation of the head-direction system. Journal of Neur oscience , 25(4):1002–1014, 2005. Robert W Stackman and Jeffre y S T aube. Firing properties of rat lateral mammillary single units: head direction, head pitch, and angular head velocity . Journal of Neuroscience , 18(21):9020–9037, 1998. Thomas Stone, Barbara W ebb, Andrea Adden, Nicolai Ben W eddig, Anna Honkanen, Rachel T emplin, W illiam Wcislo, Luca Scimeca, Eric W arrant, and Stanley Heinze. An anatomically constrained model for path integration in the bee brain. Curr ent Biology , 27(20):3069–3085, 2017. David Sussillo and Omri Barak. Opening the black box: low-dimensional dynamics in high- dimensional recurrent neural networks. Neural computation , 25(3):626–649, 2013. 12 Published as a conference paper at ICLR 2020 David Sussillo, Mark M Churchland, Matthew T Kaufman, and Krishna V Shenoy . A neural network that finds a naturalistic solution for the production of muscle activity . Nature neur oscience , 18(7): 1025–1033, 2015. Jeffre y S T aube. Head direction cells recorded in the anterior thalamic nuclei of freely moving rats. Journal of Neur oscience , 15(1):70–86, 1995. Jef frey S T aube and Robert U Muller . Comparisons of head direction cell acti vity in the postsubiculum and anterior thalamus of freely moving rats. Hippocampus , 8(2):87–108, 1998. Jeffre y S T aube, Robert U Muller , and James B Ranck. Head-direction cells recorded from the post- subiculum in freely moving rats. i. description and quantitativ e analysis. Journal of Neur oscience , 10(2):420–435, 1990a. Jeffre y S T aube, Robert U Muller , and James B Ranck. Head-direction cells recorded from the postsubiculum in freely moving rats. ii. ef fects of environmental manipulations. Journal of Neur oscience , 10(2):436–447, 1990b. Alan T uring. The chemical basis of morphogenesis. Philosophical T ransactions of the Royal Society of London. Series B, Biological Sciences , 237(641):37–72, 1952. Daniel T urner-Ev ans, Stephanie W egener , Herve Rouault, Romain Francon ville, T anya W olff, Jo- hannes D Seelig, Shaul Druckmann, and V i vek Jayaraman. Angular velocity integration in a fly heading circuit. Elife , 6:e23496, 2017. Jing W ang, De vika Narain, Eghbal A Hosseini, and Mehrdad Jazayeri. Fle xible timing by temporal scaling of cortical responses. Natur e Neur oscience , 2018. T anya W olff, Nirmala A Iyer , and Gerald M Rubin. Neuroarchitecture and neuroanatomy of the drosophila central complex: A gal4-based dissection of protocerebral bridge neurons and circuits. Journal of Comparative Neur ology , 523(7):997–1037, 2015. Xiaohui Xie, Richard HR Hahnloser , and H Sebastian Seung. Double-ring network model of the head-direction system. Physical Review E , 66(4):041902, 2002. Daniel LK Y amins and James J DiCarlo. Using goal-driv en deep learning models to understand sensory cortex. Natur e neuroscience , 19(3):356–365, 2016. Daniel LK Y amins, Ha Hong, Charles F Cadieu, Ethan A Solomon, Darren Seibert, and James J DiCarlo. Performance-optimized hierarchical models predict neural responses in higher visual cortex. Pr oceedings of the National Academy of Sciences , 111(23):8619–8624, 2014. Guangyu Robert Y ang, Madhura R Joglekar , H Francis Song, W illiam T Ne wsome, and Xiao-Jing W ang. T ask representations in neural networks trained to perform many cogniti v e tasks. Natur e neur oscience , 22(2):297, 2019. Kechen Zhang. Representation of spatial orientation by the intrinsic dynamics of the head-direction cell ensemble: a theory . Journal of Neuroscience , 16(6):2112–2126, 1996. David Zipser . Recurrent network model of the neural mechanism of short-term activ e memory . Neural Computation , 1991. 13 Published as a conference paper at ICLR 2020 A A P P E N D I X Figure 6: T uning properties and unit classification. a) HD tuning curves for all 100 units in the RNN based on the Main condition. Units are arranged by functional type (Compass, CCW Shifters, CW Shifters). The activity of each unit is shown as a function of head direction. The 12 units at the bottom were not activ e, did not contribute to the network, and were not included in the analyses. All 88 units with some activity were included in the analyses. b) Similar to a), but for A V tuning curves. c) Classification into different populations using HD and A V tuning strength. 14 Published as a conference paper at ICLR 2020 a" b" Peak"shi*"in"HD"tuning"curves" when"comparing"CW"and"CCW"rota;ons"( deg )" Number"of"units" Gain"change"in"HD"tuning"" when"comparing"CW"and"CCW"rota;ons" Number"of"units" Popula;on"summary"of"tuning"shi*" Popula;on"summary"of"gain"change" -0.3 -0.2 -0.1 0 0.1 0.2 0.3 Gain change in head-direction-tuning curve max when angular velocity is positive - max when angular velocity is negative 0 5 10 15 20 25 30 Number of units Training epoch 415, 2000 trials, 1000 timesteps in simulation errormain = 0.0014384, normalized error overall = 0.57538% -0.2" 0.2" 0" 0" 30" -150 -100 -50 0 50 100 150 Preferred integrated angle when input angle is positive minus preferred integrated angle when input angle is negative (degrees) 0 1 2 3 4 5 6 7 Number of units Training epoch 415, 2000 trials, 1000 timesteps in simulation errormain = 0.0014384, normalized error overall = 0.57538% median/mean of 88 units that do not have constant activity = 14°/13.5568° 15" 0" 50" -50" 100" -100" 0" 6" 3" -0.3 -0.2 -0.1 0 0.1 0.2 0.3 Gain change in head-direction-tuning curve max when angular velocity is positive - max when angular velocity is negative 0 5 10 15 20 25 30 Number of units Training epoch 415, 2000 trials, 1000 timesteps in simulation errormain = 0.0014384, normalized error overall = 0.57538% 29 shiftpos units, median/mean = 0.121851.3/0.113 26 shiftneg units, median/mean = -0.136/-0.123 33 ring units, median/mean = 5.04e-05/0.000729 29"CCW"Shi*ers,"median"="0.122" 26"CW"Shi*ers,"median"="-0.136" 33"Compass"units,"median"="5.04e-5 " -0.3 -0.2 -0.1 0 0.1 0.2 0.3 Gain change in head-direction-tuning curve max when angular velocity is positive - max when angular velocity is negative 0 5 10 15 20 25 30 Number of units Training epoch 415, 2000 trials, 1000 timesteps in simulation errormain = 0.0014384, normalized error overall = 0.57538% 29 shiftpos units, median/mean = 0.121851.3/0.113 26 shiftneg units, median/mean = -0.136/-0.123 33 ring units, median/mean = 5.04e-05/0.000729 29"CCW"Shi*ers,"median"="14°" 26"CW"Shi*ers,"median"="13.5°" 33"Compass"units,"median"="14°" Figure 7: Population summary of tuning shift and gain change when comparing the CW and CCW rotations. a) Population summary of tuning shift. b) Population summary of change of the peak firing rate of HD tuning curves. -180 -90 0 90 180 Preferred integrated-angle relative to ring unit (degrees) -1 -0.5 0 Mean connection strength (Whh) From 33 ring units to 26 shiftneg units Training epoch 415, 2000 trials, 1000 timesteps in simulation normalized error overall = 0.57538%, 10° bins slid by 1° -180 -90 0 90 180 Preferred integrated-angle relative to ring unit (degrees) -0.5 0 0.5 Mean connection strength (Whh) From 33 ring units to 29 shiftpos units Training epoch 415, 2000 trials, 1000 timesteps in simulation normalized error overall = 0.57538%, 10° bins slid by 1° Compass'units' CCW'Shi/ers' CW'Shi/ers' Compass'units' CCW'Shi/ers' CW'Shi/ers' a' b' 0' -1' 1' -180 -90 0 90 180 Preferred integrated-angle relative to ring unit (degrees) -0.5 0 0.5 Mean connection strength (Whh) From 33 ring units to 33 ring units Training epoch 415, 2000 trials, 1000 timesteps in simulation normalized error overall = 0.57538%, 10° bins slid by 1° CCW'Shi/ers' CW'Shi/ers' -180' 180' 0' 0' 0.5' -0.5' -.5' 0' -1' 0' 0.5' -0.5' 0' 0.5' -0.5' 0' 0.5' -0.5' Connec:vity' Difference'in'preferred'head'direc:on'( deg )' -0.5' 0.5' 0' 0.5' -0.5' 0' 0' 0.5' -0.5' -180' 180' 0' 0' 0.5' -0.5' -180' 180' 0' Compass'units' 20 40 60 80 Unit (33 ring, 29 shiftpos, 26 shiftneg 10 20 30 40 50 60 70 80 Unit (33 ring, 29 shiftpos, 26 shiftneg Training epoch 415, 2000 trials, 1000 timesteps in simulation errormain = 0.0014384, normalized error overall = 0.57538% -1.5 -1 -0.5 0 0.5 1 1.5 Whh after removing 12 unresponsive and 0 weakly tuned units sorted by preferred integrated-angle -180 -90 0 90 180 Preferred integrated-angle relative to shiftpos unit (degrees) -0.5 0 0.5 Mean connection strength (Whh) From 29 shiftpos units to 33 ring units Training epoch 415, 2000 trials, 1000 timesteps in simulation normalized error overall = 0.57538%, 10° bins slid by 1° -180 -90 0 90 180 Preferred integrated-angle relative to shiftneg unit (degrees) -0.5 0 0.5 Mean connection strength (Whh) From 26 shiftneg units to 33 ring units Training epoch 415, 2000 trials, 1000 timesteps in simulation normalized error overall = 0.57538%, 10° bins slid by 1° -180 -90 0 90 180 Preferred integrated-angle relative to shiftpos unit (degrees) -0.5 0 0.5 Mean connection strength (Whh) From 29 shiftpos units to 29 shiftpos units Training epoch 415, 2000 trials, 1000 timesteps in simulation normalized error overall = 0.57538%, 10° bins slid by 1° -180 -90 0 90 180 Preferred integrated-angle relative to shiftneg unit (degrees) -1 -0.5 0 0.5 Mean connection strength (Whh) From 26 shiftneg units to 29 shiftpos units Training epoch 415, 2000 trials, 1000 timesteps in simulation normalized error overall = 0.57538%, 10° bins slid by 1° -180 -90 0 90 180 Preferred integrated-angle relative to shiftpos unit (degrees) -1 -0.5 0 0.5 Mean connection strength (Whh) From 29 shiftpos units to 26 shiftneg units Training epoch 415, 2000 trials, 1000 timesteps in simulation normalized error overall = 0.57538%, 10° bins slid by 1° -180 -90 0 90 180 Preferred integrated-angle relative to shiftneg unit (degrees) -0.5 0 0.5 Mean connection strength (Whh) From 26 shiftneg units to 26 shiftneg units Training epoch 415, 2000 trials, 1000 timesteps in simulation normalized error overall = 0.57538%, 10° bins slid by 1° Figure 8: Connectivity of the trained network. a) Pixels represent connections from the units in each column to the units in each row . Units are first sorted by functional classes, and then are further sorted by their preferred HD within each class. Excitatory connections are in red, and inhibitory connections are in blue. b) Ensemble connectivity from each functional cell type. Plots show the av erage connectivity (shaded area indicates one standard de viation) as a function of the difference in preferred HD. 15 Published as a conference paper at ICLR 2020 Figure 9: Joint HD × A V tuning of the initial, randomly connected network and the final trained network. a) Before training, the 100 units in the network do not hav e pronounced joint HD × A V tuning. The color scale is different for each unit (blue = minimum activity , yellow = maximum activity) to maximally highlight an y potential v ariation in the untrained netw ork. b) After training, the units are tuned to HD × A V , with the exception of 12 units (sho wn at the bottom) which are not activ e and do not influence the network. 16 Published as a conference paper at ICLR 2020 Figure 10: Attractor structure of the trained network. T o store angular information the neural activity settles into a compass-like geometry , with the position along the compass determined by the angle. a) The RNN is able to store angular information in the presence of noise. In this example sequence an initial input to the RNN specifies the initial heading direction as 270 degrees. The angular velocity input to the RNN is zero and so the network must continue to store this value of 270 degrees throughout the sequence. b) The acti vity of all units in the RNN are shown for 180 sequences, similar to a), after projecting onto the two principal components capturing most of the variance (91 % ). Each line shows the neural trajectory ov er time for a single sequence. For example, the neural acti vity that produces the output shown in a) is highlighted with black dots (1 dot for each timestep). The activity of the RNN is initialized to be the same for all sequences, i.e. x (0) in equation 1 is the same, so the activity for all sequences starts at the same location, namely , the origin of the figure. The activit y quickly settles into a compass-lik e geometry , with the location around the compass determined by the heading direction. (c,d) When the RNN is integrating a nonzero angular velocity it appears to transition between the attractors shown in b), i.e. the attractors found when the network was only storing a constant angle. Panel c) sho ws an example sequence with a nonzero angular velocity . In d) the neural trajectory from c) is superimposed ov er the attractor geometry from b). 17
Original Paper
Loading high-quality paper...
Comments & Academic Discussion
Loading comments...
Leave a Comment