Linear Latent Force Models using Gaussian Processes
Purely data driven approaches for machine learning present difficulties when data is scarce relative to the complexity of the model or when the model is forced to extrapolate. On the other hand, purely mechanistic approaches need to identify and spec…
Authors: Mauricio A. Alvarez, David Luengo, Neil D. Lawrence
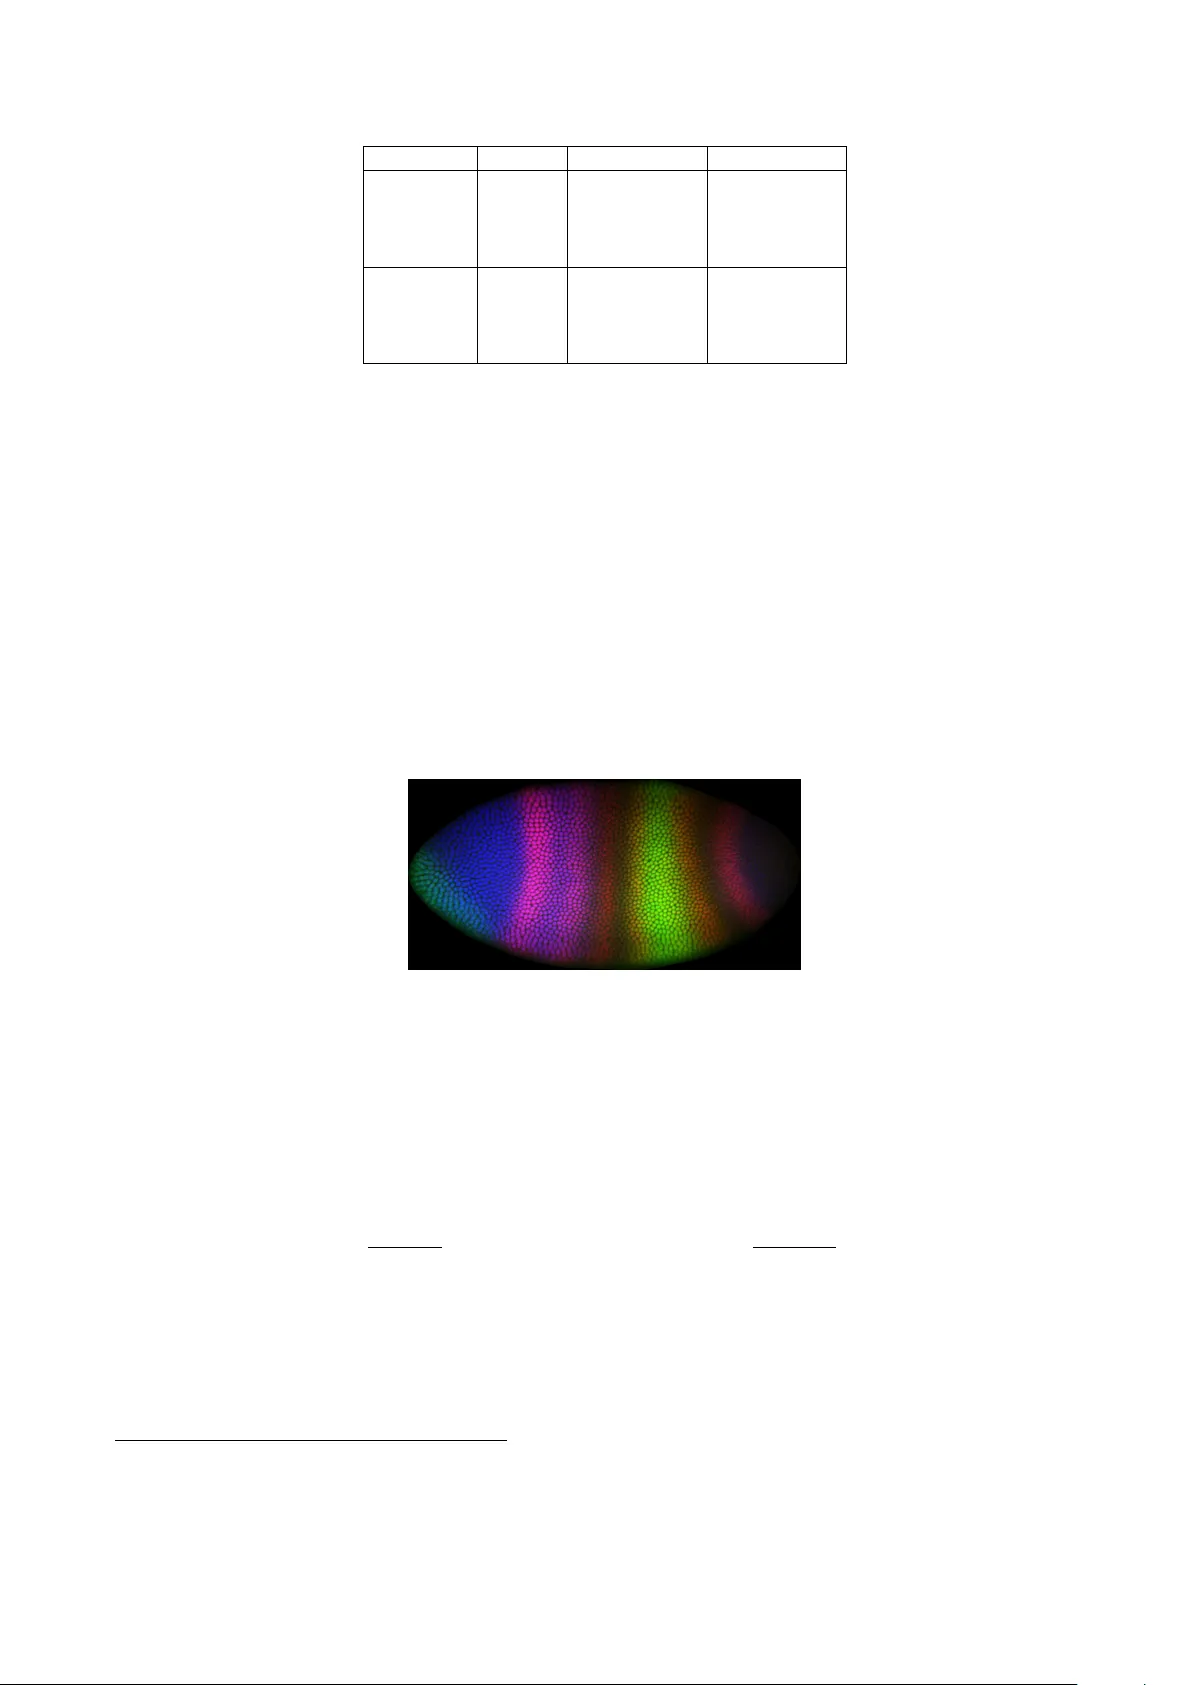
Linear Latent F orce Models using Gaussian Processes Mauricio A. ´ Alv arez † , ‡ , David Luengo ] , Neil D. Lawrence ?, ◦ † School of Computer Science, Univer sity of Manchester , Manchester , UK M13 9PL. ‡ F aculty of Engineering, Universidad T ecnol ´ ogica de P er eir a, Colombia, 660003. ] Dep. de la T eor ´ ıa de la Se ˜ nal y Comunicaciones, Universidad Carlos III de Madrid, 28911 Le gan ´ es, Espa ˜ na. ? School of Computer Science, Univer sity of Sheffield, Shef field, UK S1 4DP . ◦ The Sheffield Institute for T ranslational Neur oscience, Sheffield, UK S10 2HQ. Abstract Purely data driv en approaches for machine learning present dif ficulties when data is scarce relati v e to the comple xity of the model or when the model is forced to extrapolate. On the other hand, purely mechanistic approaches need to identify and specify all the interactions in the problem at hand (which may not be feasible) and still leav e the issue of ho w to parameterize the system. In this paper, we present a hybrid approach using Gaussian processes and differential equations to combine data driv en modelling with a physical model of the system. W e show ho w different, physically-inspired, kernel functions can be de v eloped through sensible, simple, mechanistic assumptions about the underlying system. The v ersatility of our approach is illustrated with three case studies from motion capture, computational biology and geostatistics. 1 Intr oduction T raditionally the main focus in machine learning has been model generation through a data driven paradigm . The usual ap- proach is to combine a data set with a (typically fairly flexible) class of models and, through judicious use of regularization, make predictions on previously unseen data. There are tw o key problems with purely data dri ven approaches. Firstly , if data is scarce relativ e to the complexity of the system we may be unable to make accurate predictions on test data. Secondly , if the model is forced to extrapolate, i.e. make predictions in a regime in which data has not yet been seen, performance can be poor . Purely mechanistic models , i.e . models which are inspired by the underlying ph ysical knowledge of the system, are com- mon in man y domains such as chemistry , systems biology , climate modelling and geophysical sciences, etc. They normally make use of a fairly well characterized physical process that underpins the system, often represented with a set of differ - ential equations. The purely mechanistic approach leav es us with a different set of problems to those from the data driv en approach. In particular, accurate description of a complex system through a mechanistic modelling paradigm may not be possible. Ev en if all the physical processes can be adequately described, the resulting model could become extremely com- plex. Identifying and specifying all the interactions might not be feasible, and we would still be faced with the problem of identifying the parameters of the system. Despite these problems, physically well characterized models retain a major advantage ov er purely data dri ven models. A mechanistic model can enable accurate prediction ev en in re gions where there is no a v ailable training data. For example, Pioneer space probes can enter different e xtra terrestrial orbits re gardless of the a v ailability of data for these orbits. Whilst data dri ven approaches do seem to a v oid mechanistic assumptions about the data, typically the regularization which is applied encodes some kind of physical intuition, such as the smoothness of the interpolant. This does reflect a weak underlying belief about the mechanism that generated the data. In this sense the data dri v en approach can be seen as weakly mechanistic whereas models based on more detailed mechanistic relationships could be seen as str ongly mechanistic . The observ ation that weak mechanistic assumptions underlie a data driv en model inspires our approach. W e suggest a hybrid system which in volv es a (typically ov erly simplistic) mechanistic model of the system. The k ey is to retain sufficient flexibility in our model to be able to fit the system ev en when our mechanistic assumptions are not rigorously fulfilled in practise. T o illustrate the frame work we will start by considering dynamical systems as latent v ariable models which incorporate ordinary differential equations. In this we follow the work of La wrence et al. (2007) and Gao et al. (2008) who encoded a first order differential equation in a Gaussian process (GP). Howe ver , their aim was to construct an accurate model of transcriptional regulation, whereas ours is to make use of the mechanistic model to incorporate salient characteristics of the data ( e.g. in a mechanical system inertia ) without necessarily associating the components of our mechanistic model with actual physical components of the system. For example, for a human motion capture dataset we de velop a mechanistic 1 model of motion capture that does not exactly replicate the physics of human mov ement, but nevertheless captures salient features of the movement. Having shown ho w linear dynamical systems can be incorporated in a GP , we finally show how partial differential equations can also be incorporated for modelling systems with multiple inputs. The paper is organized as follows. In section 2 we motiv ate the latent force model using as an example a latent variable model. Section 3 employs a first order latent force model to describe how the general framew ork can be used in practise. W e then proceed to show three case studies. In section 4 we use a latent force model based on a second order ordinary differential equation for characterizing motion capture datasets. Section 5 presents a latent force model for spatio-temporal domains applied to represent the dev elopment of Drosophila Melanogaster, and a latent force model inspired in a diffusion process to e xplain the behavior of pollutant metals in the Swiss Jura. Extensiv e related w ork is presented in section 6. Final conclusions are giv en in section 7. 2 Fr om latent variables to latent functions A key challenge in combining the mechanistic and data-driv en approaches is how to incorporate the model flexibility associated with the data-driv en approach within the mechanism. W e choose to do this through latent variables, more precisely latent functions: unobserved functions from the system. T o see how this is possible we first introduce some well known data dri ven models from a mechanistic latent-variable perspecti ve. Let us assume we wish to summarize a high dimensional data set with a reduced dimensional representation. For example, if our data consists of N points in a D dimensional space we might seek a linear relationship between the data, Y = [ y 1 , . . . , y D ] ∈ R N × D with y d ∈ R N × 1 , and a reduced dimensional representation, U = [ u 1 , . . . , u Q ] ∈ R N × Q with u q ∈ R N × 1 , where Q < D . From a probabilistic perspectiv e this in volves an assumption that we can represent the data as Y = UW > + E , (1) where E = [ e 1 , . . . , e D ] is a matrix-variate Gaussian noise: each column, e d ∈ R N × 1 ( 1 ≤ d ≤ D ), is a multi-variate Gaussian with zero mean and covariance Σ , this is, e d ∼ N ( 0 , Σ d ) . The usual approach, as undertaken in factor analysis and principal component analysis (PCA), to dealing with the unknown latent variables in this model is to integrate out U under a Gaussian prior and optimize with respect to W ∈ R D × Q (although it turns out that for a non-linear variant of the model it can be conv enient to do this the other way around, see for example Lawrence (2005)). If the data has a temporal nature, then the Gaussian prior in the latent space could express a relationship between the rows of U , u t n = Γu t n − 1 + η , where Γ is a transformation matrix, η is a Gaussian random noise and u t n is the n -th row of U , which we associate with time t n . This is known as the Kalman filter/smoother . Normally the times, t n , are taken to be equally spaced, but more generally we can consider a joint distribution for p ( U | t ) , for a vector of time inputs t = [ t 1 . . . t N ] > , which has the form of a Gaussian process, p ( U | t ) = Q Y q =1 N u q | 0 , K u q , u q , (2) where we have assumed zero mean and independence across the Q dimensions of the latent space. The GP makes explicit the fact that the latent variables are functions, { u q ( t ) } Q q =1 , and we have now described them with a process prior . The elements of the vector u q = [ u q ( t 1 ) , . . . , u q ( t N )] > , represents the values of the function for the q -th dimension at the times giv en by t . The matrix K u q , u q is the cov ariance function associated to u q ( t ) computed at the times given in t . Such a GP can be readily implemented. Giv en the covariance functions for { u q ( t ) } Q q =1 the implied cov ariance functions for { y d ( t ) } D d =1 are straightforward to deriv e. In T eh et al. (2005) this is known as a semi-parametric latent factor model (SLFM), although their main focus is not the temporal case. If the latent functions u q ( t ) share the same cov ariance, but are sampled independently , this is known as the multi-task Gaussian process prediction model (MTGP) (Bonilla et al., 2008) with a similar model introduced in Osborne et al. (2008). Historically the Kalman filter approach has been preferred, perhaps because of its linear computational complexity in N . Howe ver , recent advances in sparse approximations hav e made the general GP framew ork practical (see Qui ˜ nonero-Candela and Rasmussen (2005) for a revie w). So far the model described relies on the latent variables to provide the dynamic information. Our main contribution is to include a further dynamical system with a mechanistic inspiration. W e will make use of a mechanical analogy to introduce it. Consider the following physical interpretation of (1): the latent functions, u q ( t ) , are Q forces and we observe the displacement of D springs, y d ( t ) , to the forces. Then we can reinterpret (1) as the force balance equation, YB = US > + e E . Here we have assumed that the forces are acting, for example, through lev ers, so that we hav e a matrix of sensitivities, S ∈ R D × Q , and a diagonal matrix of spring constants, B ∈ R D × D , with elements { B d } D d =1 . The original model is recov ered by setting W > = S > B − 1 and ˜ e d ∼ N 0 , B > Σ d B . W ith appropriate choice of latent density and noise 2 model this physical model underlies the Kalman filter , PCA, independent component analysis and the multioutput Gaussian process models we mentioned above. The use of latent v ariables means that despite this strong physical constraint these models are still powerful enough to be applied to a range of real world data sets. W e will retain this flexibility by maintaining the latent v ariables at the heart of the system, but introduce a more realistic system by extending the underlying physical model. Let us assume that the springs are acting in parallel with dampers and that the system has mass, allo wing us to write, ¨ Y M + ˙ Y C + YB = US + b E , (3) where M and C are diagonal matrices of masses, { M d } D d =1 , and damping coef ficients, { C d } D d =1 , respecti v ely , ˙ Y is the first deriv ative of Y with respect to time (with entries { ˙ y d ( t n ) } for d = 1 , . . . D and n = 1 , . . . , N ), ¨ Y is the second deriv ative of Y with respect to time (with entries { ¨ y d ( t n ) } for d = 1 , . . . D and n = 1 , . . . , N ) and b E is once again a matrix-variate Gaussian noise. Equation (3) specifies a particular type of interaction between the outputs Y and the set of latent functions U , namely , that a weighted sum of the second deriv ati v e for y d ( t ) , ¨ y d ( t ) , the first deriv ative for y d ( t ) , ˙ y d ( t ) , and y d ( t ) is equal to the weighted sum of functions { u q ( t ) } Q q =1 plus a random noise. The second order mechanical system that this model describes will exhibit sev eral characteristics which are impossible to represent in the simpler latent variable model giv en by (1), such as inertia and resonance. This model is not only appropriate for data from mechanical systems. There are many analogous systems which can also be represented by second order differential equations, for example Resistor- Inductor-Capacitor circuits. A unifying characteristic for all these models is that the system is being forced by latent functions, { u q ( t ) } Q q =1 . Hence, we refer to them as latent force models (LFMs). This is our general framework: combine a physical system with a probabilistic prior ov er some latent v ariable. One analogy for our model comes through puppetry . A marionette is a representation of a human (or animal) controlled by a limited number of inputs through strings (or rods) attached to the character . In a puppet show these inputs are the unobserved latent functions. Human motion is a high dimensional data set. A skilled puppeteer with a well designed puppet can create a realistic representation of human mov ement through judicious use of the strings 3 Latent F or ce Models in Practise In the last section we provided a general description of the latent force model idea and commented ho w it compares to pre- vious models in the machine learning and statistics literature. In this section we specify the operational procedure to obtain the Gaussian process model associated to the outputs and dif ferent aspects in v olved in the inference process. First, we illus- trate the procedure using a first-order latent force model, for which we assume there are no masses associated to the outputs and the damper constants are equal to one. Then we specify the inference procedure, which in v olves maximization of the marginal likelihood for estimating hyperparameters. Next we generalize the operational procedure for latent force models of higher order and multidimensional inputs and finally we revie w some efficient approximations to reduce computational complexity . 3.1 First-order Latent F or ce Model Assume a simplified latent force model, for which only the first deriv ati ve of the outputs is included. This is a particular case of equation (3), with masses equal to zero and damper constants equal to one. W ith these assumptions, equation (3) can be written as ˙ Y + YB = US + b E . (4) Individual elements in equation (4) follo w d y d ( t ) d t + B d y d ( t ) = Q X q =1 S d,q u q ( t ) + ˆ e d ( t ) . (5) Giv en the parameters { B d } D d =1 and { S d,q } D,Q d =1 ,q =1 , the uncertainty in the outputs is given by the uncertainty coming from the set of functions { u q ( t ) } Q q =1 and the noise ˆ e d ( t ) . Strictly speaking, this equation belongs to a more general set of equations kno wn as stoc hastic dif fer ential equations (SDE) that are usually solv ed using special techniques from stochastic calculus (Øksendal, 2003). The representation used in equation (5) is more common in physics, where it receives the name of Lang evin equations (Reichl, 1998). For the simpler equation (5), the solution is found using standard calculus techniques and is giv en by y d ( t ) = y d ( t 0 ) e − B d t + Q X q =1 S d,q G d [ u q ]( t ) + G d [ ˆ e d ]( t ) , (6) 3 where y d ( t 0 ) correspond to the value of y d ( t ) for t = t 0 (or the initial condition) and G d is a linear integral operator that follows G d [ v ]( t ) = f d ( t, v ( t )) = Z t 0 e − B d ( t − τ ) v ( τ ) d τ . Our noise model G d [ ˆ e d ]( t ) has a particular form depending on the linear operator G d . For example, for the equation in (6) and assuming a white noise process prior for e d ( t ) , it can be shown that the process G d [ ˆ e d ]( t ) corresponds to the Ornstein- Uhlenbeck (OU) process (Reichl, 1998). In what follows, we will allow the noise model to be a more general process and we denote it by w d ( t ) . W ithout loss of generality , we also assume that the initial conditions { y d ( t 0 ) } D d =1 are zero, so that we can write again equation (6) as y d ( t ) = Q X q =1 S d,q G d [ u q ]( t ) + w d ( t ) . (7) W e assume that the latent functions { u q ( t ) } Q q =1 are independent and each of them follows a Gaussian process prior , this is, u q ( t ) ∼ G P (0 , k u q ,u q ( t, t 0 )) . 1 Due to the linearity of G d , { y d ( t ) } D d =1 correspond to a Gaussian process with cov ariances k y d ,y d 0 ( t, t 0 ) = co v[ y d ( t ) , y d 0 ( t 0 )] given by co v[ f d ( t ) , f d 0 ( t 0 )] + cov[ w d ( t ) , w d 0 ( t 0 )] δ d,d 0 , where δ d,d 0 corresponds to the Kronecker delta and co v[ f d ( t ) , f d 0 ( t 0 )] is given by Q X q =1 S d,q S d 0 ,q co v[ f q d ( t ) , f q d 0 ( t 0 )] , where we use f q d ( t ) as a shorthand for f d ( t, u q ( t )) . Furthermore, for the latent force model in equation (4), the cov ariance co v[ f q d ( t ) , f q d 0 ( t 0 )] is equal to Z t 0 e − B d ( t − τ ) Z t 0 0 e − B d 0 ( t 0 − τ 0 ) k u q ,u q ( τ , τ 0 ) d τ 0 d τ . (8) Notice from the equation abov e that the covariance between f q d ( t ) and f q d 0 ( t 0 ) depends on the cov ariance k u q ,u q ( τ , τ 0 ) . W e alternativ ely denote cov[ f d ( t ) , f d 0 ( t 0 )] as k f d ,f d 0 ( t, t 0 ) and cov[ f q d ( t ) , f q d 0 ( t 0 )] as k f q d ,f q d 0 ( t, t 0 ) . The form for the covariance k u q ,u q ( t, t 0 ) is such that we can solve both integrals in equation (8) and find an analytical expression for the cov ariance k f d ,f d 0 ( t, t 0 ) . In the rest of the paper , we assume the cov ariance for each latent force u q ( t ) follo ws the squared-exponential (SE) form (Rasmussen and W illiams, 2006) k u q ,u q ( t, t 0 ) = exp − ( t − t 0 ) 2 ` 2 q , (9) where ` q is known as the length-scale. W e can compute the cov ariance k f q d ,f q d 0 ( t, t 0 ) obtaining (Lawrence et al., 2007) k f q d ,f q d 0 ( t, t 0 ) = √ π ` q 2 [ h d 0 ,d ( t 0 , t ) + h d,d 0 ( t, t 0 )] , (10) where h d 0 ,d ( t 0 , t ) = exp( ν 2 q ,d 0 ) B d + B d 0 exp( − B d 0 t 0 ) ( exp( B d 0 t ) erf t 0 − t ` q − ν q ,d 0 + erf t ` q + ν q ,d 0 − exp( − B d t ) erf t 0 ` q − ν q ,d 0 + erf ( ν q ,d 0 ) ) , (11) where erf ( x ) is the real valued error function, erf ( x ) = 2 √ π R x 0 exp( − y 2 ) d y , and ν q ,d = ` q B d / 2 . The cov ariance function in equation (10) is nonstationary . For the stationary regime, the covariance function can be obtained by writing t 0 = t + τ and taking the limit as t tends to infinity . This is, k ST A T f q d ,f q d 0 ( τ ) = lim t →∞ k f q d ,f q d 0 ( t, t + τ ) . The stationary cov ariance could 1 W e can allow a mean prior dif ferent from zero. 4 also be obtained making use of the power spectral density for the stationary processes u q ( t ) , U q ( ω ) and the transfer function H d ( ω ) associated to h d ( t − s ) = e − B d ( t − s ) , the impulse response of the first order dynamical system. Then applying the con v olution property of the Fourier transform to obtain the power spectral density of f q d ( t ) , F q d ( ω ) , and finally using the W iener-Khinchin theor em to find the solution for f q d ( t ) (Shanmugan and Breipohl, 1988). As we will see in the following section, for computing the posterior distribution for { u q ( t ) } Q q =1 , we need the cross- cov ariance between the output y d ( t ) and the latent force u q ( t ) . Due to the independence between u q ( t ) and w d ( t ) , the cov ariance reduces to k f d ,u q ( t, t 0 ) , giv en by k f d ,u q ( t, t 0 ) = √ π ` q S d,q 2 exp( ν 2 q ,d ) exp( − B d ( t − t 0 )) erf t − t 0 ` q − ν q ,d + erf t 0 ` q + ν q ,d . (12) 3.2 Hyperparameter lear ning W e hav e implicitly marginalized out the effect of the latent forces using the Gaussian process prior for { u q ( t ) } Q q =1 and the cov ariance for the outputs after marginalization is given by k y d ,y d 0 ( t, t 0 ) . Given a set of inputs t and the parameters of the cov ariance function, 2 θ = ( { B d } D d =1 , { S d,q } D,Q d =1 ,q =1 , { ` q } Q q =1 ) , the marginal lik elihood for the outputs can be written as p ( y | t , θ ) = N ( y | 0 , K f , f + Σ ) , (13) where y = vec Y , 3 K f , f ∈ R N D × N D with each element giv en by cov[ f d ( t n ) , f d 0 ( t 0 n 0 )] for n = 1 , . . . , N and n 0 = 1 , . . . , N and Σ represents the cov ariance associated with the independent processes w d ( t ) . In general, the vector of parameters θ is unknown, so we estimate it by maximizing the mar ginal likelihood. For clarity , we assumed that all outputs are ev aluated at the same set of inputs t . Howe ver , due to the flexibility provided by the Gaussian process formulation, each output can hav e associated a specific set of inputs, this is t d = [ t d 1 , . . . , t d N d ] . Prediction for a set of input test t ∗ is done using standard Gaussian process regression techniques. The predictiv e distribution is giv en by p ( y ∗ | y , t , θ ) = N ( y ∗ | µ ∗ , K y ∗ , y ∗ ) , (14) with µ ∗ = K f ∗ , f ( K f , f + Σ ) − 1 y , K y ∗ , y ∗ = K f ∗ , f ∗ − K f ∗ , f ( K f , f + Σ ) − 1 K > f ∗ , f + Σ ∗ , where we hav e used K f ∗ , f ∗ to represent the ev aluation of K f , f at the input set t ∗ . The same meaning is giv en to the cov ariance matrix K f ∗ , f . As part of the inference process, we are also interested in the posterior distribution for the set of latent forces, p ( u | y , t , θ ) = N ( u | µ u | y , K u | y ) , (15) with µ u | y = K > f , u ( K f , f + Σ ) − 1 y , K u | y = K u , u − K > f , u ( K f , f + Σ ) − 1 K f , u , where u = vec U , K u , u is a block-diagonal matrix with blocks gi v en by K u q , u q . In turn, the elements of K u q , u q are gi ven by k u q ,u q ( t, t 0 ) in equation (9), for { t n } N n =1 . Also K f , u is a matrix with blocks K f d , u q , where K f d , u q has entries given by k f d ,u q ( t, t 0 ) in equation (12). 3.3 Higher -order Latent For ce Models In general, a latent force model of order M can be described by the follo wing equation M X m =0 D m [ Y ] A m = US > + b E , (16) 2 Also known as hyperparameters. 3 x = vec X is the vectorization operator that transforms the matrix X into a vector x . The vector is obtained by stacking the columns of the matrix. 5 where D m is a linear differential operator such that D m [ Y ] is a matrix with elements gi ven by D m y d ( t ) = d m y d ( t ) d m t and A m is a diagonal matrix with elements A m,d that weights the contribution of D m y d . W e follow the same procedure described in section 3.1 for the model in equation (16) with M = 1 . Each element in expression (16) can be written as D M 0 y d = M X m =0 A m,d D m y d ( t ) = Q X q =1 S d,q u q ( t ) + ˆ e d ( t ) , (17) where we have introduced a new operator D M 0 that is equiv alent to apply the weighted sum of operators D m . For a homogeneous differential equation in (17), this is u q ( t ) = 0 for q = 1 , . . . , Q and e d ( t ) = 0 , and a particular set of initial conditions {D m y d ( t 0 ) } M − 1 m =0 , it is possible to find a linear integral operator G d associated to D M 0 that can be used to solve the non-homogeneous differential equation. The linear integral operator is defined as G d [ v ]( t ) = f d ( t, v ( t )) = Z T G d ( t, τ ) v ( τ ) d τ , (18) where G d ( t, s ) is kno wn as the Green’ s function associated to the differential operator D M 0 , v ( t ) is the input function for the non-homogeneous dif ferential equation and T is the input domain. The particular relation between the differential operator and the Green’ s function is giv en by D M 0 [ G d ( t, s )] = δ ( t − s ) , (19) with s fixed, G d ( t, s ) a fundamental solution that satisfies the initial conditions and δ ( t − s ) the Dirac delta 4 function (Grif fel, 2002). Strictly speaking, the differential operator in equation (19) is the adjoint for the differential operator appearing in equation (17). For a more rigorous introduction to Green’ s functions applied to differential equations, the interested reader is referred to Roach (1982). In the signal processing and control theory literature, the Green’ s function is known as the impulse response of the system. Follo wing the general latent force model frame work, we write the outputs as y d ( t ) = Q X q =1 S d,q G d [ u q ]( t ) + w d ( t ) , (20) where w d ( t ) is again an independent process associated to each output. W e assume once more that the latent forces fol- low independent Gaussian process priors with zero mean and covariance k u q ,u q ( t, t 0 ) . The cov ariance for the outputs k y d ,y d 0 ( t, t 0 ) is given by k f d ,f d 0 ( t, t 0 ) + k w d ,w d 0 ( t, t 0 ) δ d,d 0 , with k f d ,f d 0 ( t, t 0 ) equal to Q X q =1 S d,q S d 0 ,q k f q d ,f q d 0 ( t, t 0 ) , (21) and k f q d ,f q d 0 ( t, t 0 ) following Z T Z T 0 G d ( t − τ ) G d 0 ( t 0 − τ 0 ) k u q ,u q ( τ , τ 0 )d τ 0 d τ . (22) Learning and inference for the higher-order latent force model is done as e xplained in subsection 3.2. The Green’ s function is described by a parameter vector ψ d and with the length-scales { ` q } Q q =1 describing the latent GPs, the vector of hyper- parameters is giv en by θ = {{ ψ d } D d =1 , { S d,q } D,Q d =1 ,q =1 , { ` q } Q q =1 } . The parameter vector θ is estimated by maximizing the logarithm of the mar ginal likelihood in equation (13), where the elements of the matrix K f , f are computed using e xpression (21) with k f q d ,f q d 0 ( t, t 0 ) giv en by (22). For prediction we use expression (14) and the posterior distribution is found using expression (15), where the elements of the matrix K f , u , k f d ,u q ( t, t 0 ) = k f q d ,u q ( t, t 0 ) , are computed using S d,q Z T G d ( t − τ ) k u q ,u q ( τ , t 0 )d τ . (23) In section 4, we present in detail a second order latent force model and show its application in the description of motion capture data. 4 W e have used the same notation for the Kroneck er delta and the Dirac delta. The particular meaning should be understood from the context. 6 3.4 Multidimensional inputs In the sections abov e we have introduced latent force models for which the input variable is one-dimensional. For higher- dimensional inputs, x ∈ R p , we can use linear partial differential equations to establish the dependence relationships between the latent forces and the outputs. The initial conditions turn into boundary conditions, specified by a set of functions that are linear combinations of y d ( x ) and its lower deriv ati ves, ev aluated at a set of specific points of the input space. Inference and learning is done in a similar way to the one-input dimensional latent force model. Once the Green’ s function associated to the linear partial differential operator has been established, we employ similar equations to (22) and (23) to compute k f d ,f 0 d ( x , x 0 ) and k f d ,u q ( x , x 0 ) and the hyperparameters appearing in the covariance function are estimated by maximizing the marginal likelihood. In section 5, we will present examples of latent force models with spatio-temporal inputs and a basic cov ariance with higher -dimensional inputs. 3.5 Efficient approximations Learning the parameter vector θ through the maximization of expression (13) in volves the inv ersion of the matrix K f , f + Σ , in v ersion that scales as O ( D 3 N 3 ) . For the single output case, this is D = 1 , different efficient approximations have been introduced in the machine learning literature to reduce computational comple xity including Csat ´ o and Opper (2001); See ger et al. (2003); Qui ˜ nonero-Candela and Rasmussen (2005); Snelson and Ghahramani (2006); Rasmussen and W illiams (2006); T itsias (2009). Recently , ´ Alvarez and Lawrence (2009) introduced an efficient approximation for the case D > 1 , which exploits the conditional independencies in equation (18): assuming that only a few number K < N of values of v ( t ) are known, then the set of outputs f d ( t, v ( t )) are uniquely determined. The approximation obtained shared characteristics with the Partially Independent T raining Conditional (PITC) approximation introduced in Qui ˜ nonero-Candela and Rasmussen (2005) and the authors of ´ Alvarez and Lawrence (2009) refer to the approximation as the PITC approximation for multiple- outputs. The set of values { v ( t k ) } K k =1 are known as inducing v ariables, and the corresponding set of inputs, inducing inputs. This terminology has been used before for the case in which D = 1 . A dif ferent type of approximation w as presented in ´ Alvarez et al. (2010) based on v ariational methods. It is a generalization of T itsias (2009) for multiple-output Gaussian processes. The approximation establishes a lower bound on the marginal likelihood and reduce computational complexity to O ( D N K 2 ) . The authors call this approximation Deterministic T raining Conditional V ariational (DTCV AR) approximation for multiple-output GP regression, borrowing ideas from Qui ˜ nonero- Candela and Rasmussen (2005) and T itsias (2009). 4 Second Order Dynamical System In Section 1 we introduced the analogy of a marionette’ s motion being controlled by a reduced number of forces. Human motion capture data consists of a skeleton and multiv ariate time courses of angles which summarize the motion. This motion can be modelled with a set of second order differential equations which, due to variations in the centers of mass induced by the movement, are non-linear . The simplification we consider for the latent force model is to linearize these differential equations, resulting in the following second order system, M d d 2 y d ( t ) d t 2 + C d d y d ( t ) d t + B d y d ( t ) = Q X q =1 S d,q u q ( t ) + ˆ e d ( t ) . Whilst the above equation is not the correct physical model for our system, it will still be helpful when extrapolating predictions across dif ferent motions, as we shall see in the next section. Note also that, although similar to (5), the dynamic behavior of this system is much richer than that of the first order system, since it can exhibit inertia and resonance. In what follows, we will assume without loss of generality that the masses are equal to one. For the motion capture data y d ( t ) corresponds to a giv en observed angle over time, and its deriv atives represent angular velocity and acceleration. The system is summarized by the undamped natural frequency , ω 0 d = √ B d , and the damping ratio, ζ d = 1 2 C d / √ B d . Systems with a damping ratio greater than one are said to be ov erdamped, whereas underdamped systems exhibit resonance and have a damping ratio less than one. For critically damped systems ζ d = 1 , and finally , for undamped systems (i.e. no friction) ζ d = 0 . Ignoring the initial conditions, the solution of the second order dif ferential equation is giv en by the integral operator of equation (18), with Green’ s function G d ( t, s ) = 1 ω d exp( − α d ( t − s )) sin( ω d ( t − s )) , (24) where ω d = p 4 B d − C 2 d / 2 and α d = C d / 2 . 7 According to the general framew ork described in section 3.2, the cov ariance function between the outputs is obtained by solving expression (22), where k u q ,u q ( t, t 0 ) follo ws the SE form in equation (9). Solution for k f q d ,f q d 0 ( t, t 0 ) is then giv en by ( ´ Alvarez et al., 2009) K 0 h q ( e γ d 0 , γ d , t, t 0 ) + h q ( γ d , e γ d 0 , t 0 , t ) + h q ( γ d 0 , e γ d , t, t 0 ) + h q ( e γ d , γ d 0 , t 0 , t ) − h q ( e γ d 0 , e γ d , t, t 0 ) − h q ( e γ d , e γ d 0 , t 0 , t ) − h q ( γ d 0 , γ d , t, t 0 ) − h q ( γ d , γ d 0 , t 0 , t ) where K 0 = ` q √ π / 8 ω d ω d 0 , γ d = α d + j ω d and e γ d = α d − j ω d and the functions h q ( e γ d 0 , γ d , t, t 0 ) follow h q ( γ d 0 , γ d , t, t 0 ) = Υ q ( γ d 0 , t 0 , t ) − e − γ d t Υ q ( γ d 0 , t 0 , 0) γ d + γ d 0 , with Υ q ( γ d 0 , t, t 0 ) = 2 e ` 2 q γ 2 d 0 4 e − γ d 0 ( t − t 0 ) − e − ( t − t 0 ) 2 ` 2 q w ( j z d 0 ,q ( t )) − e − ( t 0 ) 2 ` 2 q e ( − γ d 0 t ) w ( − j z d 0 ,q (0)) , (25) and z d 0 ,q ( t ) = ( t − t 0 ) /` q − ( ` q γ d 0 ) / 2 . Note that z d 0 ,q ( t ) ∈ C , and w ( j z ) in (25), for z ∈ C , denotes Faddee v a’ s function w ( j z ) = exp( z 2 ) erfc ( z ) , where erfc ( z ) is the complex version of the complementary error function, erfc ( z ) = 1 − erf ( z ) = 2 √ π R ∞ z exp( − v 2 ) d v . Faddee v a’ s function is usually considered the comple x equi v alent of the error function, since | w ( j z ) | is bounded whenev er the imaginary part of j z is greater or equal than zero, and is the key to achieving a good numerical stability when computing (25) and its gradients. Similarly , the cross-cov ariance between latent functions and outputs in equation (23) is gi v en by k f q d ,u q ( t, t 0 ) = ` q S d,q √ π j 4 ω d [Υ q ( e γ d , t, t 0 ) − Υ q ( γ d , t, t 0 )] , Motion Capture data Our motion capture data set is from the CMU motion capture data base. 5 W e considered tw o dif ferent types of movements: golf-swing and walking. For golf-swing we consider subject 64 motions 1, 2, 3 and 4, and for walking we consider subject 35 motions 2 and 3; subject 10 motion 4; subject 12 motions 1, 2 and 3; subject 16, motions 15 and 21; subject 7 motions 1 and 2, and subject 8 motions 1 and 2. Subsequently , we will refer to the pair subject and motion by the notation X ( Y ) , where X refers to the subject and Y to the particular motion. The data was down-sampled by 4. 6 Although each mo vement is described by time courses of 62 angles, we selected only the outputs whose signal-to-noise ratio was over 20 dB as explained in appendix A, ending up with 50 outputs for the golf-swing e xample and 33 outputs for the walking e xample. W e were interested in training on a subset of motions for each movement and testing on a different subset of motions for the same movement, to assess the model’ s ability to extrapolate. For testing, we condition on three angles associated to the root nodes and also on the first fiv e and the last fiv e output points of each other output. For the golf-swing, we use lea ve-one out cross-v alidation, in which one of the 64( Y ) movements is left aside (with Y = 1 , 2 , 3 or 4 ) for testing, while we use the other three for training. For the walking example, we train using motions 35(2) , 10(4) , 12(1) and 16(15) and v alidate over all the other motions (8 in total). W e use the abov e setup to train a LFM model with Q = 2 . W e compare our model against MTGP and SLFM, also with Q = 2 . For these three models, we use the DTCV AR efficient approximation with K = 30 and fixed inducing-points placed equally spaced in the input interv al. W e also considered a regression model that directly predicts the angles of the body gi ven the orientation of three root nodes using standard independent GPs with SE co variance functions. Results for all methods are summarized in T able 1 in terms of root-mean-square error (RMSE) and percentage of e xplained v ariance (R 2 ). In the table, the measure shown is the mean of the measure in the v alidation set, plus and minus one standard deviation. W e notice from table 1 that the LFM outperforms the other methods both in terms of RMSE and R 2 . This is particularly true for the R 2 performance measure, indicating the ability that the LFM has for generating more realistic motions. 5 Partial Differ ential Equations and Latent F orces So far we have considered dynamical latent force models based on ordinary differential equations, leading to multioutput Gaussian processes which are functions of a single variable: time. As mentioned before, the methodology can also be 5 The CMU Graphics Lab Motion Capture Database was created with funding from NSF EIA-0196217 and is av ailable at http://mocap.cs.cmu. edu . 6 W e selected specific frame intervals for each motion. For 64(1) , frames [120 , 400] ; for 64(2) , frames [170 , 420] ; for 64(3) , frames [100 , 300] ; and for 64(4) , frames [80 , 315] . For 35(2) , frames [55 , 338] ; for 10(4) , frames [222 , 499] ; for 12(1) , frames [22 , 328] ; and for 16(15) , frames [62 , 342] . For all other motions, we use all the frames. 8 Movement Method RMSE R 2 (%) Golf swing IND GP 21 . 55 ± 2 . 35 30 . 99 ± 9 . 67 MTGP 21 . 19 ± 2 . 18 45 . 59 ± 7 . 86 SLFM 21 . 52 ± 1 . 93 49 . 32 ± 3 . 03 LFM 18 . 09 ± 1 . 30 72 . 25 ± 3 . 08 W alking IND GP 8 . 03 ± 2 . 55 30 . 55 ± 10 . 64 MTGP 7 . 75 ± 2 . 05 37 . 77 ± 4 . 53 SLFM 7 . 81 ± 2 . 00 36 . 84 ± 4 . 26 LFM 7 . 23 ± 2 . 18 48 . 15 ± 5 . 66 T able 1: RMSE and R 2 for golf swing and walking applied in the context of partial differential equations to recover multioutput Gaussian processes which are functions of sev eral inputs. W e first show an example of spatio-temporal cov ariance obtained from the latent force model idea and then an example of a cov ariance function that, using a simplified version of the diffusion equation, allows an expression for higher-dimensional inputs. 5.1 Gap-gene network of Dr osophila melanogaster In this section we show an example of a latent force model for a spatio-temporal domain. For illustration, we use gene expression data obtained from the Gap-gene network of the Drosophila melanogaster . W e propose a linear model that can account for the mechanistic behavior of the gene e xpression. The gap gene network is responsible for the segmented body pattern of the Drosophila melanogaster . During the blastoderm stage of the dev elopment of the body , different maternal gradients determine the polarity of the embryo along its anterior- posterior (A-P) axis (Perkins et al., 2006). Figure 1: Drosophila body segmentation genes. Blue stripes correspond to hunchback, green stripes to knirps and red stripes to ev e- skipped at cleav age c ycle 14A, temporal class 3. Maternal gradient interact with the so called trunk gap genes, including hunchback (hb) , Kr ¨ uppel (Kr) , giant (gt) , and knirps (kni) , and this network of interactions establish the patterns of segmentation of the Drosophila. Figure 1 shows the gene expression of the hunchback, the knirps and the e ve-skipped genes in a color-scale intensity image. The image corresponds to cleav age cycle 14A, temporal class 3. 7 The gap-gene network dynamics is usually represented using a set of coupled non-linear partial differential equations (Perkins et al., 2006; Gursky et al., 2004) ∂ y d ( x, t ) ∂ t = ζ ( t ) P d ( y ( x, t )) − λ d y d ( x, t ) + D d ∂ 2 y d ( x, t ) ∂ x 2 , where y d ( x, t ) denotes the relative concentration of gap protein of the d -th gene at the space point x and time point t . The term P d ( y ( x, t )) accounts for production and it is a function, usually non-linear, of production of all other genes. The parameter λ d represents the decay and D d the diffusion rate. The function ζ ( t ) accounts for changes occurring during the mitosis, in which the transcription is off (Perkins et al., 2006). W e linearize the equation above by replacing the non-linear term ζ ( t ) P d ( y ( x, t )) with the linear term P Q q =1 S d,q u q ( x, t ) , where S d,q are sensitivities which account for the influence of the latent force u q ( x, t ) over the quantity of production of 7 The embryo name is dm12 and the image was taken from http://urchin.spbcas.ru/flyex/ . 9 gene d . In this way , the ne w dif fusion equation is gi ven by ∂ y d ( x, t ) ∂ t = X ∀ q S d,q u q ( x, t ) − λ d y d ( x, t ) + D d ∂ 2 y d ( x, t ) ∂ x 2 . This expression corresponds to a second order non-homogeneous partial differential equation. It is also parabolic with one space v ariable and constant coefficients. The exact solution of this equation is subject to particular initial and boundary conditions. For a first boundary value problem with domain 0 ≤ x ≤ l , initial condition y d ( x, t = 0) equal to zero, and boundary conditions y d ( x = 0 , t ) and y d ( x = l , t ) both equal to zero, the solution to this equation is gi ven by Polyanin (2002); Butkovskiy and Pustyl’nik ov (1993); Stakgold (1998) y d ( x, t ) = Q X q =1 S d,q Z t 0 Z l 0 u q ( ξ , τ ) G d ( x, ξ , t − τ )d ξ d τ , where the Green’ s function G d ( x, ξ , t ) is gi v en by G d ( x, ξ , t ) = 2 l e − λ d t ∞ X n =1 sin nπ x l sin nπ ξ l e − D d n 2 π 2 t l 2 . W e assume that the latent forces u q ( x, t ) follow a Gaussian process with cov ariance function that factorizes across inputs dimensions, this is k u q ,u q ( x, t, x 0 , t 0 ) = exp − ( t − t 0 ) 2 ` t q 2 ! exp − ( x − x 0 ) 2 ` x q 2 ! , where ` t q represents the length-scale along the time-input dimension and ` x q the length-scale along the space input dimension. The cov ariance for the outputs y d ( x, t ) , k f q d ,f q d 0 ( x, t, x 0 , t 0 ) , is computed using the expressions for the Green’ s function and the cov ariance of the latent forces, in a similar fashion to equation (22), leading to k f q d ,f q d 0 ( x, t, x 0 , t 0 ) = 4 ` 2 ∞ X n =1 ∞ X m =1 k t f q d ,f q d 0 ( t, t 0 ) k x f q d ,f q d 0 ( x, x 0 ) , (26) where k t f q d ,f q d 0 ( t, t 0 ) and k x f q d ,f q d 0 ( x, x 0 ) are also kernel functions that depend on the indexes n and m . The kernel function k t f q d ,f q d 0 ( t, t 0 ) is given by e xpression (10) and k x f q d ,f q d 0 ( x, x 0 ) is given by k x f q d ,f q d 0 ( x, x 0 ) = C ( n, m, ` x q ) sin( ω n x ) sin( ω m x 0 ) , where ω n = nπ ` and ω m = mπ ` . The term C ( n, m, ` x q ) represents a function that depends on the indexes n and m , and on the length-scale of the space-input dimension. The expression for C ( n, m, ` x q ) is included in appendix B. For completeness, we also include the cross-co v ariance between the outputs and the latent functions, which follo ws as k f d ,u q ( x, t, x 0 , t 0 ) = 2 S d,q l ∞ X n =1 k t f d ,u q ( t, t 0 ) k x f d ,u q ( x, x 0 ) , where k t f d ,u q ( t, t 0 ) is given by e xpression (12), and k x f d ,u q ( x, x 0 ) follows k x f d ,u q ( x, x 0 ) = sin ( w n x ) C ( x 0 , n, ` x q ) , where C ( x 0 , n, ` x q ) is a function of x 0 , the index n and the length-scale of the space input dimension. The expression for C ( x 0 , n, ` x q ) is included in appendix C. Prediction of gene expr ession data W e want to assess the contribution that a simple mechanistic assumption might bring to the prediction of gene expression data when compared to a cov ariance function that does not imply mechanistic assumptions. W e refer to the co v ariance function obtained in the section before as the drosophila (DR OS) kernel and compare against the multi-task Gaussian process (MTGP) framew ork already mentioned in section 2. Covariance for the MTGP is a particular 10 case of the latent force model covariance in equations (21) and (22). If we make G d ( t − τ ) = δ ( t − τ ) in equation (21), and k u q ,u q ( t, t 0 ) = k u,u ( t, t 0 ) for all values of q , we get k f d ,f d 0 ( t, t 0 ) = Q X q =1 S d,q S d 0 ,q k u,u ( t, t 0 ) . Our purpose is to compare the prediction performance of the cov ariance abo ve and the DR OS cov ariance function. W e use data from Perkins et al. (2006), in particular , we hav e quantitativ e wild-type concentration profiles for the protein products of giant and knirps at 9 time points and 58 spatial locations. W e work with a gene at a time and assume that the outputs correspond to the dif ferent time points. This setup is very common in computer emulation of multiv ariate codes (see Conti and O’Hagan (2010); Osborne et al. (2008); Rougier (2008)) in which the MTGP model is heavily used. For the DR OS kernel, we use 30 terms in each sum in volv ed in its definition, in equation (26). W e randomly select 20 spatial points for training the models, this is, for finding hyperparameters according to the description of subsection 3.2. The other 38 spatial points are used for validating the predicti v e performance. Results are shown in table 2 for fiv e repetitions of the same experiment. It can be seen that the mechanistic assumption included in the GP model considerably outperforms a traditional approach like MTGP , for this particular task. Gene Method RMSE R 2 (%) giant MTGP 26 . 56 ± 0 . 30 81 . 12 ± 0 . 01 DR OS 2 . 00 ± 0 . 35 99 . 78 ± 0 . 01 knirps MTGP 16 . 14 ± 8 . 44 91 . 18 ± 2 . 77 DR OS 3 . 01 ± 0 . 81 99 . 60 ± 0 . 01 T able 2: RMSE and R 2 for protein data prediction 5.2 Diffusion in the Swiss Jura The Jura data is a set of measurements of concentrations of sev eral heavy metal pollutants collected from topsoil in a 14 . 5 km 2 region of the Swiss Jura. W e consider a latent function that represents how the pollutants were originally laid down. As time passes, we assume that the pollutants diffuse at different rates resulting in the concentrations observed in the data set. W e use a simplified version of the heat equation of p variables. The p -dimensional non-homogeneous heat equation is represented as ∂ y d ( x , t ) ∂ t = p X j =1 κ d,j ∂ 2 y d ( x , t ) ∂ x 2 j + Φ( x , t ) , where p = 2 is the dimension of x , the measured concentration of each pollutant over space and time is given by y d ( x , t ) , κ d,j is the diffusion constant of output d in direction p , and Φ( x , t ) represents an external force, with x = { x j } p j =1 . Assuming the domain R p = {−∞ < x j < ∞ ; j = 1 , . . . , p } and initial condition prescribed by the set of latent forces, u ( x ) = Q X q =1 S d,q u q ( x ) , at t = 0 , the solution to the system (Polyanin, 2002) is then giv en by y d ( x , t ) = Z t 0 Z R p G d ( x , x 0 , t, τ )Φ( x 0 , τ )d x 0 d τ + Z R p G d ( x , x 0 , t, 0) u ( x 0 )d x 0 , (27) where G q ( x , x 0 , t, τ ) is the Green’ s function gi ven by G d ( x , x 0 , t, τ ) = 1 2 p π p/ 2 q Q p j =1 T d,j exp − p X j =1 ( x j − x 0 j ) 2 4 T d,j , with T d,j ( t, τ ) = κ d,j ( t − τ ) . The cov ariance function we propose here is deriv ed as follo ws. In equation (27), we assume that the external force Φ( x , t ) is zero, follo wing y d ( x , t ) = Q X q =1 S d,q Z R p G d ( x , x 0 , t, 0) u q ( x 0 )d x 0 . (28) 11 W e can write again the e xpression for the Green’ s function as G d ( x , x 0 , t ) = 1 (2 π ) p/ 2 q Q p j =1 2 T d,j exp − p X j =1 ( x j − x 0 j ) 2 4 T d,j = 1 (2 π ) p/ 2 q Q p j =1 ` d,j exp − p X j =1 ( x j − x 0 j ) 2 2 ` d,j , where ` d,j = 2 T d,j = 2 κ d,j t . The coefficient ` d,j is a function of time. In our model for the diffusion of the pollutant metals, we think of the data as a snapshot of the diffusion process. Consequently , we consider the time instant of this snapshot as a parameter to be estimated. In other words, the measured concentration is gi ven by y d ( x ) = Q X q =1 S d,q Z R p e G d ( x , x 0 ) u q ( x 0 )d x 0 , (29) where e G d ( x , x 0 ) is the Green’ s function G d ( x , x 0 , t ) that considers the variable t as a parameter to be estimated through ` d,j . Expression for e G d ( x , x 0 ) corresponds to a Gaussian smoothing kernel, with diagonal covariance. This is e G d ( x , x 0 ) = | P d | 1 / 2 (2 π ) p/ 2 exp − 1 2 ( x − x 0 ) > P d ( x − x 0 ) , where P d is a precision matrix, with diagonal form and entries { p d,j = 1 ` d,j } p j =1 . If we take the latent function to be gi ven by a GP with the Gaussian cov ariance function, we can compute the multiple output covariance functions analytically . The cov ariance function between the output functions, k f q d ,f q d 0 ( x , x 0 ) , is obtained as 1 (2 π ) p/ 2 | P q d,d 0 | 1 / 2 exp − 1 2 ( x − x 0 ) > P q d,d 0 − 1 ( x − x 0 ) , where P q d,d 0 = P − 1 d + P − 1 d 0 + Λ − 1 q , and Λ q is the precision matrix associated to the Gaussian cov ariance of the latent force Gaussian process prior . The covariance function between the output and latent functions, k f q d ,u q ( x , x 0 ) , is giv en by 1 (2 π ) p/ 2 | P q d | 1 / 2 exp − 1 2 ( x − x 0 ) > ( P q d ) − 1 ( x − x 0 ) , where P q d = P − 1 d + Λ − 1 q . Prediction of Metal Concentrations W e used our model to replicate the experiments described in Goov aerts (pp. 248,249 1997) in which a primary variable (cadmium, cobalt, copper and lead) is predicted in conjunction with some secondary variables (nickel and zinc for cadmium and cobalt; copper, nickel and zinc for copper and lead). 8 Figure 2 shows an example of the prediction problem. For several sample locations we hav e access to the primary variable, for example cadmium, and the secondary variables, nickel and zinc. These sample locations are usually referred to as the pr ediction set . At some other locations, we only have access to the secondary variables, as it is shown in the figure by the squared regions. In geostatistics, this configuration of sample locations is known as undersampled or heter otopic , where usually a fe w expensi ve measurements of the attribute of interest are supplemented by more abundant data on correlated attrib utes that are cheaper to sample. By conditioning on the values of the secondary variables at the prediction and validation sample locations, and the pri- mary variables at the prediction sample locations, we can improv e the prediction of the primary v ariables at the validation locations. W e compare results for the heat kernel with results from prediction using independent GPs for the metals, the multi-task Gaussian process and the semiparametric latent f actor model. For our e xperiments we made use of ten repeats to report standard deviations. For each repeat, the data is divided into a different prediction set of 259 locations and dif ferent validation set of 100 locations. Root mean square errors and percentage of explained variance are sho wn in T ables 3 and 4, respectiv ely . Note from both tables that all methods outperform independent Gaussian processes, in terms of RMSE and explained variance. For one latent function ( Q = 1 ), the Gaussian process with Heat kernel render better results than multi-task GPs (in this case, the multi-task GP is equi v alent to the semiparametric latent factor model). Howe ver , when increasing the v alue of the latent forces to two ( Q = 2 ), performances for all methods are quite similar . There is a still a gain in performance when using the Heat k ernel, although the results are within the standard deviation. Also, when comparing the performances for the GP with Heat kernel using one and two latent forces, we notice that both measures are quite similar . In summary , the heat kernel provides a simplified explanation for the outputs, in the sense that, using only one latent force, we provide better performances in terms of RMSE and explained v ariance. 8 Data av ailable at http://www.ai- geostats.org/ . 12 Nickel Zinc Cadmium Figure 2: Sketch of the topsoil of Swiss Jura. Secondary variables like nickel and zinc help in the prediction of the primary variable cadmium, in the squared-regions. Method Cadmium (Cd) Cobalt (Co) Copper (Cu) Lead (Pb) IND GP 0 . 8353 ± 0 . 0898 2 . 2997 ± 0 . 1388 18 . 9616 ± 3 . 4404 28 . 1768 ± 5 . 8005 MTGP ( Q = 1 ) 0 . 7638 ± 0 . 1016 2 . 2892 ± 0 . 1792 14 . 4179 ± 2 . 7119 21 . 5861 ± 4 . 1888 HEA TK ( Q = 1 ) 0 . 6773 ± 0 . 0628 2 . 06 ± 0 . 0887 13 . 1788 ± 2 . 6446 17 . 9839 ± 2 . 9450 MTGP ( Q = 2 ) 0 . 6980 ± 0 . 0832 2 . 1299 ± 0 . 1983 12 . 7340 ± 2 . 2104 17 . 9399 ± 1 . 9981 SLFM ( Q = 2 ) 0 . 6941 ± 0 . 0834 2 . 172 ± 0 . 1204 12 . 8935 ± 2 . 6125 17 . 9024 ± 2 . 0966 HEA TK ( Q = 2 ) 0 . 6759 ± 0 . 0623 2 . 0345 ± 0 . 0943 12 . 5971 ± 2 . 4842 17 . 5571 ± 2 . 6076 T able 3: RMSE for pollutant metal prediction Method Cadmium (Cd) Cobalt (Co) Copper (Cu) Lead (Pb) IND GP 15 . 07 ± 7 . 43 57 . 81 ± 7 . 19 25 . 84 ± 7 . 54 23 . 48 ± 10 . 40 MTGP ( Q = 1 ) 27 . 25 ± 5 . 89 58 . 45 ± 5 . 71 58 . 84 ± 8 . 35 56 . 85 ± 11 . 60 HEA TK ( Q = 1 ) 43 . 83 ± 8 . 71 66 . 19 ± 4 . 60 65 . 55 ± 8 . 21 71 . 45 ± 5 . 78 MTGP ( Q = 2 ) 40 . 30 ± 5 . 17 64 . 13 ± 5 . 10 67 . 51 ± 8 . 36 69 . 70 ± 6 . 90 SLFM ( Q = 2 ) 40 . 97 ± 5 . 15 62 . 49 ± 5 . 41 67 . 35 ± 8 . 29 70 . 21 ± 6 . 04 HEA TK ( Q = 2 ) 43 . 94 ± 6 . 56 67 . 17 ± 4 . 30 68 . 40 ± 6 . 46 70 . 55 ± 6 . 88 T able 4: R 2 for pollutant metal prediction 6 Related work Differential equations are the cornerstone in a diverse range of engineering fields and applied sciences. Howe ver , their use for inference in statistics and machine learning has been less studied. The main field in which they have been used is kno wn as functional data analysis (Ramsay and Silverman, 2005). From the frequentist statistics point of view , the literature in functional data analysis has been concerned with the problem of parameter estimation in differential equations (Poyton et al., 2006; Ramsay et al., 2007): gi v en a differential equation with unknown coefficients { A m } M m =0 , how do we use data to fit those parameters? Notice that there is a subtle difference between those techniques and the latent force model. While these parameter estimation methods start with a very accurate description of the interactions in the system via the dif ferential equation (the dif ferential equation might e ven be non-linear (Perkins et al., 2006)), in the latent force model, we use the differential equation as part of the modeling problem: the differential equation is used as a way to introduce prior knowledge over a system for which we do not know the real dynamics, but for which we hope some important features of that dynamics could be expressed. Having said that, we revie w some of the parameter estimation methods because they also deal with differential equations with an uncertainty background. 13 Classical approaches to fit parameters θ of differential equations to observed data include numerical approximations of initial value problems and collocation methods (references Ramsay et al. (2007) and Brewer et al. (2008) provide revie ws and detailed descriptions of additional methods). The solution by numerical approximations include an iterativ e process in which given an initial set of parameters θ 0 and a set of initial conditions y 0 , a numerical method is used to solve the dif ferential equation. The parameters of the differential equation are then optimized by minimizing an error criterion between the approximated solution and the observed data. For exposition, we assume in equation (17) that D = 1 , Q = 1 and S 1 , 1 = 1 . W e are interested in finding the solution y ( t ) to the following dif ferential equation, with unknown parameters θ = { A m } M m =0 , D M 0 y ( t ) = M X m =0 A m D m y ( t ) = u ( t ) , In the classical approach, we assume that we hav e access to a vector of initial conditions, y 0 and data for u ( t ) , u . W e start with an initial guess for the parameter vector θ 0 and solve numerically the dif ferential equation to find a solution e y . An updated parameter vector e θ is obtained by minimizing E ( θ ) = N X n =1 k e y ( t n ) − y ( t n ) k , through any gradient descent method. T o use any of those methods, we must be able to compute ∂ E ( θ ) /∂ θ , which is equiv alent to compute ∂ y ( t ) /∂ θ . In general, when we do not have access to ∂ y ( t ) /∂ θ , we can compute it using what is known as the sensitivity equations (see Bard (1974), chapter 8, for detailed explanations), which are solved along with the ODE equation that provides the partial solution e y . Once a new parameter vector e θ has been found, the same steps are repeated until some con v ergence criterion is satisfied. If the initial conditions are not av ailable, they can be considered as additional elements of the parameter vector θ and optimized in the same gradient descent method. In collocation methods, the solution of the differential equation is approximated using a set of basis functions, { φ i ( t ) } J i =1 , this is y ( t ) = P J i =1 β i φ i ( t ) . The basis functions must be sufficiently smooth so that the deriv atives of the unknown func- tion, appearing in the differential equation, can be obtained by differentiation of the basis representation of the solution, this is, D m y ( t ) = P β i D m φ i ( t ) . Collocation methods also use an iterative procedure for fitting the additional parameters in v olved in the differential equation. Once the solution and its deriv ati ves hav e been approximated using the set of basis functions, minimization of an error criteria is used to estimate the parameters of the dif ferential equation. Principal dif feren- tial analysis (PD A) (Ramsay, 1996) is one example of a collocation method in which the basis functions are splines . In PDA, the parameters of the differential equation are obtained by minimizing the squared residuals of the higher order deriv ative D M y ( t ) and the weighted sum of deriv ati v es {D m y ( t ) } M − 1 m =0 , instead of the squared residuals between the approximated solution and the observed data. An example of a collocation method augmented with Gaussian process priors was introduced by Graepel (2003). Graepel starts with noisy observations, b y ( t ) , of the differential equation D M 0 y ( t ) , such that b y ( t ) ∼ N ( D M 0 y ( t ) , σ y ) . The solution y ( t ) is expressed using a basis representation, y ( t ) = P β i φ i ( t ) . A Gaussian prior is placed ov er β = [ β 1 , . . . , β J ] , and its posterior computed under the above likelihood. W ith the posterior ov er β , the predictive distribution for b y ( t ∗ ) can be readily computed, being a function of the matrix D M 0 Φ with elements {D M 0 φ i ( t n ) } N ,J n =1 ,i =1 . It turns out that prod- ucts D M 0 Φ D M 0 Φ > that appear in this predictiv e distribution have individual elements that can be written using the sum P J i =1 D M 0 φ i ( t n ) D M 0 φ i ( t n 0 ) = D M 0 ,t D M 0 ,t 0 P J i =1 φ i ( t n ) φ i ( t n 0 ) or, using a kernel representation for the inner prod- ucts k ( t n , t n 0 ) = P J i =1 φ i ( t n ) φ i ( t n 0 ) , as k D M 0 ,t , D M 0 ,t 0 ( t n , t n 0 ) , where this co v ariance is obtained by taking D M 0 deriv atives of k ( t, t 0 ) with respect to t and D M 0 deriv atives with respect to t 0 . In other words, the result of the dif ferential equation D M 0 y ( t ) is assumed to follo w a Gaussian process prior with cov ariance k D M 0 ,t , D M 0 ,t 0 ( t, t 0 ) . An approximated solution e y ( t ) can be com- puted through the e xpansion e y ( t ) = P N n =1 α n k D M 0 ,t 0 ( t, t n ) , where α n is an element of the vector ( K D M 0 ,t , D M 0 ,t 0 + σ y I N ) − 1 b y , where K D M 0 ,t , D M 0 ,t 0 is a matrix with entries k D M 0 ,t , D M 0 ,t 0 ( t n , t n 0 ) and b y are noisy observations of D M 0 y ( t ) . Although, we presented the above methods in the context of linear ODEs, solutions by numerical approximations and col- location methods are applied to non-linear ODEs as well. Gaussian processes ha ve been used as models for systems identification (Solak et al., 2003; K ocijan et al., 2005; Calderhead et al., 2009; Thompson, 2009). In Solak et al. (2003), a non-linear dynamical system is linearized around an equilibrium 14 point by means of a T aylor series e xpansion (Thompson, 2009), y ( t ) = ∞ X j =0 y ( j ) ( a ) j ! ( t − a ) j , with a the equilibrium point. For a finite v alue of terms, the linearization above can be seen as a regression problem in which the cov ariates correspond to the terms ( t − a ) j and the deriv ati v es y ( j ) ( a ) as regression coefficients. The deriv ati ves are assumed to follo w a Gaussian process prior with a cov ariance function that is obtained as k ( j,j 0 ) ( t, t 0 ) , where the superscript j indicates how many deri v ati ve of k ( t, t 0 ) are taken with respect to t and the superscript j 0 indicates ho w many deriv ati ves of k ( t, t 0 ) are taken with respect to t 0 . Deriv ati v es are then estimated a posteriori through standard Bayesian linear regression. An important consequence of including deriv ati ve information in the inference process is that the uncertainty in the posterior prediction is reduced as compared to using only function observations. This aspect of deriv ativ e information hav e been exploited in the theory of computer emulation to reduce the uncertainty in experimental design problems (Morris et al., 1993; Mitchell and Morris, 1994). Gaussian processes hav e also been used to model the output y ( t ) at time t k as a function of its L previous samples { y ( t − t k − l ) } L l =1 , a common setup in the classical theory of systems identification (Ljung, 1999). The particular dependency y ( t ) = g ( { y ( t − t k − l ) } L l =1 ) , where g ( · ) is a general non- linear function, is modelled using a Gaussian process prior and the predicted v alue for the output y ∗ ( t k ) is used as a new input for multi-step ahead prediction at times t j , with j > k (Kocijan et al., 2005). Uncertainty about y ∗ ( t k ) can also be incorporated for predictions of future output values (Girard et al., 2003). On the other hand, multiv ariate systems with Gaussian process priors hav e been thoroughly studied in the spatial analysis and geostatistics literature (Higdon, 2002; Boyle and Frean, 2005; Journel and Huijbregts, 1978; Cressie, 1993; Goovaerts, 1997; W ackernagel, 2003). In short, a v alid cov ariance function for multi-output processes can be generated using the linear model of coregionalization (LMC). In the LMC, each output y d ( t ) is represented as a linear combination of a series of basic processes { u q } Q q =1 , some of which share the same cov ariance function k u q ,u q ( t, t 0 ) . Both, the semiparametric latent factor model (T eh et al., 2005) and the multi-task GP (Bonilla et al., 2008) can be seen as particular cases of the LMC ( ´ Alvarez et al., 2011b). Higdon (2002) proposed the direct use of a expression (18) to obtain a valid covariance function for multiple outputs and referred to this kind of construction as process con volutions. Process con v olutions for constructing cov ariances for single output GP had already been proposed by Barry and V er Hoef (1996); V er Hoef and Barry (1998). Calder and Cressie (2007) revie ws sev eral e xtensions of the single process con v olution co v ariance. Boyle and Frean (2005) introduced the process con v olution idea for multiple outputs to the machine learning audience. Boyle (2007) dev eloped the idea of using impulse responses of filters to represent G d ( t, s ) , assuming the process v ( t ) was white Gaussian noise. Independently , Murray-Smith and Pearlmutter (2005) also introduced the idea of transforming a Gaussian process prior using a discretized version of the integral operator of equation (18). Such transformation could be applied for the purposes of fusing the information from multiple sensors (a similar setup to the latent force model b ut with a discretized con v olution), for solving in verse problems in reconstruction of images or for reducing computational comple xity working with the filtered data in the transformed space (Shi et al., 2005). There has been a recent interest in introducing Gaussian processes in the state space formulation of dynamical systems (K o et al., 2007; Deisenroth et al., 2009; Turner et al., 2010) for the representation of the possible nonlinear relationships between the latent space and between the latent space and the observation space. Going back to the formulation of the dimensionality reduction model, we hav e u t n = g 1 ( u t n − 1 ) + η , y t n = g 2 ( u t n ) + , where η and ξ are noise processes and g 1 ( · ) and g 2 ( · ) are general non-linear functions. Usually g 1 ( · ) and g 2 ( · ) are unknown, and research on this area has focused on dev eloping a practical frame work for inference when assigning Gaussian process priors to both functions. Finally , it is important to highlight the work of Calder (Calder, 2003, 2007, 2008) as an alternative to multiple-output modeling. Her work can be seen in the context of state-space models, u t n = u t n − 1 + η , y t n = G t n u t n + , where y t n and u t n are related through a discrete conv olution ov er an independent spatial variable. This is, for a fixed t n , y t n d ( s ) = P q P i G t n d ( s − z i ) u t n q ( z i ) for a grid of I spatial inputs { z i } I i =1 . 15 7 Conclusion In this paper we have presented a hybrid approach to modelling that sits between a fully mechanistic and a data driven ap- proach. W e used Gaussian process priors and linear dif ferential equations to model interactions between different variables. The result is the formulation of a probabilistic model, based on a kernel function, that encodes the coupled behavior of sev eral dynamical systems and allo ws for more accurate predictions. The implementation of latent force models introduced in this paper can be extended in se v eral ways, including: Non-linear Latent F orce Models. If the likelihood function is not Gaussian the inference process has to be accomplished in a different w ay , through a Laplace approximation (Lawrence et al., 2007) or sampling techniques (T itsias et al., 2009). Cascaded Latent F or ce Models. For the above presentation of the latent force model, we assumed that the cov ariances k u q ,u q ( t, t 0 ) were squared-exponential. Howe v er , more structured covariances can be used. For example, in Honkela et al. (2010), the authors use a cascaded system to describe gene expression data for which a first order system, like the one presented in subsection 3.1, has as inputs u q ( t ) governed by Gaussian processes with cov ariance function (10). Stochastic Latent F or ce Models. If the latent forces u q ( t ) are white noise processes, then the corresponding differential equations are stochastic, and the covariances obtained in such cases lead to stochastic latent force models. In ´ Alvarez et al. (2010), a first-order stochastic latent force model is employed for describing the beha vior of a multiv ariate financial dataset: the foreign exchange rate with respect to the dollar of ten of the top international currencies and three precious metals. Switching dynamical Latent F orce Models. A further extension of the LFM framew ork allows the parameter vector θ to hav e discrete changes as function of the input time. In ´ Alvarez et al. (2011a) this model was used for the segmentation of mov ements performed by a Barrett W AM robot as haptic input de vice. Acknowledgments DL has been partly financed by Comunidad de Madrid (project PR O-MUL TIDIS-CM, S-0505/TIC/0233), and by the Span- ish government (CICYT project TEC2006-13514-C02-01 and researh grant JC2008-00219). MA and NL have been fi- nanced by a Google Research A w ard and EPSRC Grant No EP/F005687/1 “Gaussian Processes for Systems Identification with Applications in Systems Biology”. MA also ackno wledges the support from the Overseas Research Student A ward Scheme (ORSAS), from the School of Computer Science of the University of Manchester and from the Universidad T ec- nol ´ ogica de Pereira, Colombia. A Pr epr ocessing f or the mocap data For selecting the subset of angles for each of the motions for the golf-swing movement and the walking mov ement, we use as performance measure the signal-to-noise ratio obtained in the following way . W e train a GP regressor for each output, employing a cov ariance function that is the sum of a squared exponential kernel and a white Gaussian noise, σ 2 S exp − ( x − x 0 ) 2 2 ` 2 + σ 2 N δ ( x , x 0 ) , where σ 2 S and σ 2 N are variance parameters, and δ ( x , x 0 ) is the Dirac delta function. F or each output, we compute the signal-to-noise ratio as 10 log 10 ( σ 2 S /σ 2 N ) . B Expr ession f or C ( n, m, ` x ) For simplicity , we assume Q = 1 and write ` x q = ` x . The expression for C ( n, m, ` x ) is given by C ( n, m, ` x ) = Z l 0 Z l 0 sin ( w n ξ ) sin ( w m ξ 0 ) e − ( ξ − ξ 0 ) 2 ` 2 x d ξ 0 d ξ . The solution of this double integral depends upon the relative v alues of n and m . If n 6 = m , and n and m are both ev en or both odd, then the analytical expression for C ( n, m, ` x ) is ` x l √ π ( m 2 − n 2 ) { n I [ W ( m, ` x )] − m I [ W ( n, ` x )] } , 16 where I [ · ] is an operator that takes the imaginary part of the argument and W ( m, ` x ) is given by W ( m, ` x ) = w ( j z γ m 1 ) − e − ( l ` x ) 2 e − γ m l w ( j z γ m 2 ) , being z γ m 1 = ` x γ m 2 , z γ m 2 = l ` x + ` x γ m 2 and γ m = j ω m . The term C ( n, m, ` x ) is zero if, for n 6 = m , n is even and m is odd or vicev ersa. Finally , when n = m , the expression for C ( n, n, ` x ) follows as ` x √ π l 2 R W ( n, ` x ) − I [ W ( n, ` x )] h ` 2 x nπ 2 l 2 + 1 nπ i + ` 2 x 2 h e − ( l ` x ) 2 cos( nπ ) − 1 i , where R [ · ] is an operator that takes the real part of the argument. C Expr ession f or C ( x 0 , n, ` x ) As in appendix B, we assume Q = 1 and ` x q = ` x . The expression C ( x 0 , n, ` x ) is as ` x √ π 2 I e − x 0 − l ` x 2 e γ n l w ( j z γ n ,x 0 2 ) − e − x 0 ` x 2 w ( j z γ n ,x 0 1 ) , with z γ n ,x 0 1 = x 0 ` x + ` x γ n 2 , z γ n ,x 0 2 = x 0 − l ` x + ` x γ n 2 , γ n = j ω n and I [ · ] is an operator that takes the imaginary part of the argument. References Mauricio A. ´ Alvarez and Neil D. Lawrence. Sparse con volv ed Gaussian processes for multi-output regression. In Koller et al. (2009), pages 57–64. Mauricio A. ´ Alvarez, David Luengo, and Neil D. Lawrence. Latent Force Models. In van Dyk and W elling (2009), pages 9–16. Mauricio A. ´ Alvarez, Da vid Luengo, Michalis K. T itsias, and Neil D. Lawrence. Efficient multioutput Gaussian processes through variational inducing k ernels. In T eh and Titterington (2010), pages 25–32. Mauricio A. ´ Alvarez, Jan Peters, Bernhard Sch ¨ olkopf, and Neil D. Lawrence. Switched latent force models for mov ement segmentation. In NIPS , volume 24, pages 55–63. MIT Press, Cambridge, MA, 2011a. Mauricio A. ´ Alvarez, Lorenzo Rosasco, and Neil D. Lawrence. Kernels for vector-v alued functions: a revie w . T echnical report, Uni versity of Manchester , Massachusetts Institute of T echnology and Uni v ersity of Shef field, 2011b. A vailable at http://arxiv.org/pdf/1106.6251v1 . Y onathan Bard. Nonlinear P arameter Estimation . Academic Press, first edition, 1974. Ronald Paul Barry and Jay M. V er Hoef. Blackbox kriging: spatial prediction without specifying variogram models. Journal of Agricultural, Biological and En vir onmental Statistics , 1(3):297–322, 1996. Sue Becker , Sebastian Thrun, and Klaus Obermayer, editors. NIPS , volume 15, Cambridge, MA, 2003. MIT Press. Edwin V . Bonilla, Kian Ming Chai, and Christopher K. I. W illiams. Multi-task Gaussian process prediction. In John C. Platt, Daphne K oller , Y oram Singer , and Sam Roweis, editors, NIPS , v olume 20, Cambridge, MA, 2008. MIT Press. Phillip Boyle. Gaussian Pr ocesses for Regr ession and Optimisation . PhD thesis, V ictoria University of W ellington, W elling- ton, New Zealand, 2007. Phillip Boyle and Marcus Frean. Dependent Gaussian processes. In Lawrence Saul, Y air W eiss, and L ´ eon Bouttou, editors, NIPS , volume 17, pages 217–224, Cambridge, MA, 2005. MIT Press. Daniel Bre wer , Martino Barenco, Robin Callard, Michael Hubank, and Jaroslav Stark. Fitting ordinary differential equations to short time course data. Philosophical T ransactions of the Royal Society A , 366:519–544, 2008. 17 A.G. Butkovskiy and L.M. Pustyl’niko v . Characteristics of Distributed-P arameter Systems . Kluwer Academic Publishers, 1993. Catherine A. Calder . Dynamic factor process conv olution models for multiv ariate space-time data with application to air quality assessment. En vir onmental and Ecological Statistics , 14(3):229–247, 2007. Catherine A. Calder . A dynamic process con volution approach to modeling ambient particulate matter concentrations. En vir onmetrics , 19:39–48, 2008. Catherine A. Calder . Exploring latent structur e in spatial temporal pr ocesses using process con volutions . PhD thesis, Institute of Statistics and Decision Sciences, Duke Uni versity , Durham, NC, USA, 2003. Catherine A. Calder and Noel Cressie. Some topics in conv olution-based spatial modeling. In Pr oceedings of the 56th Session of the International Statistics Institute , August 2007. Ben Calderhead, Mark Girolami, and Neil D Lawrence. Accelerating bayesian inference over nonlinear differential equa- tions with gaussian processes. In Koller et al. (2009), pages 217–224. Stefano Conti and Anthony O’Hagan. Bayesian emulation of complex multi-output and dynamic computer models. Journal of Statistical Planning and Infer ence , 140(3):640–651, 2010. Noel A. C. Cressie. Statistics for Spatial Data . John W ile y & Sons (Re vised edition), USA, 1993. Lehel Csat ´ o and Manfred Opper . Sparse representation for Gaussian process models. In T odd K. Leen, Thomas G. Diet- terich, and V olker T resp, editors, NIPS , volume 13, pages 444–450, Cambridge, MA, 2001. MIT Press. Marc Peter Deisenroth, Marco F . Huber , and Uwe D. Hanebeck. Analytic moment-based Gaussian process filtering. In Pr oceedings of the 26th International Confer ence on Machine Learning (ICML 2009) , pages 225–232. Omnipress, 2009. Pei Gao, Antti Honkela, Magnus Rattray , and Neil D. Lawrence. Gaussian process modelling of latent chemical species: Applications to inferring transcription factor activities. Bioinformatics , 24:i70–i75, 2008. doi: 10.1093/bioinformatics/ btn278. Agathe Girard, Carl Edward Rasmussen, Joaquin Qui ˜ nonero Candela, and Roderick Murray-Smith. Gaussian process priors with uncertain inputs – application to multiple-step ahead time series forecasting. In Becker et al. (2003), pages 529–536. Pierre Goov aerts. Geostatistics For Natural Resour ces Evaluation . Oxford University Press, USA, 1997. Thore Graepel. Solving noisy linear operator equations by Gaussian processes: Application to ordinary and partial differ - ential equations. In T om Fawcett and Nina Mishra, editors, Pr oceedings of the T wentieth International Conference on Machine Learning , pages 234–241, W ashington, DC, USA, August 21-24 2003. AAAI Press. D. H. Griffel. Applied Functional Analysis . Dov er publications Inc., Mineola, Ne w Y ork, reprinted edition, 2002. V italy V . Gursky , Johannes Jaeger , Konstantin N. K ozlov , John Reinitz, and Alexander Samsonov . Pattern formation and nuclear di visions are uncoupled in Drosophila segmentation: comparison of spatially discrete and continuous models. Physica D , 197:286–302, 2004. David M. Higdon. Space and space-time modelling using process conv olutions. In C. Anderson, V . Barnett, P . Chatwin, and A. El-Shaarawi, editors, Quantitative methods for current en vir onmental issues , pages 37–56. Springer-V erlag, 2002. Antti Honkela, Charles Girardot, E. Hilary Gustafson, Y a-Hsin Liu, Eileen E. M. Furlong, Neil D. Lawrence, and Magnus Rattray . Model-based method for transcription factor target identification with limited data. Pr oc. Natl. Acad. Sci. , 107 (17):7793–7798, 2010. Andre G. Journel and Charles J. Huijbregts. Mining Geostatistics . Academic Press, London, 1978. ISBN 0-12391-050-1. Jonathan K o, Daniel J. Klein, Dieter Fox, and Dirk Haehnel. GP-UKF: Unscented Kalman filters with Gaussian process prediction and observation models. In Pr oceedings of the 2007 IEEE/RSJ International Conference on Intelligent Robots and Systems , pages 1901–1907, San Diego, CA, USA, 2007. Ju ˇ s Kocijan, Agathe Girard, Bla ˇ z Banko, and Roderick Murray-Smith. Dynamic systems identification with Gaussian processes. Mathematical and Computer Modelling of Dynamical Systems , 11(4):411–424, 2005. 18 Daphne Koller , Dale Schuurmans, Y oshua Bengio, and L ´ eon Bottou, editors. NIPS , volume 21, Cambridge, MA, 2009. MIT Press. Neil D. Lawrence. Probabilistic non-linear principal component analysis with Gaussian process latent variable models. Journal of Mac hine Learning Resear ch , 6:1783–1816, Nov . 2005. Neil D. La wrence, Guido Sanguinetti, and Magnus Rattray . Modelling transcriptional regulation using Gaussian processes. In Bernhard Sch ¨ olkopf, John C. Platt, and Thomas Hofmann, editors, NIPS , volume 19, pages 785–792. MIT Press, Cambridge, MA, 2007. Lennart Ljung. System Identification: Theory for the User . Prentice Hall PTR, Upper Saddle River , New Jersey , second edition, 1999. T oby J. Mitchell and Max Morris. Asymptotically optimum experimental designs for prediction of deterministic functions giv en deri v ati v e information. Journal of Statistical Planning and Infer ence , 41:377–389, 1994. Max D. Morris, T oby J. Mitchell, and Donald Ylvisaker . Bayesian design and analysis of computer experiments: use of deriv atives in surf ace prediction. T echnometrics , 35(3):243–255, 1993. Roderick Murray-Smith and Barak A. Pearlmutter . T ransformation of Gaussian process priors. In Joab Winkler , Mahesan Niranjan, and Neil Lawrence, editors, Deterministic and Statistical Methods in Machine Learning , pages 110–123. LN AI 3635, Springer-V erlag, 2005. Bert Øksendal. Stochastic Differ ential Equations: An Intr oduction with Applications . Springer , Germany , sixth edition, 2003. Michael A. Osborne, Alex Rogers, Sarvapali D. Ramchurn, Stephen J. Roberts, and Nicholas R. Jennings. T o wards real- time information processing of sensor network data using computationally efficient multi-output Gaussian processes. In Pr oceedings of the International Conference on Information Pr ocessing in Sensor Networks (IPSN 2008) , 2008. Theodore J. Perkins, Johannes Jae ger , John Reinitz, and Leon Glass. Rev erse engineering the gap gene network of Drosophila melanogaster . PLOS Comput Biol , 2(5):417–427, 2006. Andrei D. Polyanin. Handbook of Linear P artial Differ ential Equations for Engineers and Scientists . Chapman & Hall/CRC Press, 2002. A.A. Poyton, M. Saeed V arziri, Kim B. McAuley , James McLellan, and Jim O. Ramsay . Parameter estimation in continuous- time dynamic models using principal differential analysis. Computers and Chemical Engineering , 30:698–708, 2006. Joaquin Qui ˜ nonero-Candela and Carl Edward Rasmussen. A unifying view of sparse approximate Gaussian process regres- sion. Journal of Mac hine Learning Resear ch , 6:1939–1959, 2005. Jim O. Ramsay . Principal differential analysis: Data reduction by differential operators. J ournal of the Royal Statistical Society . Series B (Methodological) , 58(3):495–508, 1996. Jim O. Ramsay and Bernard W . Silverman. Functional Data Analysis . Springer Series in Statistics, New Y ork, NY , (USA), second edition, 2005. Jim O. Ramsay , G. Hooker , D. Campbell, and J. Cao. Parameter estimation for differential equations: a generalized smoothing approach. Journal of the Royal Statistical Society . Series B (Methodological) , 69(5):741–796, 2007. Carl Edward Rasmussen and Christopher K. I. Williams. Gaussian Pr ocesses for Machine Learning . MIT Press, Cambridge, MA, 2006. ISBN 0-262-18253-X. Linda E. Reichl. A modern course in statistical physics . John Wile y & Sons, United States of America, second edition, 1998. Gary F . Roach. Green’ s functions . Cambridge Univ ersity Press, Cambridge, UK, second edition, 1982. Jonathan Rougier . Efficient emulators for multiv ariate deterministic functions. J ournal of Computational and Graphical Statistics , 17(4):827–834, 2008. Matthias Seeger , Christopher K. I. W illiams, and Neil D. Lawrence. Fast forward selection to speed up sparse Gaussian process regression. In Christopher M. Bishop and Brendan J. Frey , editors, Pr oceedings of the Ninth International W orkshop on Artificial Intellig ence and Statistics , K ey W est, FL, 3–6 Jan 2003. 19 Sam K. Shanmugan and Arthur M. Breipohl. Random signals: detection, estimation and data analysis . John Wile y & Sons, United States of America, first edition, 1988. Jian Qing Shi, Roderick Murray-Smith, D.M. T itterington, and Barak Pearlmutter . Learning with large data sets using filtered Gaussian process priors. In R. Murray-Smith and R. Shorten, editors, Pr oceedings of the Hamilton Summer School on Switc hing and Learning in F eedbac k systems , pages 128–139. LNCS 3355, Springer -V erlag, 2005. Edward Snelson and Zoubin Ghahramani. Sparse Gaussian processes using pseudo-inputs. In Y air W eiss, Bernhard Sch ¨ olkopf, and John C. Platt, editors, NIPS , v olume 18, Cambridge, MA, 2006. MIT Press. Ercan Solak, Roderick Murray-Smith, W illiam E. Leithead, Douglas J. Leith, and Carl E. Rasmussen. Deriv ati ve observ a- tions in Gaussian process models of dynamic systems. In Becker et al. (2003), pages 1033–1040. I. Stakgold. Gr een’ s Functions and Boundary V alue Pr oblems . John Wile y & Sons, Inc., second edition, 1998. Y ee Whye T eh and Mike T itterington, editors. AIST A TS , Chia Laguna, Sardinia, Italy , 13-15 May 2010. JMLR W&CP 9. Y ee Whye T eh, Matthias Seeger , and Michael I. Jordan. Semiparametric latent factor models. In Robert G. Cowell and Zoubin Ghahramani, editors, AIST ATS 10 , pages 333–340, Barbados, 6-8 January 2005. Society for Artificial Intelligence and Statistics. Keith R. Thompson. Implementation of Gaussian Pr ocess Models for nonlinear system Identification . PhD thesis, Depart- ment of Electronics and Electrical Engineering, Univ ersity of Glasgo w , Glasgow , UK, 2009. Michalis Titsias, Neil D Lawrence, and Magnus Rattray . Ef ficient sampling for Gaussian process inference using control variables. In K oller et al. (2009), pages 1681–1688. Michalis K. Titsias. V ariational learning of inducing v ariables in sparse Gaussian processes. In v an Dyk and W elling (2009), pages 567–574. Ryan T urner, Marc Peter Deisenroth, and Carl Edward Rasmussen. State-space inference and learning with Gaussian processes. In T eh and Titterington (2010), pages 868–875. David v an Dyk and Max W elling, editors. AIST A TS , Clearwater Beach, Florida, 16-18 April 2009. JMLR W&CP 5. Jay M. V er Hoef and Ronald Paul Barry . Constructing and fitting models for cokriging and multiv ariable spatial prediction. Journal of Statistical Plannig and Infer ence , 69:275–294, 1998. Hans W ackernagel. Multivariate Geostatistics . Springer-V erlag Heidelberg Ne w york, 2003. 20
Original Paper
Loading high-quality paper...
Comments & Academic Discussion
Loading comments...
Leave a Comment