Physics-guided Convolutional Neural Network (PhyCNN) for Data-driven Seismic Response Modeling
Seismic events, among many other natural hazards, reduce due functionality and exacerbate vulnerability of in-service buildings. Accurate modeling and prediction of building's response subjected to earthquakes makes possible to evaluate building perf…
Authors: Ruiyang Zhang, Yang Liu, Hao Sun
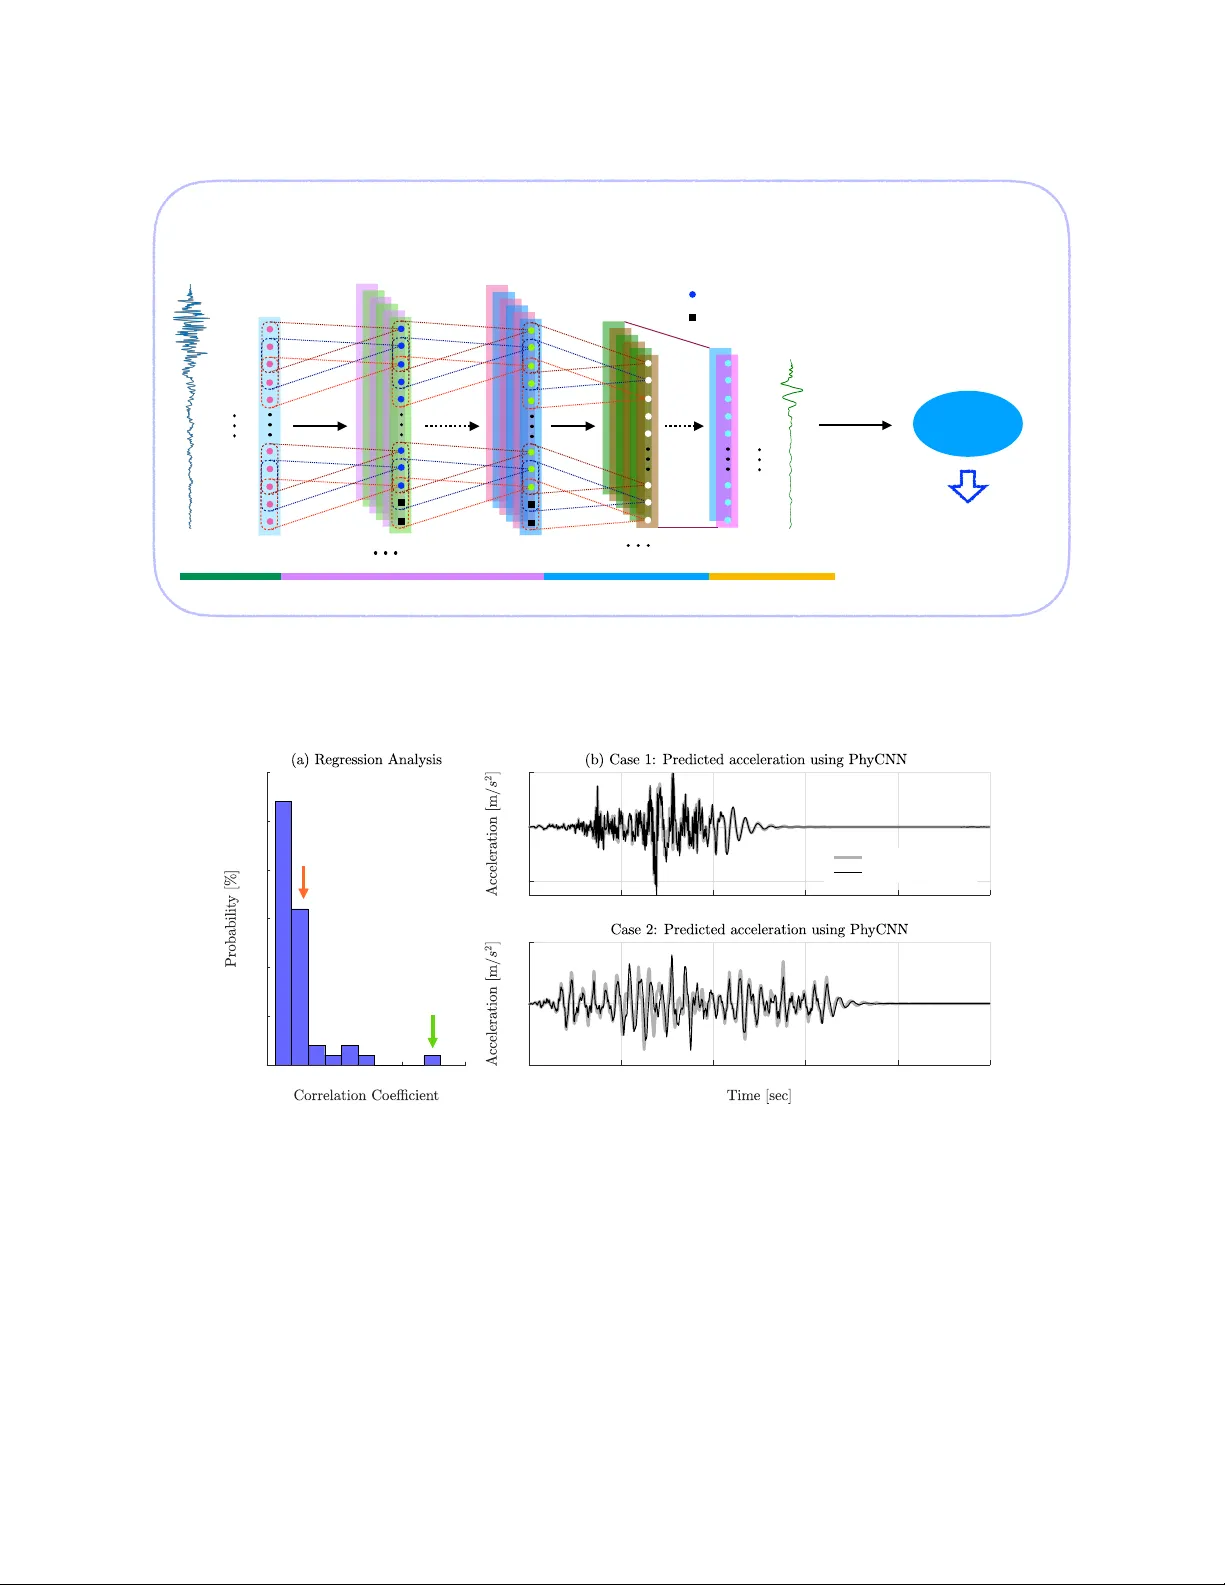
Ph ysics-guided Con v olutional Neural Net w ork (Ph yCNN) for Data-driv en Seismic Resp onse Mo deling Ruiy ang Zhang a , Y ang Liu b , Hao Sun a,c, ∗ a Dep artment of Civil and Envir onmental Engine ering, Northe astern University, Boston, MA 02115, USA b Dep artment of Me chanic al and Industrial Engine ering, Northe astern University, Boston, MA 02115, USA c Dep artment of Civil and Envir onmental Engine ering, MIT, Cambridge, MA 02139, USA Abstract Accurate prediction of building’s resp onse sub jected to earthquak es makes possible to ev aluate building performance. T o this end, w e lev erage the recent adv ances in deep learning and dev elop a ph ysics-guided con volutional neural net w ork (Ph yCNN) for data-driv en structural seismic response mo deling. The concept is to train a deep PhyCNN model based on limited seismic input-output datasets (e.g., from simulation or sensing) and physics constraints, and thus establish a surrogate mo del for structural resp onse prediction. Av ailable physics (e.g., the law of dynamics) can provide constrain ts to the netw ork outputs, alleviate ov erfitting issues, reduce the need of big training datasets, and thus impro v e the robustness of the trained mo del for more reliable prediction. The surrogate model is then utilized for fragility analysis given certain limit state criteria. In addition, an unsup ervised learning algorithm based on K-means clustering is also prop osed to partition the datasets to training, v alidation and prediction categories, so as to maximize the use of limited datasets. The p erformance of Ph yCNN is demonstrated through b oth n umerical and exp erimen tal examples. Con vincing results illustrate that Ph yCNN is capable of accurately predicting building’s seismic resp onse in a data-driven fashion without the need of a ph ysics-based analytical/numerical mo del. The Ph yCNN paradigm also outp erforms non-ph ysics-guided neural netw orks. Keywor ds: Deep learning, con volutional neural netw ork, physics-guided neural net work, K-mean clustering, seismic resp onse prediction, fragilit y analysis, serviceability assessmen t 1. In tro duction Civil infrastructures are vulnerable to natural hazards suc h as earthquak es, tsunamis and h urricanes, esp ecially under the effect of material aging and structural deterioration. Recen t dev elopmen ts in adv anced sensor and computation technologies pro vide a primary to ol for monitoring structural b eha vior and ev aluating structural integrit y . The ma jorit y of existing metho dologies fo cus on extracting structural features (e.g., mo dal characteristics) and up dating mo dels from the measured data, suc h as the Ba yesian probabilistic approac h ∗ Corresp onding author. T el: +1 617-373-3888 Email addr ess: h.sun@northeastern.edu (Hao Sun) Pr eprint submitte d to Elsevier Septemb er 19, 2019 [ 1 – 5 ], Kalman filtering [ 6 – 8 ], seismic in terferometry [ 9 – 13 ], etc. Nev ertheless, ho w to ef- fectiv ely utilize sensing data for structural resp onse mo deling and prediction under future hazards remains as a c hallenge. Con ven tional approac hes for structure resp onse prediction using sensing data include iden tification-based (or mo del up dating-based) metho ds and analytical metho ds. F or the iden tification-based approach, mapping the giv en excitation to the corresp onding resp onse through a black-box mo del or state-space model [ 14 – 18 ] has b een used to sim ulate and predict the system dynamic resp onse. A comprehensive review of w orks on system identi- fication and its applications in structural resp onse mo deling was given in [ 19 – 21 ]. Alterna- tiv ely , structural finite elemen t (FE) mo del up dating, which minimizes the errors b etw een the measured resp onse of the real structure and the syn thetic resp onse of the parametrized FE mo del, has b een extensiv ely studied and used to predict linear/nonlinear structural re- sp onse given a new input [ 22 – 26 ]. F or instance, Sk olnik et al. [ 27 ] predicted the seismic resp onses of a 15-story steel-frame building by an up dated FE mo del. In general, these ap- proac hes require excessiv e computational efforts on up dating the FE mo del when the mo del is of high fidelity , due to the large n um b er of parameters for up dating and limited av ail- abilit y of sensing data. Though low-fidelit y mo dels are more computationally cost effective, the accuracy is difficult to b e retained under uncertain ties esp ecially for nonlinear resp onse mo deling. F or analytical approac hes, autoregressiv e integrated moving av erage (ARIMA) is one of the most p opular linear mo dels for time series analysis and forecasting [ 28 , 29 ], which is originated from the autoregressive mo dels (AR), the mo ving a v erage models (MA) and the auto-regressiv e mo ving av erage mo dels (ARMA). These time series mo delling metho ds hav e serv ed the scien tific communit y for a long time; ho wev er, issues exist in regard to accuracy as well as stationarity and linearit y h yp othesis. Recen tly , considerable attention has b een fo cused on Artificial Intelligence (AI) which has b een pro ven to b e a p ow erful resp onse mo deling to ol and approximator [ 30 – 34 ]. In particular, supp ort vector mac hines (SVM) and artificial neural net works (ANN) hav e b een used for the identification and mo deling of dynamic resp onses during the past decade. F or example, Zhang et al. [ 35 ] employ ed SVM to iden tify structural parameters. Dong et al. [ 36 ] predicted the dynamic resp onse of an oscillator and a frame structure based on a SVM-based t wo-stage metho d. In addition, multi-la y er p erceptron (MLP) ANN has b een applied for predicting structural resp onse under static or dynamic loading conditions. F or instance, Ligh tb o dy and Irwin [ 37 ] applied MLP to predict the viscosit y of an industrial p olymerization reactor. W ang et al. [ 38 ] dev elop ed a MLP back-propagation net work to predict the seismic resp onse of a bridge structure. Christiansen et al. [ 39 ] used previous time step information as input to a one lay er MLP net work to predict the dynamic resp onse of the simplified mo del of a wind turbine. Huang et al. [ 40 ] iden tified structural dynamic c haracteristics and p erformed damage diagnosis of a building using a bac k-propagation MLP taking previous time step information as input. Lagaros and Papadrak akis [ 41 ] prop osed an MLP net work to predict the structural nonlinear b eha vior of 3D buildings when earthquake excitations with increasing intensities are considered. Nev ertheless, a v ery limited num b er of studies hav e b een rep orted in literature for struc- tural resp onse mo deling and prediction using more adv anced deep learning mo dels such as 2 the recurrent neural net work (RNN) and the conv olutional neural netw ork (CNN). RNN is designed to learn sequential and time-v arying patterns for regression problems [ 42 – 45 ], while CNN is known for its capability in classification of data with grid-like top ology (e.g., 1D sequences and 2D images) [ 46 – 48 ]. CNN can b e also used for solving regression problems. Recen tly , Sun et al. [ 49 ] proposed a virtual sensor mo del using CNN to estimate the dynamic resp onses of tw o numerical structure giv en measuremen ts at other lo cations. Ho w ever, the net work was trained using the partial resp onse measurements as input to predict resp onses of the rest of DOFs, limiting its applications in structural resp onse prediction under new inputs. Another remark able work by W u and Jahanshahi [ 50 ] used CNN to estimate struc- tural dynamic resp onse and p erform system identification, which show ed great capability of CNN for sequence regression. Nev ertheless, the hypothesis w as that the data is sufficien t to train a reliable predictiv e mo del. Challenges arise when the a v ailable training data is scarce. W e herein address limitations in data-driv en structural resp onse modeling through devel- oping a nov el ph ysics-guided CNN (i.e., PhyCNN), whic h is capable of accurately predicting nonlinear structural seismic time-history resp onses in a data-driven manner. The basic con- cept is to (1) embed av ailable ph ysics knowledge in to the deep learning mo del, (2) train a Ph yCNN based on av ailable seismic input-output datasets (e.g., from sim ulation or sensing), and (3) use the trained Ph yCNN as a surrogate mo del for response prediction. The surrogate mo del can further b e utilized for fragilit y analysis giv en certain limit state criteria (e.g., the serviceabilit y state). It is noted that the av ailable ph ysics (e.g., the law off dynamics) can pro vide constrain ts to the net work outputs, alleviate ov erfitting issues, reduce the need of big training datasets, and th us impro v e the robustness of the trained model for more reliable prediction. This paper is organized as follo ws. Section 2 presen ts the prop osed PhyCNN architecture for structural resp onse modeling. In Section 3 , the p erformance of PhyCNN is verified through t wo numerical examples of a nonlinear system. Section 4 presen ts the exp erimen tal v alidation of Ph yCNN based on filed sensing measurements, where data-driven serviceability analysis of a building is also discussed. Section 5 summarizes the conclusions. 2. Ph ysics-guided Con v olutional Neural Netw ork (Ph yCNN) Neural net works ha v e b een widely recognized as a p o werful tool to deal wi th problems lik e classification and regression. Among many other neural netw orks, CNN, which is inspired b y the virtual con vex of animals [ 51 ], can effectively mo del the grid-structured top ology of data (e.g., images), making it esp ecially p o werful for image classification. Ho wev er, CNN is also capable of dealing with regression problems, which is often inconspicuous due to its capabilit y in classification. T raditionally , deep neural net works are trained solely based on data. Ho wev er, b y adding physics (e.g., the go verning law of dynamics) into the training phase, the robustness and reliability of learning from the data can b e further enhanced. In other words, the em b edded ph ysics can inform the learning and constrain the training to a feasible space. In this pap er, a 1D regression-oriented Ph yCNN arc hitecture is prop osed for time series mo deling. 3 Sample points ·· x g z ( t ) 1 × k × p c − 1 × p c 1 × k × p 0 × p 1 n × p 0 n × p 1 n × p c FC Layer 1 ! nodes p d FC Layer o ! nodes p o Feature Learning Layer Fully Connected Layer Output Layer Layer output size Layer output size Layer input size ·· x g ( t 1 ) ·· x g ( t 2 ) ·· x g ( t 4 ) ·· x g ( t 5 ) ·· x g ( t 3 ) ·· x g ( t n − 1 ) ·· x g ( t n ) ·· x g ( t n − 2 ) ·· x g ( t n − 3 ) ·· x g ( t n − 4 ) z ( t 1 ) z ( t 2 ) z ( t 4 ) z ( t 5 ) z ( t 3 ) z ( t n − 2 ) z ( t n − 1 ) z ( t n ) Conv Layer 1 Conv Layer c n × p d Layer output size n × p o Output size z ( t ) Filtering Deep CNN with Unknown Parameter: θ = { W θ , b θ } State Space V ariable Modeling: z = CNN( ·· x g ) Di ff erentiation Input Layer z ( t ) = { x ( t ), · x ( t ), g ( t )} · z ( t ) = { x t ( t ), · x t ( t ), g t ( t )} e.g., Finite Difference Physics Constraints f : ·· x ( t ) + g ( t ) = − Γ ·· x g → 0 J D ( θ ) = ∥ x − x * ∥ + ∥ · x − · x * ∥ + ∥ g − g * ∥ J P ( θ ) = ∥ · x − x t ∥ + ∥ · x t + g + Γ ·· x g ∥ J ( θ ) = α 1 J D ( θ ) + α 2 J P ( θ ) θ = arg min θ J ( θ ) Data Loss: Physics Loss: T otal Loss: Solution: Zero-padding Figure 1: The prop osed physics-guided conv olutional neural net work (PhyCNN) for time-series mo deling. The Ph yCNN architecture includes the input lay er, the feature learning lay er, fully-connected lay er, the output lay er, and the graph-based tensor differentiator. The inputs are ground accelerations (or ground displacemen ts) and the outputs are state space v ariables z ( t ) including displacement x ( t ), velocity ˙ x ( t ), and restoring force g ( t ), namely , z ( t ) = { x t ( t ) , ˙ x t ( t ) , g t ( t ) } . The deriv atives of state space outputs ˙ z ( t ) are calculated through a tensor differentiator using the finite difference metho d. The total loss consists of the data loss from the measurements and the physics loss whic h mo dels the dep endency b etw een the output features. Both input and output to the netw ork are time sequences, including p 0 (e.g., ground acceleration and/or ground displacemen t) and p o (e.g., state space v ariables at different floor lev els) features, respectively . The size of lay er input and output is given. The conv olution lay er is defined as “height × width × depth × filters (output channels)”. An identical kernel size is used for all three conv olution lay ers in this study . Zero-padding is added to the output sequence of eac h conv olution la yer due to the con volution op eration as illustrated in Section 2.1 . Note that the nonlinear activ ation functions are not shown in this figure. T o illustrate the concept, let’s consider a dynamic system sub jected to the ground exci- tation following the equation of motion b elow: M ¨ x ( t ) + h ( t ) = − M Γ ¨ x g ( t ) (1) where M is the mass matrices; x , ˙ x , and ¨ x are the relativ e displacemen t, velocity , and acceleration v ectors to the ground; ¨ x g represen ts the ground acceleration; Γ is the force distribution vector; and h is the generalized restoring force vector. Normalizing Eq. ( 1 ) by M , the go verning equation can b e expressed as f := ¨ x ( t ) + g ( t ) + Γ ¨ x g ( t ) − → 0 (2) where g ( t ) is the mass-normalized restoring force, namely , g ( t ) = M − 1 h ( t ). A Ph yCNN framework is dev elop ed for surrogate mo deling of such a nonlinear dynamic system under ground motion excitation. The prop osed deep learning framework consists of a 1D CNN and a graph-based tensor differentiator. Figure 1 sho ws the basic concept and arc hitecture of Ph yCNN in the context of structural resp onse mo deling given the ground 4 acceleration as input which contains n sample p oin ts from t 1 to t n . The outputs are state space v ariables z ( t ) including the structural displacemen t x ( t ), the velocity ˙ x ( t ), and the normalized restoring force g ( t ), namely , z ( t ) = { x ( t ) , ˙ x t ( t ) , g ( t ) } , eac h of which has same n umber of n sample p oin ts ranging from t 1 to t n . With the con volution operation illustrated in Section 2.1 , zero-padding is added to the output sequence of each con volution lay er to ensure the identical input/output length. The prop osed PhyCNN architecture consists of m ultiple hidden lay ers b esides the input and output la yers, namely , the feature learning la yers and the fully connected lay ers [ 52 , 53 ]. A t ypical feature leaning lay er usually includes a con volution la yer, a nonlinear lay er (or nonlinear activ ation function), and a feature p o oling la yer. The output of each la yer is called a feature map since the feature learning lay ers are used for extracting features from the input or from the output from the previous la yer. In the prop osed PhyCNN architecture, the dimension of heigh t in a classical CNN is reduced to one, making it p ossible to tak e a time-series signal as input, while the dimension of width represen ts the temp oral space. In addition, a graph-based tensor differen tiator (e.g., the finite differen t metho d) is dev elop ed to calculate the deriv ativ e of state space outputs ˙ z ( t ) = { x t ( t ) , ˙ x t ( t ) , g t ( t ) } to construct the physics loss from the gov erning equation, where the subscript t represen ts the deriv ative of the state with resp ect to time. The basic concept here is to optimize the netw ork h yp erparameters θ = { W θ , b θ } suc h that the Ph yCNN can in terpret the measurement data (e.g., x m , ˙ x m , g m ) while satisfying the ph ysical equation of motion in Eq. ( 2 ), e.g., f − → 0. Here, W θ and b θ are the neural netw ork weigh t and bias parameters. The total loss J ( θ ) is then defined as J ( θ ) = J D ( θ ) + J P ( θ ) (3) with J D ( θ ) = 1 N k x p − x m k 2 2 + 1 N k ˙ x p − ˙ x m k 2 2 + 1 N k g p − g m k 2 2 (4) J P ( θ ) = 1 N k ˙ x p − x p t k 2 2 + 1 N k ˙ x p t + g p + Γ ¨ x g k 2 2 (5) where J D ( θ ) denotes the data loss based the measurements while J P ( θ ) represents the ph ysics loss which in tro duces a constraint for the neural net work that mo dels the dep en- dency in-b et w een the output features; the sup erscript p and m denote the prediction and measuremen t, resp ectiv ely . Note that the measurements are not necessarily required for the complete state, which could b e part of the state v ariables (e.g., x m only) or the accelera- tions (e.g., ¨ x m ). In such a case, the data loss in Eq. ( 4 ) should b e adjusted accordingly . During training, θ will b e up dated and determined b y solving the optimization problem ˆ θ := arg min θ J ( θ ). Note that the prop osed PhyCNN arc hitecture used in this study has fiv e con volution la yers ( c = 5) with identical k ernel size and three fully-connected lay ers. Details of eac h la yer are discussed in the follo wing subsections. 2.1. Convolution L ayer The conv olution (Con v) la yer is the basis of the CNN architecture, whic h p erforms the core op erations of feature learning. The size of a con volution lay er is defined as “height × 5 width × depth × filters (output channels)”, e.g., 1 × k × p 0 × p 1 for the first Con v la yer as shown in Figure 1 . Eac h Con v lay er consists of a set of learnable kernels (also kno wn as filters) with a size of 1 × k , whic h are parameterized by a h yp erparameter called the receptiv e field containing a group of weigh ts shared ov er the en tire input temp oral space. The initial w eights of a receptiv e field are t ypically randomly generated. During the forw ard pass, the k ernels conv olv e across the temp oral space of the input and compute dot pro ducts b et w een the entries of a receptiv e field and a lo cal region of the input whic h represents a sequence of input time series. The dot pro ducts are summed, and the bias is added to the summed v alue, forming a single en try z ( l ) ij of the output. The full input space is scanned through sliding the kernels along the temp oral space with one single stride. In this w ay , the time dep endency is captured by conv olving a sequence of input across the entire temp oral space. The stride op eration will lead to smaller output length if zero padding is not applied. T o ensure the output has the same length n as the input in the temp oral space, zero-padding is added at the end of the input time series. The num ber of required zero-padding, P , is given b y P = k − 1. The dimension of the conv olution lay er output z ( l ) i can b e different from the la yer input z ( l − 1) i , where l denotes the lay er index. The num ber of filters, p , sp ecifies the dimensionalit y of the output space. F or an input feature j (i.e., or called the channels in a standard CNN), the corresp onding output of a con volution la yer can b e written as z ( l ) ij = i + k − 1 X i W ( l ) j ∗ z ( l − 1) i + b ( l ) ij (6) whic h tak es the output of the previous lay er z ( l − 1) i with zero-padding as input. Here, i represen ts the time step in the temp oral space ( i = 1 , 2 , · · · , n ); W ( l ) j is the receptive field with the k ernel size of k ; b ( l ) ij is the bias added to the summed term; and ∗ represen ts the 1D conv olution op erator. A simple example is presented in Figure 2 to illustrate the con volution op eration in the temp oral space. Herein, an input sequence with a length of n = 10 is considered, with only one filter and a receptiv e filed size of k = 5. The k ernel slides across the temp oral space with a stride s = 1, resulting in the output with a length of 10. The weigh ts of the receptive field are [1, 0, − 1, 0, 1], shared across the entire temp oral space. Con ven tionally , a con volution la yer is alw a ys follo wed b y a nonlinear activ ation function, whic h introduces nonlinearit y and makes learning easier by adapting with v ariet y of data and differen tiating b et ween the output. The activ ation lay er increases the nonlinearities of the mo del and the ov erall net work without affecting the receptive fields of the con volution la y er. Common nonlinear activ ation functions include rectified linear unit (ReLU) [ 54 ], h yp erb olic tangen t (T anh), and sigmoid function. In this pap er, the ReLU function sho wn in Eq. ( 7 ) is employ ed, which gives slightly b etter p erformance compared to T anh and sigmoid. f ( x ) = ( 0 , for x < 0 x, for x ≥ 0 (7) 6 2.2. Po oling L ayer The p ooling lay er is often used to reduce the spatial size of the feature maps when dealing with classification problems with large input data. P opular p o oling la yers include max p o oling and a v erage po oling, whic h tak e either maxim um or mean v alues from a p o oling windo w. F or example, Figure 3 shows the max p o oling op eration in a standard CNN. In Ph yCNN, po oling lay er will p erform a do wn-sampling op eration in the temp oral space, resulting in smaller output length, whic h is undesired for regression problems lik e time- series prediction. Although zero-padding can b e applied to k eep same output length as input, the time dep endencies are alternated. Therefore, the p o oling lay er is restricted in the prop osed Ph yCNN arc hitecture for structural resp onse mo deling. 2.3. F ul ly-Conne cte d L ayer Exactly as its name implies, the fully-connected (FC) la y er has full connections to all ac- tiv ations in the previous la y er, as observed in regular neural netw orks. A F C la yer m ultiplies the input b y a weigh t matrix and then adds a bias v ector. FC lay ers are typically used in the last stage of the CNN to connect to the target output la y er and construct the desired n um b er 1 2 -1 1 -3 2 1 -1 -2 1 0 0 0 0 Stride = 1 -1 3 3 -2 -6 4 3 -2 -2 1 1 0 -1 0 1 1 -2 -1 3 6 -5 -5 1 2 0 0 1 2 1 0 -1 -2 -1 0 1 Input ! Output Receptive field ( k = 5) ! " # Convolution Bias Summed value ! "# $ ! " #$% x 1 , x 2 , . . . , x 10 y 1 , y 6 , . . . , y 10 ! " # $ % & ' ( ) * + , - ) * . ! # *&' / #$% &' # 0 #) * 1 2 + 3 1 4 1 5 1 6 7 8 / 3 ! "# $ % & ' # $ ( ! " $)* + ",- )* " . "# $ / 0 % 1 / 2 / 3 4 ! "# $ Figure 2: Illustration of the con volution pro cess in a single conv olution la yer with n = 10, k = 5 and s = 1. Figure 3: An example of max p ooling operation. 7 of output classes. F or regression problems like time-series prediction, nonlinear activ ation functions such as ReLU, T anh, and sigmoid are inappropriate for the last FC lay er since they map the output in the range of [0, infinite), ( − 1, 1), and (0, 1), resp ectively . Other p oten tial alternatives include parametric rectified linear unit (PReLU) [ 55 ] and exp onen tial linear unit (ELU) [ 56 ]. In this pap er, the T anh function is used as the activ ation within the F C la yers and the linear activ ation function is applied for the output lay er. 2.4. Dr op out L ayer Drop out lay ers can b e added after eac h conv olution lay er and fully-connected lay er to reduce ov erfitting by preven ting complex co-adaptations on training data [ 57 ], whic h has remained as a common issue in machine learning. The key idea is to randomly disconnect the connections and drop units from the connected lay er with a certain drop out rate during training. Drop out la yers can also improv e the training sp eed. T ypically , they are applied b efore the FC la yer whic h has more learnable parameters and is more likely to cause o verfit- ting. Although conv olution lay ers are less likely to o verfit due to their particular structure where weigh ts are shared ov er the spatial space, drop out lay ers can still b e applied to the con volution lay ers whic h ha v e h uge parameters. In this study , drop out la y ers with a dropout rate of 0.2 are applied b efore the F C la yers. 2.5. PhyCNN for R esp onse Mo deling The proposed Ph yCNN arc hitecture tak es the ground motion (e.g., ground accelerations) as input and the structural resp onses (e.g., story displacemen ts) as output to learn the feature mapping betw een the input and output. First, the mo del is trained with either syn thetic database or field sensing measuremen ts. Then the trained mo del can b e used to predict the structural resp onses under new seismic excitations. T o train the proposed Ph yCNN architecture, b oth the input and output dataset must b e formatted as a three- dimensional arra y , where the en tries are samples in the first dimension, time history steps in the second dimension, and input or output features in the last dimension. The detailed neural netw ork arc hitecture is illustrated in Figure 1 , including five conv olution lay ers and three fully-connected lay ers in addition to the input and output lay er. Eac h conv olution la yer has 64 filters with a kernel size of 50 used in this study . The num b er of filters (no des) and k ernel length can b e adjusted to get b etter p erformance for differen t problems. Note that the num ber of no des for the last FC lay er m ust b e equal to the n um b er of output features. The entire training pro cess is p erformed in a Python environmen t using Keras [ 58 ]. Keras is a high-lev el op en source deep learning library built on top of T ensorFlo w which offers easy and fast prototyping neural netw orks. T ensorFlo w, a symbolic math library for mac hine learning applications dev elop ed b y Google Brain T eam [ 59 ], is served as the bac k end engine in Keras. It offers flexible data flow architecture enabling high-p erformance training of v arious types of neural net works across a v ariet y of platforms (CPUs, GPUs, TPUs). The simulations are p erformed on a standard PC with 28 In tel Core i9-7940X CPUs and 2 NVIDIA GTX 1080 Ti video cards. The data and co des used in this pap er will b e publicly a v ailable on GitHub at https://gith ub.com/zhry10/Ph yCNN after the pap er is published. 8 3. Numerical V alidation W e first demonstrate the p erformance of the Ph yCNN approac h for predicting structural displacemen ts through t wo numerical examples. In the first example, we assume that the field measuremen ts of all states, including x , ˙ x , and g , are a v ailable for training. Note that g can be inferred from the measuremen t of ¨ x , e.g., g = − ¨ x − Γ ¨ x g . Noteworth y , these resp onses can b e recorded from n umerical simulations when using PhyCNN for reduced order surrogate mo deling. In the second example, only the measurements of ¨ x are av ailable for training. The aim of ha ving the aforemen tioned tw o scenarios is to show the v ersatility of the prop osed Ph yCNN for dealing with v arious a v ailabilit y of measuremen t data, which, for example, tak es account for the access of field sensing measurements in real applications. In b oth examples, a single degree-of-freedom (DOF) nonlinear system sub jected to ground motion excitation is in vestigated, whose equation of motion of the nonlinear system is expressed as: m ¨ x + c ˙ x + k 1 x + k 2 x 3 | {z } h = − m Γ ¨ x g (8) where m = 1 kg is the mass, c = 1 Ns/m is the damping co efficient, k 1 = 20 N/m is the linear stiffness co efficien t, and k 2 = 200 N/m is the nonlinear stiffness co efficien t. The mass-normalized restoring force reads g = h/m . 3.1. Case 1: A vailable Me asur ements of x , ˙ x , g A synthetic database, consisting of 100 samples (i.e., indep enden t seismic sequences), w as generated by numerical simulation of the 1DOF nonlinear system excited b y a suite of earthquak e records selected from the PEER strong motion database [ 60 ] with a 10% probabilit y of exceedance in 50 y ears. Each sim ulation w as executed up to 50 seconds with a sampling frequency of 20 Hz resulting in 1,001 data p oints for eac h record. Ho we ver, only 10 datasets are randomly selected and considered as known datasets for training, while the rest are considered as unknown datasets to show the prediction p erformance. The PhyCNN arc hitecture shown in Figure 1 is implemen ted to develop the surrogate mo del. The input and output are formatted in to the shap e of [10, 1001, 1] and [10, 1001, 3] for the training datasets. T o sho w the p erformance of the prop osed approac h with ph ysics constraint, our metho d is also compared with the regular CNN without the physics loss (denoted as CNN). Figure 4 summarizes the prediction p erformance of b oth PhyCNN and CNN. Figure 4 (a) shows the regression analysis across all 90 prediction datasets for b oth PhyCNN (top- left) and CNN (b ottom-left). It can b e clearly seen that the prediction accuracy is greatly increased by embedding the ph ysics constraints in to deep learning. The time histories of predicted displacemen ts are presen ted in Figure 4 (b) corresponding four different levels of correlation co efficients (noted by r ), namely , 0.95, 0.92, 0.87, 0.61 using PhyCNN and 0.60, 0.72, 0.66, 0.37 using CNN. The Ph yCNN prediction matc hes the reference well in b oth magnitudes and phases. Even for the worst case of r = 0 . 61, the prop osed PhyCNN approac h is able to reasonably predict the structural dynamics. On the contrary , CNN pro duces less satisfactory prediction esp ecially in predicting the displacement magnitudes. Another salien t feature of PhyCNN is that it also accurately predicts the states of v elo cit y 9 0.4 0.6 0.8 1 0 0.05 0.1 0.15 0.2 0.25 0.3 0.35 0 10 20 30 40 50 -0.2 0 0.2 0 10 20 30 40 50 -0.2 0 0.2 Reference PhyCNN prediction CNN prediction 0.4 0.6 0.8 1 0 0.02 0.04 0.06 0.08 0.1 0.12 0.14 0.16 0 10 20 30 40 50 -0.2 0 0.2 0.4 0 10 20 30 40 50 -0.2 -0.1 0 0.1 Case 1 r = 0.95 Case 4 r = 0.61 Case 3 r = 0.87 Case 2 r = 0.92 Case 3 r = 0.66 Case 1 r = 0.60 Case 4 r = 0.37 Case 2 r = 0.72 Figure 4: Regression analysis in (a) and four examples of predicted displacements in (b) for unknown earthquak es using PhyCNN and CNN. ˙ x and nonlinear restoring force g , as illustrated b y the regression analysis in Figure 5 (a) and (c). Figure 5 (b) shows examples of predicted time histories of ˙ x and g using PhyCNN indicating a go o d agreement with the ground truth. The predicted nonlinearit y is giv en in Figure 6 which shows an example of the predicted h ysteresis of the normalized nonlinear restoring force v ersus displacemen t and velocity . 3.2. Case 2: A vailable Me asur ements of ¨ x only In most engineering practices, only accelerometers are installed on the building to record acceleration time histories. In suc h cases, it is imp ossible to train a standard deep learning mo del to predict structural displacements using acceleration measuremen ts only . One wa y is to calculate the displacements from the acceleration measurements first and then train a deep learning mo del based on the interpreted displacements. How ev er, it is well kno wn that inevitable large numerical errors exist due to the in tegration of accelerations to displace- men ts. This somehow limits the application of standard neural net works such as CNN in real-w orld applications. Ho wev er, with physics embedded into the training, the prop osed Ph yCNN is capable of 10 0.6 0.8 1 0 0.05 0.1 0.15 0.2 0.25 0.3 0.35 0 10 20 30 40 50 -1 0 1 0 10 20 30 40 50 -5 0 5 Reference PhyCNN prediction 0.6 0.8 1 0 0.05 0.1 0.15 0.2 0.25 0.3 0.35 Figure 5: Prediction p erformance of ˙ x and g using Ph yCNN: (a, c) regression analysis of ˙ x and g resp ectiv ely; (b) an example of predicted time history of ˙ x and g . -0.2 -0.1 0 0.1 0.2 -5 0 5 Reference PhyCNN prediction -1 -0.5 0 0.5 1 -5 0 5 Figure 6: Predicted h ysteresis of nonlinear restoring force v ersus displacemen t (left) and nonlinear restoring force versus velocity (righ t). accurately predicting the displacements based on only the acceleration measuremen ts for training. This is realized by the graph-based tensor differentiator to construct the ph ysics graph. Figure 7 shows the netw ork arc hitecture sp ecified in this study which is similar to the general state space format used in the previous study as sho wn in Figure 1 . The input to the CNN is the ground motion and the output displacement is passed into the differentiator to calculate the acceleration. The mo del will b e trained and optimized to minimize the ob jective function defined as follows based on acceleration measurements. J ( θ ) = 1 N k ¨ x p − ¨ x m k 2 2 (9) In this case, only acceleration measurements are considered as known and used to calcu- late the loss. The mo del is trained using 50 randomly selected datasets and tested with the rest 50 datasets considered as unkno wn. Figure 8 shows the predicted acceleration compared to the ground truth. It is seen that the ma jorit y of correlation co efficients are greater than 11 Structural Displacement Modeling: x = CNN( ·· x g ) Sample points ·· x g x ( t ) 1 × k × p c − 1 × p c 1 × k × p 0 × p 1 n × p 0 n × p 1 n × p c FC Layer 1 ! nodes p d FC Layer o ! nodes p o Feature Learning Layer Fully Connected Layer Output Layer Layer output size Layer output size Layer input size ·· x g ( t 1 ) ·· x g ( t 2 ) ·· x g ( t 4 ) ·· x g ( t 5 ) ·· x g ( t 3 ) ·· x g ( t n − 1 ) ·· x g ( t n ) ·· x g ( t n − 2 ) ·· x g ( t n − 3 ) ·· x g ( t n − 4 ) x ( t 1 ) x ( t 2 ) x ( t 4 ) x ( t 5 ) x ( t 3 ) x ( t n − 2 ) x ( t n − 1 ) x ( t n ) Conv Layer 1 Conv Layer c n × p d Layer output size n × p o Output size z ( t ) Filtering Deep CNN with Unknown Parameter: θ = { W θ , b θ } Di ff erentiation Input Layer x ( t ), · x ( t ), ·· x ( t ) e.g., Finite Differ ence J ( θ ) = ∥ ·· x − ·· x * ∥ θ = arg min θ J ( θ ) T otal Loss: Solution: Zero-padding Figure 7: The mo dified Ph yCNN for structural displacemen t prediction without displacemen t measuremen ts for training. The only av ailable measurements are the structural accelerations which are used to train the Ph yCNN mo del. 0.7 0.8 0.9 1 0 0.1 0.2 0.3 0.4 0.5 0.6 0 10 20 30 40 50 -10 0 10 0 10 20 30 40 50 -20 0 20 Reference PhyCNN prediction Case 2 r = 0.75 Case 1 r = 0.95 Figure 8: Prediction p erformance of structural acceleration ¨ x using PhyCNN: (a) regression analysis; (b) examples of predicted time history of ¨ x . 0.9. Tw o example acceleration time histories are presented in Figure 8 (b) with differen t lev els of accuracy . Even for the worst case with r = 0 . 75, a reasonably go o d matching in b oth magnitudes and phases is observed b et ween the PhyCNN prediction and the ground truth. Figure 9 shows the predicted displacements of the nonlinear system. F rom the re- gression analysis in Figure 9 (a), the correlation co efficien ts are mainly greater than 0.8. Figure 9 (b) sho ws the comparison of displacement time histories. It can b e clearly seen that 12 0.7 0.8 0.9 1 0 0.1 0.2 0.3 0.4 0.5 0 10 20 30 40 50 -0.2 0 0.2 0 10 20 30 40 50 -0.5 0 0.5 Reference PhyCNN prediction Case 1 r = 0.91 Case 2 r = 0.74 Figure 9: Prediction p erformance of structural displacement x using PhyCNN: (a) regression analysis; (b) examples of predicted time history of x . the Ph yCNN can pro duce accurate displacement prediction even under the circumstances that only limited acceleration measurements are a v ailable for training. This study clearly demonstrates another b enefit of the prop osed Ph yCNN in structural resp onse mo deling in the context of latent resp onse prediction. 4. Exp erimen tal V alidation of PhyCNN P erformance The Ph yCNN architecture is further demonstrated using filed sensing data. A 6-story hotel building in San Bernardino, CA, from the Cen ter for Engineering Strong Motion Data (CESMD), is selected and inv estigated [ 61 ]. The deep Ph yCNN mo del illustrated in Figure 1 w as trained for the instrumented building with ground accelerations as input and the structural displacemen ts as output. Ho w ever, the measurement data used to train the PhyCNN are the acceleration time histories only (referred to the mo dified PhyCNN in Figure 7 ). A data clustering tec hnique is prop osed to partition the data sets for training, v alidation and prediction. Based on the trained PhyCNN mo del, the serviceabilit y of the 6-story hotel building can b e further analyzed giv en new seismic inputs. 4.1. 6-Story Hotel Building in San Bernar dino, CA The 6-story hotel building in San Bernardino, California (CA) is a mid-rise concrete building designed in 1970 with a total of nine accelerometers installed on the 1st flo or, 3rd and ro of flo ors in b oth directions. The sensors, with their lo cations shown in Figure 6, hav e recorded m ultiple seismic even ts in history from 1987 to 2018. T able 1 summarizes a total of 23 av ailable datasets on CESMD used in this example. The historically recorded data is then used to train the PhyCNN. The trained surrogate mo del is then used to predict structural displacemen t time histories given new ground motions and develop a fragility function for serviceabilit y assessmen t of the building. 13 Figure 10: Sensor la yout of the 6-story hotel in San Bernardino, California (Station Number: 23287) ( h ttp://www.strongmotioncenter.org/ ). Selecting training/v alidation datasets pla ys a critical role in deep learning. Commonly , the database is divided in to training, v alidation and prediction datasets randomly (e.g., with ratios of 70%, 15%, 15%, respectively). In the case when the database is very limited, dataset partition could hav e a significan t influence on the generalizability of the trained mo del. T o extensiv ely utilize the limited sensing data in this study , an unsup ervised learning technique based on the K-means algorithm is prop osed for data clustering. T o b etter illustrate the concept, the 6-story hotel building in San Bernardino, CA is taken as an example. 4.2. K-me ans clustering Before clustering, the raw sensing measurements with differen t sampling rates and high- frequency noise w ere first prepro cessed. The measured accelerations were passed through a 2-p ole Butterw orth high-pass filter with a cutoff frequency of 0.1 Hz to remov e the low- frequency b eha vior. The displacemen t time-series are further obtained from the high-pass filtered accelerations and used to mo del the input-output (ground acceleration-structural displacemen ts) relationship. The entire historical datasets summarized in T able 1 are di- vided into training, v alidation and prediction datasets using the K-means clustering and the con vex env elop e technique discussed in the following. Both training and v alidation datasets are considered as kno wn where b oth input and output are fully given during the training pro cess, while prediction dataset is considered as unknown where only ground acceleration is given. The historical data is clustered based on b oth input excitations and output struc- tural responses. Figure 11 (a) sho ws the relationship of p eak ground acceleration (PGA) v ersus the p eak structural displacement for all datasets in logarithmic scale. It can b e seen that the p eak structural displacemen ts of most samples are less than 1 cm as shown in the green region, whic h is considered as the b oundary of interest for training. The other t wo samples in the yello w region which yield large displacement under Northridge and Landers earthquak es, are used to test the p erformance of the trained Ph yCNN mo del under a larger lev el of resp onse whose information might not b e fully co vered during training pro cess. The 21 samples within the b oundary of in terest (green region) are partitioned into sev eral 14 T able 1: Historical data information. Ind. Earthquak e Epicen ter Distance (km) PGA (g) P eak Flo or Disp. (cm) Ind. Earthquak e Epicen ter Distance (km) PGA (g) P eak Flo or Disp. (cm) T raining Dataset 1 Borrego Springs 2010 102.5 0.024 0.406 7 Beaumon t 2011 22.6 0.028 0.058 2 Dev ore 2015 18.6 0.054 0.319 8 Lahabra 2014 60.7 0.024 0.181 3 F on tana 2014 17.3 0.034 0.102 9 Loma Linda 2017 4.8 0.025 0.047 4 Inglew o o d 2009 99.4 0.008 0.052 10 On tario 2011 27.8 0.004 0.015 5 Ocotillo 2010 197.3 0.007 0.135 11 Y orba Linda 2012 50.3 0.003 0.021 6 San Bernardino 2009 5.1 0.094 0.852 V alidation Dataset 12 Banning 2016 38.2 0.019 0.102 14 Redlands 2010 11.5 0.019 0.145 13 Banning 2010 38.9 0.005 0.017 15 T rabuco Can yon 2018 40.9 0.01 0.04 Prediction Dataset 16 Beaumon t 2010 28.1 0.005 0.026 20 Dev ore 2012 23.5 0.01 0.052 17 Big Bear Lak e 2014 33.4 0.011 0.107 21 Loma Linda 2013 4.6 0.012 0.058 18 F on tana 2015 15.5 0.01 0.034 22 Northridge 1994 117.4 0.07 2.67 19 Loma Linda 2016 6.9 0.008 0.034 23 Landers 1992 79.9 0.08 9.38 clusters using the K-means algorithm [ 62 ] which is a p opular data mining approach in the unsup ervised learning setting that groups datasets into a certain num ber of clusters. It starts with the random selection of a set of k cluster cen troids, e.g., C = c 1 , c 2 , ..., c k . Next, eac h observ ation is assigned to the cluster, whose mean has the least squared Euclidean distance, given by arg min c i ∈ C dist ( c i , x ) 2 (10) where dist calculates the Euclidean distance. The new centroid is then determined by taking the mean of all the observ ations assigned to that cluster as sho wn in Eq. ( 11 ): c i = 1 | S i | X x i ∈ S i x i (11) 15 (a) (b) (c) Figure 11: Data clustering using K-means clustering: (a) ov erview of historical datasets; (b) illustration of clusters ( k = 4) and conv ex env elop e; (c) training/v alidation/prediction datasets determined based on K-means algorithm and conv ex env elop e. where S i is the set of all observ ations assigned to the i th cluster. The algorithm con verges when the cluster assignmen ts no longer change. T o determine the optimal n umber of clusters k for the given observ ations, the elbow metho d is used whic h calculates the distortions for different num b ers of clusters [ 63 ]. As shown in Figure 12 , the optimal v alue for k is determined as k = 4 where adding another cluster doesn’t giv e muc h b etter mo deling of data. The limitation of this metho d is that it cannot alw ays b e unam biguously identified. In such cases, other approac hes suc h as Silhouette [ 64 , 65 ] and Cross-v alidation [ 66 ] can b e used to find the optimal n umbers of clusters, whic h will b e inv estigated in the future work. The 21 samples in the green region are divided into four clusters shown in Figure 11 (b). A total n umber of 11 datasets are selected for training b y picking up the datasets on the con vex en v elop e whic h defines the b oundary of interest, as w ell as the datasets closest to the cluster cen troids. The v alidation datasets can b e determined b y randomly and evenly picking from eac h cluster. In this study , since the datasets in Cluster 2 and Cluster 4 are insufficien t, the v alidation datasets are selected from Cluster 1 and Cluster 3 (tw o for each). The rest 6 datasets plus the 2 datasets out of the b oundary (in yello w region) are considered as the prediction datasets to demonstrate the p erformance of the prop osed PhyCNN architecture b oth within and out of the b oundary of interest. A summary of the datasets for training, v alidation and prediction purp oses is illustrated in Figure 11 (c). The training and prediction p erformance for this 6-story hotel building is presen ted in the following subsection. 4.3. Pr e dicte d displac ements using PhyCNN The training and v alidation datasets discussed ab o ve are used to train the PhyCNN for the 6-story hotel building in San Bernardino, CA, consisting of 11 and 4 samples resp ectively , eac h of which con tains sequences (with 7,200 data p oin ts) of ground motion accelerations as input and the story accelerations as the measurement data. During training, the train- ing datasets are fed in to the Ph yCNN architecture used in the previous n umerical example in Section 3.2 with accelerations as the only field measuremen ts. The trained PhyCNN mo del is then used to predict structural displacemen ts under new earthquakes. By simply 16 0 5 10 15 20 25 0 0.002 0.004 0.006 0.008 0.01 Optimal Figure 12: Iden tification of optimal n umber of clusters at the Elbow p oin t. 0 10 20 30 40 50 60 70 -0.1 0 0.1 0 10 20 30 40 50 60 70 -0.1 0 0.1 Historical data PhyCNN prediction 3rd Floor Roof (a) 0 10 20 30 40 50 60 70 -0.04 -0.02 0 0.02 0.04 0 10 20 30 40 50 60 70 -0.04 -0.02 0 0.02 0.04 Historical data PhyCNN prediction 3rd Floor Roof (b) Figure 13: Prediction p erformance of the prop osed PhyCNN mo del. feeding a new ground acceleration into the trained Ph yCNN mo del, it accurately predicts the structural displacemen ts under that excitation. Figure 13 sho ws the predicted story displacemen ts of the 3rd flo or and ro of for Big Bear Lake 2014 and Loma Linda 2016 earth- quak es. It can b e clearly seen that the Ph yCNN prediction matc hes the historical sensing data very w ell for earthquakes with differen t magnitudes and frequency con tents. T o b etter illustrate the prediction error, the probabilit y densit y function (PDF) of the normalized error distribution defined in Eq. ( 12 ) is presen ted in Figure 14 . It can b e seen that the prediction error is mainly lo cated within 5% for the 3rd flo or and ro of with a confidence in terv al (CI) of 97% and 93%, resp ectiv ely . This demonstrates the high prediction accuracy of the prop osed Ph yCNN approac h. P = PDF y true − y predict max ( | y true | ) (12) The extrap olation ability of the prop osed Ph yCNN is further v erified using the t wo sam- 17 -10 -8 -6 -4 -2 0 2 4 6 8 10 0 50 100 150 3rd floor Roof 5% error CI = 97% CI = 93% Figure 14: Error distribution of the prediction datasets using the proposed PhyCNN model. 0 10 20 30 40 50 60 70 -1 0 1 0 10 20 30 40 50 60 70 -1 0 1 Historical data PhyCNN prediction 3rd Floor Roof (a) 0 10 20 30 40 50 60 70 -10 0 10 0 10 20 30 40 50 60 70 -10 0 10 Historical data PhyCNN prediction Roof 3rd Floor (b) Figure 15: Prediction p erformance of the prop osed PhyCNN mo del under larger seismic intensities. ples out of the b oundary interest (in the yello w region as shown in Figure 11 (a)). Figure 15 shows the predicted structural displacemen ts under Northridge 1994 and Landers 1992 earthquak es. It is observ ed that the prop osed PhyCNN mo del is able to w ell predict struc- tural resp onses for larger earthquak es, whic h offers confidence in applying the prop osed metho d for building serviceabilit y or fragility assessment. 4.4. Seismic Servic e ability Analysis of the Building The trained Ph yCNN mo del is used as a surrogate mo del for structural seismic resp onse prediction which can b e further emplo y ed to develop fragilit y functions based on certain limit states for seismic serviceabilit y analysis. The use of limit states in seismic risk assessment reflects the vulnerabilit y of the building structures against earthquakes. The serviceabilit y limit state, as one of the limit states, indicates the structural p erformance under op erational service conditions and aims to minimize any future structural damage due to relatively low earthquak es [ 67 ]. F or serviceabilit y assessmen t, the fragility function can be used to de- 18 scrib e the probability of exceedance of the serviceabilit y limit state for a sp ecific earthquak e in tensity measure (IM). The probabilit y of exceeding a given damage level (DL) is defined as a cum ulative lognormal distribution function as follo ws P (DL | IM = x ) = Φ l n ( x/µ ) β (13) where P (DL | IM = x ) denotes the probability that a ground motion with IM = x exceeds a giv en p erformance lev el (e.g., serviceability limit state); Φ ( · ) is the standard normal cum ulative distribution function (CDF); µ is the median of the fragility function (the IM lev el with 50% probability of exceeding the given DL); and β is the standard deviation of the natural logarithm of the IM whic h describ es the v ariabilit y for structural damage states. T o calibrate the fragility function, we need to estimate the parameters µ and β . Shi- nozuk a et al. [ 68 , 69 ] estimated µ and β using the maximum lik eliho o d estimation (MLE), denoted by L ( · ). In the MLE approac h, the damage state is related to a Bernoulli random v ariable. If the limit state is reac hed, y i is set as 1; otherwise, y i = 0. The lik eliho od function is given by L ( µ, β ) = N Y i =1 Φ ln ( x i /µ ) β y i 1 − Φ ln ( x i /µ ) β 1 − y i (14) where Π denotes a pro duct ov er N earthquake ground motions. Using an optimization algorithm, the tw o parameters µ and β can b e obtained when the likelihoo d function in the logarithmic space is maximized. The serviceability assessment is conducted based on the p erformance-based engineer- ing metho d. According to ASCE/SEI 41-06 standard [ 70 ], the building p erformance levels include op erational, immediate o ccupancy , life safety , and collapse preven tion. Both the op- erational and immediate occupancy p erformance level can b e considered as the serviceability limit state. ASCE/SEI 41-06 also provides the recommended v alues for the maximum in ter- story drift for each p erformance lev el and type of the structure. An alternative standard for fragility analysis is HAZUS [ 71 ], in whic h the damage states of b oth structural and non- structural comp onen ts are defined. How ev er, the inter-story drifts are typically una v ailable due to the limitation of the sensor lo cations. Instead, the drift angle, defined as the ratio of the story deflection to story height, can b e calculated and used as the threshold for service- abilit y assessmen t. T ypical v alues of the drift angle for serviceability c heck lie in the range of [1/600, 1/100] for differen t building types and materials [ 72 ]. In this pap er, the threshold of the serviceability limit state is defined as 0.5% for the maximum drift angle under the earthquak e with a 10% probabilit y of exceedance in a 50-year p erio d. F or serviceabilit y assessmen t of a building, the structural resp onses can b e predicted under a group of new ground motions using the trained PhyCNN mo del. Thus, the fragility function is obtained using Eq. ( 13 ) based on the serviceability limit state. The serviceabilit y of the 6-story hotel building in San Bernardino, CA is assessed based on the trained PhyCNN mo del describ ed in Section 4.3 . A suite of 100 ground motion 19 0 5 10 15 20 -0.4 -0.2 0 0.2 0.4 0 5 10 15 20 -0.4 -0.2 0 0.2 0.4 3rd Floor Roof (a) 0 5 10 15 20 25 30 35 40 -0.3 -0.2 -0.1 0 0.1 0.2 0.3 0 5 10 15 20 25 30 35 40 -0.3 -0.2 -0.1 0 0.1 0.2 0.3 3rd Floor Roof (b) Figure 16: Predicted structural resp onses under tw o example earthquakes using PhyCNN. 0 0.1 0.2 0.3 0.4 0.5 0 0.2 0.4 0.6 0.8 1 47% 78% 90% Figure 17: Predicted fragility curve of the serviceabilit y limit state for the 6-story hotel building in San Bernardino using Ph yCNN. records is input to the trained PhyCNN mo del to predict the structural displacements in an incremen tal dynamic analysis (IDA) setting. The 100 earthquake ground motions are selected from the PEER strong motion database [ 60 ] in the area of San Bernardino with a 10% probability of exceedance in 50 y ears. The mean resp onse sp ectrum of the selected ground motion records matc hes the design sp ectrum of the 6-story hotel building. Figure 16 sho ws the predicted displacements under tw o example new earthquakes. All the predicted displacemen ts are then used to determine the fragility function with resp ect to the service- abilit y limit state. The fragility curve of the serviceability limit state is obtained based on Eq. ( 13 ) and Eq. ( 14 ) and shown in Figure 17 . It is seen that the probabilities of exceeding the serviceability limit state are around 47%, 78%, and 90% for future earthquakes with PGA of 0.1g, 0.2g, and 0.3g, resp ectiv ely . It is noted that the data-driven fragilit y curv e can pro vide v aluable information to guide the design of main tenance and rehabilitation strategies for the building. 20 5. Conclusions This pap er presents a no vel physics-guided con volutional neural net work (PhyCNN) ar- c hitecture to develop data-driven surrogate mo dels for mo deling/prediction of seismic re- sp onse of building structures. The deep PhyCNN mo del includes sev eral conv olution la yers and fully-connected lay ers to in terpret the data, a graph-based tensor differen tiator, and ph ysics constraints. The k ey concept to lev erage a v ailable physics (e.g., the law off dynam- ics) that can pro vide constrain ts to the netw ork outputs, alleviate ov erfitting issues, reduce the need of big training datasets, and thus improv e the robustness of the trained mo del for more reliable prediction. The p erformance of the prop osed approac h w as illustrated b y b oth n umerical and exp erimental examples with limited datasets either from sim ulations or field sensing. The results show that the prop osed deep Ph yCNN mo del is an effectiv e, reliable and computationally efficient approac h for seismic structural resp onse mo deling. The trained mo del can further serve as a basis for dev eloping fragility function for building serviceabilit y assessment. Overall, the prop osed algorithm is fundamen tal in nature which is scalable to other structures (e.g., bridges) under other types of hazard even ts. Ac kno wledgement The authors would like to ackno wledge the startup funds from the College of Engineering at Northeastern Univ ersit y , which support this study . The data and codes used in this pap er will be publicly av ailable on GitHub at https://gith ub.com/zhry10/Ph yCNN after the paper is published. References [1] Y uen Ka-V eng. Bayesian metho ds for structur al dynamics and civil engine ering . John Wiley & Sons; 2010. [2] Y uen Ka-V eng. Up dating large mo dels for mechanical systems using incomplete mo dal measurement. Me chanic al Systems and Signal Pr o c essing. 2012;28:297–308. [3] Y uen Ka-V eng, Kuok Sin-Chi. Efficient Ba yesian sensor placement algorithm for structural identifica- tion: a general approach for m ulti-type sensory systems. Earthquake Engine ering & Structur al Dynam- ics. 2015;44(5):757–774. [4] Sun Hao, B ¨ uy ¨ uk¨ ozt ¨ urk Oral. Probabilistic up dating of building mo dels using incomplete mo dal data. Me chanic al Systems and Signal Pr o c essing. 2016;75:27–40. [5] Y an Gang, Sun Hao, B ¨ uy ¨ uk¨ ozt ¨ urk Oral. Impact load iden tification for composite structures us- ing Bay esian regularization and unscented Kalman filter. Structur al Contr ol and He alth Monitoring. 2017;24(5):e1910. [6] Y ang Jann N, Lin Silian, Huang Hongwei, Zhou Li. An adaptive extended Kalman filter for structural damage identification. Structur al Contr ol and He alth Monitoring: The Official Journal of the Inter- national Asso ciation for Structur al Contr ol and Monitoring and of the Eur op e an Asso ciation for the Contr ol of Structur es. 2006;13(4):849–867. [7] W u Meiliang, Smyth Andrew W. Application of the unscented Kalman filter for real-time nonlinear structural system identification. Structur al Contr ol and He alth Monitoring: The Official Journal of the International Asso ciation for Structur al Contr ol and Monitoring and of the Eur op e an Asso ciation for the Contr ol of Structur es. 2007;14(7):971–990. [8] Xie Zongb o, F eng Jiuc hao. Real-time nonlinear structural system identification via iterated unscented Kalman filter. Me chanic al systems and signal pr o c essing. 2012;28:309–322. 21 [9] Nak ata Nori, Snieder Ro el, Kuro da Seiic hiro, Ito Shunic hiro, Aizaw a T ak ao, Kunimi T ak ashi. Monitor- ing a building using deconv olution interferometry . I: Earthquak e-data analysis. Bul letin of the Seismo- lo gic al So ciety of Americ a. 2013;103(3):1662–1678. [10] Nak ata Nori, Snieder Ro el. Monitoring a building using decon volution interferometry . I I: Ambien t- vibration analysis. Bul letin of the Seismolo gic al So ciety of Americ a. 2013;104(1):204–213. [11] Nak ata Nori, T anak a W ataru, Oda Y oshiya. Damage detection of a building caused b y the 2011 T ohoku-Oki earthquak e with seismic interferometry . Bul letin of the Seismolo gic al So ciety of Americ a. 2015;105(5):2411–2419. [12] Mordret Aur´ elien, Sun Hao, Prieto German A, T oks¨ oz M Nafi, B¨ uy ¨ uk¨ ozt ¨ urk Oral. Con tin uous monitor- ing of high-rise buildings using seismic interferometry . Bul letin of the Seismolo gic al So ciety of A meric a. 2017;107(6):2759–2773. [13] Sun Hao, Mordret Aur´ elien, Prieto Germ´ an A, T oks¨ oz M Nafi, B¨ uy ¨ uk¨ ozt ¨ urk Oral. Ba yesian character- ization of buildings using seismic in terferometry on ambien t vibrations. Me chanic al Systems and Signal Pr o c essing. 2017;85:468–486. [14] Sj¨ ob erg Jonas, Zhang Qinghua, Ljung Lennart, et al. Nonlinear black-box modeling in system iden tifi- cation: a unified ov erview. Automatic a. 1995;31(12):1691–1724. [15] Braun James E, Chaturvedi Nitin. An inv erse gray-box mo del for transient building load prediction. HV AC&R R ese ar ch. 2002;8(1):73–99. [16] Moa v eni Babak, Con te Jo el P , Hemez F ran¸ cois M. Uncertaint y and sensitivit y analysis of damage identi- fication results obtained using finite elemen t model up dating. Computer-Aide d Civil and Infr astructur e Engine ering. 2009;24(5):320–334. [17] Belleri Andrea, Moa veni Babak, Restrep o Jos ´ e I. Damage assessmen t through structural identification of a three-story large-scale precast concrete structure. Earthquake Engine ering & Structur al Dynamics. 2014;43(1):61–76. [18] Y ousefianmoghadam Seyedsina, Behmanesh Iman, Stavridis Andreas, Moav eni Babak, Nozari Amin, Sacco Andrea. System identification and mo deling of a dynamically tested and gradually damaged 10- story reinforced concrete building. Earthquake Engine ering & Structur al Dynamics. 2018;47(1):25–47. [19] Sohn Ho on, F arrar Charles R, Hemez F rancois M, et al. A review of structural health monitoring literature: 1996–2001. L os A lamos National L ab or atory, USA. 2003;. [20] Kersc hen Gaetan, W orden Keith, V ak akis Alexander F, Golin v al Jean-Claude. Past, present and future of nonlinear system identification in structural dynamics. Me chanic al systems and signal pr o c essing. 2006;20(3):505–592. [21] W u Rih-T eng, Jahanshahi Mohammad Reza. Data fusion approaches for structural health mon- itoring and system identification: Past, present, and future. Structur al He alth Monitoring. 2018;:1475921718798769. [22] Bro wnjohn James MW, Xia Pin-Qi. Dynamic assessment of curved cable-stay ed bridge by model up- dating. Journal of structur al engine ering. 2000;126(2):252–260. [23] Y uen Ka-V eng, Katafygiotis Lambros S. Mo del up dating using noisy resp onse measuremen ts without kno wledge of the input sp ectrum. Earthquake engine ering & structur al dynamics. 2005;34(2):167–187. [24] W eb er Benedikt, P aultre Patric k. Damage iden tification in a truss to wer b y regularized mo del up dating. journal of structur al engine ering. 2009;136(3):307–316. [25] Song W ei, Dyk e Shirley . Real-time dynamic mo del up dating of a hysteretic structural system. Journal of Structur al Engine ering. 2013;140(3):04013082. [26] Sun Hao, Betti Raimondo. A hybrid optimization algorithm with Ba yesian inference for probabilistic mo del up dating. Computer-A ide d Civil and Infr astructur e Engine ering. 2015;30(8):602–619. [27] Sk olnik Derek, Lei Ying, Y u Eunjong, W allace John W. Identification, mo del up dating, and resp onse prediction of an instrumented 15-story steel-frame building. Earthquake Sp e ctr a. 2006;22(3):781–802. [28] Fish wic k Paul A. Neural netw ork mo dels in sim ulation: a comparison with traditional mo deling ap- proac hes. In: :702–709ACM; 1989. [29] Ediger V olk an S ¸ , Ak ar Sertac. ARIMA forecasting of primary energy demand by fuel in T urkey . Ener gy p olicy. 2007;35(3):1701–1708. 22 [30] Irie Bunp ei, Miy ake Sei. Capabilities of three-lay ered perceptrons. In: :218; 1988. [31] Hornik Kurt. Approximation capabilities of m ultilay er feedforw ard netw orks. Neur al networks. 1991;4(2):251–257. [32] Chen SABS, Billings SA. Neural netw orks for nonlinear dynamic system modelling and identification. International journal of c ontr ol. 1992;56(2):319–346. [33] Tianping Chen, Hong Chen. Appro ximations of contin uous functions by neural net works with applica- tion to dynamic system. IEEE T r ansition Neur al Networks. 1993;4(6):910–918. [34] Chen Tianping, Chen Hong. Appro ximation capability to functions of s ev eral v ariables, nonlinear func- tionals, and operators b y radial basis function neural net works. IEEE T r ansactions on Neur al Networks. 1995;6(4):904–910. [35] Zhang Jian, Sato T adanobu, Iai Susumu. No vel support v ector regression for structural system iden tifi- cation. Structur al Contr ol and He alth Monitoring: The Official Journal of the International Asso ciation for Structur al Contr ol and Monitoring and of the Eur op e an Asso ciation for the Contr ol of Structur es. 2007;14(4):609–626. [36] Yinfeng Dong, Yingmin Li, Ming Lai, Mingkui Xiao. Nonlinear structural resp onse prediction based on supp ort vector machines. Journal of Sound and Vibr ation. 2008;311(3-5):886–897. [37] Ligh tb ody Gordon, Irwin George W. Multi-lay er p erceptron based mo delling of nonlinear systems. F uzzy sets and systems. 1996;79(1):93–112. [38] Ying W ang, Chong W ang, Hui Li, Renda Zhao. Artificial Neural Netw ork Prediction for Seismic Re- sp onse of Bridge Structure. In: :503–506IEEE; 2009. [39] Christiansen Niels Hørby e, Høgsb erg Jan Beck er, Win ther Ole. Artificial neural net works for nonlinear dynamic resp onse simulation in mechanical systems. In: ; 2011. [40] Huang CS, Hung SL, W en CM, T u TT. A neural netw ork approach for structural iden tification and diagnosis of a building from seismic resp onse data. Earthquake engine ering & structur al dynamics. 2003;32(2):187–206. [41] Lagaros Nikos D, Papadrak akis Manolis. Neural netw ork based prediction schemes of the non-linear seismic resp onse of 3D buildings. A dvanc es in Engine ering Softwar e. 2012;44(1):92–115. [42] Mandic Danilo P , Chambers Jonathon. R e curr ent neur al networks for pr e diction: le arning algorithms, ar chite ctur es and stability . John Wiley & Sons, Inc.; 2001. [43] Medsk er Larry R, Jain LC. Recurrent neural netw orks. Design and Applic ations. 2001;5. [44] Y u Y ang, Y ao Houpu, Liu Y ongming. Aircraft dynamics sim ulation using a no vel ph ysics-based learning metho d. A er osp ac e Scienc e and T e chnolo gy. 2019;87:254–264. [45] Zhang Ruiy ang, Chen Zhao, Chen Su, Zheng Jingw ei, B ¨ uy ¨ uk¨ ozt ¨ urk Oral, Sun Hao. Deep long short- term memory netw orks for nonlinear structural seismic resp onse prediction. Computers & Structur es. 2019;220:55–68. [46] Cha Y oung-Jin, Choi W o oram, B ¨ uy ¨ uk¨ ozt ¨ urk Oral. Deep learning-based crac k damage detection using con volutional neural netw orks. Computer-Aide d Civil and Infr astructur e Engine ering. 2017;32(5):361– 378. [47] A tha Deegan J, Jahanshahi Mohammad R. Ev aluation of deep learning approac hes based on conv olu- tional neural net works for corrosion detection. Structur al He alth Monitoring. 2018;17(5):1110–1128. [48] W ang Zilong, Cha Y oung-jin. Automated damage-sensitive feature extraction using unsupervised con- v olutional neural netw orks. In: :105981JInternational Society for Optics and Photonics; 2018. [49] Sun Shan-Bin, He Y uan-Y uan, Zhou Si-Da, Y ue Zhen-Jiang. A Data-Driv en Response Virtual Sen- sor T echnique with Partial Vibration Measurements Using Con volutional Neural Net work. Sensors. 2017;17(12):2888. [50] W u Rih-T eng, Jahanshahi Mohammad R. Deep Con volutional Neural Netw ork for Structural Dynamic Resp onse Estimation and System Identification. Journal of Engine ering Me chanics. 2018;145(1):04018125. [51] Ciresan Dan Claudiu, Meier Ueli, Masci Jonathan, Gambardella Luca Maria, Schmidh ub er J ¨ urgen. Flexible, high p erformance con volutional neural netw orks for image classification. In: ; 2011. [52] La wrence Steve, Giles C Lee, Tsoi Ah Chung, Back Andrew D. F ace recognition: A conv olutional 23 neural-net work approach. IEEE tr ansactions on neur al networks. 1997;8(1):98–113. [53] LeCun Y ann, Bengio Y oshua, Hinton Geoffrey . Deep learning. natur e. 2015;521(7553):436. [54] Nair Vinod, Hinton Geoffrey E. Rectified linear units improv e restricted boltzmann machines. In: :807– 814; 2010. [55] Xu Bing, W ang Naiyan, Chen Tianqi, Li Mu. Empirical ev aluation of rectified activ ations in conv olu- tional netw ork. arXiv pr eprint arXiv:1505.00853. 2015;. [56] T rottier Ludo vic, Gigu Philipp e, Chaib-draa Brahim, others . Parametric exp onen tial linear unit for deep conv olutional neural netw orks. In: :207–214IEEE; 2017. [57] Sriv astav a Nitish, Hinton Geoffrey , Krizhevsky Alex, Sutsk ever Ilya, Salakhutdino v Ruslan. Drop out: a simple wa y to prev ent neural netw orks from ov erfitting. The Journal of Machine L e arning R ese ar ch. 2014;15(1):1929–1958. [58] Chollet F ran¸ cois, others . Ker as. 2015. [59] Abadi Mart ´ ın, Agarwal Ashish, Barham P aul, et al. T ensorflow: Large-scale machine learning on heterogeneous distributed systems. arXiv pr eprint arXiv:1603.04467. 2016;. [60] Chiou Brian, Darragh Rob ert, Gregor Nick, Silv a W alter. NGA pro ject strong-motion database. Earth- quake Sp e ctr a. 2008;24(1):23–44. [61] Haddadi Hamid, Shak al A, Stephens C, et al. Center for Engineering Strong-Motion Data (CESMD). In: ; 2008. [62] Ng Andrew. Clustering with the k-means algorithm. Machine L e arning. 2012;. [63] Kodinariya T rupti M, Makwana Prashant R. Review on determining num b er of Cluster in K-Means Clustering. International Journal. 2013;1(6):90–95. [64] P ollard Katherine S, V an Der Laan Mark J. A metho d to iden tify significant clusters in gene expression data. 2002;. [65] Kaufman Leonard, Rousseeuw Peter J. Finding gr oups in data: an intr o duction to cluster analysis . John Wiley & Sons; 2009. [66] Sm yth Padhraic. Clustering Using Monte Carlo Cross-V alidation.. In: :26–133; 1996. [67] Dymiotis-W ellington Christiana, Vlachaki Chrysoula. Serviceability limit state criteria for the seismic assessmen t of RC buildings. In: :1–10; 2004. [68] Shinozuk a Masanobu, F eng Maria Q, Kim Ho-Kyung, Kim Sang-Ho on. Nonlinear static pro cedure for fragilit y curv e dev elopment. Journal of engine ering me chanics. 2000;126(12):1287–1295. [69] Shinozuk a Masanobu, F eng Maria Q, Lee Jongheon, Naganuma T oshihiko. Statistical analysis of fragilit y curv es. Journal of engine ering me chanics. 2000;126(12):1224–1231. [70] Committee ASCE/SEI Seismic Rehabilitation Standards, others . Seismic rehabilitation of existing buildings (ASCE/SEI 41-06). Americ an So ciety of Civil Engine ers, R eston, V A. 2007;. [71] FEMA HAZUSMHMR. Multi-hazard loss estimation metho dology , earthquake mo del. Washington, DC, USA: F e der al Emer gency Management A gency. 2003;. [72] Griffis La wrence G. Serviceability limit states under wind load. Engine ering Journal. 1993;30(1):1–16. 24
Original Paper
Loading high-quality paper...
Comments & Academic Discussion
Loading comments...
Leave a Comment