On Distribution Patterns of Power Flow Solutions
A fundamental challenge in computer analysis of power flow is the rigorous understanding of the impact of different loading levels on the solutions of the power flow equation. This letter presents a comprehensive study of possible numerical solutions…
Authors: Dan Wu, Bin Wang, Kai Sun
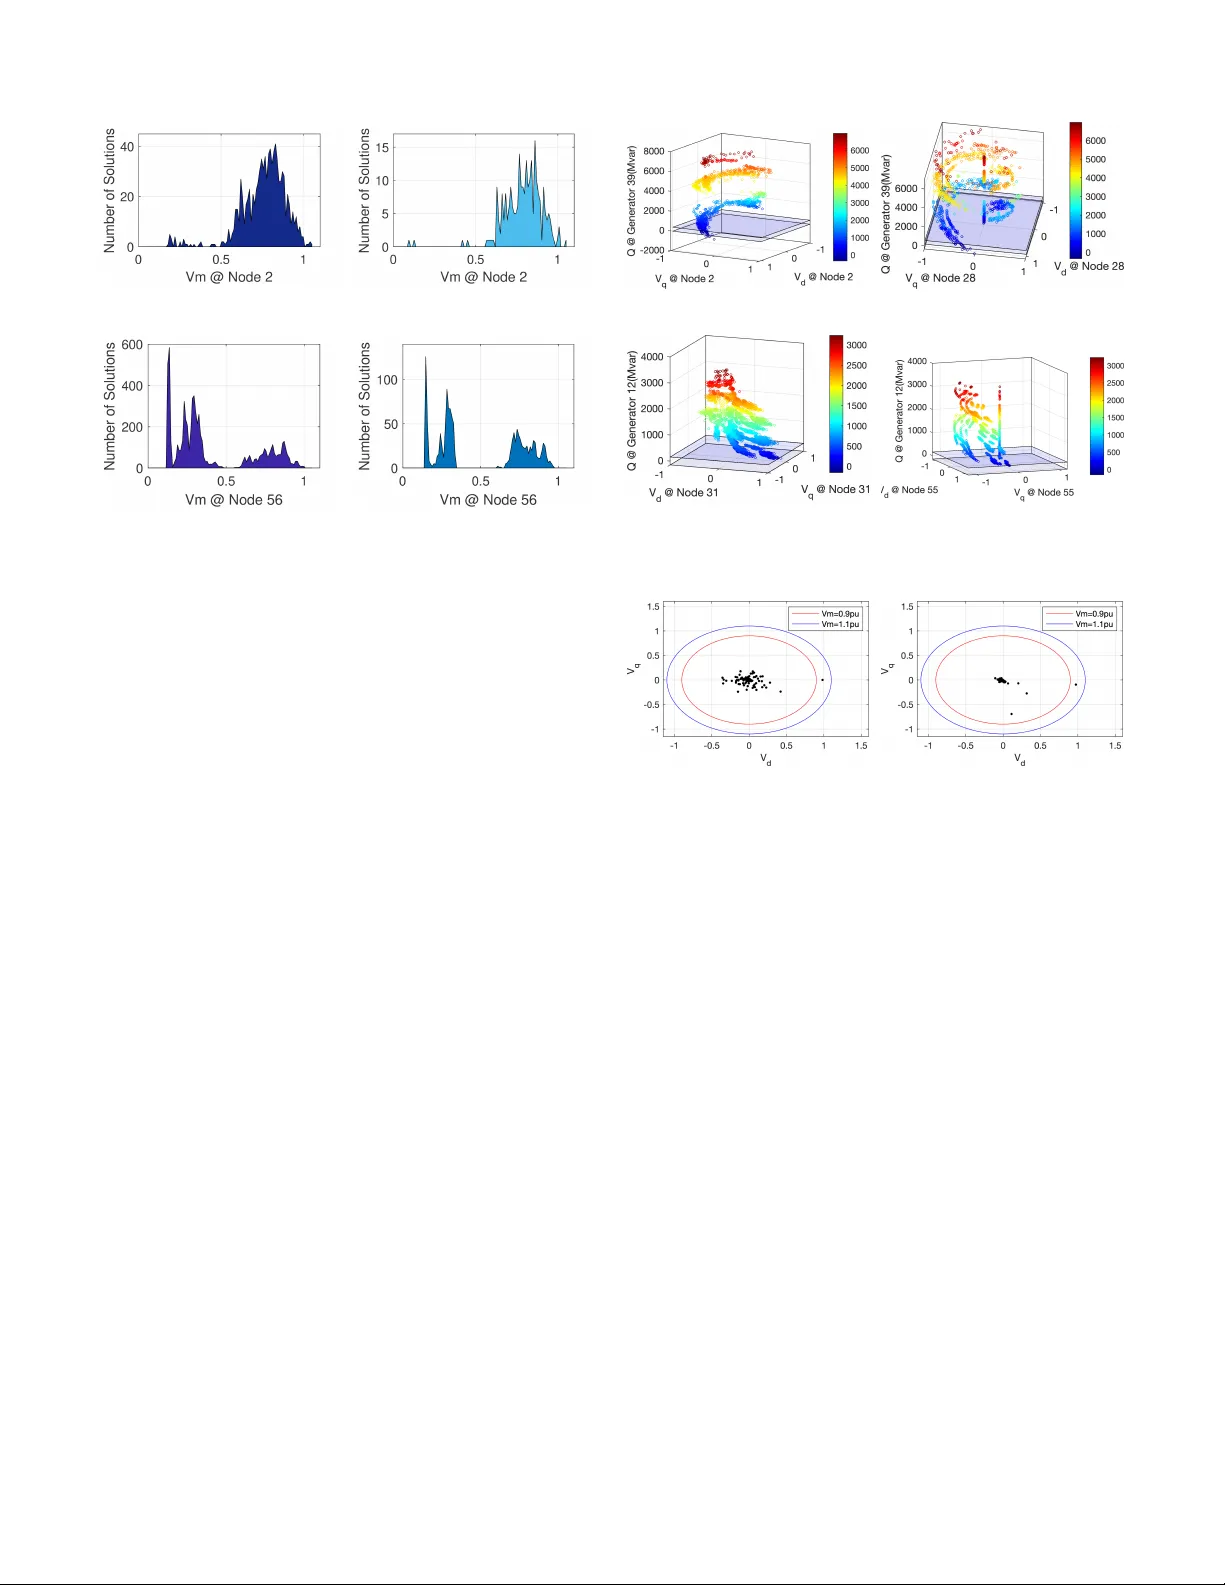
1 On Distrib ution P atterns of Po wer Flo w Solutions Dan W u, Member , IEEE , Bin W ang*, Member , IEEE , Kai Sun, Senior Member , IEEE , Le Xie, Senior Member , IEEE Abstract —A fundamental challenge in computer analysis of power flow is the rigorous understanding of the impact of different loading levels on the solutions of the power flow equation. This letter presents a compr ehensive study of possible numerical solutions that may arise as the loading level varies. In particular , a type of “false” load flow solutions is reported for the first time as a legitimate numerical solutions but with no engineering justification. The existence and the mechanism of why this category of solutions exist are rigor ously analyzed. The pr obability mass function of voltage solution is shown to be less dependent on loading levels. Furthermore, numbers of all actual solutions and those solutions within engineering limits are summarized. This letter presents a first attempt to compute such huge numbers of solutions to the tested systems, and analyze their distribution patterns. All solution sets inv estigated in this letter are posted online associated with this letter to support any further research purposes. Index T erms —Power flow , holomorphic embedding based con- tinuation, “short circuit” solution, distribution pattern I . I N T RO D U C T I O N The increasing integration of distributed energy resources and demand responses provides a great flexibility to operate power grids in a more efficient manner . Howe ver , this flex- ibility can also alter the traditional load pattern and pattern div ersity . This letter provides a comprehensi ve study to better understand the influence on the power flow solutions. It is well-kno wn that power balance equations can admit multiple solutions. Other than the high-voltage solution, most of the rest do not allo w a stable and secure operation. Ho wever , their locations and distributions conv ey important information about the underlying system, shown to be useful for both static and dynamical stability analysis [1], [2]. Finding multiple power flow solutions is not a trivial task. It was computa- tionally tractable only up to systems with 14 buses [3]. A recently developed technique, called holomorphic embedding based continuation (HEBC) method [4], pushes this boundary to a system with 57 buses. Currently , there is still a lack of theoretical proof to show if the HEBC method can find all power flow solutions. Howev er , HEBC method always gives complete solution sets in all verifiable cases [4]. This letter adopts the HEBC method to find multiple power flow solutions. T o assess potential statistical properties of power flo w solutions, a few cases, i.e. Case14, Case30, Case39 D. Wu is with the Laboratory for Information and Decision Systems, Massachusetts Institute of T echnology , Cambridge, MA, (email: danwu- mit@mit.edu). B. W ang and L. Xie are with the Department of Electrical and Com- puter Engineering, T axes A&M University , College Station, TX, (emails: binwang,le.xie@tamu.edu K. Sun is with the Department of Electrical Engineering and Computer Science, University of T ennessee, Knoxville, TN, (email: kaisun@utk.edu) and Case57, are adopted in this letter leading to a comprehen- siv e in vestigation. Their solution sets are posted online with this letter 1 . I I . “ S H O R T C I R C U I T ” S O L U T I O N S A specific type of power flo w solutions is observed. These particular solutions satisfy the power balance equations, namely the power injection model, and thus are the solutions to the power flow problem. But they do not satisfy the Kirchhoff ’ s Current Law (KCL) as explained in the following. W e refer to them as the “short cir cuit” solutions . A necessary condition for the existence of “short circuit” solution is that: a power grid has at least one transit-bus which is a special PQ-bus with zero nodal power injection. Consider the power balance equation at node- i , V i × I ? i = P i + j Q i (1) where V i ∈ C is the complex voltage at node- i , I ? i ∈ C is the conjugate of complex current at node- i , P i + j Q i ∈ C is the complex power injection at node- i . If node- i is a transit-bus, then P i + j Q i = 0 , which suggests that either V i = 0 or I i = 0 2 . When V i = 0 and I i 6 = 0 , an external current I i is supposed to enter node- i from somewhere. Since V i = 0 at this point, the solution suggests that the system is grounded at node- i . Howe ver , the system is not physically connected to the ground at node- i . Therefore, KCL fails at this solution. One can interpret this “short circuit” solution as a feasible solution to the grounded power flow problem at node- i . Reference [5] reported a numerical problem caused by “short circuit” solutions, i.e. voltage can be wrongly trapped at zero after clearing a short-circuit fault, when using power injection model in dynamic simulations. Our studies show that “short circuit” solutions are more likely to happen at a lighter loading le vel. For example, Fig. 1 shows the number of “short circuit” solutions with respect to the load scaling factor 3 . When the load increases to a certain lev el, they eventually disappear . But at low loading lev els, the number of “short circuit” solutions can be huge. For instance, in Fig. 1(a), Case30 has at least 6849 “short circuit” solutions at 10% loading lev el. A light loading level usually admits much more “short circuit” solutions because the constant loading line can intersect with many PV (QV) branches for the grounded po wer flow problem. 1 Dataset DOI provided by IEEE DataPort: 10.21227/24bh-hj72. This dataset can also be accessed at https://danwu.mit.edu/power-flo w . 2 It is possible that both V i and I i vanish to zero. Howe ver , this is rather rare and hasn’t been observed in our studies. 3 The load scaling factor scales every complex-v alued load in the system. 2 (a) Case30 (b) Case39 Fig. 1. Number of Short-Circuit Solutions “Short circuit” solutions can also occur when constant impedance loads exist. These load nodes are transit-bus, and thus can admit many such solutions at a light loading level. A simple way to av oid “short circuit” solutions is to add a small power injection, say , 10 − 5 p.u. 4 , at each transit-bus. As long as the power injection at each node- i in (1) is non-zero, neither V i nor I i is zero. I I I . N U M E R I C A L S T U DY O F S O L U T I O N D I S T R I B U T I O N This section first illustrates that the number of power flow solutions decreases with the increase of loading level. It is then sho wn that under lightly-loaded conditions, the identified solutions in each case are not randomly distributed, but exhibit distinct patterns. A scrutiny on the identified solution sets in terms of voltage magnitudes of PQ buses and reactive power of PV buses is presented. A. Number of Solutions at Differ ent Loading Levels It is expected that as the loading lev el increases, the number of power flow solutions decreases, e.g. down to two solutions right before the voltage collapse at the saddle node as illustrated in Fig. 2. On the other hand, at light loading lev els, the number of solutions can be very huge. For instance, Fig. 2(b) shows that 10% loading induces at least 25686 power flow solutions for Case30. This huge number , probably ev en greater for lighter loading or larger cases, makes it very challenging and less attractiv e to find all associated po wer flow solutions because the system stability is usually of less a concern under light loading conditions. At extremely heavy loading conditions, howe ver , the number of solutions can be very small. Therefore, it is more practical and beneficial to identify these solutions for stressed power systems. B. Node V oltage P attern An interesting observ ation is that for each test case the nodes can be clustered by a few special voltage patterns. For example, Fig. 3 depicts four basic patterns that occur in Case30, where each dot represents a voltage solution. The horizontal and vertical axes respectively represent the real and imaginary parts of the complex voltage. T able I summarizes the clusters of nodes that exhibit similar patterns as shown 4 In our simulations the power mismatch error is below 10 − 9 p.u. Hence a 10 − 5 power injection will not be confused by the error threshold. (a) Case14 (b) Case30 (c) Case39 (d) Case57 Fig. 2. Number of po wer flow solutions as loading lev el increases in Fig. 3. These structures persist as the loading condition changes. A light loading lev el, i.e. 10% , is adopted here since it giv es a suf ficient number of power flow solutions for exhibiting potential statistical properties. A common pattern omitted here is a fixed-radius circle which is associated with each PV bus. (a) Pattern 1 (b) Pattern 2 (c) Pattern 3 (d) Pattern 4 Fig. 3. V oltage Patterns for Case30 at 10% Load (25686 Solutions) T ABLE I B US G R OU P I N G B Y V O LT A GE P A T T E RN O F C A S E 3 0 Patterns 1 2 3 4 Buses 12, 14-16 17-24 9,10,25-27,29,30 3,4,6,7,28 The 39-bus system and the 57-bus system also exhibit a few distinctiv e voltage patterns. Usually , adjacent nodes are more likely to share the same pattern, but it is not always the case. Whether different patterns rev eal local structural properties of the system is an open question. But the persistence of these patterns under different loading conditions may suggest 3 (a) Case39 30% Load (b) Case39 90% Load (c) Case57 70% Load (d) Case57 100% Load Fig. 4. V oltage Magnitude Distributions a relation with the network topology . Some of the patterns are further depicted in Subsection-D with engineering limit considerations. T o rev eal the statistical characteristics of power flow solu- tions, we discretized the voltage magnitude range [0 , 1 . 1] p.u. for 100 ev en interv als, and count the number of solutions for each interval. Sample distributions are depicted in Fig. 4, which exhibits persisting patters that are consistent with the observations in fig. 3. C. Solutions within Engineering Limits Although there exist many power flow solutions, it turns out that only v ery few of them can comply with engineering limits, including bus voltage limit and generator reactiv e po wer limit. Fig. 5 extends Fig. 3 by adding the reactiv e po wer output of a certain generator as the z-axis. The two planes parallel with the plane of X − Y , representing practical reactiv e power limits, cut each 3-D space into three regions, where the region in the middle is a secure region with no reacti ve power violation. In Case39 with 10% load, there is only 1 solution (out of 1280 solutions) complying with reacti ve po wer limit at each generator . In Case57 with 70% load, only 23 out of the total 6786 solutions hav e their reacti ve power outputs on PV buses within limits. In addition, another interesting phenomenon can be observed in the 3-D plots in Fig. 5 that power flow solutions are basically distributed on a spiral surface stretching along z-axis. Fig. 6 shows that although a light loading giv es many power flow solutions, there is usually only one solution with its minimum voltage magnitude higher than 0 . 9 p.u. . It is worth mentioning that multiple high-voltage power flow solutions may exist under some special conditions or network structures [6]. I V . C O N C L U S I O N The letter sho ws the existence of “short circuit” solutions to the power flow problem and analyzes distribution patterns of (a) Node 2 of Case39 at 10% Load (b) Node 28 of Case39 at 10% Load (c) Node 31 of Case57 at 70% Load (d) Node 55 of Case57 at 70% Load Fig. 5. Bus V oltage v .s. Generator Reactive Power (a) Case39 at 10% Load (b) Case57 at 70% Load Fig. 6. Minimum Bus V oltage Magnitude of Different Solutions actual power flow solutions. All in vestigated solution sets are posted online with this letter . The presented results can serve as a benchmark for any further research purposes, including (i) inv estigation on the geometric structure of power balance equations; (ii) advanced computational methods for finding multiple power flo w solutions; (iii) applications on static voltage stability and transient stability analyses using multiple power flo w solutions. R E F E R E N C E S [1] Y . T amura, Y . Nakanishi, and S. Iwamoto, “Relationship between voltage instability and multiple load flow solutions in electric power systems, ” IEEE T ransactions on P ower Apparatus and Systems , vol. P AS-102, pp. 1115–1123, 1983. [2] H.-D. Chiang, Dir ect methods for stability analysis of electric power systems: theor etical foundation, BCU methodologies, and applications . John Wile y & Sons, 2011. [3] D. Mehta, H. D. Nguyen, and K. Turitsyn, “Numerical polynomial homotopy continuation method to locate all the power flow solutions, ” IET Generation, Tr ansmission & Distribution , vol. 10, no. 12, pp. 2972– 2980, 2016. [4] D. Wu and B. W ang, “ A holomorphic embedding based continuation- method for identifying multiple power flowsolutions, ” IEEE Access , accepted, 2019. [5] F . Milano, P ower System Modelling and Scripting . Springer , Berlin, Heidelberg, 2010. [6] H. D. Nguyen and K. S. Turitsyn, “ Appearance of multiple stable load flow solutions under power flow reversal conditions, ” in 2014 IEEE PES General Meeting — Confer ence Exposition , pp. 1–5, July 2014.
Original Paper
Loading high-quality paper...
Comments & Academic Discussion
Loading comments...
Leave a Comment