A code-free optical undersampling technique for broadband microwave spectrum measurement
A novel broadband microwave (MW) spectrum measurement (BMSM) scheme based on code-free optical undersampling and homodyne detection is proposed. The fully analog generation of optical pulses with a far-less-than-Nyquist rate is only through modulatin…
Authors: Guangyu Gao, Xueshuang Xiang, Qijun Liang
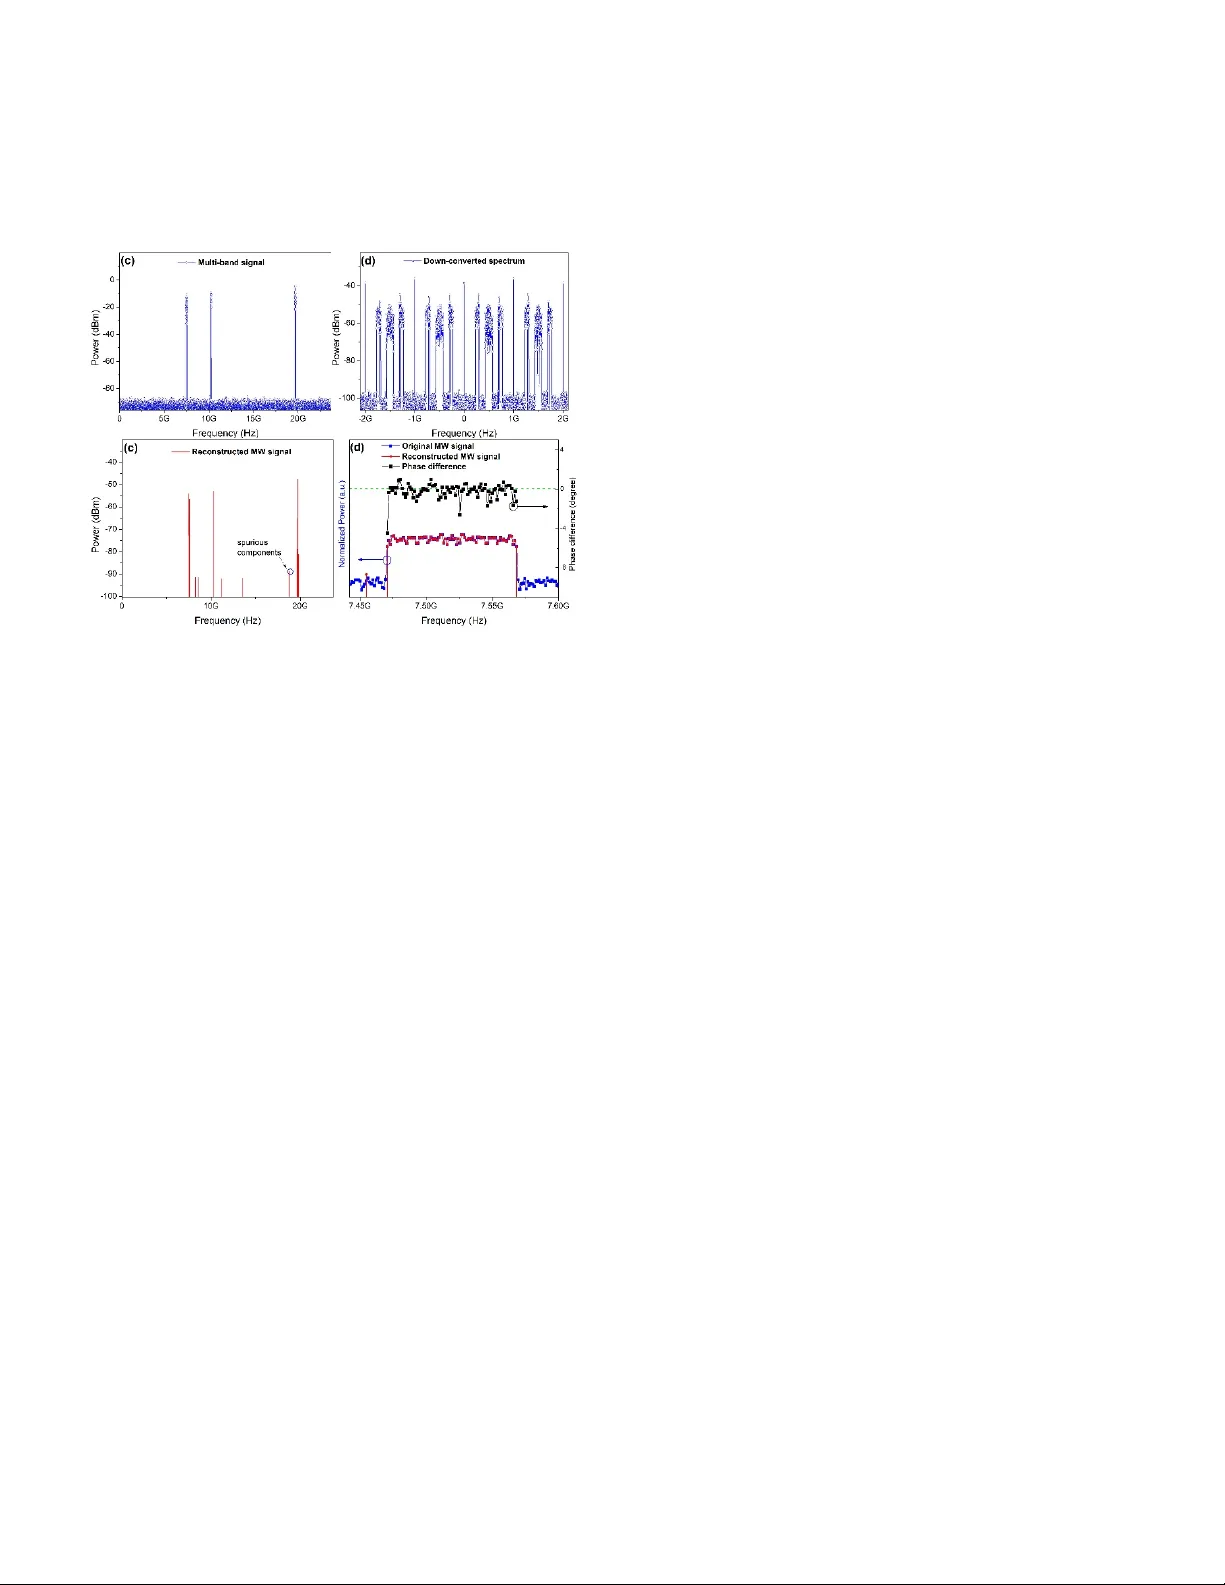
XXX-X-XXXX-XXXX-X/ XX/$ XX.00 ©20 XX I EEE A code-free optical undersampling technique for broadband microwave spectrum measurement Gua ngyu G ao Qian Xue sen L aborator y of Sp ace Technol ogy China Aca demy of Space Technol ogy Beijing, Chi na gaog uangy u@qxsl ab.cn Xu eshuang X iang Qian Xue sen L aborator y of Sp ace Technol ogy China A cademy of Space Technol ogy Beijing, Chi na xiangxu eshuan g@qxslab. cn Qijun Lia ng Qian Xue sen L aborator y of Sp ace Technol ogy China Aca demy of Space Technol ogy Beijing, Chi na liangqiju n@qxslab.c n Naijin Liu Qian Xue sen L aborator y of Sp ace Technol ogy China A cademy of Space Technol ogy Beijing, Chi na liunaijin@qx slab.c n Abstract —A novel broa dband m icrow ave (MW) spe ctrum meas ure ment (B MSM ) sche me bas ed on co de-f ree opt ical unde r- sampl ing an d homody ne det ect ion i s prop osed. T he full y anal og generation of optical p ulses with a far-less-than-Nyquist rate is only through modulating cascaded electr ooptical modulators by a sing le RF tone i nste ad of any hig h-spe ed codi ng s eque nce modu- lation. Ho modyne detectio n will reduce t he analysis ban dwidth of BM SM and en hance t he detecti on pe rfor mance of w eak sig nal. A multi-band signal w ith 20 GHz spect ral range a nd SNR = 61 dB is used t o inv estig ate t he B MSM perfor manc e of thi s sc heme, and t he results show good performanc e for BMSM. The potentials for further opti mization in practi ce are also disc ussed. Keywor ds—optica l undersa mpling, ho modyne de tection, micro wave spectrum measurement I. I NTRODUCTION Photonic techniques has been introduced into BMSM for variou s ap plicati on Scen arios in the p ast de cades as ne xt- generation s olutions to overcom e the limitations of traditi onal all-el ectric s chem es, du e to th e prom inent a dvantag es of photonic tec hniques such as broad bandwidth, lo w loss, high- efficien cy an d tun able f ilte ring and local oscill ator (LO) and intrinsic imm unity to electromagnetic inte rference [1-6]. Amon g diff erent ph ot onics -b ased BMS M sche mes , opti cal under sampling techniques as powerful solutions can sense broadband MW signa l sparse in frequenc y domain at ADC sampling rate f ar less than Ny quist rate w ith relatively sim ple archi tectu res. Recen tly , seve ral photon ics -bas ed com pres siv e sampling (CS) schemes [5-9] as a typical kind of und er- sampling techniq ues exhibit great advantage s in reducing analysis band width and data amount. Although the ADC sampling rate in th ese schemes a re largely re duced, high-speed optic al pulses w ith coding se quenc e m odul ation (e.g . pseu do- random bit s equence, PRBS) at or above Nyquist rate are s till required for incoherence sa mpling and random demodulation, which are the major bottleneck in hardware implementation for these schem es. Multi-channel me thods in [ 6-8] have been emplo yed to achieve higher op eration ba nd-widths and lower analysis band widths, but high-speed cod ing sequence and accurat e delay cont rol am ong c hannels are still requ ired, l eadin g to additional complicati ons an d penalties. In th is pape r, w e pr opos e a n ov el BMS M sc hem e base d on code -free optica l undersampling tec hnique. An OFC unit generate s code-free optical pulse s for undersampling without any coding sequence m odulation. The repetition rate of the optical sam pling pulse could be m uch low er than the Ny quist ra te as co mpared with tr aditio nal sc hemes. The homo dyne dete ction can e xtract bot h in-phase (I) a nd quadra ture (Q) compone nts of the optical sampling signal, making the measurement values in positive and negative frequenc y ranges both availabl e and great enhancing the detection performance of weak signal. A fter low-pass filtering and quantiz ation by low- speed elec trical ADC, the down-co nverted signal is fed into t he digital signal processing (DSP) unit for spectrum re construction of the broadband MW signal. II. P RI NCIPL E Fig ure 1 the sche mati c of t he pro pose d pho toni cs-bas ed BRS M sy stem The proposed scheme is sche mati cally illustrated in Fig. 1, compris ed of tw o parts, the optical fron t-en d and th e elect rical back-end. In the front end, a continuo us wave (CW) light with freq uency at ω 0 from a narrow linewidth laser is divided i nto two paths by a pow er splitter, one path is sent t o the OFC gener ator, and the other as a local oscillator (LO) is sent to the I/Q cohe rent recei ver for homodyne d etection. In the OFC generator, the C W light is el ectro-optic modulated to gene rate an OFC w ith casca ded int ensit y and phase m odul ators driven by a RF tone at f requen cy Δω . T he generated OFC are then intensity m odulated with an inte n sity modul ato r by a bro ad- band MW signal under detect ion as shown in fig 1A. Upon intensity modu lati on, a ll frequ ency componen ts of th e M W sig nal are up- conver ted on light as shown in fig 1B. these process is also named as optical s ampling, which is ex pressed in tim e domain as y ( t ) = p ( t ) × x ( t ), w here x ( t ) and y ( t ) are the rea l MW sign al befor e and af ter optic al sam plin g. p ( t ) is the optical sam pling pulses given by exp[ i ( ω 0 t + β 0 cos( 2 πΔ ft )+ π /4)] × cos( β 1 cos(2 πΔ ft ) + π / 4), w here β 0 and β 1 are resp ectively the modulation factors of the phase an d intensity m odulators. Through mixed with the LO and homodyne detec tion, th e sampled signal is down-conve rted into electrical do main and fed into the back end for digital signal processing for signal reconstr uction. The spectrum of the down-conver ted signal is expre ssed as () () () () =0 2 + + . (1 ) KI LO S k i i kK i Y A A S Xf Xf N f ∗ =− = where Y is the spectrum of the down-co nverted signal of y ( t ), ∑ ∗ is the spect rum of x ( t ), and S k is the kth comb lin e of the OFC. N ( f ) is the n oise com ponent . For a freq uency co mponent f + l Δ ω in the do wn-conver ted signal, its measured value s Y l ( l Δ ω + f ) and the symmetri c compon ent Y l ( l Δ ω - f ) can be written as () () () ( ) {} () + ++ + . ll J k jJ Yf l f Y l f f SX f j f X j f fN l f f + =− +Δ Δ − = ×Δ Δ − Δ ± (2 ) where − , , L and J ∈ , K ≥ J , j ∈ [ − J , J ], l ∈ [ − L , L ]; and for | k | > K , S k = 0; for | k | ≤ K , S k ≠ 0. Accord ing to equat ion ( 1) an d (2), the com ponents of MW signal belonging to the set ∆ will subject to freque ncy aliasing, needing suitable algorithm to reconstruct the original com ponents. Differen t from the t raditional schem es in which only th e measu rement values in a sing le sid e band a re availab le by dire ct dete ction of opti cal sam p ling s ignal , the dow n-conv erted inf orm ation in dual side bands ar e both extracted under homodyne detection as shown in fig 1C, doubl ing th e num ber of the m easurem ent valu es. Fo r an undersampling system , the down-converted signal will go through a low-pass filter (LPF) with a cut-off freq uency far less than the Nyquist rate of the M W signa l to reduce electr ic sam pling rate an d the am ounts of quan tizat ion da ta. B ased on the assum ption that the f requency response of the LPF is an i deal recta ngular function, the spectrum of the filtered signal with compo nents belonging to the set ∆ can be give n in matrix f orm Y = AX , ex pressed as 21 12 12 1 2 11 2 2 2 1 (3 ) fJ LJ LL L J L f lk k k J k J LL L L J L J fJ M SS S S Y M YS S S S YS S S S M ω ω −Δ −− + −− − − − − −− + − −− − − − − +Δ = where is a 2 2 1 measurement m a trix with ≪ , k and l ∈ −, − 1 . By combining equation 3 and the matrix form of the symmetric component ∆ − , a com bination equati on ca n be c onstruc ted with dou ble m easurement v alues over equatio n (3). Equa tion (3) and its combi nation eq uatio n are underd eterm ined and cannot be solv ed dir ectly . While i t is possible to find the unique sparsest solution or som e approx im ate s parse ones of , by given some additional crite ria [1 0- 11], p rovid ed the o rig inal spectrum is sparse to so me extent. As for BMSM scen ari o, the n onzero- value distribu ti on of th e br oad band MW spe ctr um in pra cti ce is h igh ly s pars e, normally described by multiban d models [12-13]. Thus, by adop ting a suitab le algor ithm based o n a ba sic criter ion of L0– norm op timization e xpressed in equation (4) , one ca n reco nstruct the spectrum of a n unknown broadband MW signal in a high fidelity. 0 arg min || || s.t. . ( 4) = XY A X Fig. 2. (a) The sch ematic of th e electro -opt ic-ba sed OFC generat or in front end, and (b ) the opti cal sp ectrum of OFC; PS: ph ase shi fter; EA: elect ric al ampli fier; PM: ph ase modu lator; IM: i nten sity mod ulat or. III. R E SULTS AND D ISC US SIO N The proposed scheme as shown in fig. 1 is demonstra ted by compu ter sim ulation . The power , frequ ency and lin ew idth of t he CW light is set at 16 dBm, 193.1 THz and 100 kHz. In the OFC genera tor , the phas e modu lat or an d int ensi ty m odulator bi as ed at quadra ture p oint ar e mod ulated with a RF to ne at 1 G Hz to achieve an OFC w ith spacing at 1 GHz, corres pondin g to an optical pulse s equen ce w ith far- less-than -Ny quist rat e at 1 G Hz. The phase m odulator is set with m odulation factor β 0 at 7.25 π , and the intensity modulator biased a t quadrature point is set w ith param eters of h alf-w ave volta ge at 4 V, m odul ation facto r β 1 at 0.3 π , inser tion loss at 5 dB , and e xtinction ratio at 30 dB. The phase dif fer ence betw een two m odulat ors a re 0.1 rad. By w ell setting the driving voltages an d phase dif feren ce betw een the modulators, an OFC is generated as shown in Fig. 2a, which has 47 co herent comb lines fro m − 23 th to + 23 th with flatness less than 5 dB. The generated OFC is directly used to sample the MW signal w ithout further spectral optimizati on. The bandw idths of the ph otod iod es ( PD) i s set at 2. 5 GHz. Th e down-converted signal is f urther filtere d and sampled by a low- pass f ilter w ith cut-off f reque ncy at 2 GHz and an ADC with sampling rates equa l to 4 GSa/s, w hich gives a co mpressive ratio at 10 due to the Ny quist rate of the MW signal equal to 40 G Hz. The frequency resolution is 1. 22 MHz. The performance of the proposed scheme was investigated with a m ulti-band signal gen erated by a M atlab module. Its spectra l range is from 0 to 20 GHz as shown in fig 3a, containing three wideba nd NRZ signals with carrier freque ncies and band widths respe ctively at 7.52 GHz (100 MH z), 10.25 G Hz (50 MHz), 19.7 GHz (30 MHz) and w hite noise w ith power spectral density at -146 dBm/Hz. The signal-to-noise ratio (SNR) of the MW signal is 61 dB. The spectrum of the down-co nverted signal is shown in fig 3b. 8 m easur emen t values within the range from -2G Hz to +2G Hz are used to recons truct t he signal sp ectrum. The com b lines of th e OFC us ed to construct the matrix A are selected w ithin the spectra l range as show n in fig 2a from 193.0 79 THz to 193.121 T Hz ( k = - 21 to + 21), co verring a single-side-b and range at 21 GHz far less than the Nyquist rate at 40 GHz. Fig ure 3 (a) the spectr um of the MW s ignal u nder de tectio n; (b) t he spec tru m of the d own-con verted si gnal; (c) the spec trum of t he recon struc ted signa l; (d) th e spect rum comp arison (lower c urves ) and the phas e differen ce (u pper cu rve) betw een t he or iginal wideband sig nal w ith carrie r fr equen cy at 7. 52 G Hz a nd its re constr ucted signa l The r econstruction r esults are sho wn in fig 3 c and 3d . The main frequen cy com pon ents of the MW signal w ith powers greater than th e noise fl oor T at -88 dBm were reconstructed eviden tly as s how n in fig 3c, an d most of n oise com pon ents w ere eliminated except f or several sm all spurious signals with powers slightly above T . The spec trum com parison an d ph ase dif fe rence between the original w i deband si gnal with carrier freq uency at 7.52 GHz and its reconstruc ted signal are shown in fig 3d in detail. The relative re construction error E r is 0.004 for the down- conver ted signal with noise floor at -96 dBm as sho wn in fig 3b. E r is given b y − / ‖ ‖ , w here is the reconstructed coeff icient vect or of X . The detect ion limit of the MW signal in SNR is 6 dB , and the spurious free d ynamic range (SFDR) is 59 dB (99 dB·Hz 2/3 ) not considering the spurio us signal from reco nstr uctio n error. The re sult s above i ndicate t hat the prop osed s che me is feasi ble f or BM SM. Fu rthe rmor e, t his scheme po ssesses potentials for furt her performance optim ization an d sy stem dev elopm ent in practic e, f or exam ple, the optimizati on of the measurem ent matrix based on the configur ation of OFC, the increa se of detectio n bandwidth and the increas e of the rec onst ructi on efficien cy. IV. C ONCLUS ION In conclusion, we have pro posed and demonstrated a BMSM scheme b ased on code-fr ee optical under sampling and homodyne detec tion, achieving high-fidelity spectrum recons- tructio n of an unknown broadb and sparse MW signal. The distin ct advan tages of this s chem e are th reefold . Firstly , the optical sam pling pulse w ith repetition ra te far less than the Nyquist rate is generated only by m odulating a CW laser w ith a low-freque ncy RF tone without any high-speed codi ng sequ- ence mod ulation such as high-bit-rate PRBS, brea king through the bottl enecks of tradit ional schem es on the requi remen ts for high-bit-ra te electrical devices. Secondly, the repetition rate, optical spect ral ran ge and chara cterist ics of OFC spec trum ar e easy to be reco nfigured based on various req uirements. Thirdly, the homodyne detection of optical sampling signal reduces the analysis bandwidth of BMSM and significantly enhance the detection p erformance o f weak signa l. A CK NOW L EDGM EN T This work w as sup port ed by Indepen d ent Inn ovati on Fu n d of Qia n Xuesen Labora tory of Space Te chnology, and Independe nt researc h and develop ment projects o f China Aero space Scie nce and Techno logy Corpora tion. R EFERENCES [1] S. Pan and J. Yao, “Photonics-based Broadband Microwave Measurement,” J. Light. Technol., vol. 35, no. 16, pp. 3498, 2016. [2] X. Zou, B. Lu, W. Pan, et al., “ Photonics for microwave measurements,” Laser and Photonics Reviews, vol. 10, no. 5. pp. 711, 2016. [3] G. Ga o a nd L. Lei , “ Pho ton ics -Ba sed Br oadb and RF Sp ect ru m Measurement With S liced Coherent De tection and Spectrum S titching Technique,” IEEE Photonics J., vol. 9, no. 5, pp. 1, 2017. [4] H. Emam i, M. A shou rian, and M. E bnal i-H eid ari, “Dy nami cal ly reconfigurable all optical frequency measurement system,” J. Light. Technol., vol. 32, no. 24, pp. 4194, 201 4. [5] Q. Guo, Y. Lia ng, M. C hen, H. Ch en, an d S. Xi e, “C ompr essi ve sp ectr um sens in g of rada r p uls es b as ed o n p hot onic tec hni qu es,” Opt . E xpr ess , vo l. 23, no. 4, pp. 4517, 2015. [6] H. Chi, Y. Chen, Y. Mei, et al., “ Microwave spectrum sensing based on photonic time stretch a nd compressive sa mpling,” Opt. Lett., vol. 38, no. 2, pp. 136, 2013. [7] Q. Guo, M. Che n, Y. Lia ng, H. Che n, S. Ya ng, a nd S. Xi e, “ Phot onic s- assisted compressive sampling system for wideba nd spectrum sensing,” Chinese Opt. Lett. Vol. 15, pp. 10012, 2017. [8] H. Nan, Y. Gu, and H. Zhang, “Optical analog-to-di gital conversion system based on compressive sampling,” IEEE Photonics Te chnol. Lett., vol. 23, no. 2, pp. 67, 2011. [9] H. Chi, Y. Mei, Y. C hen, et al., “Microwave sp ectral analysis based on photonic compressive sampling with random demodulation,” Opt. Lett., vol. 37, no. 22, pp. 4636, 2012. [10 ] A. M. Br uckstein, D. L. Donoho, and M. Elad, “From Sparse Solutions of Systems of E quations to Sparse Mode ling of Signals and Im ages,” SIAM Rev., vol. 51, no. 1, pp. 34–81, 2009. [11 ] S. J okar and M. Pfetsch, “Exact and approximat e sparse solutions of underdetermined linear e quations,” SIAM J. Sci. Com put., vol. 31, no. 1, pp. 23–44, 2008. [12 ] C. Herley a nd P. W. Wong, “Minimum rate sampling and reco nstruction of si gna ls wit h ar bitr ar y fr equ enc y s upp ort,” IE EE Tra ns. Inf . The or y, vo l. 45, no. 5, pp. 1555–1564, 1999. [13 ] M. Mishali and Y. C. Eldar, “From Theory to Practice: Sub-Ny quist Sampling of S parse Wideband An alog Signals,” IEEE J. Sel. Top. Signal Process., vol. 4, no. 2, pp. 375–391, 20 10.
Original Paper
Loading high-quality paper...
Comments & Academic Discussion
Loading comments...
Leave a Comment