Accurate Target Localization by using Artificial Pinnae of brown long-eared bat
Echolocating bats locate the targets by echolocation. Many theoretical frameworks have been suggested the abilities of bats are related to the shapes of bats ears, but few artificial bat-like ears have been made to mimic the abilities, the difficulty…
Authors: Sen Zhang, Xin Ma, Hongwang Lu
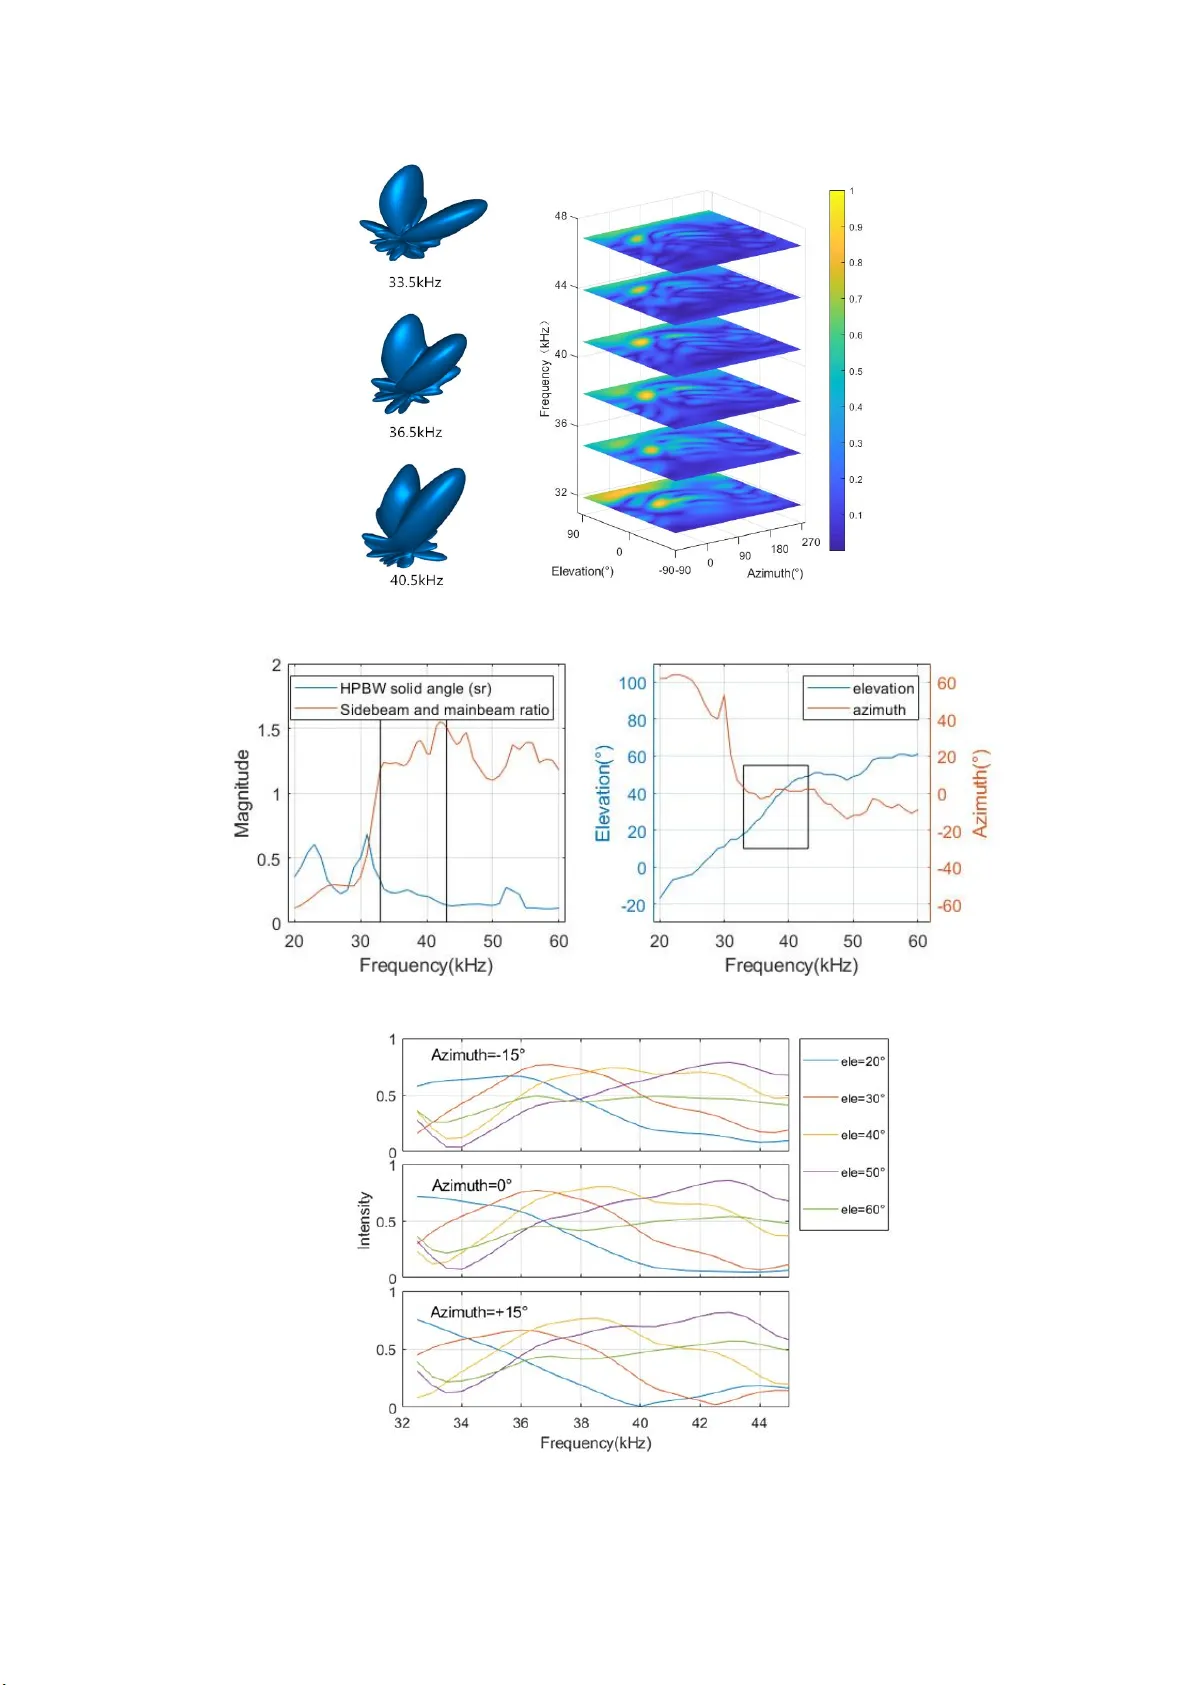
Accurate Target Localization by using Ar tificial P innae of brown long -eared bat Authors Sen Zhang 1 , Xin Ma 1,2 *, Hongwang L u 3 , Weikai He 4 ,Weidong Zhou 5 Affiliations 1 School of I nformation Science and Engineering, Shandong University, Qingdao 266237, China 2 Shenzhen Research I nstitute, Shandong University, Shenzhen 518000, China 3 School of Phy sics, Shandong University, Jinan 250022, China 4 School of Phy sics, University of Jinan, Jinan 250000, Shandong, C hina 5 S chool of Microelectronics, Shandong University, Jinan 250022, C hina Abstract Echolocating bats loca te the targets by echolocation. Many t heoretical frameworks have been sug gested the abiliti es of bats a re r elated to the shapes of bats ears, but few artificial bat-like ears have been made to mimic the abiliti es, the difficulty of which l ies in the determination of the elevation angle of the target. In this study, we present a device with artificial bat pinnae modeli ng by the ears of brown long-eared bat (Plecotus auritus) which can accurately estimate t he elevation angle of the aerial target by virtue of active sonar. An artificial neural-network wi th the l abeled data obtained from echoes as the t rained and tested data i s used and optim ized by a tenfold cross-validation technique. A decision method we named sliding window averaging algorithm is designed for getting the esti mation results of elevation. At last, a right-angle pinnae construction is designed for determining direction of t he target. The results show a higher acc uracy for t he direction determination of the single target. The results also demonstrate that for the Plecotus auritus bat, not only the binaural shapes, but the binaural relative orientations also play important roles in the target localization. MAIN TEXT Introduction The rapid development of mobile robots and flying robots emphasizes the need for new s ensory approaches for target search and obstacle avoidance. Although the machine vision can meet the basic requirements in most cases, there are always some situations, such as darkness, smoke, which are not suitable for the application of vision. Sonar sensing is an effective compl ement to the vision sensing in robot applications. Most bats can use sonar to navigate and forage or hunt for insects[1-3] , so they are also often called echolocating bats [4-8].The sonar used in echolocating bats enables them to move flexi bly in dark and complex environments , determines the ex isting of targets in space [9] and obtain location information [10].Some of the echolocating bats can discr iminate the targ et’ s angular resolution up to 1.5° [1 1].These performances of the echolocating bats have drawn great attention in the research field. Many researchers have focused on the study of the bats s onar and great progress has been m ade in the m echanism of bat’ s echolocation [12,13]. Ex tensive studies have shown the s patial information of targ ets can be obtained by analyzing the received echoes [14,15].Several studies have display the detail application of the bat-like echoes in navigati on or t arg et localizati on. For example, Y amada Y et al. designed a vehicle that could automati cally avoid obstacles mimicking bat sonar behavior [16]. Dieter V anderelst et al. conducted the scene recognition experiments by using ensonification data [ 17]. I tamar Eliakim presented a n autonomous terrestrial robot that can map a novel environment relying on echolocation data classification[18] . But we can note these bat inspi red sonar designs are quite different from real artificial bat sonar , because they lack t he pinna construction of the bat ears which can play useful roles in bat’ s target localization[19]. Also, most of the above designs are 2D sonars realized m ainly by microphone arrays time delay estimation, while the true artificial echolocating bat sonar should be able to localize realist ic targets in 3D space with a binaural bio-inspired sonar design. There are also a few research results that are closer to t he echolocating bats. Müll er et al.[20] theoretically gives the possibility of accurately locating by artificial bats in 3D. Schillebeeckx et al. [21] have designed a binaural artificial bat-li ke head for l ocalizing realist ic t arg ets and the result shows the feasibility of targets location i n 3D space. The substance of t he most of reports in bat i nspired t arg et localiz ation designs is obtaining the azimuth angle or the distance determination based on interaural time differe nce (ITD) cues [22,23] ,while in the 3D space localiz ation, the elevation estimation of the tar ge t is important whether for navigati on or tar get localization. There has not been much research on elevation features of bat ears s tructures, nor has complex information contained in echoes recei ved by the bat ears been fully ut ilized. It is best if we can find a configuration which has good directional sensitivity in the elevation while insensitive to the azimut h. Many reports have suggested that some physiological st ructures have evolved whi ch are related to the bat’ s echolocation and space directivity [ 2 4][ 2 5][ 2 6]. Among these cases , the pinnae structure of brown long-eared bat (Plecotus auritus) pinnae has its special characte ristics [ 27 , 28 ]: the side lobe of the acoustic beam formed by the pinna sweeps a spatial region with the change of frequency of the sonar, and our previous study[ 29 ] show the peak of the spatial frequency response shifts linearly wi th the elevation angle. Inspired by these characteristics, we have mimicked this approach in t he sonar device: we employ artificial 3D printed brown long-eared bat’ s pinnae with one microphone in the root of each pinna t o mimick bat’ s ears, and use an ultrasonic speaker mimicking the bat's mouth which produced frequency m odulated (FM) chirps pulse train as a typical bat, reproduce the discrimination in elevation direction. Before the work of artificial ears realizing the echolocation, first we conducted a more detailed si mulation experiment than the description in our previous work by using the fini te element method (FEM) [30] and Kirchhoff integral [31] which suppl y us more enough material for our artificial bat like work, then the bat-like artificial ears echolocati on ex periments were conducted and t he results demonstrate under the conditi on that t he two pinnae point to the same direction, active head-related spectral features of the echoes have good cluster effec ts with the elevation, while poor with the az imuth. Based on the correlation between the spectral features of the echoes and the targ et elevation, we succeed i n estimating a targ et angle (azimuth θ and elevation φ ) by making t he two pinnae perpendicular to each other . Results Our goal is to realize the accurate echolocation for single target by using bat-like artificial device, The resul ts show when t he directions of t he two pinnae are t o par allel, our approach achieved high estim ation accuracy in elevation direction; and when the two pinnae in the device are perpendicular to each other, it can be used for estimating a target angle (azimuth θ and elevation φ ). 1 S pacial Frequency characteristics of the digital Brown b ig-eared bat’s pi nna (A) (B) Fig. 1. Photos and 3D model of Plecotus auritus ear . (A) (B) (E) ( C ) ( D ) Fig. 2. Bat ear model far -field pattern. (A) Distance field lobe pattern at d iffere nt frequencies (33.5 kHz, 36.5 kHz and 40.5 kHz) from up to down. (B) Raw data of acoustic far f ield obtained using Kirchhoff integral. With change in frequency , the size and di rec tivity of the side l obe changed in elevation. (C) Half-power beam width and energy ratio of si de lobe and main lobe. (D) S ide lobe elevation and azimuth. (E) Frequency response curve of fi xed azimu th w ith elevation range f rom 20° to 60° (every 10°). The frequency response curve at different elevation presents different peaks because of f req uency scann ing characteristic. When frequency chan ges, the lob e under this f requency p oints to different directions. Frequencies spanning the entire frequency range (22 to 56 kHz in 1kHz steps) known to be covered by the biosonar pulses’ first harmonic [32] were analyzed by using numeral method (see Methods).The first side lobe i n the beam pattern (Fig. 2A,B) performs a frequency-driven scanning characteristic and a relatively strong power when the frequencies exceed 32.5 kHz. The half-power beam width (HPBW) curve is relatively large while the power of side beam is low when the frequencies are less than 30kHz (Fig. 2C).When the frequencies are less than 30kHz, the directivity of the lobe under these frequencies is not concentrated which will cause low resolution. The beam direction of the first side lobe shifts along the elevation almost linearly with the change of frequency in the band 30KHz to 60 KHz whil e azimuth of the side lobes almost maintain stable (Fig. 2D), which suggests in thi s frequency band only the elevation i nformation have strong correlation. The corresponding location of the peak in the frequency response shifts wi th the differe nt elevations because of frequency scanning characteristics of the first si de lobe (Fig. 2E). This suggests that the elevations information of a target located can be obtained by measuring t he frequency response of t he sound emitted or reflected by the targ et. According to this feature, bats' received echoe s carry differe nt features that can be used to distinguish elevation of the target, which i s relevant for this work. W e conducted an actual positi oning and extracted features of different frequencies from the resulti ng echo to locate elevation. 2 T arget echolocation by artificial bat-like sonar device Although the special information generated by virtue of scanning sidelobes have been demonstrated in the work of simulations, the phy sical verification need to be done for further ascertainment of the function, and then we have designed a bat-li ke device to determine spatial location for t he point-like target (Fig3.A) by taking advantage of the function like the Plecotus auri tus ears. 2.1 T he target angle estimation in the case of parallel pinnae (A) (B) (C) (D) (E) (F) Fig. 3. Bats sounder acquisition geometry scheme. The whole collection device is respectively bat ear model, u ltrasonic microphone, stepping motor , ultrasonic loudspeaker and support f rame f rom top to bottom. (A, B ) Actual environment (C) T op view of pl atform. (D) Spherical coordinate. (E, F) S ide view of the artificial p inna. In this section, first , we developed the biomimetric sonar device i n whi ch the of the two artificial pinnae point t o the same orientations. Then we used the artificial bat-like sonar device to emi t and receive signals and collect the data according to table 1. Inspired by special location remembering abilities of the bats [33], machine learning and statistical methods were adopted. In t he large of learning methods , BP neural network is comparatively simple and have good effects in a wide scope of applications. Based on this, in this paper , a BP neural network was trained for t he t ask of target angle identification. T able 1. Experimental parameters. ID Name Comment 1 Sampling rate 100 kHz 2 Model si ze of bat ear 3 t imes the size of the original siz e 3 Microphone distance 5 cm 4 relative posit ion between target and device 8 di ffe rent locations in section 2.1 and training data acquition of section 2.2.(see Fig.10). Random selected position 1.0-2.0 meters from target in test data acquition of section 2.2. 5 Tr ansmi ssion signal Linear frequency modulation signal 6 Frequency range 5–20 kHz 7 Passive signal duration 2 s 8 Active signal duration 5 m s 9 Azimuth rotation angle -90°–90°(step length: 7°) in section 2.1, -28°– 28°(step length: 7°) i n section 2.2. 10 Elevation rotation angle 20°–55° (step length: 5°) in section 2.1, 12–68°(step length: 7°)in section 2.2. 2.1.1 S ingle pulse target elevation estimation A set of tim e-frequencies representations were extracted from the echoes and used as i nput for the network (Methods, Fig. 4A). For testi ng the estimation accuracy of elevation under different scope of azimuth, i n thi s section, the single pulse and differe nt sets of data categor ies in every statistics (Methods, and Fig. 4C ) are adopted, the training data and the testing data are different but come from t he same dataset depicted in Method. T en-fold cross validation were conducted for getting more credible results, the means of the results of ten-fold cross validation are shown in Fig. 4B. (A) (B) (C) (D) Fig. 4. Chirp pulse, echos and the results of neural network recognition. (A) An example of an emitting signal b y the l oudspeaker and echoes received by the two ears. (B) Ratio u nder ± 5° error in 10 cross-validation cycles. 10 histograms in each cycle represent the limit scope of azimuth of traini ng s et f rom ± 0° to ± 90°respectively . Th e vertical axis repr esents the ratio of error within 5° between estimated angle and actual angle of elevation . (C) the difference between true elevation an d estimated elevation. T he top level of blue histogram stan ds for the mean of the estimation values, and b lack bar in the blue histogram stands f or the error distribution, The n eural n etwork p red icts give the best result when the limiting an gle of azimuth is concentrated close to 0°. When the scope of azimuth increased, and estimation accuracy will declin ed. (D) Correspondence between true elevation an d elevation error . The closer the average angle error was to zero and the smaller the stand ard deviation of error b ar , the b etter the training result of neural network . The lim it angle of az imuth was in the range of - N ° to + N ° which stands for t he left and the right (see F ig.3). The best elevation estimation emerged within the range ±30° of az imuth, with the ratio of estimation value with less than 5° error exceeding 80%. This result is larg ely consis tent with our simulation results. The far-field direction diagram of the bi onic bat ear beam pattern (Fig.2) indi cates that t he half-power wave lobe width of the main l obe is oriented towards a z ero-azimuth angle with a change of approximately 20°. Thi s result i s also consistent with echolocation function of actual bats. When bat ears are facing the targ et, the function of positioning is most powerful. When not facing the t arg et, bat can ensure the correct orientation angle by rotating its head and ears to face the target. W ith the increase of the az imuth range of participants in training, the estimation accuracy of t he elevation wil l decline but still remains above 60% (fig 4 B) , this mainly because t he orientation of the transmitter we used remains i n the 0° of the aspects which caused the signal-to-noise ratio (SNR) is much lower in the high azimuth than in the low azimuth. But the standard deviation of the elevation results within 20-55° almost remains stable, this indi cate although the SNR becomes poor in high elevation like in the azimut h, the correlations between sweeping frequency and the elevation are strongly maintained as long as the range of the elevation is not too larg e. 2.1.2 Improving the echolocation accuracy by using P ulse t rain Up t o now we have obtained the estimati on value of elevation from single pulse. For imitating t he pulse train used by the bats, pulse train estimation method was used and moving windows accumulation m ethod (see Methods) was designed for getting a more accurate result. Fig. 5. The error betw een the estimated elevation an d true elevation b y pu lse chain estimation, under the cond ition of different size of p ulse train (f rom left to right the number of pulses in a single p ulse train is 3 to 20) and di ffer ent level of moving w indows(from top to the bottom the size of movin g w indow size is 10, 5, 2). The horizontal and vertical axis in each small diagram repr esent li mited azimuth u sed i n traini ng set(in this fi gur e,the range is ± 70° only) and the estimated elevation (the range is 20° to 55°)respectively . Fig. 6. Pulse train based accuracy of the elevation estimation with different error range (From top to bottom: ± 1°, ± 3°, and ± 5° ) under different l imit range of azimuth. The different colors stand f or different number of pulses in one pulse train used for estimation. (b) (c) (e) (d) Azimuth θ ( ˚ ) (a) Fig 7. Th e orthogonal pinnae active sonar device . Every pi nna tilts f orward 40 degrees, so as to f orm the overlap re gion(shadow i n fig1 1) of the two pinna effective ranges for their respect ive elevation estimation. The shadow region repr esent overlap of the two p inna effective ranges for their respective elevation estimation. The actual s tatistical scope is -28 to 28° in azimuth and 12~68° in elevation as f ig 7 (e). The increase of numbers of pulses in pulse train effec tively compensates for the loss of elevation estimation caused by the larg er range of azimuth (middle and t he bottom i n Fig.6).when the number of pul ses i n one pulse train attained to 20,the elevation estimati on accuracy can achieve an accuracy of more than 95% with an error range of ±3° error (the mi ddle i n Fig.6). 2.2 T he target angle estimation in the case of orthogonal pinnae In the process of estimation of elevation described in above sections, the two pinnae of the big brown bat are parallel to each other . W e have observed that the two pinnae of the big brown bats often stretch to a certain angle when foraging. Obviously if the angle is 90, the orthogonality of the two pinnae can be utilized to obt ain the aspect angles in the two orthogonal di rections. The artificial big brown bat pinnae used in target localization are shown in Fig.7. Apart from the angle of the t wo pinnae, the other measurement conditions are same with the elevation estimation depicted in section 2.1. The training samples were obtained as illustrated in fig 10.(see Method).The total number of ehoes puls es is 65600 (In each of the eight sit es, t he orthogonal pinnae active sonar device collects 200 echo pulses from each of the 41 aspect direction ). The test data are different from the test data used i n above tests. For observing the robustness of the system used for estimati on, Robustness tests methods are designed to verify their generalization abili ties. Unlike the data set used i n cross validation depicted in section 2.2 and the Method, the robustness test ing samples are collected in the same experimental chamber but under the condition that the acquisit ion device (include t he right-angle pinnae) were placed almost in the random directions relative to the target (small ball), and t he distance between the pinnae and the ball i s almost random selecte d wi thin the range of 1.0m to 2m.the whole process is performed like section2.2, the azi muth and the elevation angle are independently clustered by BP neural network wit h 9 neurons in the hidden layer , and the moving windows accumulation m ethod (see Method) is als o used for getti ng the final estimation values. Fig.8.The statistics of the azimuth estimation (a) an d the elevation estimation (b).in the sin gle pulse test. The results shown in Fig.8 demonstrated that not only for the elevation estimation but for the azi muth esti mation can be successfull y fulfilled. For t he azimut h estimation, the estimation value is close to the mean in the adjacency of z ero-degree angle . The farther the deviation from 0 degre e in the negative direction is, the great er the negative deviation of the estimated value is, and the opposite is true in the posi tive direction. For the elevation estimati on, the estimation value is close to the mean in the adjacency of 33 degree angle, t he farther the deviati on from the 33 degree in the negative direction i s, the greater the negative deviation of the est imated value i s, and the opposi te is true in the positive direction. Fig.9.Cumulative distributions for the corresponding azimuth and elevation erro rs. The abscissa axis represents the errors that both the az imuth and elevation need meet. In our experiments. Figure 9 shows the localiz ation results under different pulse train. For the all pulse train, under 50% of all targ et angles are estimated, with an error 3 ˆ and 3 ˆ , and under 91% with an error 6 ˆ and 6 ˆ .These percentages increase as the number of pulse in these pulse trains rise. Only less than 5% error rate emerg e when the demand is 9 ˆ and 9 ˆ under the condition that number of pulses in each pulse train equals or ex ceeds 15. Obviously , usi ng pulse train can improve the estim ation results. Nonetheless, the fig.9 shows not that the m ore the number of pulses i s included in eac h pulse train, the better t he estim ation effect is. The optimal effect appears when the number of pulses in each pulse train is 10~15. Compared with the results i n s ection2.1, t he results l ook not so good. At a rough glance, the results don't seem to be so good Compared with the results in section2.1.but in fact, they have different concepts which were shown mainly in two aspect: One is the result here is the location estimation results, while the results in section 2.1 is the results of elevation estimation. Another is the difference in the test condition. In section 2.1, the bat-like device was located in the fixed eight locations surrounding the targ et, wit h a fixed distance of 1.5m to the targe t, but t he bat-like device here was located in random locations with a distance of 1-2m to the target. So the test results here own more strong generalization ability , and as the diameter of the targ et (small ball ) is 11 cm, of which the relatively excessive size may cause the l ower angular resolution, these results indicate an acceptable l ocalization accuracy over a variable distance. Discussion In this paper, firstly we carried out a FEM sim ulation of a Pl ecotus auritus’ ear model at different frequencies and have observed the frequency scanning wherein the lobe direction changes with the frequency . On this basis, we constructed a physical experimental platform in which the active sonar signals were collected. A neural network algorit hm was used to esti mate the direction of a si ngle targe t. The experimental results show for single target, this method of bat echolocation detection can achieve good results . A precise estimate of the elevation of a single targe t is achieved by using pulse train. At last, we design an orthogonal binaural structure for obtaining t he aspect angles of two orthogonal directions to perform the target posi tion localization. The results show the varieties of the binaural topological shape can compensate the ins ufficienc y of spatial information. In our experiments , we mainly m ake use of the positioning characte ristics of Plecotus auritus’ auricle at the elevation. The echo features we used are based on frequency sectionaliz ed energy . In the us e of neural network for elevation estimation, we also make estimation for azim uth and the results show for single pulse the average estimation probability of ±5° error is less than 50%,as a results, we cannot make use of pulse train to compensate. The reason may be that the energy features of binaural spectrum lack the sufficient phase information needed for the azimuth esti mation. The results also prove that for the brown long ear bats, only the elevation direction has a relatively st rong correlation with amplitude-frequency energy features of the echoes. For the az imuth estim ation, the phase information is important and there have been many literatures focus on the research, for example, m ature algorithms such as GCC and MUSIC can achieve the az imuth estimati on accuratel y , but how to successfully combine these methods with characteri stics of bat ears to achieve accurate azimuth estimation i s also a key direction of our future research. W e can find that the physical experimental results are not constant with num erical simulation results. This mi ght be caused by the following reasons: one is the differe nce betwee n bat ear physics models and the numerical sim ulation model. The material of physics models is PLA plasti c which is only partial reflection for the ultrasound while numerical s imulation m odel is defined as whole reflecti on. S econd, not like the dot sound source in the numerica l simulation, the microphone and t he horn have their size and have their own frequency characteristics and space sound field di stributions. Their placements and the non-linear characteristics of acoustic wave have also effects for the echo. Third, the effects of the frequency components are not tot ally equivalent to numerical simulation results. In addition, there are reve rberation and wall surface reflecti on in indoor space, which can make the receive signals contaminated and hard t o be used for t he targ et position. Therefore, how to improve the SNR of the echo is a problem in the echolocation. There are differenc es between t he experiments and the t rue bats’ behavior . Bats have complicated sonar constructions, and can improve the effects of sonar by many auxiliary ways such as deformations of pinna and movements of lancet. In our experiments, the actual P lecotus auritus’ ear is about 30- 34 mm, in order to put an ultrasound microphone into the ear root, the ear model i s ex panded t o t he ex tent of 3 times the size of real models, correspondingly and the frequency used in the experiments i s decr eased t o 1/ 3 for maintain almost same sound field characteristics. The material of ear model uses PLA plastic, thi s material physical and biomechanical properties are not comparable to t hose of real biological materials. Thi s may also affe ct the reflection and absorption of sound waves. The improved method is to find a smaller ultrasound microphone wit h higher accuracy , which can be put into a 1:1 ear model; Look for materials similar to real bats’ ear tissue in phy sical and biomechanical properties, which can approach real situation of echolocation of bats. From the results shown i n fig.8,9 and 10, the estimations for the elevation are affe cted by azimut h angle, but when the scope of the azimuth is limi ted to - 30° to + 30°, the estimations for the elevation are not only opt imal, but also almost no l onger affe cted by the azimuth angle. This can confirm the hypothesis that when the bat catches it s prey , firstly it wil l locate the targ et’ s azimuth, its two ears will directly face the targ et by rotating its head and changing flight direction for gett ing an accurate estimation for the elevation of the targ et. In our experiments, we also found the number of feature parameters extracted from energy of the echo spectrogram can affect the estimati on results: first wi th the increase of the number t he est imation effects can be improved in the same data set (training and t est data comes from the same data set), but the improvement is limited when the number ex ceed a certain value; second, the robustness can decreased with the number of feature .Thi s illus trates the excessive features can caused overfitting of the classifier . Apart from the ex traction of features, classifier can also bring the differe nce of the esti mation results: we have try the deep learning, cnn,bayes and BP neural network, Their results were similar within same data set but the neural network performed better effects in our robust test. In this paper, the ex periments on the binaural elevation localization of P lecotus auritus were carried out in the laboratory , and the training and t esting were carried out on a si ngle target with l ess int erference to t he experiment. Therefore, the robustness and generalizability of the system need to be further verified and enhanced. However, this result i n the case of single targ et is a first step t owards the application of space targ et localizati on by bat ears . The experimental results also prove that the use of bat sonar for l ocalization and navigation still have great development and application prospects, and its more perfect research and appli cation results are worthy of expectation. Materials and Method s 1 Numeral analyses of the Plecotus au ritus ear For getting m ore evidences that inspire us to desi gn good artificial bat-like sonar system, we conducted the numeral simulation for the Pl ecotus auritus ear by using FEM and Kirchhoff integral for the analysi s of its spacial Frequency character istics. The 3D digital model of Brown big-ear was obtained from digital image processing [34] of the Plecotus Auritus ear tomography via CT scanning (Fig. 1). W e placed sound source in the inner ear canal of the numerical m odel and performed FEM numerical calculation. Finite Element Method and Kirchhoff integral were used for obtaining the beam pattern of the digital ear in the sim ulation. First the acoustic near field inside a cuboid-shaped volume surrounding the ear were calculated using a finit e-element model consisti ng of linear cubic elements derived directly from the voxel shape representation. Then the far-field directivity pattern was calculated by projecting the complex wave field amplitudes on the surface of the finit e-element model’ s computational domain outwards using a Kirchhoff integral formulation. 2. Artifi cial Bat-like device The Artificial Bat-like Ear were produced by 3D printer by virtue of the 3D digital representation of t he shape of a pinna sample taken from the carcass of a Brown Long-Eared Bat . For avoid damaged in assembling and for fix the microphone on it, the si ze of the Artificial Bat-like Ear is 3 times as large as the original ear , As the frequency range of Plecotus Auritus ears is 60–20 kHz, acc ording to the scale model principle [ 35], and the frequency range used in our experiments was adjusted to 15–5 kHz correspondingly . A pair of ultrasonic microphones (SPU0410LR5H-QB) were placed in the inner of a pair of artificial ears and insulating glue was smeared in the gaps between the microphones and the pinna to prevent outside sound waves entering the microphones from bottom of the model, then the artificial ears were fixed to the rotating platform and tilted for ward 40°(Fig. 5C). A stepping motor (42BYGH34) was mounted under the rotating platform t o facilitate rotation of ear and measure positioni ng information at azim uth. An ultrasonic loudspeaker (Ultra Sound Gate Player BL Light, A visoft C ompany ) was fixed under the st epping mot or . 3. Data Acquisition All experiments related to the data acquisition were conducted in experimental chamber [8 (L) × 6 (W) × 3.6m (H)] (Fig. 3).No sound insulation were conducted for the chamber . The acquisition parameters are li sted in T able 1. The target to be measured was a small ball made of rubber with 1 1cm diameter suspended by a string. By controlling t he height of target, the frequency response of the ear model in differe nt direc tion could be measured. The ultrasonic signal acquisition and processing device was a signal acquisition card (PXIe-6358 and P XIe-1082, National Instrumental Company , sampli ng at 100KS/ s) which can perform multi-channel synchronous signal acquisition. In our experiments of active echolocation for targe t, we set the signal acquisition card in the work m ode of two-channel synchronous signal acquisition which can gather the bi naural signals sy nchronously . Ultrasonic loudspeaker e mits Linear frequency-modulated pulse signal (Fig. 4A), the detailed depictions of t he emitted signals in active echolocation are also l isted in T able 1. 4.Feature extraction For obtaining the effective signals for further process, first the endpoint detections were conducted in the signals recei ved by the left or the right microphones, then t he effective s ignals were transferred to time-frequency representation as ឺ ឺ ឺ (3) Where x(n) is the signal after the process of endpoint detection; and ω(n) is the window function, which shift the sound signal by a step length on the time axis. Here we use hamming windows with a length of 1ms (100 samples) as t he window function which shift step is n/2. The spectrogram representation with 0.5KHz frequency resoluti on as |X n e jω | 2 of the pulse signals received the left and right mi crophones are obtained and shown in Fig. 4A. As spectrogram energy of the chirp pulse si gnal mainly concentrates near t he diagonal line, we set zero of t he other parts of the spectrogram to suppress the effec ts of interference components. Then According to frequencies channel s t he feature representation of one spectrogram is restricted to a 30, and the left and the right echoes signals form one vectors with 60 elements for the input of classi fier . 5 Neural network Classification in active echolocation The received pulse Spectrograms are compl ex patterns which are assum ed to carry important information to di scriminate among different locations of the target. The classification and direction estimati on task is considered as a pattern recognition problem. Here a standard BP neural network which consists of an input layer with 60 neurons (30+30 i.e.,the extracted features from the signals of left and right artificial ears that are directly fed into the network) a hidden layer with 9 neurons, and an output l ay er with 1 output neuron is applied for the directions of targ et estimation. The three l ayers in the BP neural network are fully connected. The output neuron represents az imuth or elevation angle of the targ et respectively . 6. Movin g windows accumulation discrimination by vi rtue of pu lse series The activiti es of t he output neurons indi cate the respective value of t he azimuth or elevation in an analysis of one pulse. If multiple pulses for one target were analyzed by the same classifier, multi ple values of the estimati on will be outputted. Usually from the multiple values of the estim ation an opti mization method can be find and optimization value as the result of the method can be come out which l ocated at a higher l evel of confidence. This principle i s suggested why the bats locates the target by virtue of pul se train [36] [37]. For imitating t he actual signals which are often emitted by t he bats in the form of a pulse train, we designed the improved direction angle discrimination method named moving windows cumulative discrimination based on pul se train. The moving windows cumul ative method can get an optimal estimation using multiple relatively rough estimate values. For n i nitial estimate values, A P-levels moving windows cumulati ve method is depicted as follow: For n esti mated values (each value represents one sample) obtained from a certain method, s uch as BP Neural network, t he first level moving window with length L moves over the range of all the n samples with a step length l. The starting position of the window (left edge) is ali gned with the point wi th minimum value, and the ending position (right edge) is t he sampl e point wi th maximum value. Each point in t he range was set an ini tial token value y as 0. W henever the window m oves one step, the y value of each point in the window i ncreases by the number of the sampl es in t he current window . When t he window moves to the ends, we calculate the point with the maximum y value as t he optim al value of first-order moving window . If there are more than 1 poi nt with equal maximum value, t ake intermediate point of the left and the right point with maximum value as the optimum solution. Then an L/2 l ength second-level window and L/4 length third-level window estimation can also be performed up to a pt h window estimation. The number of l evels determines the accuracy of the estimation. Usually , the accuracy of the estimation is less than the half of the window’ s width. 7. Cross-valid ation In our active echolocat ion experiments (section 2.1), t he Artificial Bat-like Ear device Em its and receives 200 pulses at 8 sites surrounding the spherical targe t(fig 10).So we can select 10 group pulse as 10 pulse trains each of which contains t he same number of pul ses. W e conducted five cross-validations in each of which the number of pulses in one pulse train is 3,5,10,15,20 (fig.7). For obtaini ng more reliable results and to suppress eff ect of overfitting, tenfold cross-validation is used to test the reliability of t he neural network system along with t he established angle recognition sy stem. The detailed process is as follows: 10 combinations were analyzed, each one i ncluding a training set of 9×8 recorded pulse trains (9 pul se trains for each site ) and a testing set of 1×8 recorded pulse trains (1 pulse trains for each site) for one target locations to be estimated. Fig.10.The 8 differ ent sites surrounding the spherical target used for locating the Artificial Bat-like Ear device f or the experiments in section 2.1 and the training data acquisition in section 2.2. References 1. Neuweiler, G., & Covey , E. The biology of bats. Quarterly Review of Biology(4) (2000). G. Neuweiler, The Biology of Bats, E. Covey , trans., Ox ford U. Press, New Y ork (2000). 2. Griffin, D. R . (1958). Listening in the dark. Y ale University Press. 3. Nachtigall, P . E., & Moore, P . W . B. Animal Sonar . Springer US (1988). 4. Neuweiler, G. Foraging ecology and audition in echolocating bats. Tr ends Ecol. Evol. 4, 160-166 (1989). 5. Holland, R . A.; W aters, D. A.; Rayner, J. M. V . (2004). "Echolocation signal structure in t he Megachiropteran bat Rousettus aegyptiacus Geoffroy 1810". J ournal of Ex perimental Biology . 207 (25): 4361–4369. doi:10.1242/J eb.01288. 6. Jones G. (2005). "Echolocation". Current Biology . 15 (13): 484–488. 7.Jones, G.; Holderied, M. W . (2007). "Bat echolocation calls: Adaptation and converge nt evolution". P roceedings of the Royal Society B: Biological Sciences. 274 (1612): 905–912. 8. Fenton, M. B.; Portfors, C. V .; Rautenbach, I. L.; W aterman, J. M. (1998). "Compromises: Sound f requencies used in echolocation by aerial-feedi ng bats". Canadian Journal of Zoology . 76 (6): 11 74–1 182. doi :10.11 39/cjz-76-6-1 174 9. Griffin, Donal d R. (29 December 1944). "Ech olocation in blind men, bats and radar". Science. 100 (2609): 589–590. Bibcode:1944Sci...100..589G. 10 . Simmons, J. A. The resolution of target range by echolocati ng bats. Journal of the Acoustical S ociety of America, 54(1), 157-73 (1973). 11 . Bio-inspi red engineered sonar systems based on the understanding of ba t echolocation. 12.Manfred Kössl1, Cornelia V o ss1, Emanuel C. Mmora2, Ssilvio Mmacias2, Elisabeth Foeller1, Mmarianne V ater ,Auditory cortex of newborn bats is prewired for echolocation Nat. C ommun. 3, 773 (2012). 13 . Gareth Jones1 and Emma C. T eeling, The evolution of echolocation in bats TRENDS in Ecology and Evolution V ol.21 No.3 March 2006 149-156. 14. W otton, J. and S immons, J. A. (2000). Spectral cues and perception of the vertical position of t arg ets by the big brown bat,eptesicus fuscus. Journal of the Acoustical Society of America,107(2): 1034–1041. 15 . T ardos JD, Neira J, Newman PM, Leonard JJ. Robust Mapping and Localization in Indoor Environments Using S onar Data. The International Journal of Robotics Research. 2002; 21(4):311±330.https://doi.org /10.1 177/027836402320556340 16 . Y amada, Y ., Ito, K., Oka, A., T a teiwa, S., Ohta, T ., & Kobayashi, R., et al. Obstacle-avoidance navigation by an autonomous vehicle i nspired by a bat biosonar strategy (2015). 17 . V anderelst, D., Steckel, J., Boen, A., P eremans, H., & Holderied, M. W . Place recognition usi ng batli ke sonar. eLife,5,(2016-06-20), 5 (2016). 18 . I Eliakim, Z Cohen, G Kosa, Y Y ovel. A fully autonomous terrestrial bat-li ke acoustic robot. PLOS Computati onal Biology , 14(9):e1006406 (2018). 19 . Müller, R., Lu, H., & Buck, J. R. Sound-diffra cting flap i n t he ear of a bat generates spati al information. Physical Review Letters, 100(10), 108701 (2008). 20. Rolf Müller et al. Dynamic Substrate for the Physical E ncoding of Sensory Information in Bat Biosonar. PRL 118, 158102 (2017) 21. F . Schil lebeeckx, F . De Mey , D. V anderelst, and H. Peremans, “ Biomimetic sonar: Binaural 3d localiz ation using artificial bat pinnae,”The International Journal of Robotics R esearch, vol. 30, no. 8, pp. 975–987, 2011 . 22. Barshan, B. and Kuc, R. (1992). A bat-like sonar system for obstacle localizati on. IEEE Tr ansactions on Systems, Man and Cybernetics, 22(4): 636–646. 23.Barshan, B. and Sekmen, A. S. (1999). Radius of curvature est imation and localization of targ ets using multiple sonar sensors.Journal of t he Acoustical Society of America, 105(4):2318–2331. 24 . Ear Deformations Give Bats a Physical Mechanism for FastPhysRevLett.107.214301. 25 . He, W ., Pedersen, S. C., Gupta, A. K., Sim mons, J. A., & Müller, R. Lancet dynamics in greater horseshoe bats, rhinolophus ferrumequinum. Plos One, 10(4), e0121700 (2015) 26 . Zhiwei Zhang , Son Nguyen Tr uong , and Rolf Mi iller ,Ac oustic Effects Accurately Predict an Extreme Case of Biological Morphology ,Plays . Rev . Lett . , 2009 , 7 , 103(3) : 038701 — 1 — 038701 . 4 . 27. R olf Miill er ,Hongwang Lu , Zhiwei Zhang , and John R . Buck , Frequencyswept directivity lobes·-An emer ging functional principle of biosonar beamforming(A) . J . Acoust . Soc . Am . , 2007 , 1l , 122 : 2946 . 28 . Entwistle, A. C., Racey , P . A., & Speakman, J. R. Habitat exploitation by a gleaning bat, plecotus auritus. Philosophical Tr ansactions of the Royal Society of London B, 351(351), 921-931 (1996). 29. Experimental Analysis of S pace Acoustic Field Positioning Characteristics of Plecotus Auritus Pinna Model.Sen Zhang , Xin Ma , Y ufeng Pan , Hongwang Lu. Proceedings of Internati onal Conference on Geo-spat ial Knowledge & Intelligence 2017, Bei jing, P .R. China, C CIS, volume 84 30 . Bathe, K. Finite Element Method. W iley Encyclopedia of Com puter Science and Engineering. John Wil ey & Sons, Inc. (2000). 31 . Kraus, H. G. Huygens –fresnel–kirchhoff wave-front diffra ction formulation: spherical waves. Journal of the Optical Society of America A, 6(8), 1 196-1205 (1989). 32 . M. K. Obrist, R. Boesch, and P . F . Flu¨ckiger, Mammalia 68,307(2004). 33 . Barchi, Jonathan R.; Knowles, Jeff rey M.; Si mmons, James. Spatial memory and stereotypy of flight paths by big brown bats in cluttered surroundings A. Journal of Experimental Biology vol 216.(6) 1053-1063 2013. 34 . Likhachov , A. V ., & P ickalov , V . V . Modification of feldkamp algorithm for bifocal tom ography . (2002). 35 . Muncey , R. W . The use of three-dimensional models in room acoustics. Journal of the Acoustical Society of America, 22(4), 510-511 (1950). 36 . Benedikt Grothe , El len Covey , John H C asseday Medial Superior Olive of the Big Brown Bat: Neuronal Responses to Pure T ones, Ampli tude Modul ations, and Pulse Tr ains, Journal of Neurophysiology 86(5):2219-30 · December 2001. 37 . Annette Denzinger and Hans-Ulrich Schnitzler .Bat guilds, a concept t o classify the highly diverse foraging and echolocation behaviors of m icrochiropteran bats.Front. Physiol., 03 July 2013 ht tps://doi.org/10.3389/fphy s .2013.00164 Acknowledgments Funding: This work was supported by the National Natural Science Foundation of China for from Grant No. 61271453, the Shandong P rovincial Key R&D Program 2017GGX101 13, Shenzhen science and t echnology research and development funds (No.JCYJ2017081810401 1781), the National Natural S cience Y outh Foundation of China for from Grant No. 1 1704154. Author contributi ons Sen Zhang: Detailed sim ulation and hardware experiment, and paper writing. Xin Ma: The general idea of the article, ex perimental guidance and financial support. Hongwang Lu: Provide ear model of Plecotus auritus and numerical simulati on calculation. W eikai He: Print 3D m odel, prepare experiment equipment and guide part of experiment. W eidong Zhou: Guide neural network theory . Competing i nterests The authors declare no competing interests. Correspondence and requests for materials should be addressed to Xin Ma. (max@sdu.edu.com)
Original Paper
Loading high-quality paper...
Comments & Academic Discussion
Loading comments...
Leave a Comment