Real time state monitoring and fault diagnosis system for motor based on LabVIEW
Motor is the most widely used production equipment in industrial field. In order to realize the real-time state monitoring and multi-fault pre-diagnosis of three-phase motor, this paper presents a design of three-phase motor state monitoring and faul…
Authors: S.Q. Liu, Z.S. Ji, Y Wang
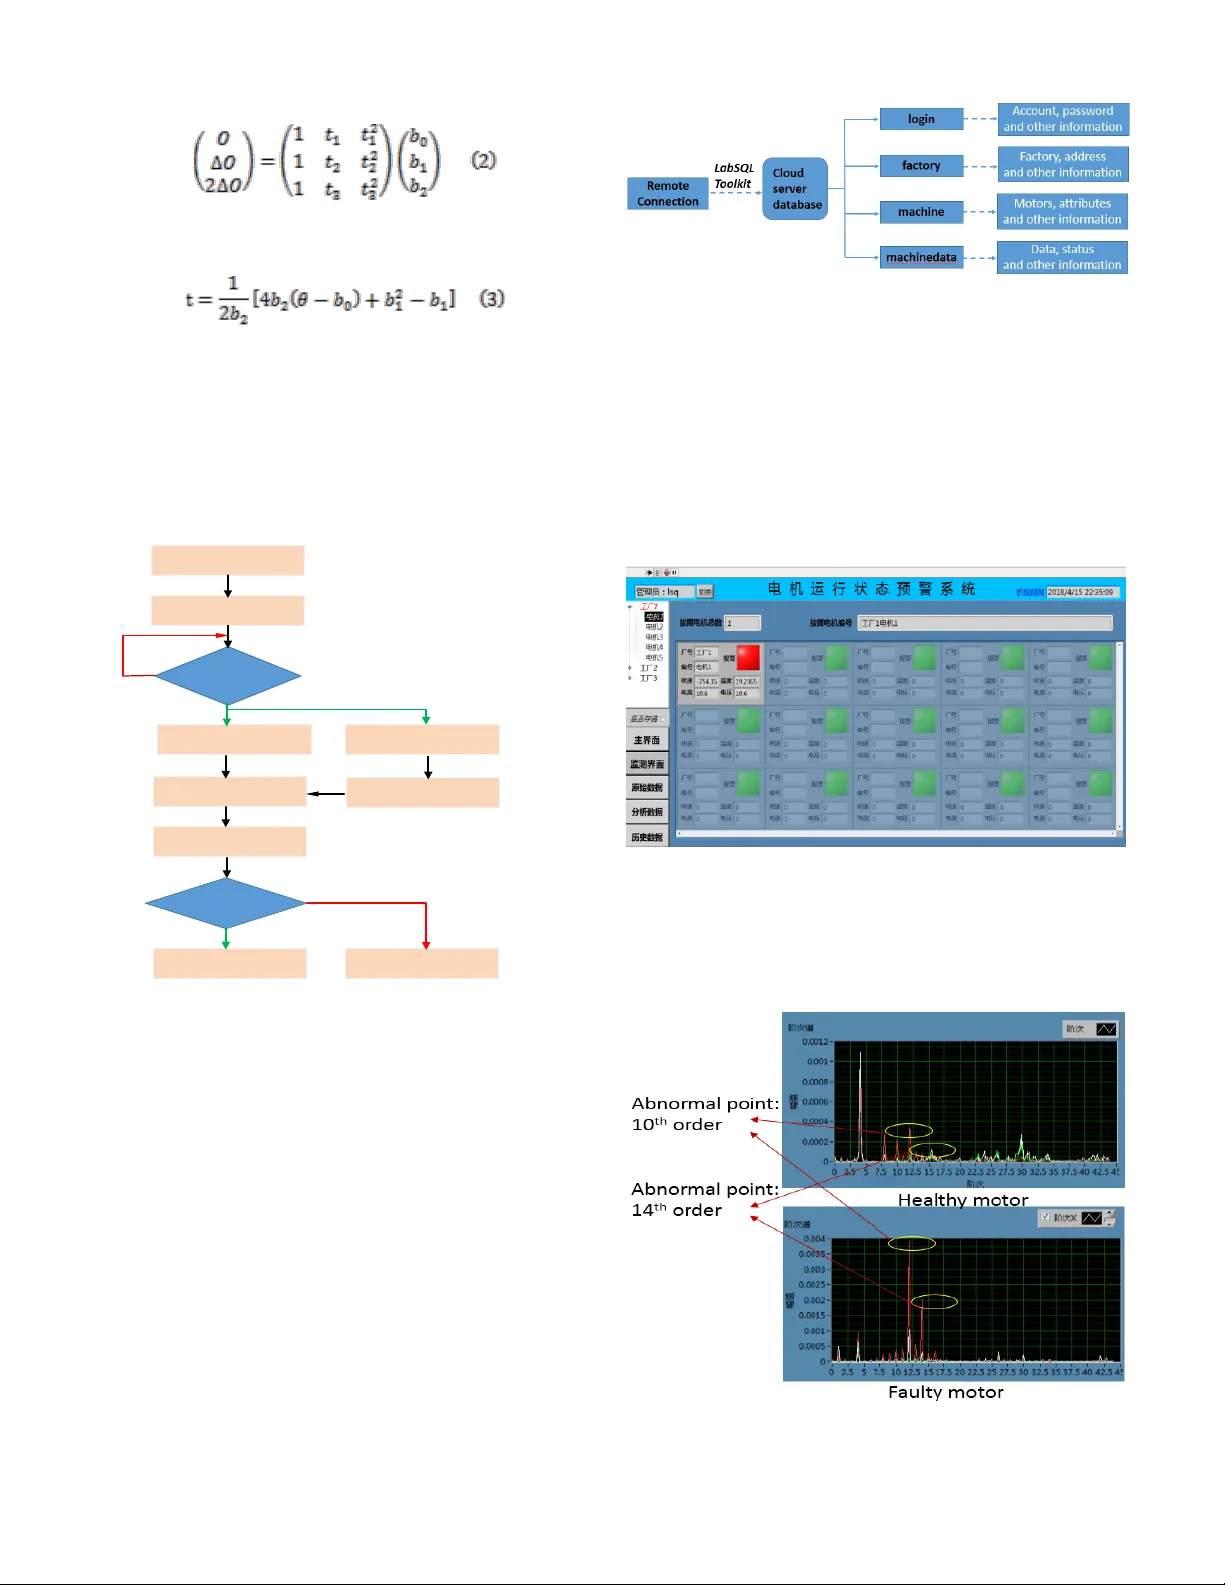
1 Abstract — Motor is the m ost widely u sed production equipment in industrial field. In order to realize the real-ti me state monitoring and m ulti-fault pre-diagnosis o f th ree-phase m otor, th is pape r presents a de sign of three-phase motor state mon itoring and fault diagnosis system based on LabVIEW. The multi-dimensional vibration acceleration, rota tional speed, temperature, current and voltage signals of the motor are collected with NI cDAQ acquisition equipment i n real ti m e an d high speed. At the sa me ti m e, the m odel of m otor health state and fault state is established. The order a nalysis a lgorithm is used to analyze th e data at an advanced level, and the diagnosis and classification of different fault types are realized. The system is equipped with multi-channel acquisition, display, analysis and storage. Combined with the current cloud transmission technology, w e wil l back up the data to the clou d to be used by other terminals. I. I NTRODUCTI ON n today’s ma nufacturing industries, mec hanical and electromechanical systems are driven by electric moto rs on the premises [1]. Any small f ault occurred in a m otor will led to complete motor failure if not addressed in time[2].In recent years, with the develop ment of sensor tech nology and si gnal processing tec hnology, such a s filtering tec hnology, spectrum analysis tech nology and so on, the motor fault diagnosis is becoming more and more per fect. In or der to ensure real -time data access and d ata integrity, the s ystem is b uilt with two lay ers producer and consumer frame. The key requirements of the state m onitoring and fault diagnosis system are listed as follows: 1. Measure the real-ti me parameters of the moto r , including triaxial acceleratio n, ro tational speed, te m perature, working current and volta ge, at 1KSPS to 25 KSP S sampling rate per chann e l. 2. Process the ra w data. After filtering and a m pli fying, the data can be transformed into actual physica l quantities. 3. Display t he actual p arameters and state of the motor on the monitoring interface of the Industrial Personal Computer (IPC). This w ork is su pported b y the Nation al N a tural S cience F oundation of China under Gr ant No.11505239. S.Q. Liu is with the I nstitute of Plasma Physics, Chinese Academy of Sciences, Hefei, Anhui, China; and also with University of Sci ence and Technolo gy of China, Hefei, China (telephone: 86 -551-655923 97; e-mail: shqliu@ipp.ac.c n). Z.S. Ji, Y. Wang, Z.C. Zhang are with t he I nst itute of Plasma P h y si cs, Chinese Academy of Sciences, 350 Shus hanhu Road, Hef ei, Anhui 23003 1, P. R. China. 4. Analyze t he cr itical state o f each param eter and the specific fault source of moto r by multiple anal ysis algorithm. 5. Archive all of data in the M y SQ L database on loca l and Ali cloud servers at inter vals of 10ms. II. S YSTEM S TRUCTURE According to the above req uirements, t he state monitoring and fault diagnosis system includes the follo wing functions: Real-time data a cquisition Data processing and analysis State m onitori ng Data archiving and managing The system’s architect ure is as shown i n Fi g. 1. The system acquires data of sensors on healt hy motor and faulty motor through NI cD AQ acq uisition d evice. Af ter processing and analysis, the data will b e displayed o n the monitoring interface of the IPC. All parameters and state infor mation are stored in the MySQL database o n local and Alibaba cloud server. He a lt hy Mo tor Fa u lt y Mot or NI cDA Q ac q ui siti on e quipm ent D a t a A c q u i s i t i o n Triaxial accelera tion Rotation rate Temperatu re Eddy cur rent displace ment Current and voltage Pr o ce ssed si gnal Da ta p r o ce s si ng a nd an alys i s U p p e r M o n i t o r In terf a c e di spla y D ata st orag e Ba ck u p to th e cl oud Di agno s ti c re s ul ts Fig. 1. System arc h ite cture A. Real- tim e d ata acquisition The system ac quires the signals of the underlying sensors from NI cDAQ acquisitio n equip m ent i n real time, and transmits the signals to the IPC based on the TCP /IP pr otocol Real time state monitoring and fault diagnosis system for motor based on LabVIEW 1 S.Q. Liu, Z.S. J i, Y Wang , Z.C. Zhang I 2 [3]. T he system samples the vibratio n signal at a maxim um sampling rate of 25KSPS. For other signals, the system sa m ples from 1SPS to 1 0KSPS. B. Data pro cessing and analysis The system processes t he raw data by filtering and amplifying. It uses ord er analysis to analyze the acceleratio n and speed signal. T hreshold analysis is used to analyze other signals. The final results o f the analysis of the motor w il l be obtained by comprehensive a nalysis. C. State monitoring The system displa ys the actual physical quantities and state on th e m onitoring interface of the IPC. For abnormal parameters, th e system will give corresponding prompts through the alar m indicator . At the same ti me, the user can choose to view the real ti m e par ameter waveform. D. Data a rchiving and managing The system archives all of data in M ySQL datab ase at intervals of 10 ms . In or der to achieve multi-po int bac ku p, the system arc hives data on local and Alibaba cloud server. At the same time, in or der to facilitate the user to view the d ata, the corresponding data m a nagement functions are d esigned. III. S YSTEM I MPLEMENTATI ON A. Hardware Structure Fig. 2 shows the main hard w ar e structure of t he state monitoring and fault diagnosi s system. NI 9232 NI 9205 NI 9211 NI cDAQ 9188 DAQ Monitor Analysis IPC Fig.2. Hardware st ru cture 1. NI cDAQ 9188 is 8-slot E thernet chassis, which is us ed to communicate with the I PC [4]. 2. NI 9232 is a 3-channel, 102.4 KSPS, ± 30V, C series sound and vibration input boar d [ 5]. It is used to obtain triaxial acceleration signals. 3. NI 9205 is a 16-bit, 32-channel C series voltage input card [6] for sp eed and current voltage signals. 4. NI 9211 is a 4-channel, ± 80 MV C series temperature input boar d [7 ] for obtaining thermocouple temperature signals. 5. IPC is an industrial control co m puter for data proce ssin g and status monitoring. B. Software Structu re The software is mainly based o n LabVIEW, and it s environments are listed as foll ows: 1. LabVIEW 201 5 2. MySQL 5.7.20 3. Alibaba cloud server (Ce ntos 7.3) As sho wn in fig.4, the so ftware system is divided into three modules: data acquisition m o dule, data processing module and state monitoring a nd storage module. Data flow is based o n a two-tier p roducer and consumer frame w or k, which en sures both real-time data collection and data integrit y . Data-acquisition module is used to acquire data from the NI cDAQ acquisition equipme nt and se nds ra w d ata to data-process module. It anal y sis D A Q info, configure s acquisition setting and acquire s data [8 ].The sampling rate can be adjusted from 1KSPS to 25 KSPS acco rding to the acquisition configuration i nformation. In order to realize data integrity, there is a buffer area between the data -acquisition module and the data -process module. Data-process m o dule is used to preprocess and anal yze data. It uses Kalman filter to process the ra w data [ 9] . In order to obtain the real physical val ue of the ra w data, the data will be amplified in a certain p roportion. Data analysis consists of two parts, pr im ar y analysis and advanced ana lysis. Th e primar y analysis is mainly the threshold analysis, w hic h judges the state of the motor b y the upper limit and lower limit of the parameters. Ad vanced anal ysis is mainly order analysis algorithm. Data-acquisiti on Module Data-pr ocess Module Raw da ta Buffer Raw da ta Prod ucer Cons umer Prod ucer Cons umer Buffer Stat e monitoring Module MySQL MySQL Local Ali cloud Manage Data ar chivin g and managing Module Signals from NI cD AQ acquisition equipment Fig.3. Softw a re structure The order spectr um is used to loca te the fault source o f the motor. First of all, the cr ankshaft is sampled at equal angles . In order to obtain the resampling time point [ 10] , it is ass umed here that the reference a xis rot ation angle θ can be represented in the following for m: Where: b 0 , b 1 , b 2 is the undeter mined coef ficient; t is the time point. At the same time interval sampling signal, three p ulse time points t and rotation angle i ncrement O which have been achieved in turn are b rought into (1).It gets 3 After finding b, we take it into ( 1) and get According to the above for mu la, t he time points corresponding to the constan t angle incre ment when sa mpling at equal angles can be obtained. After the acceleration signal is interpolated and Fast Fourier Transform (FFT) according to the time poi nt, the order spectrum will be obtained. T he syste m analyzes the dif ference o f the amplitude of each order w hen th e rotational speed changes, an d gets the fault information of the motor finally. Fig.4 is a flow chart of order anal y si s algorithm. Confi gure NI MAX Init DAQ Acqui re tacho signa ls Acqui re accel eration signa ls Equal angle sampl ing poin ts Inter polation T rigger arriving? Fast f ourier tr ansfor m (FF T) Norma l for so me part of mo tor abnor mal for s ome part of motor Y Y N N Some order amplitude in range A? Fig .4 . Wo rk fl ow of or der analysis algor ithm State monitoring mod ule is in front of the system . Based on the t wo-tier p roducer and co nsumer m o del, the actual physical quantities and state of motor is displayed to th e front end of the monitor interface i n real time b y data flo w . For abnormal parameters, the system will give correspo nding prompts through the alarm indicato r . Meanwhile, the s ystem will also give spec ific alar m in formation on the interface . T he user c an choose to view t he real time parameter wavefor m of data. Data archiving and m anaging mod ule m ainly consists of two parts. In o rder to achieve multi-point bac kup, the syst em archives data i n M ySQL data base on local and Alibab a clo ud server. The sy ste m also adds the function of m anaging the database. Users can view the s y ste m's historical d ata in the form of a chart. T he system re m o tely connects to the M ySQL database on the clo ud server through t he Lab SQL toolkit. At present, t he database is mainly div ided into four tables. Fig.5 is the system remote database ta ble structure. Fig.5 . Remote database table st ruct u re IV. R ESULTS A. Real-time da ta monitoring results The state m o nitoring and f ault d iagnosis s ystem was tested in March 2018. The system has been running steadily for t wo months in the pilot phase. The test res ults sho w that it meets the requirements of real -time data acquisition and m onitoring, a nd has the characteristics of per sistence and rob ustn e ss at the s ame time. Fig.6 shows the monitoring interface of the s ystem. It includes sensor data, state, and alert infor m at ion. Fig.6 . The mo nitoring inter face of the sy st em B . Fault diagnosis results Fig.7 shows the o rder spectrum of a healthy motor and a faulty motor. Fro m the figure, we can see that the a mplitude of the faulty m otor at the 10th an d 14th orders is much high er than that of the healthy motor. T his reflects a fault feature of the motor from the side. It p rovides a good reference for users. Fig.7 . Order spe ctrum contrast gr aph C . Data mana ging results 4 Fig.8 shows the in ter face of the data man a gement. In order to meet the needs of u sers to view historical data, multiple search functions are designed . As shown i n the fi gure, users can retrieve data b y setting query time and quer y para m eters. The system also p rovides export data to Excel table function . Data management feature s pro vide users with a g reat d eal o f convenience. Fig.8. the interface of t h e data manage ment V. S UMMARY In this paper , we have presented a s ystem b ased on LabVIEW. T his system realizes multi-functions such as d ata acquisition, data pr ocessing and analysis, and state monitoring an d archiving. In or der to achieve multi-point backup, the system uses Alibaba cloud server for data cloud storage. After two months of testing, the system bas ically meets the requirements of t he system d esign. The function of real- time data acquisition and data processing and analysis ru ns stably. Next work, we will continue to perfect system functio ns and add multiple analysis al gorithms. A CKNOWL E DGMENT This work is suppor ted by the National Natural Science Foundation of China under Grant No.11505239. R EFERENCES [1] Me hmet Ş en and Basri Kul, ”IoT -Based W irele ss Induction Motor Monit o ring” , Proc. XXVI Inte rnational Scientific Confer ence Electronic s - ET2017. [2] D . Shyamala; D. Swa thi; J. Laxmi Prasanna; A. Ajitha, ”IoT platf orm for condi t ion m onit oring of industrial m otors” , 2017 2nd Int erna tional Conf erence on Communica tion and E lec tro ni cs Syst ems (ICCES), pp.260-265, 2017. [3] Shi Li, Y ong Wang, Yi ng Chen, Feng Wang, ” Dev elopment of the EPICS-base d Monito r ing and Contro l Syst em for EAST Fas t Contr ol Powe r Sy stem” , 2016 IEEE-NPSS R eal T ime Conf erence (R T ). [4] NI cDA Q 9188,ht tp://www .ni.c om/zh- cn/ support/model.c daq-9188.html [5] NI 9 232, https://www .ni.c om/zh-cn/support/mode l.ni-9232.h tml [6] NI 9 205, http://www .ni.c om/zh-cn/ support/mode l.ni-9205.h tml [7] NI 9 211, ht tps://www .ni.com/zh-cn/su pport/model .ni-9211.ht ml [8] Y .Che n, S.Li, F . Wang, B.J.Xiao, Y .L.Li, “ The Data Acquisi tion and Co n trol Sys tem of EAST ME- SXR Diagnosti c” , 2016 IEEE -NPSS Real T ime Conf erence (R T). [9] Mar tin Čala; Petr Beneš, ” T urboje t vibrations analysis using the order trac king methods” , 2016 8th Int ernatio nal Congress on Ultra Modern T ele communic ations and Contr ol Syste ms and W ork shops (ICUMT), pp.225-230, 201 7. [10] He Chengbing; Cai Shunkai; Sun Dakang; Song Lei, ”F ault diagnosis of wi nd turbine planetar y gear box base d on order analysis and dive rge n ce index” , The Journal of Engineering,vol.2017,i ssue 13,pp. 1394 – 1398 . S.Q. Li u received the B. S. degree in measurement a nd control technolo gy a nd instruments from Anhui Universit y of Technology , Maanshan , Chi na, in 2014 and the M.S. degree i n computer technology from Universit y of Science and Technology of China , Hefei , Ch i na, in 2018 . He is currently purs uing the Ph.D. degree in c om p uter application tech nology at University of Science and T echnology of China , Hefei , China. From 20 15 to 2018 , He w as a student with I nstitute of Plasma Physics, Chinese Academy of Scie nces , Hefei , C hina . His resear ch interest includes data acquisition and automatic control in the industrial field. Z.S. Ji was born in 1963 . He received the B.S. degree from the United Universit y of Hefei , China, in 1985 . Since 198 5, he has been engaged in the control and data acq uisition systems of the Institute of Plasma Physics of the Ch inese Academy of Sc iences. As the subject leader, he has participated in several 973 projects of the Mini stry o f Science and Tec hn ology and t he National Natural Science Foundation of China. As a visiting scholar, he worked at Kyushu University a nd NIFS I nstitute in Japan. Now he is responsible for the total control sy stem and safe ty chain system, hardware and signal conditionin g o f the Natio nal Science and Engineering EAST device. Over the years, he has published more tha n 40 p apers o n control a nd o btained more than 10 national i nv ention patents.
Original Paper
Loading high-quality paper...
Comments & Academic Discussion
Loading comments...
Leave a Comment