Performance of Angle of Arrival Detection Using MUSIC Algorithm in Inter-Satellite Link
An attitude of satellite is not always static, sometimes it moves randomly and the antenna pointing of satellite is harder to achieve line of sight communication to other satellite when it is outage by tumbling effect. In order to determine an approp…
Authors: Cahya Budi Muhammad, Heroe Wijanto, Antonius Darma Setiawan
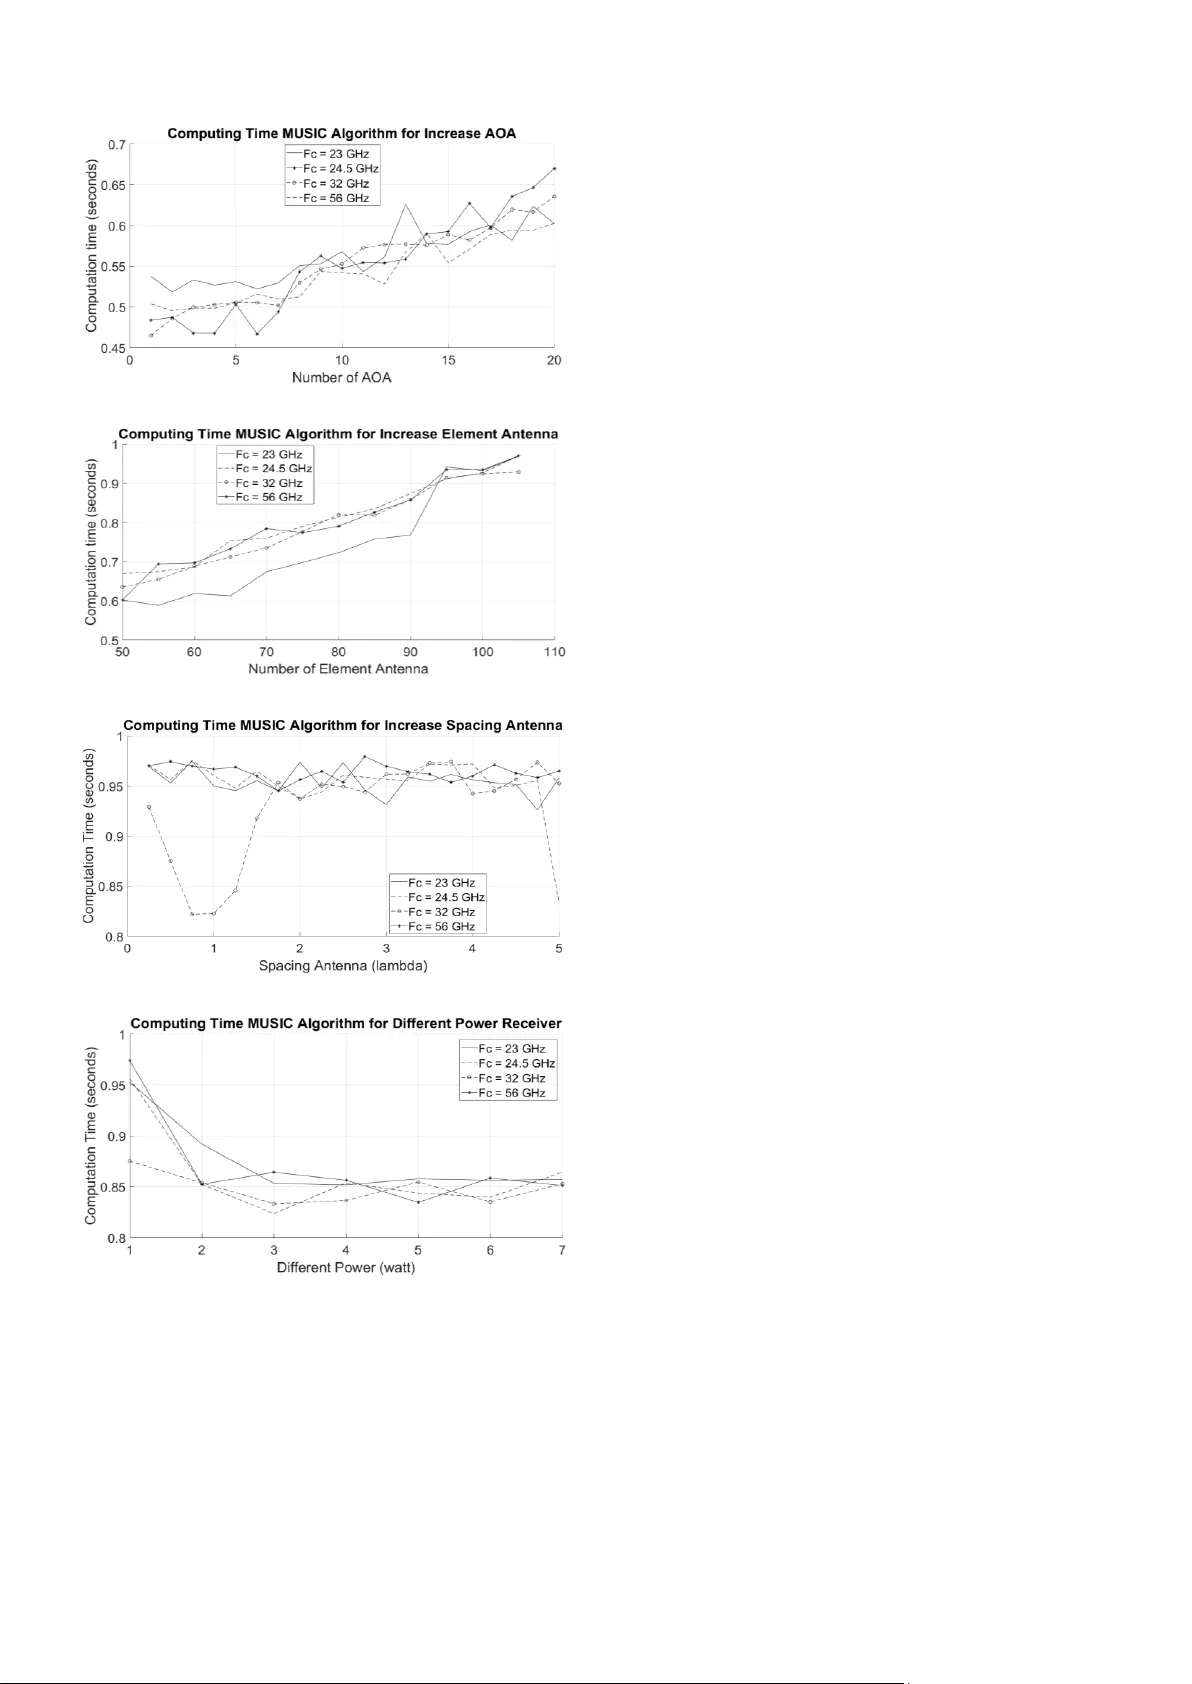
Performance of Angle of Arrival Detection Using MUSIC Algorithm in Inter-Satellite Link Cahya Budi Muham mad 1 , Heroe Wijanto 2 , Antonius Darma Setiawan 3 1,2,3 School of Electrical Engineer ing - T elkom University, B andung, Indonesia 1 cahyabudi@student.tel komuniversity.ac.id , 2 heroe@telkomuniversit y.ac.id , 3 adsetiawan170 1@gmail.com Abstract — An a ttitude of satellite is not always static, sometimes it mov es random ly and the antenna pointing o f satellite is harder to achieve line of sight communication t o other satellite when it is outage by tumblin g effect. In order to determine an appropriate direction of satellite antenna in inter -satellite link, this paper analyze estimation performance of t he direction of arrival (DoA) using MUSIC algorithm from conne cted satellite signal source. It differs from optical measurement, m agnetic field measurement, inertial mea surement, and global positioning system (GPS) attitude determination. The proposed m etho d is characterized b y taking signal source from connected satellites, after that the m ain satellite processed t he infor mation to obtain connected satellites antenna direction. The simu lation runs only o n the d irection of azi muth. The simulation re sult shows tha t MUSIC algorithm processing time is faster than satellite m ovement time in orbit on altitude of 8 30 km w ith the period of 101 m inutes. With the use of a 50 elemen ts array a ntenna in spacing o f 0.5 wavelength, the total of 20 angle of arrival (AoA) c an be detected in 0.98 seconds of processing tim e w hen u sing M USIC algorithm . Keywords — Dire ction o f Arrival, inter-satellite link (ISL), MUSIC algorithm, attitude determination, tumbling effect I. I NTRODU CTION Attitude of comm unication sat ellites, especially direction of antenna pointing of satel lite, m ust point toward to their satellit es to obtain a b etter data link. The attitu d e o f communication o f satellit e can be d eterm ined by m easurem ents from attitude sensors. Attitude sensors prod uce the projection of the reference vector in the sensitive directio n o f attitude [1][2][3 ]. T he used vectors are defined by stars, the sun, the earth , ge omagn etic field, inertial space , and G PS satellite [3][4][5]. Most of commun ication satellites a chieve attitu de determination by corporately using different attit ude referenc es to prevent a system failure. For example, a three-ax is gy roscope, a thre e-axis magn etometer, and a coarse h orizon s ensor ar e used f or attitu de references of iri dium satel lites [1][2]. The atti tude of Gl obalst ar satellit es is determined by four Sun senso rs, a horizon sensor, a three-axis magn etometer, and GPS [2]. Previous w ork about attitud e determinati on with DOA estimation hav e been done by usin g groun d sign al source (a ground station or a ground mobile user) as a reference sig nal source and as the observati on o f the Extended Kalman Filter (EKF) for attitude determinati on o f a communication satelli te, where DOA attitude measure ment equation is derived on t he basis o f the groun d sign al s ource lo cation , the sa tellit e orbit position, and the space ge om etric inform ation b etween the signal source and the smart antenn as. The results show that estimation accuracy increased in term of increasing SNR and number of sn apshots , w here th e SNR sim ulated betw een -14 dB to 14 dB, and it give the best results for 14 dB. T he simu lation is an aly zed in pitch , y aw , roll angle [ 8]. T he secon d one is about directi on f inding t o be us ed in a d rone surv eillance s ystem using a sparse de -n oising aut o-encode r (SDAE) based deep neural netw ork. The system comprises a single channel receiver and a directional antenna arr ay. The receive r sequenti ally activates each antenna in the array and measures the received power level . The power measurem ents corresp onding to each sw itching cycle are fed to the p roposed dee p netw ork. Then, it pe rform s direction finding by exploiting the sparsity property of the incomin g drone signal, and the gain variat ion property of th e di rectiona l antenn a array. It has been proven that phase synchronizati on mechanis m, antenna gain calibration mechanism, o r profound know ledge about the ant enna ra diation patte rn are not effectiv e for t his single ch annel im plemen tation [1 1]. The third and the last one is finding di rection of arrival estimation (DoA) using sparse reconstructi on gives adv antage on minim izing the num ber of required sam p les. Among available sparse reconstru ction schem es, angle sparsity has shown a favor able advant age as it requi res fewer samp les compared to other schemes. Previous researches on angle sparsity utilized an exhau stive s canning on eve ry possib le arriv al angles. This techni que leads to a problem of la rge sensing matrix A. The r esult proves that partial scanning (i.e. n on-exhaustive search) also gives similar accurate result. The advantage of this scheme is smaller sensing matrix. I n simu lation, this sche me requires sensing m atrix six tim es less than the exhaust ive search with similar accura cy, and it is potential for practical applicati on of DoA estim atio n base d on s parse re construct ion [1 2]. The work in this p aper is based o n a developing low earth orbit (LEO) satellite, where the informati on exchange between one main satelli te to other connected sat ellites , and the inform ation o f angle of arrival ca n be obtained by array signal processing. T he direction of arrival (DOA) estim ation uses the data received by the smart array to estim ate the direction of the signal source. T he DOA contains information about angle of arrival that can be related to d irecti on of pointing antenna from each connect ed s atellit e u sing MUS IC a lgorithm , where the algorithm is efficient enough because it is sim ple and based on eigen stru cture m ethod [9]. A DOA estim ation of antenna pointing satellite measurem ent eq uati on is derived on the basis of the co nnecte d sat ellites o rbit position. the p erform ance of MUSIC algorithm is analyzed in detail. Then, a pointing antenn a satellit e dete rmination is presented using azimuth d irecti on of connected satell ite. Final ly the pro posed m ethod of ant enn a pointing of conn ected sat ellite dete rmintaion is an alyzed in te rm of Peak MUSIC (PMUSIC) and accuracy by explori ng influen ces of maxim um angular bea mw idth, the num ber o f antenna, the length of spacin g betw een antenna, variation of frequency operation in inter-satelli te links, the num ber o f angle of arrival that can be related to num ber of co nnecte d satelli te, and in put s ignal- to -n oise ratio (S NR) f or e ach co nnect ed satellit es. II. S IGNAL M ODEL A. S ignal Analysis Consider Fig. 1, a narro wband signal ) ( t s with operating frequency 0 arrive s from angle a nd with z -axis and x -axis plane respectively. T he narrowband signal ca n be expressed as )) ( ) ( cos( ) ( ) ( 0 t v t t u t s + = , (1) where u ( t ) and s ( t ) is a variation of fu nction fro m time which define as a n a mplitudo and phase. A delay depends o n r elative position from eac h se nsor and against angle of arr ival (AOA). If taking cartesia n coor dinate system as a reference location, and antenna ele ment i which related to signal on reference location can be expressed as [6 ] c z y x i i i i ) cos sin sin cos sin ( + + − = , (2) wher e c is a ligh t velocity. B ecause the signal is a co mplex narrowband si gnal, the ef fect of dela y propagation i makes a phase shift i = – 0 i can be r epresented by ) exp( ) ( ) exp( ) ( ) ( 0 i i i j t s j t s t s − = = − , (3) where phase shift i given b y [5] ) cos sin sin cos sin ( 2 ) cos sin sin cos sin ( i i i i i i i z y x z y x c + + = + + = . (4) The signal received b y array can be expressed in a vector [9 ] ) ( ... ) ( ... ) ( ) ( ) ( 2 1 2 1 t s e e e t x t x t x t x M j j j M = = . (5) Vector from x ( t ) alw ay s refere nced as in p ut vector array data or illumin ation vector. I n (5), p hase shift separ ated from sign al s ( t ) because of existance of sp atial separation betw een array antenna. For general cases, array e lement will have a direction and frequen cy response which d epends on each element. T hat mattter can be modelle d with applying different gain and phase for vektror from each elemen in (5). If the direction and frequency dependant gain and phase from antenna elem en i denoted as g i ( , , ), the signal in output array can be expressed as [5] Fig. 1. Inter-Satell ite-Link Model ) ( ) , , ( ) , , ( ... ) , , ( ) , , ( ) ( ... ) ( ) ( ) ( 2 1 2 1 2 1 t s e g e g e g t x t x t x t x M j M j j M = = = (6) where the vector = = + + + + + + ) cos sin sin cos sin ( ) cos sin sin cos sin ( 2 ) cos sin sin cos sin ( 1 2 1 ) , , ( ... ) , , ( ) , , ( ) , , ( ... ) , , ( ) , , ( ) ( 2 2 2 1 1 1 2 1 M M M M z y x j M z y x j z y x j j M j j e g e g e g e g e g e g t x (7) is called steering vector. Equation (7) represen t general form from steering ve ctor from an ar ray. Stee ring vecto r is a r espons e function from each elem ent , array geometry, frequency signal and angle of arr ival. B. MUS IC Met hod Multiple Signal Classif ication (MUSIC) is a technique that quite popular which used in direction of arrival estimation. It can be concluded that DOA estimation as a job to estimate angle of arrival which the location is unknown to antena receiver with some sign al process ing te chnique . MUSIC method is relative simple and eigenstructu re method which is efficien t from DOA estimation. The techni que can be done by doing eigenvalu e decomposi tion from matrix correlati on estim ation from array or singula r decomposition value, wh ich colum n N repres ent N snapsh ots f rom array vect or signal [9 ]. Matrix X from array sensor is l with n matrix wh ere lth is total from antenna sens or and n represent total snapsh ots which taken. The matrix can be formu lated as [ 10] l T x x X ... 1 = . (8) Fig. 2. Maximum Angular B eamwidt h Simualtion Re sults at: (a) 0 – 180 Degree . (b) 60 – 80 Degree The total sig nal that in duced in element l from receiver array can be form ulated as [7] ) ( ) ( 1 ) ( 2 0 t n e t m x K k l f j k l k k i = + + = . (9) Time required si gnal which u p to elemen i fro m recei ver array fro m reference ar ray ele ment with signal k th which arrive from ( k , k ) can be calc ulated as [10 ] c v r k k l k k l ) , ( . ) , ( = (10) where r l is the position vector of antenna i and v ( k , k ) is the unit vector which aim to sig nal of arri val k . Autoco rrelation matrix from array sensor can be obtained from [10] T XX E R = . (11) The correl ation matrix of received signal from antenna element c an be foun d from [10] = = N n H n n x x K R 1 1 . (12) To calculate eigenvalues and eigenvecto rs from correlation matrix using (12), input a noise su bspace matrix where eigenvecto rs which suited for smallest eigenvalues from correlati on matrix . For every and , create steerin g vector with using equation that given by [10] ) , ( 2 ) , ( 2 0 1 0 ... ) , ( l f j f j e e s = . (13) Calculatin g P MU for each angle using equation to find peak from MUS IC spectrum which estimated ang le DOA [7] 2 ). , ( 1 ) , ( L H MU U s P = (14) where U L is a matrix w ith the dimension l l – m as eige nvectors which ap propriate with smallest o f l – m eigen values from correlation matrix of array [7] . III. S I MULATION R ESULTS System for estim ation signa l in inte r-satellite- link sy stem perform ed with doing c onstell ation s atellit e sim ulation w here K satellit e want to communicate with one main satellite. Each of satellit e will have information of azimu th and elev ation positi on. But in this case only azim uth posit ion that will be taken an d the main satellite only d etect for 1800 v iew. Later each sa tellit e will emit an electrom agnetics wave with power that has been decided. Evaluation scenario for MUSIC algorithm in inter-satelli te- link system will be review ed from several aspects first. First, how to calcula te and find the values of maximum angular beamw idth for MUS IC alg orithm in inter-satell ite-link ca se. Second, how the number of AOA chang es toward output g raphic from MUSIC algorithm. Third, how the nu mber of elem ent changes t ow ard output gra phic. Fourth , how the number o f frequency operation changes toward o utput graphic. Fifth, how spacing betw een elements chang es toward graphic output. Sixth, how differ ent power receiv e changes toward graphic outpu t. Last, how to calcul ate computing time for MUSIC algorithm . Later, computing time for MUSIC algorithm will be compar ed to tim e of satell ite w hen m oves in orbit. A. Ma ximum Angu lar Beamwidth Calculatin g maximum angular beamwidth addressed to find out the threshold detecti on o f MUSIC algorithm . So, if applying maximum angular beamwidth to ISL system, calculati ng maximum angular beamw idth can determ ine max imum n umber of satellite constelati on so th e main satellite can receiv e and detect sign al of arrival f r om an other sat ellite accurate ly. Fig. 2 sh ows v alues of maximum angular beamw idth can be decided in MUSIC algorithm . In Fig. 2 (a) obtaine d simulati on result graph for maximum angular beamwidth from 0 unt il 180 degree. The gr aph is u sing step w id th of 1 degr ee an d it still can detect the angle of arrival accurately with d ifferen ces of one degree ste pwidth. In Fig. 2 (b) to s ee more cl early aver age peak power MUSIC for every AOA which detected by MUSIC algorithm with rang e angle from 6 0 until 80 degre e, it d etects 20 angle of arrival (AOA). B. I ncreasing Numb er of Ang le of Arrival For this analysis will perform ed graph of comparison result from one AOA until 20 AOA. The comparis on that will be perform ed is valu es of PMUSIC(dB) and accu racy fr om gra ph. (a) (b) Fig. 3. Simulation Results of Incre asing AOA to PMUSI C(dB) Fig. 3 show s how increasi ng A OA affect to MUS IC algorithm . For increasin g AOA occur fluctuations . The graph show s that when MUSIC algorithm detects one AOA, MUSIC algorithm receiv es a sign al arou nd 62.9 d B. When the num ber of AOA increased become two, it h appens increasing receiv e a signal a rou nd 63.1 dB. When the num b er of AOA increased becom e th ree, it happ ens increasing receive a signal around 63.6 dB, and s o w ith others num b er of AOA , happened fluctuati ons for every increased the number of AOA. So, n ot ev ery increase d nu mber of AOA w ill dec rease PMUSIC that receiv ed by MUSIC alg orith m. Fig. 4. Simulation Results of Comparison N umber of Eleme nt Antenna: (a) for Ave rage Peak Power , (b) for Minimum Sensi tivity C. Increasing Number of Antenna Element to Average Peak Power Music and Accuration Level In this analysis w ill be perform ed graph o f c omparison fr om nine to 105 elem ents of antenna. Fig . 4 (a) depicts that increas ing element of antenna will decrease P MUSIC. But for b etter and more accurate decision, the effect of increasing number of antenna elem ent should be reviewed in minim um sensitivity detecti on. Fig. 4 (b) depicts that the minimum sensitivity is increased along increas ing num ber of antenna element. Minimum sensitivity can be a param eter to det ect accuracy level, because for ce rtain P MUSIC, angle of arrival h as been detecte d. For 9 elements o f antenn a, MUSIC algorithm can detect AOA with PMUSIC level around 60 dB. For 20 elements of antenna, MUSIC algorith m can detect AOA with PMUSIC level around 46 dB. When the num ber of antenna elem ents is increas ed, it will produce lower PMUSIC level to detect AOA ac curately . It can be conclu d ed th at m ore accurate to detect AOA from a s ignal. It produces lower P MUSIC level which be used by MUSIC algorithm . D. Different Spa cing between Element Antenna For this analy sis w ill be perform ed for different spacing from 0.25 until 5 with number of antenna elem ents is 50 and the operatin g frequen cy is 32 GHz wh ich produce the wav elength of 9.4 mm. In Fig. 5, given informati on that detection accura cy level o f AOA for spacing 5 mm o r 0.5 with accuracy level of 95 percent. For increased spacing is occur fluctuation of gra ph, but for every increased AOA for accuracy level always below 50 percent. T he level of accu racy increase d again when the spacing equals to 40 m m with 70 percent o f accuracy, and decreased w hen the spacin g equals to 47.5 mm. This phenomenon can be happened because the greater spacin g between antenna in MUSIC algorithm , the greater MUSIC algorithm w ill detec t subs pace s ource s o ther e w ill be u nw anted signal w hich detec ted but not greater as AOA sig nal. E. Differen t Operating Freq uency This analysis will perform effect of d ifferen t fre quency operation for MUSIC algorithm . Frequency operation that will be com pared is 23 GHz, 24.5 GHz, 32 GHz , and 56 GHz correspon ding to the Table 1. [8] Fig. 5. Simulation Result fo r Differe nt Spacing (a) (b) Fig. 6. Simulation Result fo r Differe nt Frequency Operation Fig. 7. Simulation Result fo r Differe nt Receive Powe r in Every Antenna Eleme nt at SNR = 5 dB , SNR = 10 dB , SNR = 15 dB , SNR = 20 dB TA BLE I . T ABLE S TYLES Intersatellite servi ce Frequency Bands Radio Fre quency 22.55 GHz – 23.55 GHz 24.45 – 24.75 G Hz 32 – 33 GHz 54.25 – 58.2 G Hz In Fig. 6, given information that the largest PMUS IC(dB) is when the fre quency operati on is 32 GHz. B ut the changes of PMUSIC(dB) value for every frequency operation is not too significan t, because f or each fre quency operation pro duce PMUSIC(dB) with range arou nd 57 dB and 58 dB. F. Differen t Receive Power i n Ea ch Anten na Element This analysis perform s the effect of difference receive power in every antenna elem ent for each AOA. For noise signal amplitude amount of 50 watt. Num ber 1 indicate pow er receive that received b y MUSIC algorith m amount of 1 watt, number 2 amount of 0.1 watt, number 3 amount of 0.01 watt, number 4 amount of 0.0 01 w att, nu mber 5 amoun t of 0.0001 watt, n umber 6 amoun t o f range power from 0.1 watt to 0.9 watt, number 7 amount of range pow er from 0.01 watt to 0.09. In Fig . 7 (a), given inf ormation that power r eceive amount of 1 w att or 0 dB. MUSIC algorithm can detect AOA with PMUSIC(dB) around 24 dB. When power r eceive is decre ased to 0 .1 watt or - 10 dB, the PMUSIC(dB) decreased around 6 dB. A lthoug h th ere is decreasing P MUSIC( dB), it still can detect AOA ac curate ly. but, if PMUSIC(dB) below 2 dB, MUSIC algorith m will no t detect AOA a ccurately , so for 0.01 watt or -20 dB, 0 .001 w att or -30 dB , 0.0 001 w att or -40 dB , and 0.01 – 0.09 w att or -10.4 576 – 20 dB. The result can be happene d because in MUSIC algorithm , every signal of arrival w ill be div ided into 2 parts, the first on e is su bspace source and the second one is subsp ace noise. Where subspace source and subspace noise are data matrix which consist of complex number. For taking real number f rom each subspace, the value can be com pared w ith adding every real number of the matrix . If total real number from subspace s ource is great er than total real nu mber fr om subs pace noise, th e MUSIC a lgorithm will detect AOA accur ately . The solution to increase accuracy level in 0.01 watt, 0.001 watt, 0.0001 watt, and 0.01 – 0.09 watt is to increas e SNR. Increasin g SNR will min imize noise v ariance in AWGN chan nel as can be seen in Fig. 7 (b). G. Comparison fo r Computing Time to Sa tellite Velocity For computat ional time calculation analysis, the first calculat ion is done when the SPOT satelli te are used for earth imagery observati on. T he satellite m oves w ith an altitu de of 830 km in a period of 101 minutes. However, the lack of info rmati on about SPOT satelli tes is the apogee and perige e location so it is difficult to calculate the cir cum ference of SPOT satelli tes in elliptica l form. In this case it is assum ed for circular orbits of satellit es. T he first scenario is to calculate the circumference of the circu lar or bit of the SPOT s atellite. Calculati on of the ci rcum ference of SPOT satellite o rbit requires the radius o f the earth and the heig ht of the SPO T satellit e, where the SPOT sat ellite altitude is 830 km and the radius of the ear th is 6 ,371 k m, then the ra dius of th e circum ference is 7,201 km and the circum ference of the SPOT satellit e orbit is 45 ,222 km. Furthermore, th e SPOT satell ite speed is calculat ed with the formula v = s / t , where s is the circum ference of SPOT satellite orbit and t is SPOT satellite period of 101 min utes o r 1.683 hours. T he obtain ed S PO T satellit e speed is 26,870 km/h or 7,463.9 m/s. T he next step is calculat ion the d istance per one degree o f SPOT satellite orbit, where the circum ference of SPO T satel lite orbit is 360 degrees, then the obtaine d distance per o ne degree is 125.617 km. T hus, the time required by SPOT sate llite to travel a path of one degree in orbit is 16. 83 seconds. Fig. 8 desc ribes th at increas ing num ber of A OA and num ber of antenna element in all of opera ting frequency will inc rease computati on time. On the contra ry, the less receiv ed power, the le ss computation time. Meanw hile increasing spacing between antenna elem ents give fluctuati on but n ot too signif icant to affect the computation time. Comparison also were made wheth er the largest computati onal tim e of t he MUSIC algorith m w as slower than orbit interval in one degree. When the MUSIC algorith m' s largest computin g t ime is bel ow the orbit inte rval in one degree, the MUS IC algorithm m atches t o the Inter-Satellite Lin k requirem ent . The largest computational time is about 0.98 seconds, where the orbit interva l is 16.83 seconds , so the MUSIC alg orithm is suitab le for Inter-Satelli te-Lin k sys tem. Fig. 8. Simulation Eesult for Computation Time : (a) Increasing AOA . (b) Increasing Number of Element Antenna. (c) I ncreasing Spacing Antenna. (d) Differe nt Power Rece ive IV. C ONCLUSION The detection of Direction o f Arrival (DoA) using the MUSIC algorithm can accurately detect the direction of signal arrival or angle of arrival (AoA) based o n the analy sis o f simu lation results on several param eters. The largest improvem ent effect b y the MUSIC algorithm in DoA d etect ion is the increasin g in the num b er of antenna elem ents, follow ed by increasing received p ower level wh ich increase the SNR, increasing the number o f AOA detection, increasing inter- elements spacin g, and inc reasin g frequency . The conclusions ar e valid as long as appropriat e with the limitation of volum e and mass budget associ ated to the total dimension an d w eight of th e array antenna . The use of 50 elements array antenna w ith 0.5 wavelength spacing be tween a djacent elem ents, the MUSIC algorithm can correctly detect 20 angles of arrival (AoAs). The total dimensions of array antenna are 65.22, 61.22, 46.88, and 26.79 cm in each of the operating frequenci es 23, 24.5, 32, and 56 GHz. R EFERENCES [1] T. P. Garriso n, M. Ince, J. Pizzicaroli, an d P. A. Sw an, "Systems Engineering Trades for the I RIDI UM Constell ation", Journal of Spacecraft an d Rockets, Vol . 34, No. 5 (19 97), pp. 675-680. [2] L . X. Lin, ”Globalstar const ell ation and its at titude and orbit control technology ”, Aerospace China 1997 . [3] R. B. Dybdal and K. M. Soo Hoo, ”Narrow b eamwidth satellite antenna pointing and tracking ”, 2011 IEEE International Symposium Antennas Propagation (A PSU RSI ), July 2011. [4] M. Yang, H. Wang, C. Wu, C. Wang, L . Ding, Y. Zheng , a nd Z. Jin, ”Space flight vali dat ion of design and engineering of the Z DPS-1A pico- satellite”, Chin J Aer onaut, 2012. [5] H. Liu and H. Wang, ”Appli cation of mean field annealing algor ithms to GPS-based attitu de determination ”, Chin J A eronaut, 2004. [6] J. Wang, K. Xiong, and H. Zhou, ”Low -frequency periodic error identification and compensation for star tracker attitude measureme nt”, Chin J Aer onaut, 2012. [7] O. A. Ousman e, M . F. Siyau, and T. P. Sattar, ”Compariso n betwee n MUSIC and ESP RIT Direction of Arrival Estima tion A lgorithms for Wirele ss Communication Systems”, The 2012 Inter national Conference on Future G eneration Commu nication Te chnology (FG CT), Dec 2012. [8] Y. Bin, H. Fe ng, J. Jin, X. Huagang, a nd X. Gua nghan, “DOA estimation for attitude determination on communication satellites” , Chinese Society of Aero nautics and Astronautics an d Beihang Unive rsity, April 2014. [9] L . C. Godara, ”Application of an tenna array s to mobile commu nication,” part II: Beam forming and d irection of arrival consi derations, Pro c. IEEE, 85, 1193-1245, 19 97. [10] M. S. F idan, ” Multiple Signal Classificat ion Metho d in Direction of Arrival Estimat ion”, Hacettepe University , 2007. [11] S. Abeywickrama, L. Jayasinghe, H. Fu, and C. Yuen, "RF-Based Direction Finding of UAVs Using DNN." arXiv prepri nt arXiv:1712.0115 4 (2017) [12] K. Usman, A . B. Suksmono , an d H. G unaw an, ”Unifo rm Non -Exha ustive Search on Sparse Reconstruction for Direction of Arriv al Estimation”, IEEE A sia Pacific Confere nce on Wirele ss and Mobile, January 2016. (a) (b) (c) (d)
Original Paper
Loading high-quality paper...
Comments & Academic Discussion
Loading comments...
Leave a Comment