Optimal Relay Location in Diffusion Based Molecular Communications
Molecular Communications via Diffusion (MCvD) is a promising paradigm which enables nano-machines to communicate with each other. However, the reliability of existing systems degrade rapidly as the distance between the transmitters and the receivers …
Authors: Ghazaleh Ardeshiri, Ali Jamshidi, Alireza Keshavarz-Haddad
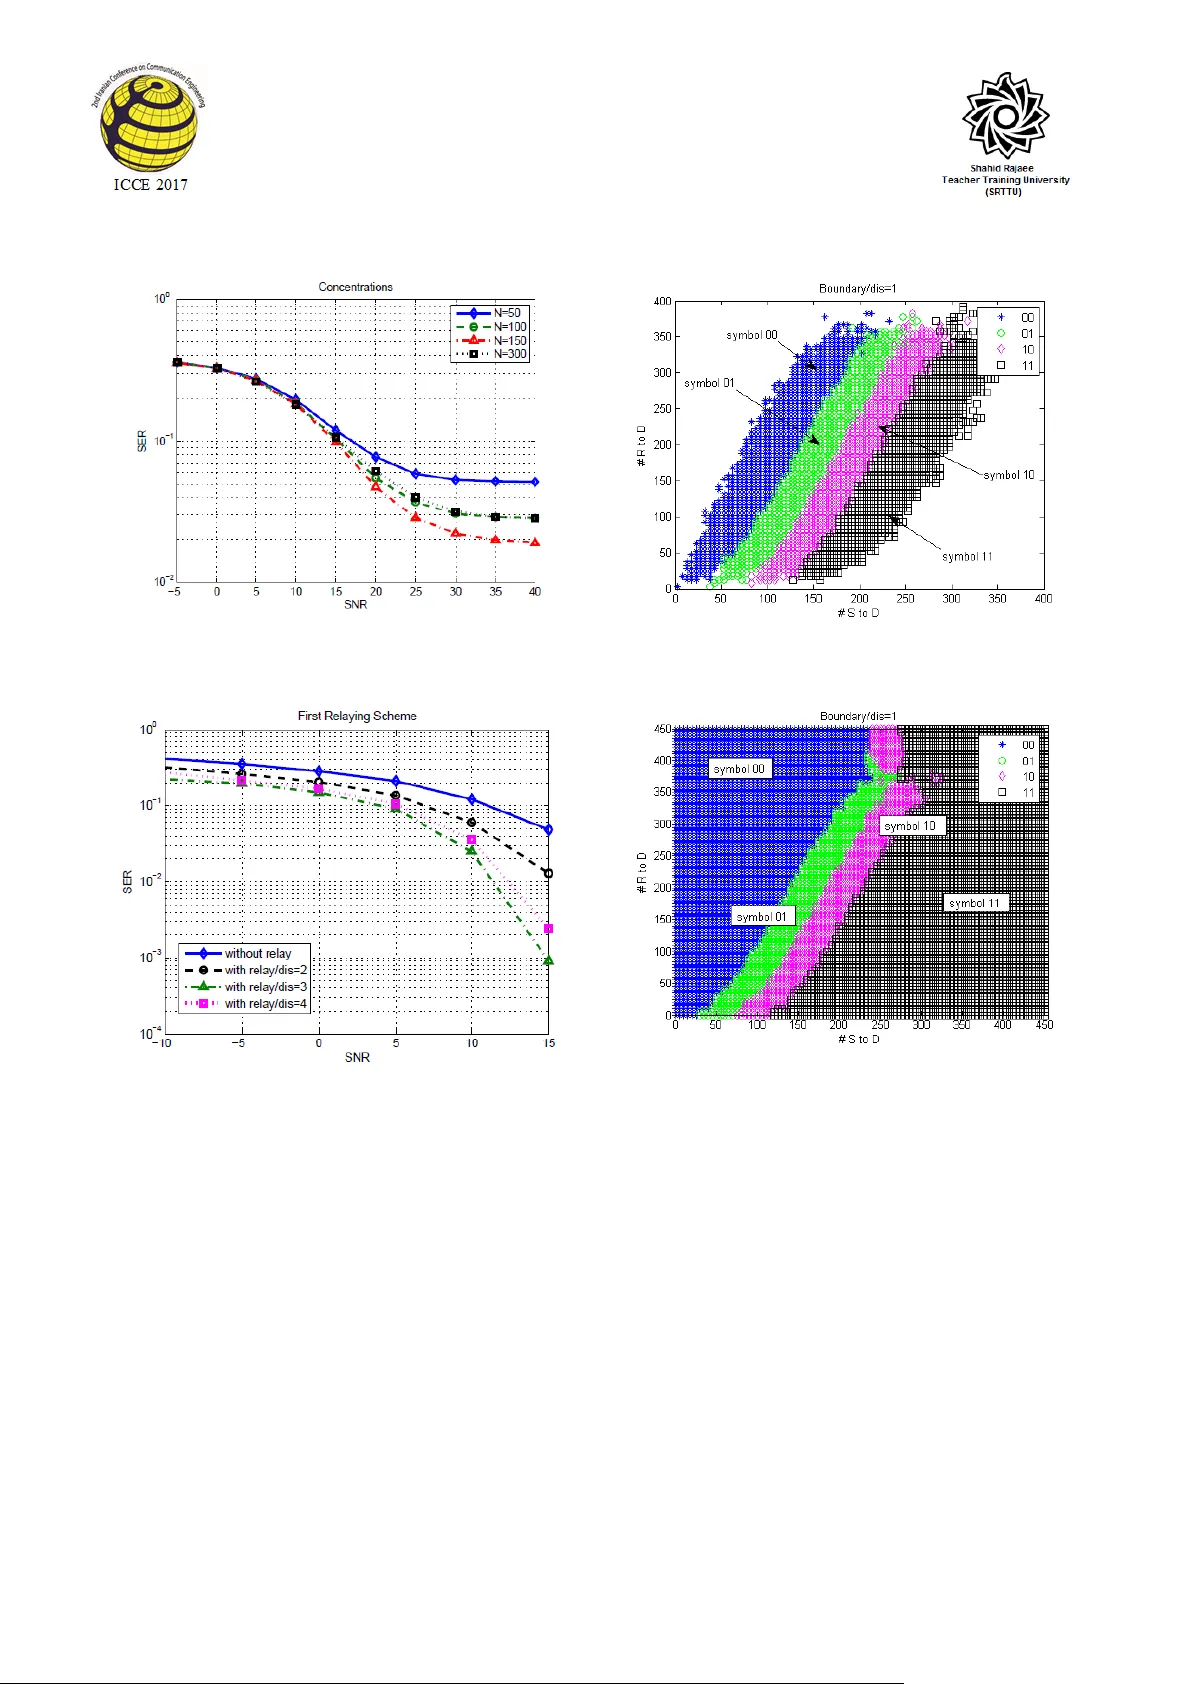
The 3 rd Iranian Confere nce on Comm unications Engineering (I CCE 2017) Shahid Rajaee Un iversity, Tehran, I ran, 23-24 February 2017 1 Optimal Relay Location in Diffusion Based Molecular Communications Ghazaleh Ardeshiri School of Electr ical and Computer Engineer ing Shiraz Universi ty Shiraz, Iran gh.ardeshiri@shira zu.ac.ir Ali Jamshidi School of Electr ical and Computer Engineer ing Shiraz Universi ty Shiraz, Iran jamshidi@shira zu.ac.ir Alireza Keshavarz-Haddad School of Electr ical and Computer Engineer ing Shiraz Universi ty Shiraz, Iran keshavarz@shirazu.a c.ir Abstract : Molecular Communications via Diffusion (MCvD) is a promising paradigm which enables nan o- machines to communicate with each other. However, the reliability of existing systems degrades rapidly as th e distance between the transmitters and the receivers grows. To solve this issue, relaying schemes must be implemented i n pr actice. In this paper, we st udy tw o relaying schemes: In the first case, the relay node decodes the incoming signal symbol and forwards it to the receiver using a different type of molecule. Then, the receiver detects the information b its by only considering the molecules from the relay node. In th e second case, the receiver considers bo th the types of molecules sent from the tran smitte r and the relay nod e. For these two scenarios, the o ptimal location of t he relay node are obtained. We assume Qu adruple Con centration Shift Keying (QCSK) modula tion in which the sig nal is encoded into the four level concentrations of molecules emitted by the nano -machines. Our simulation results indica te that adding a relay improves th e performance by 10dB and 15dB in the fir st and the second schemes, respectively. Keywords: Molecular commu nication , Diffusion-based channel , relay network, Cooperative Networks I. I NTRODUCTI ON Nanotechn ology enables the development o f devices in a scal e rangin g from one to a fe w hundred nanom eter s. At nano sc ale, th e most basic fu nctional u nit is a n ano- machin e, w hich is able to perf orm simple tasks such as computing , data storin g, sensing or actuation [1]. One of the important areas of nano- networks is the b iom edical domain, wh ich inclu des health monitoring, tissue engineerin g, and ta rgeted drug delivery [2 ]. Other applicati on domains include industri al applicati ons, such as new materi als and quality contr ol of products, and environm ental applications, such as biodegradati on and air pollution control [ 3], [4]. In molecular co mm unication, signal is encoded and decoded by molecules rather than electr omagnetic waves [5]. M olecular Commun ication via Diffusion (MCvD) is the most p romising approach for the comm unication between nano-machin es [6]. In MCvD , the molecules that are released by the transm itter nano-mach ine in a flui d environm ent randomly walk in all direction s without any further infrastru cture and some of them may r each the receiver nano-machin e [2]. One of th e main draw backs of MCvD is its limited range of c ommunicati on, s ince the p ropagati on tim e increases and the number of received mol ecules decreases with grow ing the d istance. T his makes co mmunication over lar ger distances challenging [7]. One appr oach i n conventional wireless co mmunicatio ns that can be adap ted for MC vD is the use of intermediate tran sceivers ac ting as relays to aid the co mmunication with di stant r eceivers. Such relays can po tentially improve the reliability a nd performance of the co mmunication [2]. In this paper, we investigate two different relaying schemes. The relay node is p laced between the transmitter and the receiver deco des the incoming signal and forwards it to the receive r using a differ ent type of molecule than the one used by the tr ansmitter. In the firs t case, the rec eiver uses only molecules which come from the relay node and ignores molecules from the t ransm itter. In the second case, the rec eiver c onsiders both m olecules receiv ed from the transmitte r and the relay node . For each schem e optimal locati on of the relay node is obtained. Interesting ly, the optim al location for the first scheme is the middle point between the transmitter and the receiver , while for the sec ond schem e the relay should be placed nea r to the t ransmitte r. Further, we assume that Quad ruple Concen tration Shift Keying ( QCSK) modulation for the commu nications among the transmitter , the relay, and the receiver. T he optimal c oncentrati ons and thresho lds for QCSK modulati on are calculated by Mo nte Carlo simu lations. Our simu lation results indicate that for the first case the Sym bol Error Rate (SER) is improved by 10dB and in the second case up t o 15dB im provement is achieved . The remainder of the pap er is organized as follo ws. In section II, the MCvD s ystem model is introduced, and QCSK is de scribed. In section II I, we i ntroduce our rela y schemes. Section I V, provides simulation results o f the optimal concentratio ns and thresholds for QCSK modulation and the relay node. Finally , conclusion is drawn in section V. The 3 rd Iranian Confere nce on Comm unications Engineering (I CCE 2017) Shahid Rajaee Un iversity, Tehran, I ran, 23-24 February 2017 2 II. S YSTEM M ODEL A. Diffusion and the First Hitting Time The m olecules are the information particles in molecular scale. In t his scale , the movement o f particles inside a fl uid is m odeled b y B rownian motion or diffusio n process. If we focus on the d iffusion process of a particle starting fro m ori gin, then t he concentratio n at radius r and time t is given b y the following formula [ 8 ]: 2 4 2 1 ( , ) ( 4 ) r Dt n C r t e Dt where n and D are the dimension o f the en vironment and the diffusion coefficient, resp ectively [9] . In n ature, whenever a messenger molecule hits the bod y of the receiver, the molecule is received and re moved from t he environment; therefore, the h itting molecule cannot move further and constit utes the signal just o nce. T his pro cess is referred to as first passage or the hitting process. What we are concerned with t he p robabilit y that a diffusing particle first reaches a speci fied site at a specified time [ 10 ]. The first ge neralized model for probabilit y d istribution function of first h itting pr ocess in 1 -D environme nt was derived as [11 ] 2 14 3 4 D d Dt hit d f t e Dt where d corr esponds to the distance. Therefore, the probability of h itting an absor bing receiver until ti me t , can be obtained from integrating of (2) as follo ws [12] 1 erf c 4 D hit d Ft Dt Similarly, fraction of hitting molecule s to a perfectly absorbing sp herical receiver in a 3-D environment is derived in [13]. Hitting rate of molecules to a spherical receiver in a 3-D e nvironment is formulated as 2 34 3 4 D d Dt r hit r r d f t e dr Dt where r r denotes the radius of spherical receiver. One can obtain the fraction of hitting molecule s unti l time t b y integrating 3 D hit ft in (4) w ith resp ect to time, which yields similar results with the 1 -D case. Note that there is a positive probability o f no hitting to the absor bing boundar y for a diffusing p article in a 3 - D environment when time goe s to infinity. The survival probability depends on the radius of the receiver and the distance between the tra nsmitter and the receiver [1 3]. B. Co ncentration Sh ift Keying (CSK) Modulation The concentration o f t he recei ved molecules is used a s the amplitude o f t he signal. I n order to represent different symbols, the trans mitter releases different number of Figure 1 . BCSK and Q CSK modulations ’ thres holds molecules for each symbol. For example, for “0” the transmitter releases N 0 molecules whereas f or “1” N 1 molecules will be released [1 4]. T hen, the receiver detects the intended s ymbol as “ 1” if the number of m olecules arriving at the receiver during a time slot exceeds a threshold (assuming N 1 > N 0 ). Other wise, the symbol is detected as “0”. CSK is analogou s to Amplitude Shift Keying ( ASK) in classical comm unication. Instead of using tw o values, e. g., N 0 and N 1 , and a single thresh old, the symbol can be tailore d to represent b bits by using 2 b different values with 2 b -1 thresh old levels. CSK can be implem ented in practice as BCSK ( Binary CSK) or QCSK (Qua druple CSK), depending on the bi ts per sym bol rate. If b = 1 , CSK is calle d Binary CSK (BCSK) If b = 2 , CSK is calle d Quadruple C SK (QCSK). Extension BCSK to higher order, e.g. QCSK, is not as easy as conventional comm unication. We can consider four different level of concent rations for the sym bols, i.e. N 0 , N 1 , N 2 , N 3 . Notice that, in gene ral the optimal thresh olds ( 1 , 2 and 3 in Figure 1) are not midpoint of the molecul e quantity per sy mbol, w hich is consistent w ith the theoretic al analys is. In this w ork, for the first time the o ptim al concentrati ons and threshold s for this modulation are investigat ed. For simplify ing our simulations, we assum e that for QCSK modul ation the transmitter does not send any molecules fo r symbol “ 0” , sends N molecul es for sym bol “1 ” , 2 N m olecules for sym bol “2 ” , 3 N molecules for symbol “3 ” . Next, we find the optim al concent ration N for a giv en baud-rate via sim ulation. C. ISI Mod el Arising fro m the pr obabilistic d ynamics o f Br ownian motion, the signal molecules m ove rando mly a nd do not necessarily reach the receiver , moreover the arrival of molecules spread s to a very l ong d uration. Instead, ever y The 3 rd Iranian Confere nce on Comm unications Engineering (I CCE 2017) Shahid Rajaee Un iversity, Tehran, I ran, 23-24 February 2017 3 molecule has a probability of hitting the recei ver in a predetermined time duration t s . T he received molecules contain ISI due to surplus m olecule s f ro m the previous symbols and affects the d ecoding process severely [8 ]. D. Noise Model Channel noise is m ainly ca used by other nano-machines, apart fro m the po ssible molecular rea ction and background molecules. Receivi ng and counting undesired molecules in demodulation, co uld be regarded as noise. Positi ve noise means re ceiving red undant molecule s from other nano -devices, negati ve noise means so me molecules are received by other nano-devices [15]. In most papers, it is assumed that the noise is Additive White Gaussian Noise ( AWGN) and expressed as, 2 ~ (0, ) noise N n N or ma l Notice that, in this system model , the noise takes discrete values, however, for simplification, it s distribution function is approxi mated as ( 5). Here, the noise po w er is defined as the varia nce of the no rmal distribution. III. R ELAY S CHEMES In this se ction, w e study th e effect of relayin g in MCvD. We assume that the transmitter is a point source and placed at locati on (0, 0, 0 ) and th e receiver and the r elay nodes spherical in shape w ith fixed volum es and radii in 3-D space. Also, they are passive ob se rvers such that molecules can diffuse throu gh them [7]. T he r eceive r is placed at the distance of 6 m from the tran smitter. The relay node is placed betw een the tr ansmitter and the receiver. We assume that there are two distinct types of molecules, type I and type II, the transmitter releases type I molecules. T he relay node ca n detect type I m olecules and emits type II mole cules. The receiver can detect both types. Our goal is to minim ize SER b y optimally choosing the location of the r elay node. We use the SNR definition presen ted in [14]; the ratio between the average received power and the average noise power. The transmiss ion power is defined as the number o f molecules sent b y the transmitter. Detection process in relay node is b ased on th e optim al threshol ds ex plained before and we use the optim al co ncentra tion for each distance ( d 12 , d 13 and d 32 in Figure 2). The follow ing cases consider two detecti on process es for the rec eiver no de. First relaying scheme: In this ca se, the transm itter releases defined concentrati on of type I molecules for each sym bol. T he relay node c an diagnose type I molecu les and by com paring the num ber of r eceive d molecules in each time slot with the threshol ds, it can detect sym bols. The Optim al thresho lds based on the value of d 12 are determ ined for this case. T he relay node releases co ncent ration of type II molecul es for each symbols. Detection process in th e Figure 2 . The Rel aying Scheme receiver carri es out just using type II molecules from the relay node. The r eceive r uses optimal thresholds based on the va lue of d 32 . Second relayi ng scheme: In the se cond case, the receiver does not ignor e type I molecules received from the transmitte r, and u ses Maximum A Poste riori (MAP) detecti on based on the two received types. In this paper, perform ance of the relaying system is investigated by using this kind of detection. By conducting sim ulations, first, we obtain decision bo unda ries for d ifferen t location of the relay node. T hen, we co mpare SERs for the different relay locations to specif y the optim al locati on of the relay node. IV. PERFORMANCE EV ALUATION In this section, we study the p erformance of our proposed relaying schemes. Fir st, we obtain the parameters of QCSK modulation op timally. Next, we pr esent simulation results for the relaying sche mes. In this sectio n, all si mulation res ults are provided with para meters given in Table I. A. Op timal thresholds To minimize symbol er ror rate, optimal thresholds for QCSK modulation ar e essential. W e obtain these opti mal thresholds for differe nt dis tances by conduc ting so me simulations. Notice t hat, we assume the transmi tted symbols have the same probability. T he probability density function (PDF) of the received molecules can be obtained via si mulation. These fo ur PDFs have three incidence points (intersection of nearby P DFs) which can be used as an ap proximation for the o ptimal threshold values. For exa mple, Figure 3 d epicts the PDFs corresponding to various symbols for d = 3 m and N = 15 0 over a noiseless channel. The incidence point of PDFs corr esponding to s ymbols “0” and “1”, is (x, y) = (10 7.8 , 0.003). The value of x-a xis shows approximated opti mum threshold 1 . If the hitting molecules b y the receiver is less than 108, symbol “0” is decoded . The 3 rd Iranian Confere nce on Comm unications Engineering (I CCE 2017) Shahid Rajaee Un iversity, Tehran, I ran, 23-24 February 2017 4 TABLE I . SIMULATI ON PARAMETERS Parameter Simulation Par ameters D 100μm 2 /s R relay , R receiver (radii) 4μm Symbol durati on 0.15s Sampling duratio n 0.15s Number of sy mbols 50000 Distance 6μm TABLE II . T HRESHOLDS Distance Thresholds 𝝉 1 𝝉 2 𝝉 3 1μm 80 213 345 2 μm 96 210 318 3 μm 108 198 287 4 μm 116 187 285 5 μm 122 180 235 6 μm 127 177 214 Table II includes the threshold values when the d istance between the transmitter and the receiver varies from 1 m to 6 m . Note that it is not necessarily i n the midpoint o f the released co ncentration per symbol. T his sho ws that a s distance increa ses, the value of 1 increases and the val ues of 2 and 3 decrease. For distance 1 m , 1 = 80 , 2 = 213 and 3 = 3 45. Fo r distance 6 m , 1 = 127 , 2 = 1 07 and 3 = 2 14. As you can see, the optimal thre sholds for distance 6 m are closer to each other, so, d etection process for this distance is har der and error probability is higher. In the next subsecti on, we o btain for N = 50 , 100 ,150 , and 300 , to compute the opti mal concentration values. B. Op timal Concentration Concentration level affects error probability directly. Re ducing concentrations, reduces the o verall effect of ISI, and increases the p robability of m iss detectio n and increasing conce ntrations enhances the ISI which in turn increases the probab ility of false alar m, so, so me opti mal concentrations must be utilize d. We conducting simulations to compute these concentrations for different distances. Figure 4 depicts SE R for N = 50, 10 0, 1 50, 3 00 and d= 5 m over noiseless cha nnel w hen the thres hold values are chosen optimally. Moreover, Figure 5 depicts SER when the channel is noisy and SN R varies from -5dB Figure 3 . Threshol ds for distance 3 m and N =150 Figure 4 . SER of vario us concentrations for distance 3 m ( S N R ) to 40dB. Both results sho w t hat that N = 150 has the minimum SER among all c ases. C. Relaying Scheme Here we assume that the concentratio n para meter is N =150 and the threshold values ar e chosen opti mally based on distances. The distance b etween the transmitter and the receiver is 6 m . W e exa mine the per formance o f the system by placi ng the relaying node at distances 2 m , 3 m and 4 m from t he tran smitter. Figur e 6 depicts SER for the first rela ying scheme. Optimal concentrations are utilized by the transmitter and the rela y node. T he receiver and the relay nod e use optimal t hresholds in detectio n processes. Noisy channel is considered and SNR v aries from -10dB to 1 5dB. As Figure 6 d epicts, SER reaches its minimum value for distance 3 m . For the second rela ying The 3 rd Iranian Confere nce on Comm unications Engineering (I CCE 2017) Shahid Rajaee Un iversity, Tehran, I ran, 23-24 February 2017 5 Figure 5 . SER of vario us concentrations vs. SN R for distance 3 m Figure 6 . SER of first re laying scheme scheme, w e need to specify d ecision’s b oundaries (regions) for the receiver. In Figure7 x-axis a nd y-axis are the number of type I and type II molecules which are received by the recei ver, when the r elay nod e is placed at distanced 1 m from t he transmitter and the channel is noiseless. We use four markers to clarify the boundar ies and regions for the symbols. In Fig ure 8, we e xpand regions of each sy mbol which are obtained from the last si mulation, so, we can use it in noisy channel as well. Next, we conduct si mulations when the relay nod e is placed at distance 2, 3, 4, 5 m from the transmitter and obtain the op timal bo undaries. Then, w e co mpute SER for each case. Fi gure 9 depicts SER when the rela y node is located at different distances and SNR varies from -10d B to 15dB. Figure 7 . Decision’s bou ndaries at distance 1 m , N = 150 Figure 8 . Expanded De cision’s boundaries a t distance 1 m , N = 150 This figure indicates t hat when the relay node is in distance 1 m from the trans mitter, the perfor mance of this relaying scheme is hi gher than other cases. In Figure10 we compared d ifferent r elay schemes with our p roposed scheme which is based on MAP detector. In [7], amplify and forward relaying was p resented. I n this paper, the relay node was placed in the middle b etween the transmitter a nd the receiver node and the a mplification factor was set as K=50. Decode and forward relaying has been p resented as Multi-Molecule mu lti -Hop Network (MM -MH) in [2]. MM - MH i s the same as our first rela ying scheme. Based on [2] and our simulations res ult in Figure6, we locate the relay node in the middle of distance between the transmitter and the rec eiver, 3 m from the tr ansmitter, in order to obtain the best p erformance for the relay node. The 3 rd Iranian Confere nce on Comm unications Engineering (I CCE 2017) Shahid Rajaee Un iversity, Tehran, I ran, 23-24 February 2017 6 Figure 9 . SER of the secon d relaying scheme Figure 10 . Comparing diffe rent relay ing schemes V. CONCLUSION In this paper, we considered a three -node network where a nano-relay is de ployed between a nano -transmitter and a nano-recei ver. W e st udied two schemes of rela ying. In both schemes, simulation results showed that t he qualit y of co mmunication can be significant ly improved after deploying relay node. Opti mal thresholds and concentration were also calcul ated to mitigate the effect of ISI. In the first relaying scheme, our simulation results showed that w hen relay n od e is in the midpoint of the transmitter a nd the receiver, SER is minimum. In the second relaying scheme, si mulations i ndicated that the optimal location o f the relay node is near to the tra nsmitter. In this sit uation, the results indicate d that the probab ility of correct decoding b y the relay node is substa ntially improved. Si mulation res ults sho w ed that o ur p roposed relaying sc heme has better p erformance tha n existi ng schemes. R EFERENCES [1] I. F. Aky ildiz and J. M. Jornet, ”The I nternet of na no - things,” I EEE Wirele ss Communications, vol. 17, n o. 6, pp. 5863, Dec. 2 010. [2] Ahmadzadeh, A rman, Adam Noel, and Robert Schober. ”Anal ysis and design of mult i-hop diffusion-base d molecular communicat ion networ ks.” (2014). [3] T. Nakano, M. Moore, F. Wei, A. Vasilakos, and J. Shuai, ”Molecular communication and networking: Opportunities and challenges,” IEEE Trans. Nan obiosc i., vol. 11, no. 2 , pp. 135148, Jun. 2012. [4] Y. Chahibi, M. Pier obon, S. O. Song, and I . Akyildiz, ”A mole cular communication system model for particulate drug delivery systems,” IEEE Trans. Biome d. Eng., vol. 60, no. 12, pp. 34683483, Dec. 2013. [5] T. Nakano and J. Shuai, ”Repe ater design and modeling for molecular comm unication netwo rks,” in Computer Communicatio ns Workshops I NFOCOM 2011. [6] Hong, L iang, Wei Chen, and Feng L iu. ”Cooperative molecular communication for nanone twork.” Sixth I nternational Confere nce on Ubiquitous and Future Netw orks (ICUFN) . 2014. [7] A. Ahmadzadeh, A. Noel, and R. Schober, ” Amplify -and-Forward Relaying in T wo-Hop diffusion-base d mo lecular communication networ ks. ” (2014) [8] H. B. Yilmaz, N.-R. Kim, and C.- B. Chae, ” Effect of ISI mitigation on modulation t echnique s in mole cular communication v ia diffusion,” in Pro c. ACM NAN OCOM, May 2014. [9] S. Redner, A guide to first-passage processe s. Cambridge University Pr ess, 2001. [ 10 ] W ang, Xiayang, Matthew D. Higgins, and Mark S. Leeson. ”Relay Analysis in Molecular Communications with Time-Dependent Concentration.” Commu nications Letter s, IEEE 19.11 (2015): 197 7 - 1980. [ 11 ] A . W. Eckford, ”Nanoscale communication with brownian motion,” in Proc. Conf. o n Inf. Sci. and Sy st. (CISS), Baltimore , MD, 2007. [ 12 ] N . Farsad, H. B. Yilmaz, A. Eckford, C.- B. Chae, and W. Guo, ”A comprehensive su rvey of r ecent advancements in molecular communication,” I EEE C ommunica tions Surveys and Tutorials, 2016. [ 13 ] H . B. Yilmaz , A. C. He ren, T. T ugcu, and C.- B. Chae, ”T hree dimensional channel characteristics for molecular communications with an absorbing receiver,” IEEE Communication . Letters. , vol. 18, no. 6, pp. 929932, June 2014. [ 14 ] M. Kuran, H. B. Yilmaz, T. Tugcu, and I. Akyildiz, ”Modulation tech niques for comm unication via d iffusion in nanonetwo rks,” in Proc .EEE I CC, Jun. 2011, pp. 15. [ 15 ] P eng He, Y uming Mao, Qiang Liu, and K un Yang. ”Adaptive Threshol d Variation Algorithm for Diffusion-based Molecular Communication”, in Proc. ACM NA NOCOM, 2015
Original Paper
Loading high-quality paper...
Comments & Academic Discussion
Loading comments...
Leave a Comment