Power Distribution System Synchrophasors with Non-Gaussian Errors: Real-World Measurements and Analysis
This letter studies the synchrophasor measurement error of electric power distribution systems with on-line and off-line measurements using graphical and numerical tests. It demonstrates that the synchrophasor measurement error follows a non-Gaussian…
Authors: Can Huang, Charanraj A. Thimmisetty, Xiao Chen
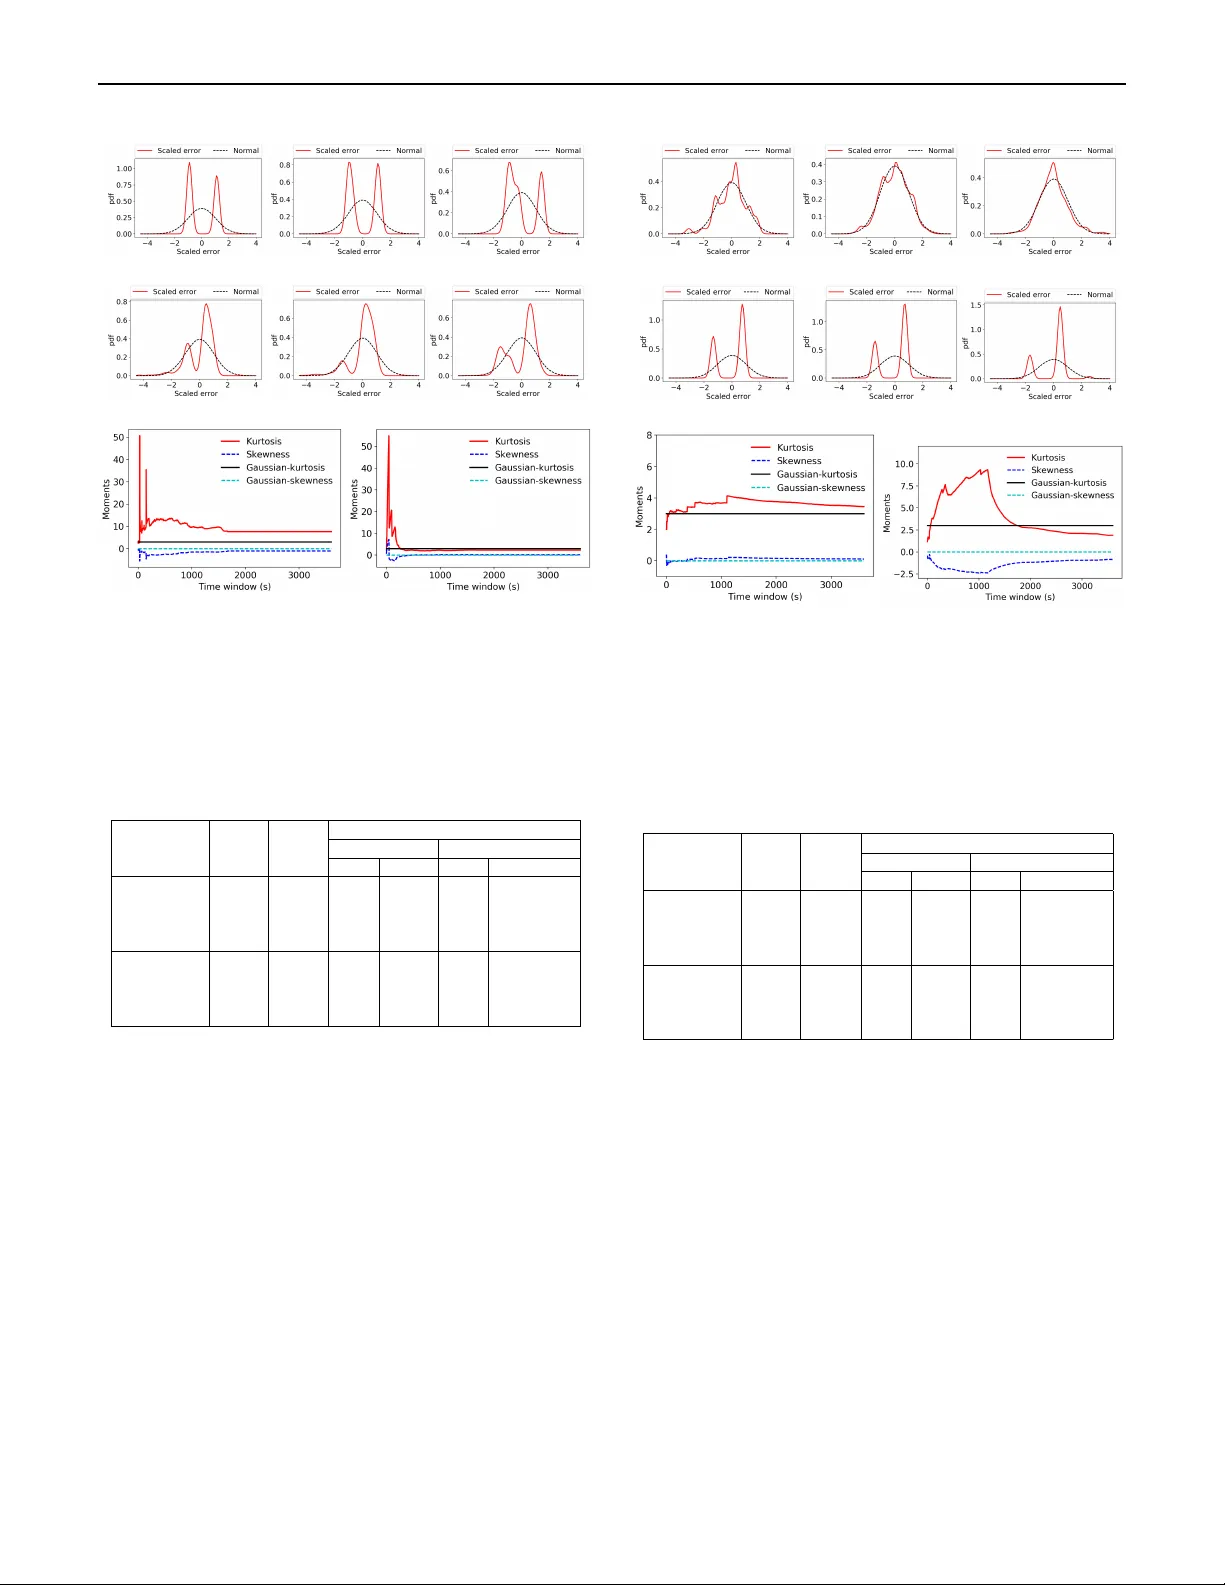
V OL., NO ., 2018 0000000 Sensor Applications P ower Distrib ution System Synchr ophasors with Non-Gaussian Err ors: Real-W orld Measurements and Analysis Can Huang , Charanraj A. Thimmisetty , Xiao Chen , Mert Korkali , V aibhav Donde , Emma Ste war t , Philip T op , Charles T ong , Liang Min Lawrence Livermore National Laboratory , Livermore, CA 94550, USA Abstract—This letter studies the synchrophasor measurement error of electric power distribution systems with on-line and off-line measurements using graphical and n umerical tests. It demonstrates that the synchrophasor measurement error f ollows a non-Gaussian distr ib ution instead of the tr aditionally-assumed Gaussian distribution. It suggests the need to use non-Gaussian or Gaussian mixture models to represent the synchrophasor measurement error. These models are more realistic to accur ately represent the error than the traditional Gaussian model. The measurements and underlying analysis will be helpful f or the understanding of distribution system measurement characteristics, and also f or the modeling and simulation of distribution system applications . Index T er ms—P ower distrib ution system, synchrophasor measurement error , state estimation, non-Gaussian, Gaussian mixture model. I. INTRODUCTION An electric power grid is an interconnected network for delivering electricity from generators to loads via transmission and distrib ution systems. It is also a network o verlaid with sensing and measurement, communication, and monitoring and control components that maintain grid reliability , security , and efficiency . T oday’ s power grid has been ev olving into the ‘smart grid’ to provide more reliable, more efficient, and more sustainable electricity to customers [1]–[3]. T o achie ve these attributes, a v ariety of smart grid technologies are needed. In sensor and measurement fields, the ‘synchrophasor’ is one of the most important smart grid technologies [1]–[6]. A synchrophasor system consists primarily of phasor measurement units (PMUs), phasor data concentrators (PDCs), and communication networks, as shown in Fig. 1. It typically uses PMUs to produce synchrophasor measurements from current and voltage signals (e.g., the ones from current and voltage transducers) and a standard time signal (e.g., the one from a global positioning system (GPS)). It then utilizes PDCs to transfer synchrophasor data from PMUs/PDCs to a control center and/or various applications [1]–[4]. In the past decade, an increasing number of synchrophasor systems hav e been installed around the world and a series of synchrophasor applications have been implemented in grids. The North American SynchroPhasor Initiativ e (N ASPI) reports that there are about 2,000 commercial PMUs installed across North America, and more than 20 kinds of PMU-based applications under research and development [5], [6]. The synchrophasor is expected to perform high-precision, low- latency , and time-synchronized measurement and provide significant insight into grid planning and operation. In practice, the synchrophasor inevitably in volv es measurement errors, which may affect or ev en disable certain synchrophasor applications [5]–[10]. It is a challenging yet critical task to analyze and model the synchrophasor measurement error . T raditionally , the synchrophasor is designed for transmission systems and the synchrophasor measurement error is assumed as a Gaussian noise in most synchrophasor applications. Several studies point out that this assumption is violated in reality and the results are Corresponding author: X. Chen (e-mail: chen73@llnl.gov). Associate Editor: Digital Object Identifier: Fig. 1. A synchrophaor system ov er an electr ic po wer grid. misleading or ev en damaging to certain applications (e.g., PMU-based state estimation) [8]–[10]. For example, W ang et al . analyze real PMU measurements and reveal that the PMU measurement errors do not follow a Gaussian distribution [8]; and Mili et al . assess the sensitivity of different state estimators to Gaussian/non-Gaussian noises and develop a robust state estimation method to cope with non-Gaussian measurement errors [9]. Now the synchrophasor is being extensi vely deployed in distribution systems, such as micro-PMUs ( µ PMUs) and FNET/GridEye [11]– [14]. Compared with transmission systems, distribution systems are in vested with fewer sensors and measurements, and distribution networks are often plagued by large measurement uncertainties due to their highly distributed and di verse infrastructure. At present we pay increasingly more attention to distribution systems, especially with the rapid development of distributed energy resources (DER) and distribution management systems (DMS). Howev er, we have very limited knowledge about the nature of distribution system mea- surement errors. Accordingly , NASPI established Distribution T ask T eam (N ASPI DisTT) to promote the distribution-le vel synchrophasor dev elopment. In NASPI DisTT 2017 W inter Report, one of the 0000000 V OL., NO ., 2018 most urgent tasks is to inv estigate the nature of the synchrophasor measurement error in real distribution systems [11]. This letter in vestigates the distribution system synchrophasor measurement error with on-line and off-line measurements, and identifies the distrib ution of the measurement error using both graphical and numerical methods. T o the best knowledge of the authors, this is the first paper to perform this kind of studies with real-world measurements and analysis. The results will be useful for the modeling and simulation of distribution systems, and also for the design and development of adv anced DER and DMS applications. II. METHODOLOGY In this letter, the measurement error is defined as the difference between the measured and true values of a selected quantity . It mainly consists of two components: a systematic error and a random error , which are often represented by a consistent bias and a random noise, respectiv ely . In theory , the random error plays a decisive role in the distribution of measurement errors, which is typically introduced by unknown and unpredictable changes occurring in measurement devices (e.g., the electronic noise and circuit aging) and/or in the en vironment (e.g., the wind, temperature, and communication). T o in vestigate the distribution of the distribution-le vel synchrophasor measurement error thoroughly , tests are performed in v arious measurement de vices including PMUs, µ PMUs, and FNET/GridEye, and in different en vironments covering both primary and secondary distribution systems. In the following, we begin with the explanation of the measurement and analysis methods. Measurement : It is difficult to obtain directly the real-time measurement error between the measurement and the true values. Here, the distrib ution of the measurement error is identified indirectly through multiple synchronized measurements (MSMs), whereby multiple identical and independent synchrophasor measuring de vices are deployed to simultaneously and independently meter the quantity x with the measurement ( z i = x + e i , z j = x + e j , i and j ∈ N ) and the measurement error ( e i , e j ). Subsequently , the Gaussian/non- Gaussian distribution of the measurement error can be determined by constructing the distribution of the difference of the MSM errors or MSMs, i.e. ∆ e = e i − e j , ∆ z = z i − z j , and ∆ e = ∆ z . The general principle is: if A and B are two independent random variables, and they are both normally distrib uted, then A ± B is normally distrib uted ( Proposition ); and if A ± B is not normally distributed, then either A or B (or both) is not normally distributed ( Contraposition ). In other words, if ∆ e = e i − e j is non-Gaussian, then e i or/and e j is non- Gaussian. Since the measurements are taken from identical devices around very similar en vironment where the measurement errors are supposed to follow the same distribution, it can thus be argued that if ∆ e is non-Gaussian, then both e i and e j are non-Gaussian. In addition to the on-line test described above, an off-line test is carried out on a distribution monitoring platform FNET/GridEye, in which a distribution signal is generated by a power system simulator and measured by a high-precision frequenc y disturbance recorder (FDR), and the resulting measurement error is calculated by a calibrator . Analysis : There are two common ways to check normal- ity/Gaussianity , namely , graphical methods and numerical meth- ods [15]. Here, the measurement z ( t , ω ) , t ∈ T , ω ∈ Ω is viewed as a stochastic process defined on the probability space ( Ω , F , P ) ov er time T . The graphical method is implemented using the scaled (a) (b) (c) (d) Fig. 2. T est 1 results: (a) pdf of the voltage angle error differences ∆ e s with standard Gaussian for time windows of 1s, 5s, 10s; (b) pdf of the v oltage magnitude error diff erences ∆ e s with standard Gaussian for time windows of 1s, 5s, and 10s; (c) v ar ying time windows versus ske wness and kur tosis of voltage angle ∆ e ; and (d) varying update period versus ske wness and kur tosis of voltage magnitude ∆ e . T ABLE 1. Summary of the Gaussianity T ests on µ PMU Data Measurement Time window (s) Sample size % of non-Gaussian distributions Shapiro-Wilk K olmogorov-Smirnov α =5% α =10% α =5% α =10% V oltage angle 1 120 89.5 93.5 40 49.5 5 600 99 99 75 81.5 10 1200 100 100 76.5 84 30 3600 99.5 100 81 85 V oltage magnitude 1 120 74.5 82 27 37.5 5 600 98.5 98.5 65.5 72 10 1200 99.5 99.5 78 84 30 3600 100 100 95.5 97.5 error ∆ e s ( ω ) along with the standard Gaussian distrib ution to visualize the de viation from Gaussianity . The numerical method is performed with the Shapiro-W ilk (SW) and Kolmogorov-Smirno v (KS) tests, which reject or accept null hypothesis of Gaussianity using test index and % confidence index α [15]. ∆ e s ( ω ) = ∆ e ( ω ) − µ ∆ e σ ∆ e , (1) where µ ∆ e and σ ∆ e are the mean and standard deviation of ∆ e ( ω ) . III. RESUL TS In power engineering, distribution systems are monitored by various sensing and measuring de vices with multiple time scales, like µ PMU with reporting rate 120 fps, PMU with reporting rate 10/30/60 fps, and supervisory control and data acquisition (SCAD A) updating a frame in every few seconds. In statistics, a statistical test has little power when the sample size is extremely small or large (e.g., sample size < 30 or > 6000 ) [15], [16]. Thus, in the tests described below , V OL., NO ., 2018 0000000 (a) (b) (c) (d) Fig. 3. T est 2 results: (a) pdf of the voltage angle error differences ∆ e s with standard Gaussian for time windows of 1s, 5s, 10s; (b) pdf of the v oltage magnitude error diff erences ∆ e s with standard Gaussian for time windows of 1s, 5s, and 10s; (c) v ar ying time windows versus ske wness and kur tosis of voltage angle ∆ e ; and (d) varying update period versus ske wness and kur tosis of voltage magnitude ∆ e . T ABLE 2. Summary of the Gaussianity T ests on PMU Data Measurement Time window (s) Sample size % of non-Gaussian distributions Shapiro-Wilk K olmogorov-Smirnov α =5% α =10% α =5% α =10% V oltage angle 1 60 44 48 24 28 5 300 96 100 88 88 10 600 100 100 100 100 60 3600 100 100 100 100 V oltage magnitude 1 60 4 8 0 0 5 300 84 88 36 40 10 600 92 92 72 72 60 3600 100 100 100 100 the distributions under different time windows and sample sizes are considered collectiv ely . In T est 1, a voltage phasor in a primary distribution system is measured using two µ PMUs, and in T est 2, a voltage phasor in a secondary distribution system is metered with two PMUs manufactured by the same vendor . Figs. 2(a), 2(b), 3(a), and 3(b) describe the probability density functions (pdf) of the scaled error ∆ e s along with the standard Gaussian distribution within different time windows. The results show that the distributions in various cases are all non-Gaussian with multiple peaks and they are non- symmetric. Figs. 1(c) 1(d), 2(c), and 2(d) show the varying time window versus ske wness (third-order moment) and kurtosis (fourth- order moment) of ∆ e . W e observe that the skewness deviates from zero and kurtosis departs from Gaussian-kurtosis, which demonstrate the non-symmetric and long- or short-tail nature of the pdf of ∆ e ev en for the large time window . Also, T ables I and II give the percentage of non-Gaussian random variables (rvs) out of the total random samples taken with different time windows and different (a) (b) (c) (d) Fig. 4. T est 3 results: (a) pdf of the v oltage angle errors with standard Gaussian for time windows of 5s, 30s, 60s; (b) pdf of the voltage magnitude errors with standard Gaussian for time windows of 5s, 30s, and 60s; (c) v arying time windo ws vs skewness and kurtosis of v oltage angle ∆ e ; and (d) varying time windows vs skewness and kur tosis of voltage magnitude ∆ e . T ABLE 3. Summary of the Gaussianity T ests on FDR Data Measurement Time window (s) Sample size % of non-Gaussian distributions Shapiro-Wilk K olmogorov-Smirnov α =5% α =10% α =5% α =10% V oltage angle 5 50 32 46 4 10 30 300 100 100 100 100 60 600 100 100 100 100 120 1200 100 100 100 100 V oltage magnitude 5 50 100 100 100 100 30 300 100 100 100 100 60 600 100 100 100 100 120 1200 100 100 100 100 sample sizes (note that SW test is generally more powerful than KS test and the power of both KS and SW tests is low for small sample, e.g, sample size < 60 [15]). It is observed that most rvs are non-Gaussian based on the SW and KS tests, and that their joint distribution is non-Gaussian. Moreover , the skewness and kurtosis in Figs. 2(c) and 2(d) are much higher than the ones in Figs. 1(c) and 1(d), partially because the measurement error in the secondary distribution system is more vulnerable to en vironmental changes than the measurement error in the primary distribution system. Furthermore, in T est 3, an off-line test is carried out on the FNET/GridEye platform using the FDR with the reporting rate of 10 fps. It is found from Fig. 4 and T able III that ev en though there are few environmental fluctuations in the laboratory environment, the observed measurement errors still follow a non-Gaussian distribution. Through the on-line and off-line measurements and the graphical and numerical analysis, extensi ve results rev eal that the real-world measurement error potentially follo ws a non-Gaussian distribution. 0000000 V OL., NO ., 2018 IV . CONCLUSION T oday’ s electric power distribution system is being transformed from a passive system into an active and intelligent network. It is advantageous to understand the distribution-lev el measurement characteristics, which is critical to distribution system planning and operation. This letter studies the distribution-lev el synchrophasor measurement error and shows that, based on a series of tests, the measurement error follows a non-Gaussian distribution instead of the traditionally-assumed Gaussian distribution. It suggests the use of non-Gaussian or Gaussian mixture model (GMM) for modeling the distribution synchrophasor measurement error, which is more accurate and more realistic than the traditional Gaussian model. The presented measurements and analysis will become helpful for the understanding of distribution measurement characteristics, and for the modeling and simulation of distribution system applications. The future work includes parameterization of both synchronized and non-synchronized distrib ution measurements with adv anced data analytics and data-intensi ve machine learning, and also the application of the results to DER and DMS studies. V . ACKNO WLEDGMENT This work was sponsored by the U.S. Department of Energy through its Laboratory Directed Research and Development (LDRD) program. This work was performed under the auspices of the U.S. Department of Energy by Lawrence Liv ermore National Laboratory under Contract DE-A C52-07NA27344 with IM release number LLNL-JRNL-740270. REFERENCES [1] H. Gharavi and B. Hu, “Synchrophasor sensor networks for grid communication and protection, ” Proc. IEEE , vol. 105, no. 7, pp. 1408–1428, July 2017. [2] R. Morello, S. C. Mukhopadhyay , Z. Liu, D. Slomovitz, and S. R. Samantaray , “ Advances on sensing technologies for smart cities and po wer grids: A revie w , ” IEEE Sensors J. , vol. 17, no. 23, pp. 7596–7610, Dec 2017. [3] E. Y . Song, G. J. FitzPatrick, and K. B. Lee, “Smart sensors and standard-based interoperability in smart grids, ” IEEE Sensors J. , vol. 17, no. 23, pp. 7723–7730, Dec 2017. [4] D. Pal, B. Mallikarjuna, R. J. Reddy , M. J. B. Reddy , and D. K. Mohanta, “Synchrophasor assisted adaptive relaying methodology to prevent zone-3 mal- operation during load encroachment, ” IEEE Sensors J. , vol. 17, no. 23, pp. 7713– 7722, Dec 2017. [5] C. Huang, F . Li, D. Zhou, J. Guo, Z. Pan, Y . Liu, and Y . Liu, “Data quality issues for synchrophasor applications part i: a re view , ” J. Mod. P ower Syst. Clean Ener gy , vol. 4, no. 3, pp. 342–352, July 2016. [6] C. Huang, F . Li, L. Zhan, Y . Xu, Q. Hu, D. Zhou, and Y . Liu, “Data quality issues for synchrophasor applications part ii: Problem formulation and potential solutions, ” J. Mod. P ower Syst. Clean Energy , vol. 4, no. 3, pp. 353–361, July 2016. [7] G. Rigatos, D. Serpanos, and N. Zervos, “Detection of attacks against power grid sensors using kalman filter and statistical decision making, ” IEEE Sensors J. , vol. 17, no. 23, pp. 7641–7648, Dec 2017. [8] S. W ang, J. Zhao, Z. Huang, and R. Diao, “ Assessing gaussian assumption of pmu measurement error using field data, ” IEEE T rans. P ower Syst. , in-Press. [9] J. Zhao and L. Mili, “ A framew ork for robust h ybrid state estimation with unkno wn measurement noise statistics, ” IEEE T rans. Ind. Informat. , in-Press. [10] P . A. Pegoraro, A. Angioni, M. Pau, A. Monti, C. Muscas, F . Ponci, and S. Sulis, “Bayesian approach for distribution system state estimation with non-gaussian uncertainty models, ” IEEE T rans. Instrum. Meas. , in-Press. [11] “Synchrophasor monitoring for distribution systems: T echnical foundations and applications, ” NASPI DisTT , T ech. Rep., 2017. [12] P ower Standards Lab . URL: http://pqubepmu.com/about.php. [13] A. Meier , E. Ste wart, A. McEachern, M. Andersen, and L. Mehrmanesh, “Precision micro-synchrophasors for distribution systems: A summary of applications, ” IEEE T rans. Smart Grid , in-Press. [14] Y . Liu, S. Y ou, W . Y ao, Y . Cui, L. W u, D. Zhou, J. Zhao, H. Liu, and Y . Liu, “ A distribution level wide area monitoring system for the electric power grid- fnet/grideye, ” IEEE Access , vol. 5, pp. 2329–2338, 2017. [15] N. M. Razali and Y . B. W ah, “Power comparisons of Shapiro-Wilk, Kolmogorov- Smirnov , Lilliefors and Anderson-Darling tests, ” J. Stat. Model Anal. , vol. 2, no. 1, pp. 21–33, 2011. [16] A. Ghasemi and S. Zahediasl, “Normality tests for statistical analysis: A guide for non-statisticians, ” Int. J. Endocrinol. Metab. , vol. 10, no. 2, pp. 486–489, 2012.
Original Paper
Loading high-quality paper...
Comments & Academic Discussion
Loading comments...
Leave a Comment