Enhanced Linear-array Photoacoustic Beamforming using Modified Coherence Factor
Photoacoustic imaging (PAI) is a promising medical imaging modality providing the spatial resolution of ultrasound (US) imaging and the contrast of pure optical imaging. For linear-array PAI, a beamformer has to be used as the reconstruction algorith…
Authors: Moein Mozaffarzadeh, Yan Yan, Mohammad Mehrmohammadi
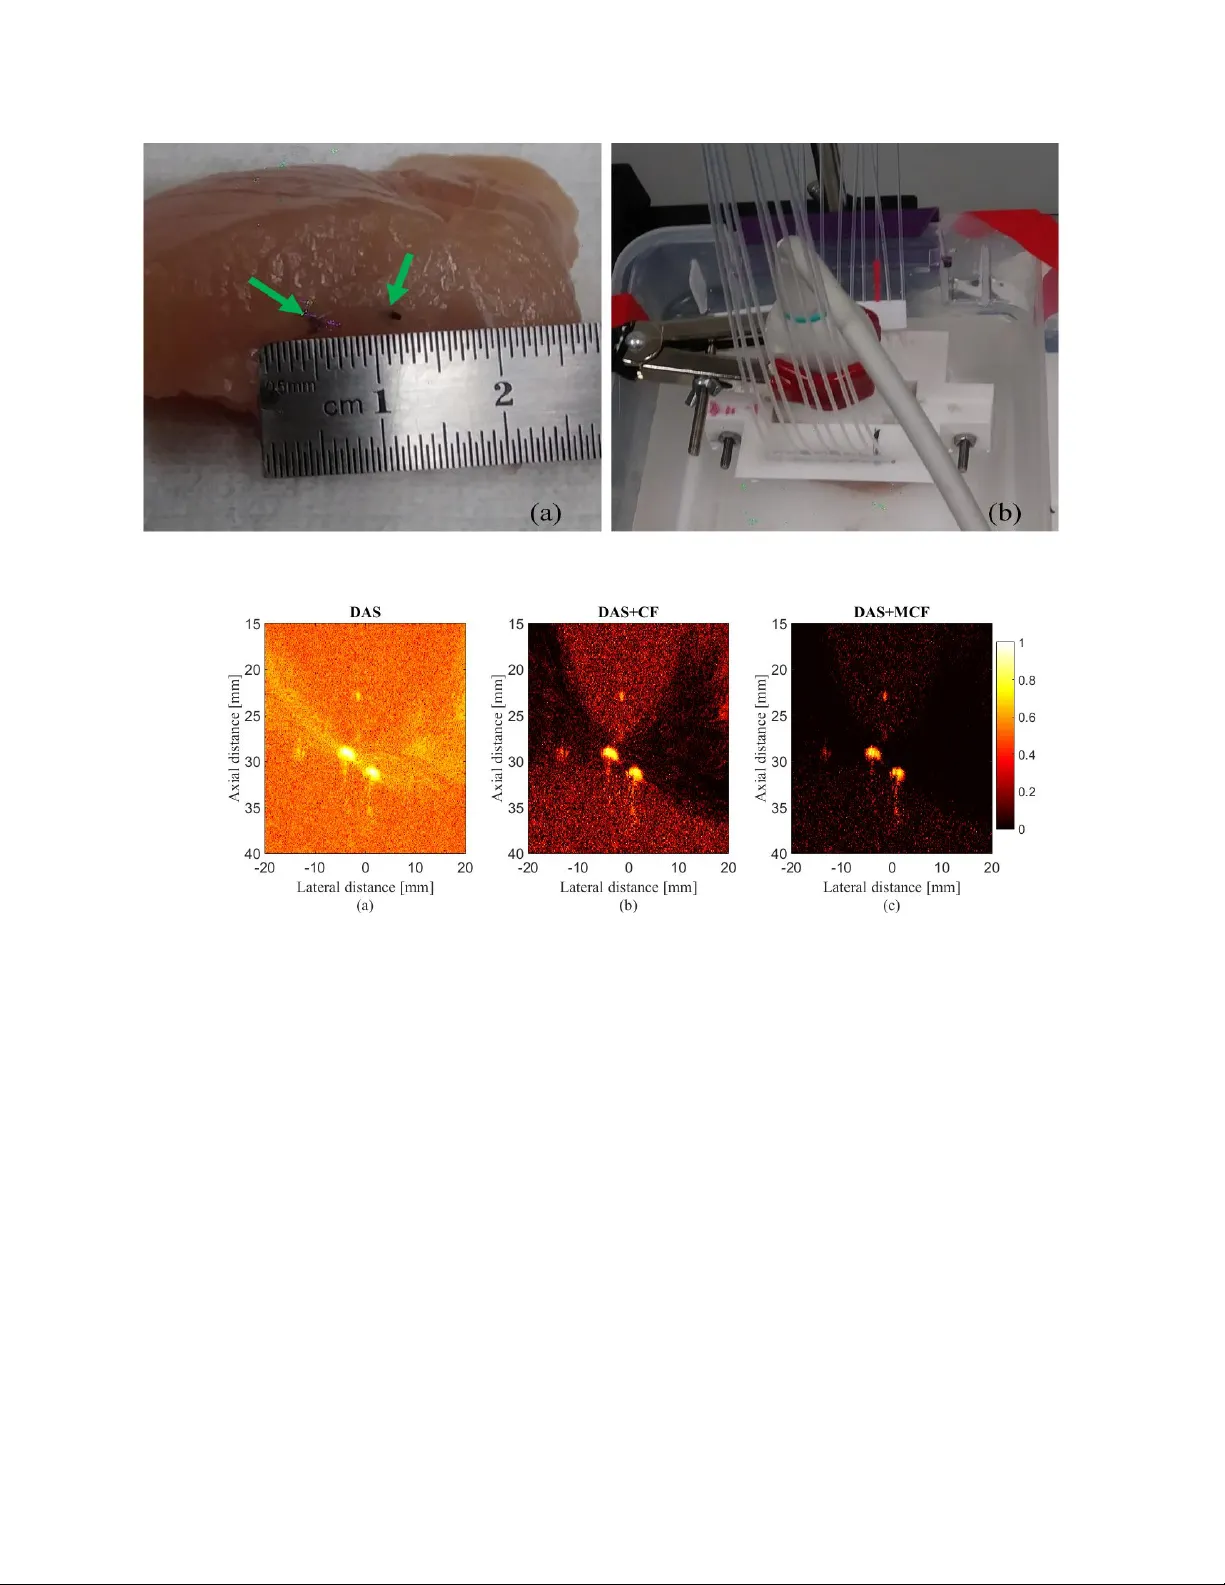
Enhanced Linear -array Photoacoustic Beamf orming using Modified Coher ence F actor Moein Mozaffarzadeh a,c , Y an Y an d , Mohammad Mehrmohammadi d , Bahador Makkiabadi a,b,* a Research Center for Biomedical T echnologies and Robotics (RCBTR), Institute for Advanced Medical T echnologies (IAMT), T ehran, Iran. b Department of Medical Physics and Biomedical Engineering, School of Medicine, T ehran Uni versity of Medical Sciences, T ehran, Iran. c Department of Biomedical Engineering, T arbiat Modares University , T ehran, Iran. d Department of Biomedical Engineering, W ayne State University , Detroit, MI, USA. Abstract. Photoacoustic imaging (P AI) is a promising medical imaging modality providing the spatial resolution of ultrasound (US) imaging and the contrast of optical imaging. For linear -array P AI, an image beamformer can be used as the reconstruction algorithm. Delay-and-sum (D AS) is the most pre v alent beamforming algorithm in P AI. Ho wev er, using D AS beamformer leads to lo w resolution images as well as high sidelobes due to non desired contribution of off-axis signals. Coherence factor (CF) is a weighting method in which each pix el of the reconstructed image is weighted, based on the spatial spectrum of the aperture, to mainly impro ve the contrast. In this paper , we demonstrate that the numerator of the formula of CF contains a D AS algebra, and it is proposed to use the delay-multiply-and-sum (DMAS) beamformer instead of the av ailable DAS on the numerator . The proposed weighting technique, modified CF (MCF), has been ev aluated numerically and experimentally compared to CF . It was sho wn that MCF leads to lower sidelobes and better detectable tar gets. The quantitati ve results of the experiment (using wire targets) sho w that MCF leads to for about 45% and 40% improvement, in comparison with CF , in the terms of signal-to-noise ratio and full-width-half-maximum, respectiv ely . Keyw ords: Photoacoustic imaging, beamforming, linear-array imaging, noise suppression, contrast impro vement.. * Bahador Makkiabadi, b-makkiabadi@tums.ac.ir 1 Introduction Photoacoustic imaging (P AI), also called optoacoustic imaging, is an emer ging medical imaging technique which combines the properties of optical and ultrasound (US) imaging. 1 , 2 P AI is based on the photoacoustic (P A) ef fect, and combined US and P A properties provide structural, func- tional and potentially the molecular information of tissue. 3 , 4 In this imaging modality , acoustic wa ves are generated, as a result of an electromagnetic pulse illumination, based on thermoelastic ef fect. 5 Then, the optical absorption distrib ution map of the tissue is reconstructed through a recon- struction algorithm. 6 P AI is a scalable imaging modality used in dif ferent preclinical and clinical applications e.g., tumor detection, 7 , 8 ocular imaging, 9 monitoring oxygenation in blood vessels, 10 1 and functional imaging. 5 , 11 There are two types of P AI: photoacoustic tomography (P A T) and pho- toacoustic microscopy (P AM). 12 – 14 In P A T , an array of US transducers in the form of linear , arc or circular shape is used for data acquisition, and mathematical reconstruction algorithms are used to obtain optical absorption distribution map of the tissue. 15 Recently , lo w-cost P A T and P AM systems are extensi vely being in vestigated 16 – 19 In linear-array P AI, image reconstruction is done with beamformers, as in US imaging. The prob- lem of image reconstruction in linear -array imaging for P AI and US imaging can be addressed in almost a same way . There are some modifications which should be considered in image recon- struction for these two imaging modalities, and the modifications are directly concerned with the transmission part. 20 In US imaging, US pulses are transmitted, but in P AI, the laser illumination plays the excitation role. There are many studies focused on using one beamforming technique for US and P A image formation to reduce the cost of the integrated US/P A system. 21 – 23 Delay- and-sum (D AS), as the most basic and commonly used beamformer in US and P AI due to its simple implementation, is a blind beamformer and results in lo w quality images. 24 De velopment of a proper beamforming algorithm has been widely in vestigated in US imaging in different stud- ies. 25 – 28 Adapti ve beamforming such as minimum variance (MV) can be a proper option to weight the signals and reduce the effect of the of f-axis signals in the reconstructed images. 29 MV com- bined with CF has been used for P AI. 30 Short-lag spatial coherence (SLSC) beamformer was used in P AI for contract enhancement. 31 Recently , to address the relati vely poor appearance of inter- ventional de vices such as needles, guide wires, and catheters, in con ventional US images, delay and standard de viation (D ASD) beamforming algorithm was introduced. 32 In 2015, 33 Matrone et al . introduced a ne w beamforming algorithm namely delay-multiply-and-sum (DMAS). This al- gorithm was initially used as a reconstruction algorithm in confocal microw av e imaging for breast 2 cancer detection. 34 Although it leads to a higher resolution compared to D AS, the resolution is not well enough in comparison with the resolution gained by MV -based algorithms. MV beamformer has been combined with DMAS algorithm to improve the resolution of DMAS. 35 , 36 Double stage DMAS (DS-DMAS) was introduced for P AI. 37 , 38 In addition, it was shown that it outperforms DMAS in the terms of contrast and sidelobes for US imaging too. 39 Eigenspace-Based Minimum V ariance (EIBMV) and forward-backward (FB) MV beamformers also hav e been applied to med- ical US imaging to improv e the image quality and robustness. 40 , 41 EIBMV was combined with DMAS to further improv e the P A image quality . 42 , 43 In this paper , a novel version of coherence factor (CF) algorithms is introduced. W e hav e demon- strated that the numerator in the formula of the CF weighting procedure is the output of D AS algorithm, and it is proposed to improv e the image quality by including DMAS algebra in CF , instead of the existing D AS. The rest of the paper is org anized as follo ws. Section 2 contains the theory of beamformers and the proposed method. Numerical simulation of the imaging system and the experimental design along with the results, and the performance ev aluation are presented in section 3 and section 4 , respecti vely . Discussion is presented in section 5 , and finally the conclusion is presented in section 6 . 2 Materials and Methods P A signals are generated and detected after the laser has illuminated the imaging tar get. The obtained signals can be used to reconstruct the P A images through a reconstruction algorithm such 3 as D AS which can be written as follows: y DAS ( k ) = M X i =1 x i ( k − ∆ i ) , (1) where y DAS ( k ) is the output of beamformer , k is the time index, M is the number of array el- ements and x i ( k ) and ∆ i are the detected signals and the corresponding time delay for detector i , respecti vely . 44 T o provide a more efficient beamformer and improv e the quality of the recon- structed image, coherence factor (CF) can be used combined with D AS, which leads to sidelobe le vels reduction and contrast enhancement. 45 CF , as a weighting procedure, is presented by: C F ( k ) = P M i =1 x id ( k ) 2 M P M i =1 | x id ( k ) | 2 , (2) where x id is the delayed detected signal. The output of combined D AS and CF is giv en by: y DAS + C F ( k ) = C F ( k ) × y DAS ( k ) . (3) Implementing the D AS beamformer is simple which is why is it the most common beamforming algorithm in US and P AI. Howe ver , this algorithm provides a low of f-axis signal rejection and noise suppression. Consequently , D AS results in reconstructed images ha ving high lev els of sidelobe and a low resolution. T o address the limitations of D AS, DMAS was suggested in. 33 The same as D AS, DMAS calculates corresponding samples for each element of the array based on the delays, but samples go through a correlation process before adding them up. The DMAS formula is as follows: 4 y DM AS ( k ) = M − 1 X i =1 M X j = i +1 x i ( k − ∆ i ) x j ( k − ∆ j ) . (4) T o overcome the dimensionally squared problem of ( 4 ), following modifications are suggested in: 33 ˆ x ij ( k ) = sign [ x i ( k − ∆ i ) x j ( k − ∆ j )] q | x i ( k − ∆ i ) x j ( k − ∆ j ) | , for 1 6 i 6 j 6 M . (5) y DM AS ( k ) = M − 1 X i =1 M X j = i +1 ˆ x ij ( k ) . (6) DMAS algorithm is a correlation process, and a non-linear beamforming algorithm in which the autocorrelation of the aperture is used. A product in time domain is equiv alent to the con volution of the spectra of the signals in the frequency domain. Consequently , new components centered at the zero frequency and the harmonic frequenc y appear in the spectrum due to the similar ranges of frequency for x i ( k − ∆ i ) and x j ( k − ∆ j ) . A band-pass filter is applied on the beamformed output signal to only pass the necessary frequency components, generated after the non-linear operations. Having a closer look at ( 2 ), the numerator of CF algorithm is the output of D AS beamformer , and the formula can be written as follo ws: C F ( k ) = y DAS ( k ) 2 M P M i =1 | x id ( k ) | 2 . (7) Having CF combined with D AS, ( 3 ), leads to sidelobes reduction and contrast enhancement com- pared to ( 1 ). Howe ver , in this paper, it is proposed to use the output of DMAS algorithm instead 5 of the D AS algebra on the numerator of CF formula. The proposed weighting is called modified CF (MCF), and its algebra is as follo ws: M C F ( k ) = y DM AS ( k ) 2 M P M i =1 | x id ( k ) | 2 . (8) MCF will be used the same as CF to weight the samples. The combination of D AS and MCF can be written as follo ws: y DAS + M C F ( k ) = M C F ( k ) × y DAS ( k ) . (9) Since the DMAS outperforms D AS in the terms of resolution and sidelobes, it is expected that the proposed weighting method provides a higher image quality compared to ( 2 ). In what follows, it is sho wn that the proposed method outperforms the con ventional CF weighting. 3 Numerical Results and Perf ormance Assessment In this section, numerical results are presented to e valuate the performance of the proposed algo- rithm in comparison with D AS and combination of D AS and CF (D AS+CF). 3.1 P oint T ar gets K-wa ve Matlab toolbox was used to simulate the numerical study. 46 Ele ven 0.1 mm spherical absorbers were positioned along the vertical axis ev ery 5 mm as initial pressure. The first absorber was 25 mm aw ay from the transducer surface. The imaging region was 20 mm in lateral axis and 80 mm in v ertical axis. A linear array ha ving M =128 elements operating at 7 M H z central frequency and 77 % fractional bandwidth was used to detect the P A signals generated from defined initial pressures. The sampling frequency is 50 M H z . Speed of sound was assumed to be 1540 6 Fig 1: Reconstructed images for simulated detected data using (a) D AS, (b) D AS+CF and (c) D AS+MCF . A linear array and point targets were used for numerical design. All images are sho wn with a dynamic range of 60 dB . Noise was added to the detected signals having a SNR of 50 dB . m/s during simulations. En velope detection, performed by means of the Hilbert transform, has been used for all presented images, and the obtained lines are normalized and log-compressed to form the final images. The reconstructed images are sho wn in Fig. 1 where Gaussian noise w as added to the detected sig- nals having a SNR of 50 dB . As is demonstrated, D AS leads to high sidelobes and after the depth of 50 mm the targets are barely detectable as a point tar get. Using CF combined with D AS results in lower sidelobes and a higher image quality . Fig. 1 (c) sho ws that the proposed method suppresses the artif acts and sidelobes more than the con ventional CF . T o compare the reconstructed images in detail, the lateral v ariations at two depths of imaging are shown in Fig. 2 . As it is demonstrated, the MCF method causes lower sidelobes. Consider , for instance, the depth of 25 mm where the le vels of sidelobes for D AS, D AS+CF and D AS+MCF are for about -36 dB , -99 dB and -124 dB , which indicates the superiority of the proposed method compared to the con ventional CF in the 7 Fig 2: Lateral v ariations of the reconstructed images shown in Fig. 1 at the depths of (a) 25 mm and (b) 40 mm . Fig 3: Reconstructed images for simulated detected data using (a) D AS, (b) D AS+CF and (c) D AS+MCF . A linear array and point targets were used for numerical design. All images are sho wn with a dynamic range of 60 dB . Noise was added to the detected signals having a SNR of 0 dB . term of sidelobe reduction. T o ev aluate the proposed method at the presence of high level of noise of the imaging system, Gaussian noise w as added to the detected signals having a SNR of 0 dB . The reconstructed im- ages are sho wn in Fig. 3 , and as can be seen, the formed image obtained by D AS is highly af fected by noise. CF improv es the image quality by suppressing the ef fects of noise. Howe ver , the side- lobes still degrade the image quality . The MCF reduces the sidelobes and improves the target 8 Fig 4: Lateral v ariations of the reconstructed images shown in Fig. 3 at the depths of (a) 25 mm and (b) 45 mm . detectability , resulting in a higher image quality in comparison with CF . It should be noticed that the absence of the tails attached to the targets (can be seen in Fig. 1 ) is due to the high lev el of noise. T o put it more simply , the po wer of noise is more than the tails, and that is why the y are not seen in Fig. 3 . The lateral variations for the images shown in Fig. 3 , are shown in Fig. 4 , and as can be seen, the higher performance of MCF in the terms of sideloebs and noise suppression, compared to CF , is clear . 3.2 Quantitative Evaluation T o quantitati vely assess the performance of the proposed weighting method, the full-with-half- maximum (FWHM) in -6 dB and signal-to-noise ratio (SNR) are calculated and presented in T able 1 and T able 2 , respecti vely . SNR is calculated using the method explained in. 37 As sho wn in T able 1 , the FWHM gained by MCF , at the all depths, is lo wer than CF , sho wing the superiority of MCF . Consider , for instance, the depth of 40 mm where D AS, D AS+CF and D AS+MCF results in 2.2 mm , 1.3 mm and 0.9 mm , respecti vely . In other w ord, MCF impro ves the FWHM for about 0.4 mm compared to CF . As shown in T able 2 , SNR gained by the proposed weighting method is higher compared to the CF which also indicates the superiority of MCF . Consider , for example, the depth of 50 mm where the SNR for D AS, D AS+CF and D AS+MCF is for about 36.9 dB , 65.0 9 T able 1: -6 dB FWHM ( mm ) v alues at the different depths. ` ` ` ` ` ` ` ` ` ` ` ` ` ` ` Depth( mm ) Beamformer D AS D AS+CF D AS+MCF 25 1.1 0.6 0.4 30 1.3 0.8 0.6 35 1.6 0.9 0.7 40 1.9 1.1 0.8 45 2.2 1.3 0.9 50 2.6 1.6 1.1 55 3.0 1.8 1.3 60 3.5 2.1 1.5 65 3.7 2.2 1.6 70 4.2 2.5 1.8 75 4.8 2.9 2.0 T able 2: SNR ( dB ) values at the dif ferent depths. ` ` ` ` ` ` ` ` ` ` ` ` ` ` ` Depth( mm ) Beamformer D AS D AS+CF D AS+MCF 25 47.2 76.3 119.6 30 44.7 73.0 116.9 35 43.0 72.9 117.8 40 40.7 69.5 116.5 45 38.9 68.0 113.3 50 36.9 65.0 110.4 55 35.3 63.4 109.0 60 34.2 61.8 107.3 65 33.5 60.1 105.3 70 32.2 58.6 103.2 75 31.4 56.2 101.6 dB and 110.4 dB , respectiv ely . 3.3 MCF Applied to DMAS It should be noted that the proposed method in this paper is a weighting technique which can be applied to an y beamformer to achiev e a higher image quality . Here, the aim is to e valuate the MCF when is applied to other beamformers e xcept D AS. The DMAS beamformer was selected. The results are presented in Fig. 5 . As demonstrated, the proposed method leads to higher sidelobes reduction and artifacts remov al when it is applied on the DMAS, compared to CF . In other words, 10 Fig 5: Reconstructed images for simulated detected data using (a) D AS, (b) D AS+CF , (c) D AS+MCF , (d) DMAS, (e) DMAS+CF and (e) DMAS+MCF . A linear array and point targets were used for numerical design. All images are sho wn with a dynamic range of 70 dB . Noise was added to the detected signals having a SNR of 20 dB . Fig 6: Lateral v ariations of the reconstructed images sho wn in Fig. 5 at the depths of 45 mm . e ven though the CF degrades the sidelobes (in D AS and DMAS), MCF outperforms the con v en- tional CF with a higher artifacts suppression. For further ev aluation, consider the lateral variations at the depth of 45 mm , sho wn in Fig. 6 , where the MCF reduces the sidelobes for about 20 dB , compared to the con ventional CF . 11 Fig 7: The schematic of the setup used for the experimental P AI. T able 3: FWHM ( mm ) v alues, in -6 dB , at the two depths of imaging using the experimental data. ` ` ` ` ` ` ` ` ` ` ` ` ` ` ` Depth( mm ) Beamformer D AS D AS+CF D AS+MCF 22 0.68 0.59 0.30 24 0.66 0.47 0.28 4 Experimental Results T o further e valuate the proposed weighting method and its ef fect on enhancing P A images, phan- tom experiments were performed in which a phantom consists of 2 light absorbing wires with diameter of 150 µm were placed 1 mm apart from each other in a water tank. The schematic of the experimental setup is shown in Fig. 7 . In this experiment, we utilized a Nd:Y A G pulsed laser , with the pulse repetition rate of 30 H z at wav elengths of 532 nm . A programmable digital ultrasound scanner (V erasonics V antage 128), equipped with a linear array transducer (L11-4v) operating at frequency range between 4 to 9 M H z was utilized to acquire the P A RF data. A high speed FPGA was used to synchronize the light e xcitation and P A signal acquisition. The reconstructed images are shown in Fig. 8 . As it is demonstrated, D AS results in high lev els of noise in the images, degrading the image quality , and image is af fected by sidelobes. Using CF improv es the images quality , but the image is still af fected by noise and sidelobes. Finally , the proposed weighting method enhances the image by providing higher noise suppression and lo wer 12 Fig 8: Reconstructed images for the experimental detected data using (a) D AS, (b) D AS+CF and (c) D AS+MCF . A linear array and wire tar get phantom were used for the e xperimental design. All images are sho wn with a dynamic range of 80 dB . le vels of sidelobes compared to con ventional CF . T o e v aluate in more detail, the lateral v ariations at two depths for tar gets shown in Fig. 8 , are presented in Fig. 9 . Considering Fig. 9 (a), the proposed weighting method results in lower sidelobes and noise where D AS, D AS+CF and D AS+MCF leads to -40 dB , -84 dB and -134 dB , respectiv ely . Thus, the proposed method outperforms con ventional CF . FWHM in -6 dB has been calculated for the experimental results and shown in T able 3 . It can be seen that the proposed weighting method results in narrower mainlobe in comparison with CF . Consider , for e xample, the target at the depth of 22 mm where D AS+MCF results in 0.38 mm 0.29 mm improvement compared to D AS and D AS+CF , respectiv ely . Moreover , SNR has been calculated for the experimental data and the results are sho wn in T able 4 where the MCF causes higher SNR compared to con ventional CF for both depths of imaging. 13 Fig 9: Lateral v ariations of the reconstructed images shown in Fig. 8 at the depths of (a) 22 mm and (b) 24 mm . T able 4: SNR ( dB ) values for the experimental images sho wn in Fig. 8 . ` ` ` ` ` ` ` ` ` ` ` ` ` ` ` Depth( mm ) Beamformer D AS D AS+CF D AS+MCF 22 48.5 60.7 90.4 24 47.2 59.6 88.2 4.1 Ex V ivo Imaging In this study , an e x vivo experimental tissue study ha ve been designed to e valuate the performance of the proposed algorithm. A piece of a breast tissue (about 4 cm × 4 cm × 3 cm ) is extracted from a ne w sacrificed chicken. T wo pencil leads with a diameter of 0.5 mm are embedded inside the breast tissue, ha ving an axial distance of about 5 mm . Fig 10 shows the photographs of the imaged tissue. The P A signals are collected with a combined linear US/P A imaging probe. 47 As can be seen in Fig. 11 (a), the artifacts and the background noise degrade the P A image quality obtained by D AS. As is expected based on the pre vious results, applying CF to the D AS algorithm would reduce the artifacts and sidelobes. The e xpectations are satisfied, as sho wn in Fig. 11 (b), but the P A image can be further improv ed using MCF . As demonstrated in Fig. 11 (c), the MCF leads to higher noise suppression and sidelobes degrading in comparison with the con ventional CF . For further ev aluation, the lateral variations of the reconstructed images shown in Fig. 11 , are presented in Fig. 12 where the superiority of the proposed method in term s of lo wer sidelobes and 14 Fig 10: (a) The phantom used for the experiment. (b) The ex vivo imaging setup. Fig 11: Reconstructed ex vivo images using (a) D AS, (b) D AS+CF and (c) D AS+MCF . A linear - array and the phantom shown in Fig. 10 were used for the experimental design. All images are sho wn with a dynamic range of 80 dB . higher noise suppression is obvious. SNR is calculated for the ex vivo images (presented in T able 5 ). The quantitati ve ev aluation indicates that MCF outperforms the con ventional CF . In particular , it improv es the SNR for about 14 dB , at the depth of 31.3 mm , compared to the CF . 5 Discussion The main enhancement gained by the proposed method is higher contrast and lower sidelobes. Considering the fact that D AS beamformer results in a low quality image, having it on the nu- merator of the formula of CF would degrade the performance of the CF weighting procedure. On 15 Fig 12: Lateral v ariations of the reconstructed images sho wn in Fig. 11 at the depths of (a) 29 mm and (b) 31.3 mm . T able 5: SNR ( dB ) values for the e x vivo images sho wn in Fig. 11 . ` ` ` ` ` ` ` ` ` ` ` ` ` ` ` Depth( mm ) Beamformer D AS D AS+CF D AS+MCF 29 41.34 52.81 68.99 31.3 40.35 50.78 64.84 the other hand, in, 33 Matrone et al . prov ed that DMAS can be used instead of D AS for image re- construction, and it was shown that the main improvement gained by DMAS was higher contrast. Thus, it can be percei ved that using DMAS instead of the e xisting D AS on the numerator of CF algebra would results in contrast enhancement due to its auto-correlation process which is a non- linear operation. As can be seen in Fig. 1 , Fig. 3 , Fig. 8 and Fig. 11 , using the correlation process of DMAS inside the formula of CF results in higher noise suppression and artifact reduction, lead- ing to the higher image quality compared to D AS and D AS+CF . In other word, the multiplication operation inside the DMAS procedure reduces the presence of noise and of f-axis signals on the reconstructed images, and improves the image quality . The advantage of the proposed weighting method in the term of sidelobes reduction can be seen in the Fig. 2 , Fig. 4 , Fig. 9 and Fig. 12 . As can be seen in the lateral v ariations, the width of mainlobe has decreased which is a merit of MCF . Since DMAS improves the resolution gained by D AS, shown in, 37 the MCF leads to higher resolution in comparison with CF . T o put it more simply , presence of DMAS inside the formula 16 of MCF is the reason of higher resolution achiev ed by MCF . Despite all the results, it was nec- essary to e v aluate the proposed method quantitativ ely . Considering the numbers presented in the T ables of the last section, it can be seen that the proposed method outperforms CF in the terms of FWHM and SNR. The proposed method significantly outperforms CF when the targets are at the high depths of imaging. As sho wn in Fig. 1 , for the targets located at the depths of 55 mm -75 mm , sidelobes and artifatcs are better reduced compared to the lower depths. This also can be percei ved regarding the T able 2 where SNR improv ement in high depths is more than lower depths (80 % and 56 % for 25 mm and 75 mm , respecti vely). It should be noticed that, as mentioned in the section 1 , the beamforming and concerned weighting methods can be applied on both the US and P AI cases. CF or MCF would be proper options for US imaging. Ho wev er , using multiple times of the CF or MCF ( MCF 2 and MCF 3 ) would remove the speckles in the US images. The speckle remov al is not desired in applications in which the speckles provide helpful information for diag- nosis. Therefore, the MCF 2 and MCF 3 would further increase the quality of the P A images, but it is not suggested to use them for the con ventional US imaging. MCF The computational burden imposed by the proposed method is the same as DMAS, and the order of processing in O( M 2 ) while the order of processing for CF is the same as D AS which is O( M ). Therefore, it should be mentioned that the improv ements are obtained at the expense of higher computational b urden in comparison with CF . The proposed method can be implemented on a FPGA device, e.g. on an Altera FPGA of the Stratix IV family (Altera Corp., San Jose, CA, USA). The time consumption has been reported in 33 for DMAS implementation, which indicates that the proposed method can be used in clinical P AI systems. In applications in which phased (or micro-con ve x) arrays are used, MCF can provide a further enhancement compared to CF . W e hav e tested the proposed algorithm for ex vivo P AI, and the results were promising (shown in Fig. 11 and Fig. 12 ). In small-parts 17 and v ascular US imaging, for instance in vivo imaging of the carotid artery , where the resolution and specially sidelobes are of importance, MCF can be used, providing higher contrast and noise suppression in comparison with CF . 6 Conclusion In this paper , a nov el weighting procedure has been introduced by combining the con ventional CF and the DMAS beamformer . It was shown that the numerator of the formula of CF can be treated as a D AS, and it was proposed to use DMAS instead of the e xisting D AS inside the formula of CF . The MCF has been ev aluated numerically and experimentally , and all the results showed the higher performance of MCF compared to CF . For the experimental results obtained by the wire target phantom, MCF reduced the sidelobes for about 50 dB in comparison with CF , indicating the higher contrast, and the quantitative results sho wed that MCF impro ves the SNR and FWHM for about 45% and 40%, respecti vely . Acknowledgments This research receiv ed no specific grant from any funding agency in the public, commercial, or not-for-profit sectors, and the authors ha ve no potential conflicts of interest to disclose. Refer ences 1 L. Li, L. Zhu, C. Ma, et al. , “Single-impulse panoramic photoacoustic computed tomography of small-animal whole-body dynamics at high spatiotemporal resolution, ” Natur e Biomedical Engineering 1 (5), Art–No (2017). 2 L. V . W ang and J. Y ao, “ A practical guide to photoacoustic tomography in the life sciences, ” Natur e methods 13 (8), 627–638 (2016). 18 3 J. Xia and L. V . W ang, “Small-animal whole-body photoacoustic tomography: a revie w , ” IEEE T ransactions on Biomedical Engineering 61 (5), 1380–1389 (2014). 4 M. Mehrmohammadi, S. Joon Y oon, D. Y eager , et al. , “Photoacoustic imaging for cancer detection and staging, ” Curr ent molecular imaging 2 (1), 89–105 (2013). 5 M. Nasiriav anaki, J. Xia, H. W an, et al. , “High-resolution photoacoustic tomography of resting-state functional connectivity in the mouse brain, ” Pr oceedings of the National Academy of Sciences 111 (1), 21–26 (2014). 6 M. Jeon and C. Kim, “Multimodal photoacoustic tomograph y , ” IEEE T ransactions on Multi- media 15 (5), 975–982 (2013). 7 B. Guo, J. Li, H. Zmuda, et al. , “Multifrequency micro wav e-induced thermal acoustic imag- ing for breast cancer detection, ” IEEE T ransactions on Biomedical Engineering 54 (11), 2000–2010 (2007). 8 M. Heijblom, W . Steenbergen, and S. Manohar , “Clinical photoacoustic breast imaging: the twente experience., ” IEEE Pulse 6 (3), 42–46 (2015). 9 A. de La Zerda, Y . M. Paulus, R. T eed, et al. , “Photoacoustic ocular imaging, ” Optics letters 35 (3), 270–272 (2010). 10 R. O. Esenaliev , I. V . Larina, K. V . Larin, et al. , “Optoacoustic technique for nonin v asi ve monitoring of blood oxygenation: a feasibility study , ” Applied Optics 41 (22), 4722–4731 (2002). 11 J. Y ao, J. Xia, K. I. Maslov , et al. , “Nonin v asi ve photoacoustic computed tomography of mouse brain metabolism in vi v o, ” Neur oimag e 64 , 257–266 (2013). 19 12 Y . Zhou, J. Y ao, and L. V . W ang, “T utorial on photoacoustic tomography , ” Journal of Biomed- ical Optics 21 (6), 061007–061007 (2016). 13 J. Y ao and L. V . W ang, “Photoacoustic microscopy , ” Laser & Photonics Reviews 7 (5), 758– 778 (2013). 14 L. V . W ang and S. Hu, “Photoacoustic tomography: in vi vo imaging from or ganelles to or- gans, ” Science 335 (6075), 1458–1462 (2012). 15 M. Xu and L. V . W ang, “T ime-domain reconstruction for thermoacoustic tomography in a spherical geometry , ” IEEE T ransactions on Medical Imaging 21 (7), 814–822 (2002). 16 A. Hariri, A. Fatima, N. Mohammadian, et al. , “De velopment of lo w-cost photoacoustic imaging systems using very lo w-energy pulsed laser diodes, ” J ournal of biomedical optics 22 (7), 075001 (2017). 17 P . K. Upputuri and M. Pramanik, “Dynamic in vi vo imaging of small animal brain using pulsed laser diode-based photoacoustic tomography system, ” J ournal of biomedical optics 22 (9), 090501 (2017). 18 A. Hariri, A. Fatima, N. Mohammadian, et al. , “T owards low cost photoacoustic microscopy system for e v aluation of skin health, ” in Imaging Spectr ometry XXI , 9976 , 99760X, Interna- tional Society for Optics and Photonics (2016). 19 P . K. Upputuri and M. Pramanik, “Performance characterization of lo w-cost, high-speed, portable pulsed laser diode photoacoustic tomography (pld-pat) system, ” Biomedical optics expr ess 6 (10), 4118–4129 (2015). 20 C.-W . W ei, T .-M. Nguyen, J. Xia, et al. , “Real-time integrated photoacoustic and ultrasound 20 (paus) imaging system to guide interventional procedures: e x viv o study , ” IEEE transactions on ultrasonics, ferr oelectrics, and fr equency contr ol 62 (2), 319–328 (2015). 21 H. K. Zhang, M. A. L. Bell, X. Guo, et al. , “Synthetic-aperture based photoacoustic re- beamforming (spare) approach using beamformed ultrasound data, ” Biomedical optics ex- pr ess 7 (8), 3056–3068 (2016). 22 E. Mercep, G. Jeng, S. Morscher, et al. , “Hybrid optoacoustic tomography and pulse-echo ultrasonography using concav e arrays, ” IEEE T ransactions on Ultrasonics, F err oelectrics, and F r equency Contr ol 62 (9), 1651–1661 (2015). 23 T . Harrison and R. J. Zemp, “The applicability of ultrasound dynamic recei ve beamformers to photoacoustic imaging, ” IEEE T ransactions on Ultrasonics, F err oelectrics, and F r equency Contr ol 58 (10), 2259–2263 (2011). 24 C. G. Hoelen and F . F . de Mul, “Image reconstruction for photoacoustic scanning of tissue structures, ” Applied Optics 39 (31), 5872–5883 (2000). 25 T . Szasz, A. Basarab, and D. Kouam ´ e, “Beamforming through re gularized in v erse problems in ultrasound medical imaging, ” IEEE T ransactions on Ultrasonics, F err oelectrics, and F r e- quency Contr ol 63 (12), 2031–2044 (2016). 26 N. Q. Nguyen and R. W . Prager , “High-resolution ultrasound imaging with unified pixel- based beamforming, ” IEEE T r ansactions on Medical Imaging 35 (1), 98–108 (2016). 27 C. Y oon, H. H. Kim, and K. K. Shung, “De velopment of a low-comple xity , cost-ef fecti ve digital beamformer architecture for high-frequency ultrasound imaging, ” IEEE T ransactions on Ultrasonics, F err oelectrics, and F r equency Contr ol 64 (6), 1002–1008 (2017). 21 28 C. A. Samson, A. Bezanson, and J. A. Bro wn, “ A sub-nyquist, variable sampling, high- frequency phased array beamformer, ” IEEE transactions on ultrasonics, ferr oelectrics, and fr equency contr ol 64 (3), 568–576 (2017). 29 N. Nguyen and R. Prager , “Minimum variance approaches to ultrasound pixel-based beam- forming, ” IEEE T r ansactions on Medical Imaging (2016). 30 S. Park, A. B. Karpiouk, S. R. Aglyamov , et al. , “ Adapti ve beamforming for photoacoustic imaging, ” Optics letters 33 (12), 1291–1293 (2008). 31 M. A. L. Bell, N. Kuo, D. Y . Song, et al. , “Short-lag spatial coherence beamforming of pho- toacoustic images for enhanced visualization of prostate brachytherapy seeds, ” Biomedical optics expr ess 4 (10), 1964–1977 (2013). 32 R. S. Bandaru, A. R. Sornes, J. Hermans, et al. , “Delay and standard deviation beamforming to enhance specular reflections in ultrasound imaging, ” IEEE T ransactions on Ultrasonics, F err oelectrics, and F r equency Contr ol 63 (12), 2057–2068 (2016). 33 G. Matrone, A. S. Sav oia, G. Caliano, et al. , “The delay multiply and sum beamforming algorithm in ultrasound b-mode medical imaging, ” IEEE T ransactions on Medical Imaging 34 (4), 940–949 (2015). 34 H. B. Lim, N. T . T . Nhung, E.-P . Li, et al. , “Confocal microwa ve imaging for breast cancer detection: Delay-multiply-and-sum image reconstruction algorithm, ” IEEE T ransactions on Biomedical Engineering 55 (6), 1697–1704 (2008). 35 M. Mozaf farzadeh, A. Mahloojifar , and M. Orooji, “Medical photoacoustic beamforming us- ing minimum variance-based delay multiply and sum, ” in SPIE Digital Optical T echnologies , 1033522–1033522, International Society for Optics and Photonics (2017). 22 36 M. Mozaf farzadeh, A. Mahloojifar , M. Orooji, et al. , “Linear array photoacoustic imaging using minimum variance-based delay multiply and sum adapti ve beamforming algorithm, ” arXiv preprint arXiv:1709.07965 (2017). 37 M. Mozaff arzadeh, A. Mahloojifar , M. Orooji, et al. , “Double-stage delay multiply and sum beamforming algorithm: Application to linear-array photoacoustic imaging, ” IEEE T ransac- tions on Biomedical Engineering 65 (1), 31–42 (2018). 38 M. Mozaf farzadeh, A. Mahloojifar , and M. Orooji, “Image enhancement and noise reduction using modified delay-multiply-and-sum beamformer: Application to medical photoacous- tic imaging, ” in Electrical Engineering (ICEE), 2017 Iranian Confer ence on , 65–69, IEEE (2017). 39 M. Mozaf farzadeh, M. Sade ghi, A. Mahloojifar , et al. , “Double stage delay multiply and sum beamforming algorithm applied to ultrasound medical imaging, ” Ultrasound in Medicine and Biology PP (99), 1–1 (2017). 40 S. Mehdizadeh, A. Austeng, T . F . Johansen, et al. , “Eigenspace based minimum variance beamforming applied to ultrasound imaging of acoustically hard tissues, ” IEEE transactions on medical imaging 31 (10), 1912–1921 (2012). 41 T . Zhou, Q.-l. Li, X. Chen, et al. , “Forward-backw ard minimum v ariance beamforming combined with coherence weighting applied to ultrasound imaging, ” in W orld Congr ess on Medical Physics and Biomedical Engineering May 26-31, 2012, Beijing, China , 1092–1096, Springer (2013). 42 M. Mozaf farzadeh, S. A. O. I. A v anji, A. Mahloojifar , et al. , “Photoacoustic imaging using 23 combination of eigenspace-based minimum variance and delay-multiply-and-sum beamform- ers: Simulation study , ” arXiv pr eprint arXiv:1709.06523 (2017). 43 M. Mozaffarzadeh, A. Mahloojifar , M. Nasiriav anaki, et al. , “Eigenspace-based minimum v ariance adapti ve beamformer combined with delay multiply and sum: Experimental study , ” arXiv preprint arXiv:1710.01767 (2017). 44 M. Mozaf farzadeh, M. Mehrmohammadi, and B. Makkiabadi, “Image improv ement in linear- array photoacoustic imaging using high resolution coherence factor weighting technique, ” arXiv preprint arXiv:1710.02751 (2017). 45 K. W . Rigby , “Method and apparatus for coherence filtering of ultrasound images, ” (1999). US Patent 5,910,115. 46 B. E. Treeby and B. T . Cox, “k-w a ve: Matlab toolbox for the simulation and reconstruction of photoacoustic wa ve fields, ” Journal of Biomedical Optics 15 (2), 021314–021314 (2010). 47 Y . Y an, M. Basij, E. Hemandez-Andrade, et al. , “Endocavity ultrasound and photoacous- tic imaging system to ev aluate fetal brain perfusion and oxygenation: Preliminary ex vi vo studies, ” in Ultrasonics Symposium (IUS), 2017 IEEE International , 1–1, IEEE (2017). Moein Mozaffarzadeh was born in Sari, Iran, in 1993. He receiv ed the B.Sc. degree in Electrical Engineering from Babol Noshirv ani Uni versity of T echnology (Mazandaran, Iran), in 2015, and the M.Sc. degree in Biomedical Engineering from T arbiat Modares Uni ver - sity (T ehran, Iran), in 2017. He is currently a research assistant at research center for biomedical 24 technologies and robotics, institute for adv anced medical technologies (T ehran, Iran). His cur- rent research interests include Photoacoustic Image Reconstruction, Ultrasound Beamforming and Biomedical Imaging. Y an Y an joined W ayne State Uni versity since 2015-May as a PhD student in functional and molecular ultrasound research laboratory (http://ultrasound.eng.wayne.edu/). His interesting areas are Medical Image, Object Detection and Data Mining. He had strong back- ground in Computer Science pattern recognition and computer graphics. He holds two bachelors, Computer science and Post and T elecommunication. He also recei ved a master in computer science from W ayne State uni versity 2017. His current research interests include Endoca vity Ultrasound and Photoacoustic for fetal and maternal care. Mohammad Mehrmohammadi receiv ed his B.Sc. degree in Electrical Engi- neering from Sharif Uni versity of T echnology (T ehran, Iran), the M.Sc. in Electrical and Computer Engineering from Illinois Institute of T echnology (Chicago, IL), and the Ph.D. in Biomedical En- gineering from the Univ ersity of T e xas at Austin (Austin, TX). He did his postdoctoral fellowship at Mayo Clinic Colle ge of Medicine (Rochester , Minnesota). Currently , he is an assistant profes- sor of Biomedical/Electrical and Computer Engineering at W ayne State Uni versity and scientific member at Karmanos Cancer Institute. 25 Bahador Makkiabadi recei ved his B.Sc. degree in Electronics Engineering from Shiraz Univ ersity (Shiraz, Iran), the M.Sc. in Biomedical Engineering from Amirkabir Uni- versity of T echnology (T ehran, Iran), and the Ph.D. in Biomedical Engineering from Uni versity of Surrey (Guildford, Surrey , UK). Currently , he is working at Research Center for Biomedical T ech- nologies and Robotics (RCBTR), Institute for Advanced Medical T echnologies (IAMT), T ehran Uni versity of Medical Sciences, T ehran, Iran. His research interests include Blind Source Separa- tion, Adv anced Array Signal Processing for Medical Applications and Biomedical Imaging. List of Figur es 1 Reconstructed images for simulated detected data using (a) D AS, (b) D AS+CF and (c) D AS+MCF . A linear array and point targets were used for numerical design. All images are sho wn with a dynamic range of 60 dB . Noise was added to the detected signals having a SNR of 50 dB . 2 Lateral v ariations of the reconstructed images sho wn in Fig. 1 at the depths of (a) 25 mm and (b) 40 mm . 3 Reconstructed images for simulated detected data using (a) D AS, (b) D AS+CF and (c) D AS+MCF . A linear array and point targets were used for numerical design. All images are sho wn with a dynamic range of 60 dB . Noise was added to the detected signals having a SNR of 0 dB . 26 4 Lateral v ariations of the reconstructed images sho wn in Fig. 3 at the depths of (a) 25 mm and (b) 45 mm . 5 Reconstructed images for simulated detected data using (a) D AS, (b) D AS+CF , (c) D AS+MCF , (d) DMAS, (e) DMAS+CF and (e) DMAS+MCF . A linear array and point tar gets were used for numerical design. All images are shown with a dynamic range of 70 dB . Noise was added to the detected signals having a SNR of 20 dB . 6 Lateral variations of the reconstructed images sho wn in Fig. 5 at the depths of 45 mm . 7 The schematic of the setup used for the experimental P AI. 8 Reconstructed images for the experimental detected data using (a) DAS, (b) D AS+CF and (c) D AS+MCF . A linear array and wire tar get phantom were used for the e x- perimental design. All images are sho wn with a dynamic range of 80 dB . 9 Lateral v ariations of the reconstructed images sho wn in Fig. 8 at the depths of (a) 22 mm and (b) 24 mm . 10 (a) The phantom used for the experiment. (b) The e x vivo imaging setup. 11 Reconstructed ex vivo images using (a) DAS, (b) D AS+CF and (c) D AS+MCF . A linear -array and the phantom sho wn in Fig. 10 were used for the experimental design. All images are sho wn with a dynamic range of 80 dB . 12 Lateral v ariations of the reconstructed images sho wn in Fig. 11 at the depths of (a) 29 mm and (b) 31.3 mm . List of T ables 1 -6 dB FWHM ( mm ) v alues at the different depths. 27 2 SNR ( dB ) values at the dif ferent depths. 3 FWHM ( mm ) values, in -6 dB , at the two depths of imaging using the experimental data. 4 SNR ( dB ) values for the experimental images sho wn in Fig. 8. 5 SNR ( dB ) values for the e x vivo images sho wn in Fig. 11. 28
Original Paper
Loading high-quality paper...
Comments & Academic Discussion
Loading comments...
Leave a Comment