Hyak Mortality Monitoring System: Innovative Sampling and Estimation Methods - Proof of Concept by Simulation
Traditionally health statistics are derived from civil and/or vital registration. Civil registration in low-income countries varies from partial coverage to essentially nothing at all. Consequently the state of the art for public health information i…
Authors: Samuel J. Clark, Jon Wakefield, Tyler McCormick
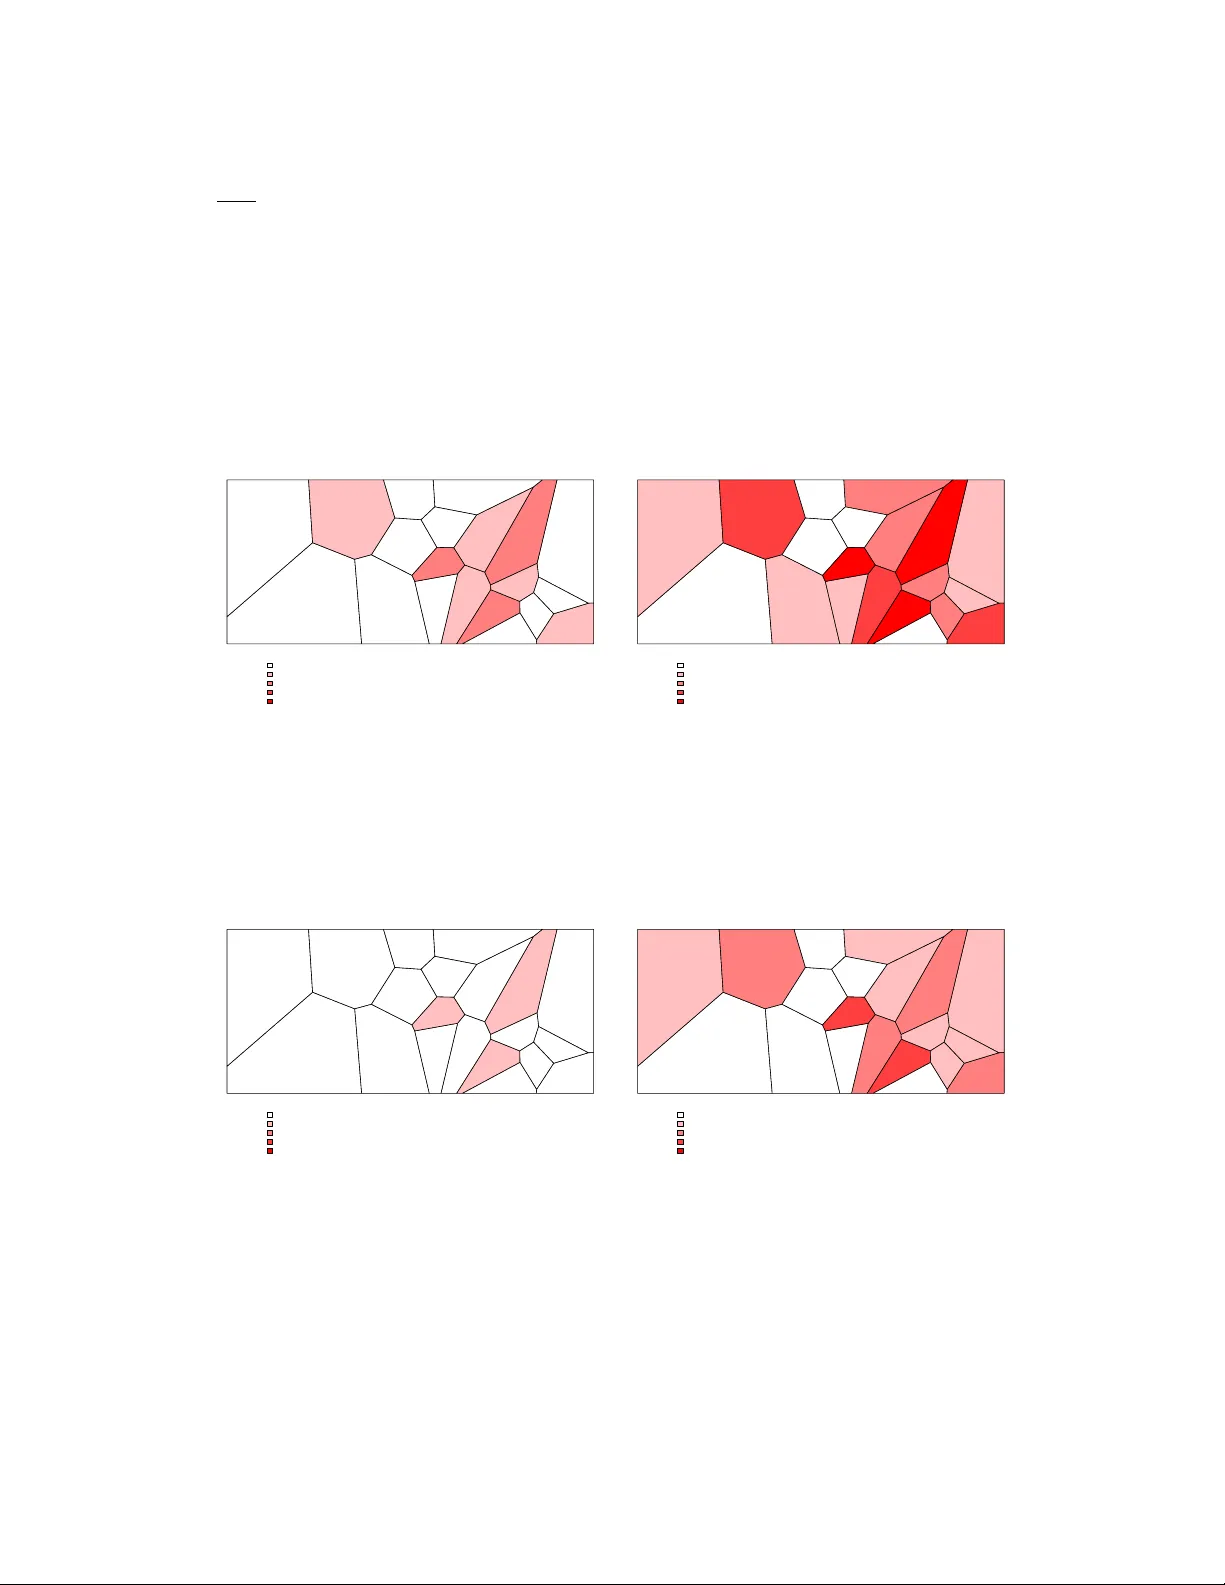
Hy ak Mortalit y Monitoring System Inno v ativ e Sampling and Estimation Methods Pro of of Concept b y Simulation Sam uel J. Clark 1,2,3,4,* , Jon W akefield 5,6 , T yler McCormick 5,7 , and Mic helle Ross 8 1 Departmen t of So ciology , The Ohio State Univ ersity 2 MR C/Wits Rural Public Health and Health T ransitions Researc h Unit (Agincourt), Sc ho ol of Public Health, F acult y of Health Sciences, Universit y of the Witw atersrand 3 INDEPTH Net w ork, Accra 4 ALPHA Net w ork, London 5 Departmen t of Statistics, Univ ersity of W ashington 6 Departmen t of Biostatistics, Univ ersity of W ashington 7 Departmen t of So ciology , Univ ersity of W ashington 8 Departmen t of Biostatistics and Epidemiology , Univ ersity of P ennsylv ania * Corresp ondence to: work@samclark.net No vem b er 5, 2018 Abstract T raditionally health statistics are deriv ed from civil and/or vital registration. Civil registration in lo w- to middle-income coun tries v aries from partial co verage to essentially nothing at all. Consequen tly the state of the art for public health information in lo w- to middle-income countries is efforts to combine or triangulate data from differen t sources to pro duce a more complete picture across b oth time and space – data amalgamation . Data sources amenable to this approach include sample surv eys, sample registration systems, health and demographic surv eillance systems, administrative records, census records, health facility records and others. W e prop ose a new statistical framew ork for gathering health and p opulation data – Hy ak – that leverages the b enefits of sampling and longitudinal, prosp ective surv eillance to create a cheap, accurate, sustainable monitoring platform. Hy ak has three fundamental comp onents: • Data Amalgamation : a sampling and surv eillance comp onen t that organizes tw o or more data collection systems to work together: (1) data from HDSS with frequent, intense, link ed, prosp ective follo w-up and (2) data from sample surveys conducted in large areas surrounding the Health and Demographic Surv eillance System (HDSS) sites using informed sampling so as to capture as many ev en ts as p ossible; • Cause of Death : verbal autopsy to c haracterize the distribution of deaths b y cause at the population lev el; and • SES : measurement of so cio economic status in order to characterize p ov ert y and w ealth. W e conduct a simulation study of the informed s ampling comp onen t of Hy ak based on the Agincourt HDSS site in South Africa. Compared to traditional cluster sampling, Hy ak ’s informed sampling captures more deaths, and when combined with an estimation mo del that includes spatial smo othing, produces estimates of b oth mortality coun ts and mortality rates that hav e low er v ariance and small bias. i A CKNOWLEDGMENTS Preparation of this man uscript w as supported b y the Bill and Melinda Gates F oundation and gran ts K01 HD057246 and K01 HD078452 from the Eunice Kennedy Shriver National Institute of Child Health and Human Dev elopment (NICHD). JW was supp orted b y R01-CA095994. The authors are grateful to P eter Byass, Basia Zaba, Stephen T ollman, Adrian Raftery , Philip Setel, Osman Sank oh and t wo very constructive anonymous reviewers for helpful discussions or other inputs. ii Con ten ts 1 New Directions for Health and P opulation Statistics in Lo w- to Middle-Income Coun tries 1 1.1 Bac kground . . . . . . . . . . . . . . . . . . . . . . . . . . . . . . . . . . . . . . . . . 1 1.2 A New Statistical Platform . . . . . . . . . . . . . . . . . . . . . . . . . . . . . . . . 4 1.3 Design Criteria . . . . . . . . . . . . . . . . . . . . . . . . . . . . . . . . . . . . . . . 4 1.4 Hy ak . . . . . . . . . . . . . . . . . . . . . . . . . . . . . . . . . . . . . . . . . . . . 5 2 Pilot Study of Hy ak Informed-Sampling via Sim ulation 7 2.1 Metho dological Approac h . . . . . . . . . . . . . . . . . . . . . . . . . . . . . . . . . 7 2.1.1 Notation . . . . . . . . . . . . . . . . . . . . . . . . . . . . . . . . . . . . . . . 7 2.1.2 Mo dels . . . . . . . . . . . . . . . . . . . . . . . . . . . . . . . . . . . . . . . 7 2.1.3 The Sim ulation Study Region . . . . . . . . . . . . . . . . . . . . . . . . . . . 9 2.1.4 Sampling Strategies . . . . . . . . . . . . . . . . . . . . . . . . . . . . . . . . 10 2.1.5 Measures of Predictiv e Accuracy . . . . . . . . . . . . . . . . . . . . . . . . . 11 2.2 Sim ulation . . . . . . . . . . . . . . . . . . . . . . . . . . . . . . . . . . . . . . . . . . 12 2.3 Results . . . . . . . . . . . . . . . . . . . . . . . . . . . . . . . . . . . . . . . . . . . . 14 3 Discussion 16 3.1 Key Conclusions . . . . . . . . . . . . . . . . . . . . . . . . . . . . . . . . . . . . . . 16 A Appendix 25 A.1 Optimum allocation sampling strategy details . . . . . . . . . . . . . . . . . . . . . . 25 A.2 Village-level c haracteristics for the current and historic cohorts . . . . . . . . . . . . 26 A.3 Additional simulation results . . . . . . . . . . . . . . . . . . . . . . . . . . . . . . . 27 iii 1 New Directions for Health and P opulation Statistics in Lo w- to Middle-Income Coun tries 1.1 Bac kground In most of the dev elop ed w orld the traditional source of basic public health information is civil registration and vital statistics. Civil registration is a system that records births and deaths within a go vernmen t jurisdiction. The purp ose is t w o-fold: (1) to create a legal record for eac h p erson, and (2) to provide vital statistics. Optimally a civil registe r includes every one in the jurisdiction, pro vides the basis to ensure their civil rights and creates a steady stream of vital statistics (United Nations. Statistical Division, 2014). The vital statistics obtained from man y w ell-functioning civil registration systems include birth rates b y age of mother, mortality rates by sex, age and other characteristics, and causes of death for eac h death. These basic indicators are the foundation of public health information systems, and when they are tak en from a near-full-co verage civil registration system, they relate to the whole p opulation. Although the idea is inheren tly simple, implementing full-cov erage civil registration is not, and only the w orld’s richest coun tries are able to main tain ongoing civil registration systems that co ver a ma jorit y of the population. Civil registration in the rest of the w orld v aries from partial co v erage to essen tially nothing at all (Mathers et al., 2005). A four-article series titled “Who Counts?” in the L anc et in 2007 reviews the curren t state of civil registration (AbouZahr et al., 2007; Bo erma and Stansfield, 2007; Hill et al., 2007; Horton, 2007; Mahapatra et al., 2007; Setel et al., 2007). This w as follow ed eigh t y ears later with another four-article series presenting a similar but slightly more hop eful picture (Ab ouZahr et al., 2015b,a; Mikk elsen et al., 2015; Phillips et al., 2015). The authors lamen t that there has b een a half a century of neglect in civil registration in lo w- to middle-income coun tries, and critically , that it is not p ossible to obtain useful vital statistics from those countries (Mahapatra et al., 2007; Setel et al., 2007; Mikkelsen et al., 2015). The L anc et authors argue that in the long term all coun tries need complete civil registration to ensure the civil rights of eac h one of their citizens and to pro vide useful, timely public health information (Ab ouZahr et al., 2007, 2015a), and they explore a n um b er of in terim options that w ould allo w countries to mo ve from where they are to da y to full civil registration (Hill et al., 2007). Ec hoing the L anc et sp ecial series are additional urgen t pleas for b etter health statistics in lo w- and middle-income countries (for example: Ab ouzahr et al., 2010; Bchir et al., 2006; Mathers et al., 2005, 2009; Rudan et al., 2000). The WHO and its partners and supp orters ha ve actively supp orted improv ements in civil registration and vital statistics (CR VS) o ver the recen t past (W orld Health Organization, 2013a,b, 2014). These work ers clearly identify a need for representativ e data describing sex-, age-, and cause-sp ecific mortalit y through time in small enough areas to b e meaningful for lo cal gov ernance and health institutions. These critiques are for the most part discussed in the framew ork of civil registration as the ‘primary’ source of data. Recen tly , v arious United Nations agencies, including the office of the Secretary General, ha ve articulated strong, specific supp ort for rapid impro v ement in the evidence base for the Sustainable Dev elopment Goals (SDG) (United Nations, 2014b) – the international target framework that follo ws from the MDGs (e.g., Data Rev olution Group: The UN Secretary General’s Indep enden t Exp ert Advisory Group on a Data Rev olution for Sustainable Dev elopment, 2014; Commission on Population and Developmen t, 2016; United Nations, 2016). The appropriately named Data 1 R evolution (United Nations, 2014a) is the flagship program organized b y the UN to address the systematic lac k of data to measure progress tow ard the SDG targets. W e agree that in order to ensure civil rights and pro vide each unique citizen with a legal identit y , full-co verage civil registration is the long-term goal. Ac knowledging that, w e propose decoupling the discussion of civil registration from vital statistics. In particular, w e can obtain accurate and represen tative vital statistics measuremen ts by making inferences from carefully adjusted sam- ples. The sample-based approach drives the production of population statistics in many other fields including economics, so ciology and political science. Borro wing from these fields public health w orkers hav e dev elop ed sample-driven approaches to health statistics that partially substitute for vital statistics derived from civil registration. India has conducted a sample registration system (SRS) for sev eral decades (Office of the Registrar General & Census Commissioner, India, 2012) that has pro duced go o d basic vital statistics, and more recently Jha and colleagues (2006) hav e added verbal autopsy (Lopez et al., 2011) to this system to create the Indian Million Death Study (MDS). In a similar vein, USAID’s Sample Vital Registration with V erbal Autopsy (SA VVY) is a program that combines sample registration with v erbal autopsy and provides general-purp ose to ols to collect data (MEASURE Ev aluation, 2012). USAID’s Demographic and Health Surveys (DHS) (Measure DHS, 2012) and UNICEF’s Multiple Indicator Cluster Surv eys (MICS) (UNICEF - Statistics and Monitoring, 2012) are go o d examples of traditional household surv eys that describ e a select subset of indicators for national p opulations at m ultiple points in time. There are man y more similar sample surveys conducted b y smaller organizations and aimed at sp ecific diseases or the ev aluation of sp ecific interv entions. These approac hes generally utilize sampling designs dev elop ed to provide cross-sectional snapshots of the curren t state of the p opulation with resp ect to an indicator. With the exception of India’s SRS and SA VVY, they lack the ongoing, prosp ective, longitudinal structure of a traditional vital registration system. They also often lack the spatial resolution to distinguish differences in indicator v alues across short distances. Finally , they often miss or undercoun t rare even ts b ecause they t ypically take one measurement and rely on recall to fill in recent history . The curren t state of the art for public health information in lo w- to middle-income countries is efforts to com bine or triangulate data from m ultiple sources to pro duce a more complete picture across b oth time and space. The usual sources of data include: non-representativ e, low-co verage, p o or qualit y vital registration data; roughly once-per-decade census data; snapshot or repeated snapshot data from (sometimes nationally represen tativ e) household surveys; one-off sample surveys conducted for a v ariet y of specific reasons b y a diverse arra y of organizations; sample registration systems; and finally , a ho dgep o dge of miscellaneous data sources that may include health and demographic surv eillance systems (HDSS), sen tinel surveillance systems, administrative records, clinic/hospital records and others. Com bining data from different sources with multiple sampling schemes presents a m yriad of statis- tical challenges. W e use data p o oling as a broad term that describ es metho ds that adjust for bias due to differences in represen tativ eness across data from differen t sources. The global burden of disease study by the Institute for Health Metrics and Ev aluation (Nagha vi et al., 2015) is a highly visible example of data po oling. As another example, Gething et al. (2011) po ol survey data to pro duce fine geographical scale Plasmo dium falciparum malaria endemicit y . Data amalgamation , also uses data from m ultiple sources, but is differentiated by activ e engagement in the data collec- tion pro cess. Data amalgamation uses proactiv e (e.g. Hy ak ) or adaptive mec hanisms that actively 2 adjust the data collection pro cess to optimize a set of metrics – minimize bias, minimize v ariance, minimize cost, etc. A recent study of malaria prev alence b y Kabaghe et al. (2017) is an example of data amalgamation in which survey lo cations are adaptively chosen to minimize the v ariance of a target, see Chip eta et al. (2016) for statistical details. In the surv ey sampling literature, adaptive cluster sampling has a relativ ely long history (Thompson and Seb er, 1996), and has been used extensiv ely in surv eys of rare animal and plan t sp ecies; we are not aw are of any applications in the con text considered here. In short, we use data p o oling for situations where researchers com bine sev eral datasets not necessarily collected to measure the indicator of interest, whereas data amal- gamation is an inten tional strategy that incorp orates multiple heterogeneous data sources in to the design pro cess. Ro we (2009) and Bryce and Steketee (2010) describ e a system of ‘integrated, contin uous surveys’ that would pro duce ongoing, longitudinal monitoring of a v ariety of outcomes – a proactive en- gagemen t with the data collection pro cess in keeping with our definition of amalgamation . Data from such a system could b e represen tativ e with resp ect to p opulation, time and space and thereby substitute for and impro v e on traditional vital statistics data. The idea is to systematize the na- tionally representativ e household surveys already implemen ted in a coun try , conduct them on a regular sc hedule with a p ermanent team and institute rigorous qualit y con trols. The innov ation is to turn traditional cross sectional surveys in to something quasi longitudinal and to ensure a lev el of consistency and qualit y . This concept app ears to still be in the ide a stage without an y real methodological dev elopment or real-w orld testing. More in the spirit of data amalgamation, Bryce and colleagues (2004) use a v ariety of data sources to conduct a multi-coun try ev aluation of In tegrated Managemen t of Childho o d Illness (IMCI) in terv entions. This ev aluation does dev elop some ad-ho c metho ds for combining and interpreting data from diverse sources. Victora et al. (2011) articulate a similar vision for a national platform for ev aluating the effectiv e- ness of public health interv entions, sp ecifically those targeting the Millennium Developmen t Goals (MDG). The authors argue that national co v erage with district-lev el granularit y is necessary , and lik e Ro w e and Bryce, that contin uous monitoring is required to assess changes and thereby inter- v ention impacts. That article contains significan t discussion of general survey methods, sample size considerations and other metho dological requiremen ts that w ould b e necessary to ev aluate MDG in terven tions. Again ho wev er, there are no methodological details that w ould allo w someone to design and implemen t a national, prosp ective survey system of the type describ ed. Sev eral authors w ho w ork at HDSS sites hav e describ ed an idea for carefully distributing HDSS sites throughout a coun try in wa y that could lead to a pseudo represen tativ e description of health indicators in the coun try through time (Y e et al., 2012). Although these authors do not pro vide details for ho w this could b e done or evidence that it w orks, the basic idea is supp orted b y work from By ass and his colleagues (2011) who examine the national represen tativ eness of health indicators generated in individual Sw edish counties in 1925. Byass and colleagues disco v er that any of the not-ob viously-unusual counties pro duced indicator v alues that were broadly represen tative of the national p opulation – the counties b eing roughly equiv alen t to an HDSS site, and Sweden in 1925 b eing roughly equiv alent to low- and middle-income countries to day . Prabhat Jha (2012) summarizes all of this in his description of fiv e ideas for improving mortalit y monitoring with cause of death. His five ideas include SRS systems with v erbal autopsy , improving the represen tativeness of HDSS (similar to Y e and colleagues (2012)), co ordinating, representativ e retrosp ectiv e surv eys (similar to Row e and Bryce) and finally using whatev er decent-qualit y civil registration data migh t b e av ailable. 3 W e find only t wo fully implemen ted and demonstrated examples of data amalgamation in the public health sphere. Alkema and colleagues (2007; 2008) working with the UNAIDS Reference Group on Estimates, Mo delling and Pro jections dev elop a Ba y esian statistical method that simultaneously estimates the parameters of an epidemiological mo del that represen ts the time-evolving dynamics of HIV epidemics and calibrates the results of that mo del to match p opulation-wide estimates of HIV prev alence. The epidemiological mo del is fit to sentinel surv eillance data describing HIV prev alence among pregnan t women who attend an tenatal clinics, and the population-wide measures of prev alence come from DHS surveys. In terestingly the second example relates to a similar problem. Lanjou w and Iv aschenk o at the W orld Bank (2010) describ e a metho d to amalgamate p opulation- lev el data from DHS surveys and HIV prev alence data from a sentinel surv eillance system. The DHS contains represen tative information on a v ariet y of items but not HIV prev alence, and the sen tinel surveillance system describes the HIV prev alence of a select (non-represen tative) subgroup, again pregnan t women who attend an tenatal clinics. Building on ideas in small-area estimation, they develop and demonstrate a metho d to adjust the sentinel surveillance data and then predict the HIV prev alence of the whole p opulation. Although these are tw o specific applications of data amalgamation, it is this level of c onc eptual and metho dolo gic al detail that ar e ne c essary in or der to amalgamate data fr om differ ent sour c es to pr o duc e r epr esentative, pr ob abilistic al ly me aningful r esults. The p opulation, public health and ev al- uation literatures are full of urgen t requests for better data and more useful metho ds to amalgamate data from different sources to answer questions ab out c ause and effe ct and change at national and subnational lev els, but there is v ery little in any of those literatures that actually develops the new concepts and metho ds that are necessary to deliv er the required new capabilities. Chip eta et al. (2016) describ e an adaptiv e design whose aim is to estimate disease prev alence. 1.2 A New Statistical Platform T aking accoun t of the situation describ ed in the literature and firmly in the spirit of ‘data amalgama- tion’, we aim to dev elop a system that pro vides high qualit y , contin uously generated, representativ e vital statistics and other p opulation and health indicators using a system that is cheap and logisti- cally tractable. W e are confident that such a system can provide highly useful health information at all important geographical (and other) scales: nation, pro vince, district, and p erphaps ev en sub district. As we argue ab o ve, we strongly believe that a sample-b ase d approac h is b oth appropriate and sufficien t to pro duce meaningful, useful public health information, and we do not b eliev e it is fiscally responsible to attempt to co ver the en tire population with a public health information system. That argumen t must b e made on the basis of guaranteeing human rights alone . 1.3 Design Criteria What w e w ant is a che ap, sustainable , con tinuously operated monitoring system that combines the benefits of both sample surv eys (represen tativity , sparse sampling, logistically tractable) and surv eillance systems (detailed, linked, longitudinal, prosp ectiv e with p oten tially in tense monitoring – e.g. of pregnancy outcomes and neonatal deaths) to pro vide useful indicators for large p opula- tions o v er prolonged p erio ds of time, so that we can monitor change and relate changes to p ossible 4 determinan ts, including interv entions. More sp ecifically , ‘useful’ in this context means an informa- tiv e balance of accuracy (bias) and precision (v ariance) – i.e. minimal but probably not zero bias accompanied b y moderate v ariance. We want indic ators that ar e close to the truth most of the time , and we wan t an ability to study causalit y prop erly . Critically , we w ant the whole system to b e cheaper and more sustainable than existing systems, and p erhaps offer additional adv antages as w ell. 1.4 Hy ak W e propose an in tegrated data collection and statistical analysis framew ork for improv ed p opulation and public health monitoring in areas without comprehensiv e civil registration and/or vital statistics systems. W e call this platform Hy ak – a w ord meaning ‘fast’ in the Chino ok Jargon of the North western United States. Hy ak is conceived as having three fundamental comp onen ts: • Data Amalgamation : a sampling and surv eillance component that organizes tw o data col- lection systems to work together to pro vide the desired functionality: (1) data from HDSS with frequent, intense, linked, prospective follo w-up and (2) data from sample surv eys con- ducted in large areas around the HDSS sites using informed sampling so as to capture as man y even ts as p ossible. • V erbal Autopsy (Lop ez et al., 2011) to estimate the distribution of deaths b y cause at the p opulation lev el, and • SES : measurement of so cio economic status (SES) at household, and p erhaps other levels, in order to c haracterize p ov erty and wealth. Hy ak uses relatively small, in tensive, longitudinal HDSS sites to understand what types of individ- uals (or households) are likely to b e the most informative if they w ere to b e included in a sample. With this knowledge the areas around the HDSS sites are sampled with preference given to the more informativ e individuals (households), thus increasing the efficiency of sampling and ensuring that sufficient data are collected to describ e rare p opulations and/or rare ev ents. This fully utilizes the information generated on an on-going basis b y the HDSS and produces indicator v alues that are representativ e of a p otentially very large area around the HDSS site(s). F urther, the informa- tion collected from the sample around the HDSS site can b e used to calibrate the more detailed data from the HDSS, effectiv ely allowing the detail in the HDSS data to b e extrap olated to the larger p opulation. F or an example of ho w this has been done in the context of antenatal clinic HIV prev alence surveillance and DHS surv eys, see Alkema et al. (2008). Another w ay to do this is to build a hierarchical Ba yesian mo del of the indicator of in terest, sa y mortalit y , with the HDSS b eing the first (informative) level and the surrounding areas b eing at the second level. Thus the surrounding area can b orrow information from the HDSS but is not required to match or mirror the HDSS. In the remainder of this work w e fo cus on the informed sampling component of Hy ak . Informed sampling seeks to capture as many ev ents as possible. This is critical for the measurement of mortalit y , and esp ecially for the measurement of cause-sp ecific mortality fractions (CSMF) at the p opulation level. In order to adequately c haracterize the epidemiology of a p opulation, it is nec- essary to measure the CSMF with some precision, and to do this a large n umber of death ev ents 5 with verbal autopsy are required, esp ecially for rare causes. Informed sampling aims to mak e the measuremen t of mortality rates and CSMFs as efficient as p ossible. Belo w we presen t a detailed example of the informed sampling idea and a pilot study based on in- formation from the Agincourt HDSS site 1 in South Africa (Kahn et al., 2007, 2012). The Agincourt HDSS is situated in the rural northeast of South Africa and co vers an area of 420km 2 comprising a sub-district of 27 villages. The site monitors roughly 90,000 p eople in 16,000 households. The villages and households are disp ersed widely across this area, and there is a functional road netw ork linking them all. The epidemiology of the site is typical for South Africa with generally low mor- talit y except for the effect of HIV at v ery young and middle ages, and in terms of wealth/pov erty , the p opulation is t ypical of a middle-income country (e.g. Kabudula et al., 2016; Clark et al., 2015; Houle et al., 2014; Clark et al., 2013; G´ omez-Oliv ´ e et al., 2013; Houle et al., 2013). The Agincourt HDSS is the canonical HDSS, not extreme along an y dimension, and generally representativ e of what an HDSS site is. W e generate virtual p opulations based on information from the Agincourt site, and then we sim ulate applications of traditional t wo-stage cluster and Hy ak sampling designs. W e estimate sex-age- sp ecific mortality rates for c hildren ages 0 − 4 years (last birthday) and compare and discuss the results. In the Conclusions Section w e describ e how v erbal autopsy metho ds can b e integrated into the Hy ak system and the ‘demographic feasibilit y’ of Hy ak . W e are thinking ab out existing data collection methods and these ob jectives in a unified framew ork, and w e are starting by exp erimen ting with sampling and analytical framew orks that work together to pro vide the basis for a me asur ement system that is representativ e, accurate and efficient in terms of information gained p er dollar sp ent (not the same as che ap in an absolute sense b ecause estimation of a binary outcome lik e death is still bound b y the fundamental constrain ts of the binomial mo del; i.e. relativ ely large num b ers of deaths are needed for useful measurements). A measurement system like this w ould be among the c heap est and most informativ e w ays to monitor the mortalit y of children affected b y in terven tions that cov er large areas and exist for prolonged p erio ds of time. With this in mind, the pilot pro ject we present b elow fo cuses on childhoo d ages 0 − 4. 1 F rom Kahn et al. (2012): The Agincourt health and so cio-demographic surveillance system (HDSS), lo cated in rural northeast South Africa close to the Mozambique b order, was established in 1992 to supp ort district health systems developmen t led by the p ost-apartheid ministry of health. At baseline in 1992, 57,600 p eople were recorded in 8,900 households in 20 villages; by 2006, the p opulation had increased to 70,000 p eople in 11,700 households. This increase is partly due to Mozambican in-migran ts ov erlo ok ed in the baseline survey and to a new settlement established as part of the p ost-apartheid gov ernments Reconstruction and Developmen t Program. In 2007, the study area was extended to include the catchmen t area of a new priv ately supp orted communit y health centre established to provide HIV treatment before public sector roll-out of HAAR T. By mid-2011, the p opulation under surveillance comprised 90,000 p eople residing in 16,000 households in 27 villages. Households are self-defined as p eople who eat from the same p ot of fo o d. Given sustained high lev els of temp orary lab our migration in southern Africa, we included temp orary migran ts residing for less than 6 mon ths p er year who retain close ties with their rural homes in the HDSS. There ha v e b een 17 census and vital even t up date rounds conducted strictly annually since 2000. P articipation is virtually complete, with only tw o households refusing to participate in 2011. 6 2 Pilot Study of Hy ak Informed-Sampling via Sim ulation 2.1 Metho dological Approach In this section we describ e our approach to sampling and analysis. T o b e concrete, we supp ose that the outcome of in terest is alive or de ad for children age 0 − 4. There are tw o no vel asp ects to our approac h: • Informed Sampling: Using existing information f rom a HDSS site w e construct a mortalit y mo del based on village-lev el c haracteristics. On the basis of this mo del we subsequently predict the num b er of outcomes of interest in each village of the study region. W e then set sample sizes in eac h village in prop ortion to these predictions. • Analysis: W e mo del the sampled deaths as a function of known demographic factors and village-lev el characteristics, and then we employ spatial smo othing to tune the mo del to each village and exploit similarities of risk in neigh b oring villages. 2.1.1 Notation Giv en our in terest in the binary status alive or de ad , our mo deling framework is logistic regression with random effects. Sp ecifically , let i = 1 , . . . , I represent villages within the study region and j = 1 , . . . , 4 index strata whic h we tak e as the four levels of sex (F, M) and age (Y oung: [0 , 1) years, old: [1 , 5) y ears). Households within areas will b e represen ted b y k = 1 , . . . , K i , for i = 1 , . . . , I . The quantit y of interest is Y ij , the unobserved true n umber of deaths in village i and in sex/age stratum j . W e assume that the p opulations N ij are kno wn in all villages. Also assumed kno wn are village-sp ecific cov ariates X i (for example, the av erage SES in village i , a measure of water qualit y , or pro ximity to health care facilities). The probability of dying in village i and stratum j is denoted b y p ij , whic h is the h yp othetical prop ortion of children dying in a h yp othetical infinite p opulation in area i and strata j . W e stress that we are carrying out a small-area estimation problem so the tar get of inter est is Y ij and the probability is just an intermediary whic h allo ws us to set up a mo del. If the full data w ere observ ed, we would take the probabilit y to b e the observed frequency ˜ p ij = Y ij / N ij . The survey design problem corresponds to choosing n ij , the n umber of c hildren in stratum j that we sample in village i . Of these, y ij are recorded as dying. In the next section, we describe mo dels that will b e used to analyze the data; once we ha ve estimated probabilities from a generic mo del, b p ij , w e use the estimator: b Y ij = y ij + ( N ij − n ij ) × b p ij , (1) where y ij is the observ ed num b er of deaths and ( N ij − n ij ) is the n umber of unsampled individuals in village i and stratum j . 2.1.2 Mo dels In this section, w e describ e mo dels that may b e fit to the sampled data. 7 I Na ¨ ıv e Mo del: This baseline mo del simply estimates b p = y /n , i.e., a single probabilit y is applied to the unsampled individuals in each village. The predicted num b er of deaths in each village is then (1) with b p ij = b p . I I Strata Mo del: This mo del estimates b p j = y j /n j , so that estimates of four stratum-sp ecific probabilities are calculated. The predicted n umber of deaths in each village is then (1) with b p ij = b p j . I I I Cov ariate Mo del: This approac h fits a mo del to data from all villages where sampling w as carried out and estimates stratum effects along with the asso ciation betw een risk and village-lev el cov ariates x i . W e assume a logistic form, logit p ij = x i β + γ j , (2) where j = 1 , . . . , 4. Hence, we ha v e a mo del with a separate baseline for each stratum and with the co v ariates having a common effect across stratum and village, so there no in teraction b et ween cov ariates and stratum, and cov ariates and area. W e use the maxim um lik eliho o d estimates b γ j and b β to obtain fitted probabilities: b p ij = expit( x i b β + b γ j ) = exp( x i b β + b γ j ) 1 + exp( x i b β + b γ j ) , whic h may b e used in (1). IV Spatial Co v ariate Mo del: This approac h requires sufficien t villages to hav e sampled data so that spatial random effects can b e estimated. Sp ecifically , we assume a Ba y esian imple- men tation of the mo del: logit p ij k = x i β + γ j + i + S i + h k , (3) where j = 1 , . . . , 4. W e ha ve three random effects in this model. The unstructur e d village- and household-lev el error terms i ∼ iid N (0 , σ 2 ) and h k ∼ iid N (0 , σ 2 h ), resp ectively , are in- dep enden t and allow for excess-binomial v ariability . The household-level random effects also allo w for dep endence within households. The S i error terms are village-level spatial random effects that allo w the smoothing of rates across space. There are man y different forms that these random effects could take. A mo del-based ge ostatistic al appr o ach (Diggle et al., 1998) w ould assume the collection [ S 1 , . . . , S n ] arise from a m ultiv ariate normal distribution, with co v ariances a function of the distance betw een villages. W e go a differen t route and use an in trinsic conditional auto-regressive (ICAR) mo del (Besag et al., 1991) in which: S i | S j , j ∈ ne( i ) ∼ N ( S i , σ 2 s /n i ) , where ne( i ) is the set of neighbors of village i and n i is the num b er of such neigh b ors. This mo del assumes that the prior distribution for the spatial effect in area i , giv en its neighbors, is centered on the mean of the neigh b ors, with a v ariance that dep ends on the n umber of neighbors (with more neigh b ors reducing the prior v ariance). W e describe our ‘shared b oundary’ neighborho o d scheme in the next section. W e use the p osterior means b β , b γ j , b i and b S i to obtain fitted probabilities: b p ij = exp( x i b β + b γ j + b i + b S i ) 1 + exp( x i b β + b γ j + b i + b S i ) , 8 whic h may b e used in (1); w e do not include the household random effects as these are not relev ant to predicting an area-level summary , but rather accoun t for within-household clustering. Until relativ ely recen tly , fitting this mo del w as computationally c hallenging within the con text of a sim ulation study (which requires rep eated fitting). Ho wev er, Rue et al. (2009) ha ve describ ed a clev er combination of Laplace appro ximations and n umerical integration that can be used to carry out Ba y esian inference for this this mo del – the in tegrated nested Laplace appro ximation (INLA). The INLA R pac k age implemen ts the INLA metho d. A Ba yesian implemen tation requires sp ecification of priors for all of the unknown parameters, which for mo del (3) consist of β , γ , σ 2 , σ 2 s and σ 2 h . W e choose flat priors for β , γ , and Gamma( a, b ) priors for σ − 2 , σ − 2 s and σ − 2 h . 1 2 3 4 5 6 7 8 9 10 11 12 13 14 15 16 17 18 19 20 Figure 1: The 20 villages of the Agincourt region with V oronoi tesselations defining neigh b orho o d structure. Grey lines indicate neigh b oring villages. 2.1.3 The Sim ulation Study Region W e describe the study region that w e create for the simulation study , in order to provide a context within which the differen t sampling strategies can b e described. The study region is based on the Agincourt HDSS site in South Africa (Kahn et al., 2007, 2012). W e assume N individuals reside in one of 20 villages and that there are b etw een 1,400 and 14,000 children in each village, N i ∼ Unif(1400 , 14000). In addition for eac h village, w e assume half the children are b o ys and half are girls, with 20% in the age range 0 − 1 y ears and 80% in the age range 1 − 5 years. Within each village, w e assume that households contain b et ween 1 and 5 children and follow the distribution • P (household with 1 child) = 75 / 470 = 0 . 16 • P (household with 2 children) = 100 / 470 = 0 . 21 • P (household with 3 children) = 125 / 470 = 0 . 27 • P (household with 4 children) = 100 / 470 = 0 . 21 9 • P (household with 5 children) = 70 / 470 = 0 . 15 . W e sample a single population of N c hildren and then take S = 100 rep eated dra ws from this p opulation under the four sampling schemes described below. Beginning with the denominators N ij , w e sample the observed deaths y ij using a binomial with probabilities giv en by (2). W e sample a second p opulation of N c hildren and treat this p opulation as a historical cohort. It is from this p opulation that we treat three of these villages as HDSS sites for which w e hav e extensive and complete information. W e form a V oronoi tessellation of the village b oundaries based on the 20 co ordinate pairs that describ e the centroids of the villages. This op eration forms a set of tiles, eac h asso ciated with a cen troid and is the set of points nearest to that p oint. This is a standard op eration in spatial statistics (e.g. Denison and Holmes, 2001). W e can then define neigh b ors (for the spatial model) as those villages whose tiles share an edge. Figure 1 sho ws the study region along with village cen troids and asso ciated village p olygons (as defined by the V oronoi tesselations), along with edges sho wing the neighborho o d structure. 2.1.4 Sampling Strategies In this section we describ e the sampling strategies that we compare. In each strategy , w e consider four differen t sample sizes, n , for the total n umber of children sampled: 1,300, 2,600, 3,900 and 5,200. • Two-stage Cluster Sampling: Randomly select 5 villages and randomly sample ( n/ 5) / 3 households within each of the villages (since each household contains, on a v erage, 3 children). Additional households will be sampled as needed until at least n/ 5 c hildren are obtained from eac h village. This is an example of a tw o-stage cluster sampling plan, a common design. • Stratified Sampling: Randomly sample n/ 20 c hildren’s outcomes from each of the 20 villages. This strategy lies b et ween the cluster sampling and informed sampling designs. • Hy ak – HDSS with Informativ e Sampling: The num b er of children sampled from eac h village is proportional to the predicted num b er of deaths based on the HDSS data. In particu- lar, w e select all children from the three HDSS villages in the historical cohort and w e fit mo del (2). On the basis of the estimated β , γ , w e obtain predicted coun ts of deaths for all villages, using the village-level co v ariates x i , i = 1 , . . . , I . Let β ? , γ ? b e the estimated parameters based on the historic HDSS data only and p ? ij b e the asso ciated village and stratum-sp ecific probabilities. W e estimate p ? i via p ? i = J X j =1 N ij N i p ? ij . Then, the predicted num b er of deaths are e Y i = N i × p ? i . W e then select sample sizes as the (rounded versions of ) n i ∝ e Y i so that villages with more predicted deaths are sampled more hea vily . Sp ecifically , w e take n i = n × e Y i / e Y + where e Y + is the total predicted n umber of deaths. The observ ed num b er of deaths from n i is y i . • Optimum Allo cation: As in the Hy ak sampling design, we obtain the village-lev el esti- mates of the probability of death, p ? i , based on the historic HDSS data only . W e then select 10 sample sizes as the (rounded v ersions of ) n i = n × N i p b p i (1 − b p i ) P i 0 N i 0 p b p i 0 (1 − b p i 0 ) . Details are pro vided in the App endix. 2.1.5 Measures of Predictive Accuracy Giv en N total c hildren, broken in to the four stratum, w e can set risks p ij (details of which app ear in Section 2.2) for each village/stratum and then simulate counts Y ij . W e tak e this set of { Y ij : i = 1 , . . . , 20; j = 1 , . . . , 4 } as fixed, and then subsample from these counts, under eac h of the four designs and rep eat s = 1 , . . . , S times. The estimated n umber of deaths in survey villages in simulation s is b Y ( s ) ij = y ( s ) ij + ( N ij − n ij ) × b p ( s ) ij where the b p ( s ) ij are obtained from one of the mo dels we describ ed in Section 2.1.2. T o estimate the frequen tist prop erties of the simulation procedure, w e summarize the results b y examining v arious summary measures. An obvious measure of accuracy is the mean squared error (MSE) asso ciated with the predicted num b er of deaths. The MSE of an estimator of the num b er of deaths in area i and strata j , b Y ij a veraged ov er villages and strata is MSE( b Y ij ) = E y ij − b Y ij 2 , where y ij is the true n um b er of deaths (which recall, is fixed), and the expectation is ov er all p ossible samples that can b e taken (for whic hever design we are considering). This MSE is estimated based on S sim ulations: MSE( b Y ) = 1 S S X s =1 20 X i =1 4 X j =1 ( b Y ( s ) ij − Y ij ) 2 = 20 X i =1 4 X j =1 ( b Y ij − Y ij ) 2 + 1 S S X s =1 20 X i =1 4 X j =1 ( b Y ( s ) ij − b Y ij ) 2 = 20 X i =1 4 X j =1 Bias( b Y ij ) 2 + 20 X i =1 4 X j =1 V ar( b Y ij ) . (4) where Y ij is the true n umber of deaths in village i and stratum j and b Y ij = 1 S S X s =1 b Y ( s ) ij is the av erage of the predicted counts ov er sim ulations in village i and stratum j . The decomp o- sition in terms of bias and v ariance is useful since it makes apparent the trade-off in volv ed in mo deling. 11 [-0.22,0.08) [0.08,0.38) [0.38,0.67) [0.67,0.97) [0.97,1.27] Figure 2: The simulated spatial random effects for the Agincourt region. 2.2 Sim ulation W e assume there are t wo village-level cov ariates so that the length of the β vector is 2. Both of the village-level cov ariates x i 1 and x i 2 are generated indep endently from uniform distributions on 0 to 1, i = 1 , . . . , 20. Based lo osely on the real v alues from the Agincourt HDSS in South Africa, the parameter v alues we use in the simulation are: • The risk of death in young girls is expit( γ 1 ) = 0 . 050. • The risk of death in young b oys is expit( γ 2 ) = 0 . 117. • The risk of death in older girls is expit( γ 3 ) = 0 . 032. • The risk of death in older b oys is expit( γ 4 ) = 0 . 077. • The first village-level cov ariate has exp( β 1 ) = exp( − 2 . 2) = 0 . 111 so that a unit increase in x 1 leads to the o dds of death dropping by one ninth. • The second village-lev el co v ariate has exp( β 2 ) = exp(1 . 4) = 4 . 05 so that a unit increase in x 2 leads to the o dds of death quadrupling. • W e set σ 2 = 0 . 22 to determine the level of unstructured v ariability at the village level. This leads to a 95% range for the residual unstructured village-level o dds b eing exp( ± 1 . 96 × √ 0 . 22) = [0 . 40 , 2 . 51]. • W e set σ 2 s = 0 . 48 to determine the lev el of structured v ariabilit y at the village level. This op eration requires some care because the ICAR mo del does not define a proper probabilit y distribution. The ICAR v ariance is not in terpretable as a marginal v ariance (and so is not comparable to the other random effects v ariances, σ 2 and σ 2 h ) and so instead Figure 2 shows a simulated set of S i , i = 1 , . . . , 20 v alues, with dark er v alues indicating higher risk. The spatial dep endence is apparent, with this realization pro ducing high risk to the W est of the region and lo w risk in the East. 12 • W e set σ 2 h = 0 . 08 to determine the lev el of unstructured v ariability at the household level. This leads to a 95% range for the residual unstructured household-level o dds b eing exp( ± 1 . 96 × √ 0 . 08) = [0 . 57 , 1 . 74]. F or the strata and cov ariates mo del, the cov ariate relationship is estimated from the villages that pro duced data, and then mo del (2) is used to obtain fitted probabilities that are applied to the unsampled villages, using the p opulation and co v ariate information that is assumed kno wn for each village. [0.01,0.08) [0.08,0.14) [0.14,0.21) [0.21,0.27) [0.27,0.34] (a) [0.01,0.08) [0.08,0.14) [0.14,0.21) [0.21,0.27) [0.27,0.34] (b) [0.01,0.08) [0.08,0.14) [0.14,0.21) [0.21,0.27) [0.27,0.34] (c) [0.01,0.08) [0.08,0.14) [0.14,0.21) [0.21,0.27) [0.27,0.34] (d) Figure 3: The predicted probabilities of dying for the Agincourt region: (a) y oung girls, (b) y oung b o ys, (c) older girls, (d) older b oys. Com bining all of the elements of the mo del, w e generate deaths Y ij for village i and stratum j b y randomly drawing from a Binomial distribution with probabilities giv en b y (3). This yields the predicted probabilities for all 20 villages and for eac h of the four stratum display ed in Figure 3. 13 The historic cohort is generated in the same fashion. Details of the village-level characteristics for b oth cohorts are pro vided in App endix A.2. The HDSS villages are selected by taking the villages with b oth large x 1 and large x 2 , small x 1 and small x 2 , follo wed by a randomly sampled third village. A Ga (5 , 1) prior is used for the spatial and non-spatial random effects in the spatial mo dels (Mo del IV). 2.3 Results T able 1 summarizes the results of the simulation study for n = 5 , 200. Results for the smaller sample sizes are shown in T ables A.3-A.5 in App endix A.3 The num b er of a v erage sampled deaths and bias, v ariance and MSE from (4) are display ed for each combination of sampling strategy and analytical mo del. Ov erall, the Hy ak sampling strategy c aptures more deaths and is generally more accurate. Across sampling schemes and sample sizes, Hy ak generally has the smallest MSEs. F urther examination of the comp onen ts of the MSE reveals that: (i) Hy ak yields smaller bias, and (ii) pa ys for this by sacrificing some v ariance. The o verall comparison betw een the sampling strategies clearly fa vors Hy ak . This partly reflects the careful choice of HDSS villages so that they con tain substantial v ariation in terms of village-level cov ariates. 14 T able 1: Deaths, Bias, V ariance, MSE for cluster sampling, stratified sampling, Hy ak and optim um sampling for n = 5 , 200. Results from S = 100 sim ulations. There w ere 11,299 deaths in the simulated population from which samples w ere taken. ‘Cluster’ is shorthand for Two-stage Cluster Sample ; ‘ Hy ak ’ for HDSS with Infor- mative Sampling ; ‘Strata/Co v ariates’ for L o gistic R e gr ession Covariate Mo del and ‘Strata/Co v ariates/Space’ for L o gistic R e gr ession R andom Effe cts Covariate Mo del . It is not possible to fit the spatial mo del (IV) to the tw o-stage cluster sampling sc heme since there are data from 5 villages only . Design Mo del Deaths Bias V ariance ( × 10 3 ) MSE ( × 10 3 ) Cluster I. Na ¨ ıv e 459 1,067 174 1,312 I I. Strata 459 874 188 951 I I I. Strata/Co v ariates 459 651 386 810 IV. Strata/Co v ariates/Space 459 — — — Stratified I. Na ¨ ıv e 460 1,058 5 1,124 I I. Strata 460 866 15 765 I I I. Strata/Co v ariates 460 651 16 439 IV. Strata/Co v ariates/Space 460 183 80 113 Hy ak I. Na ¨ ıv e 538 1,162 7 1,357 I I. Strata 538 969 18 956 I I I. Strata/Co v ariates 538 635 16 419 IV. Strata/Co v ariates/Space 538 182 66 100 Optim um I. Na ¨ ıv e 477 1,072 5 1,154 I I. Strata 477 880 18 792 I I I. Strata/Co v ariates 477 632 17 416 IV. Strata/Co v ariates/Space 477 167 74 102 Comparing the analytical mo dels also pro duces an encouraging result. Within each sampling strategy , the logistic regression random effects co v ariate mo del (mo del IV) performs b est ov erall (smaller MSEs). Within Hy ak , this outp erforms the others. Similar patterns are observed across all sample sizes. This suggests that accounting for unmeasured factors and taking adv an tage of the spatial structure of mortalit y risk is significantly worth while. The trade-off b etw een bias and v ariance is clearly revealed by a closer lo ok at the distributions of the estimated probabilit y of dying pro duced b y eac h mo del. Figure 4 displays these distributions for mo dels I, I I I & IV – Na ¨ ıve, Covariates and Covariates & Sp ac e under the Hy ak sampling strategy for n = 5 , 200, while figures A.1-A.3 in App endix A.3 display these same distributions for n = 3 , 900 , n = 2 , 600 and n = 1 , 300, resp ectively . The Na ¨ ıve mo del estimates are very condensed, alw ays miss the truth and ha ve clear bias; estimates from the Covariates mo del also hav e very little spread, almost alw ays miss the truth and hav e some bias; and finally , estimates from the Covariates & Sp ac e model ha v e large spread, how ev er the distributions nearly alw ays include the truth, and ha ve muc h less bias. Clearly the Covariates & Sp ac e mo del displa ys the balance we are seeking: small bias and manageable spread, and importantly , distributions that include the truth. This com bination of sampling strategy and analytical approach provides our key ob jective: an indicator that is close to (and around) the truth most of the time. 15 Figure 5 displa ys the av erage village- and strata-sp ecific estimates for the (unobserved) p opulation coun ts of death plotted against the true v alues across each of the four models under the Hy ak sampling sc heme for n = 5 , 200, while figures A.4-A.6 in App endix A.3 displa y the same for the smaller sample sizes. (See figures A.7-A.18 in Appendix A.3 for the remaining sampling sc hemes for all sample sizes.) In general, the a verage estimates from the spatial mo del tend to follow the y = x line quite closely , indicating w e are estimating the true num b er of deaths in eac h village quite w ell. Estimates tend to b e clos er under the Hy ak sampling strategy and for larger sample sizes, th us confirming (visually) our previous results. 0.05 0.10 0.15 0.20 0.25 P(death) Y oung F emales Y oung Males Old F emales Old Males ● ● ● ● ● ● ● ● ● ● ● ● ● ● ● ● ● ● ● ● ● ● ● ● ● ● ● ● ● ● ● ● ● ● ● ● ● ● ● ● ● ● ● ● ● ● ● ● ● ● ● ● ● ● ● ● ● ● ● ● ● ● ● ● ● ● ● ● ● ● ● ● ● ● ● ● ● ● ● ● ● ● ● ● ● ● ● ● ● ● ● ● ● ● ● ● ● ● ● ● ● ● ● ● ● ● ● ● ● ● ● ● ● ● ● ● ● ● ● ● ● ● ● ● ● ● ● ● ● ● ● ● ● ● ● ● ● ● ● ● ● ● ● ● ● ● ● ● ● ● ● ● ● ● ● ● ● ● ● ● ● ● ● ● ● ● ● ● ● ● ● ● ● ● ● ● ● ● ● ● ● ● ● ● ● ● ● ● ● ● ● ● ● ● ● ● ● ● ● ● ● ● ● ● ● ● ● ● ● ● ● ● ● ● ● ● ● ● ● ● ● ● ● ● ● ● ● ● ● ● ● ● ● ● ● ● ● ● ● ● ● ● ● ● ● ● ● ● ● ● ● ● ● ● ● ● ● ● ● ● ● ● ● ● ● ● ● ● ● ● ● ● ● ● ● ● ● ● ● ● ● ● ● ● ● ● ● ● ● ● ● ● ● ● ● ● ● ● ● ● ● ● ● ● ● ● ● ● ● ● ● ● ● ● ● ● ● ● ● ● ● ● ● ● ● ● ● ● ● ● ● ● ● ● ● ● ● ● ● ● ● ● ● ● ● ● ● ● ● ● ● ● ● ● ● ● ● ● ● ● ● ● ● ● ● ● ● ● ● ● ● ● ● ● ● ● ● ● ● ● ● ● ● ● ● ● ● ● ● ● ● ● ● ● ● ● ● ● ● ● ● Model I Model III Model IV T r uth Figure 4: The distributions of the estimated probability of dying from mo dels I, I I I and IV under the Hy ak sampling strategy for n = 5 , 200. 3 Discussion 3.1 Key Conclusions The key conclusion of this pilot study is that the statistical sampling and analysis ideas supp orting the Hy ak monitoring system are sound: a combination of highly informative data suc h as are pro duced by a HDSS site can b e used to judiciously inform sampling of a large surrounding area to 16 20 40 60 80 100 140 20 60 100 140 Y oung Females A verage Estimated Y ij T ruth 1 2 3 4 5 6 7 8 9 10 11 12 13 14 15 16 17 18 19 20 1 2 3 4 5 6 7 8 9 10 11 12 13 14 15 16 17 18 19 20 1 2 3 4 5 6 7 8 9 10 11 12 13 14 15 16 17 18 19 20 1 2 3 4 5 6 7 8 9 10 11 12 13 14 15 16 17 18 19 20 ● ● ● ● Model I Model II Model III Model IV 50 100 150 200 250 300 50 100 200 300 Old Females A verage Estimated Y ij T ruth 1 2 3 4 5 6 7 8 9 10 11 12 13 14 15 16 17 18 19 20 1 2 3 4 5 6 7 8 9 10 11 12 13 14 15 16 17 18 19 20 1 2 3 4 5 6 7 8 9 10 11 12 13 14 15 16 17 18 19 20 1 2 3 4 5 6 7 8 9 10 11 12 13 14 15 16 17 18 19 20 100 200 300 400 500 100 200 300 400 500 Y oung Males A verage Estimated Y ij T ruth 1 2 3 4 5 6 7 8 9 10 11 12 13 14 15 16 17 18 19 20 1 2 3 4 5 6 7 8 9 10 11 12 13 14 15 16 17 18 19 20 1 2 3 4 5 6 7 89 10 11 12 13 14 15 16 17 18 19 20 1 2 3 4 5 6 7 8 9 10 11 12 13 14 15 16 17 18 19 20 200 400 600 800 200 400 600 800 Old Males A verage Estimated Y ij T ruth 1 2 3 4 5 6 7 8 9 10 11 12 13 14 15 16 17 18 19 20 1 2 3 4 5 6 7 8 9 10 11 12 13 14 15 16 17 18 19 20 1 2 3 4 5 6 7 8 9 10 11 12 13 14 15 16 17 18 19 20 1 2 3 4 5 6 7 8 9 10 11 12 13 14 15 16 17 18 19 20 Figure 5: The av erage village- and strata-sp ecific estimates for the (unobserv ed) p opulation coun ts of death plotted against the true v alues across eac h of the four mo dels under the Hy ak sampling scheme for n = 5 , 200. Plotting sym b ols indicate village n um b ers, and colors indicate model n umber with k ey in upper-left plot. The spatial mo del IV (purple) sym b ols are in general closest to the y = x line of equality . 17 yield estimated counts of deaths that are far more useful than those pro duced by a traditional cluster sample design. F urther, Hy ak combined with an analytical mo del that includes unstructured random effects and spatial smo othing pro duces the most accurate and w ell-b eha ved estimates. The impro vemen ts are dramatic and clearly justify additional work on these ideas. Another crucial idea underlying Hy ak is the notion that very detailed information generated b y an HDSS site can b e extrap olated to the muc h larger surrounding p opulation b y calibrating that information with carefully c hosen and muc h less detailed data from the surrounding p opulation. This idea has already b een demonstrated convincingly b y Alk ema et al. [2008] and is currently being applied by UNAIDS to pro duce global estimates of HIV prev alence. This relies on the assumption that the p opulation monitored by the HDSS is similar enough to the p opulation surrounding the HDSS that the relationships b etw een co v ariates and the outcomes of interest are the same or v ery similar. The degree to which this is true will v ary among specific settings. In particular, when HDSS sites also serve as research and in terven tion testing sites, it is possible that there will b e Hawthorne Effe ct issues – i.e. the in tensiv ely studied HDSS p opulation will b e different from the surrounding p opulation that has not participated in studies and trials. This may affect the key co v ariate-outcome relationships that drive Hy ak . This is something that must b e studied, initially with a real-world pilot study of Hy ak , and then in an ongoing w ay b y o ccasionally verifying these relationships through an ov ersample of the surrounding p opulation, or through small add-on studies conducted whenever a census is done in the surrounding areas to update the sampling frame. Although this is a concern, it is unlikely to make Hy ak infeasible or in v alidate Hy ak results. An explicit goal of a pilot study will b e to c haracterize the uncertaint y created by p ossible Ha wthorne Effect issues and build them in to Hy ak estimates. A k ey adv an tage of Hy ak sampling strategy is that it c aptur es signific antly mor e de aths . V erbal autopsy methods (Lop ez et al., 2011) can b e applied to all or a fraction of these deaths to as- sign causes (immediate, contributing, etc.). This cause of death information can then b e used to construct distributions of deaths by cause – CSMFs – whic h illuminate the epidemiological regime affecting the p opulation, and if this is monitored through time, how the epidemiology of the p op- ulation is changing. Critically , this pro vides a means of measuring the impact of interv entions on sp ecific causes of death and the distribution of deaths ov er time. The increased num b er of deaths captured with informed sampling increases the accuracy and precision of measurements of CSMFs. A final b enefit of the Hy ak system is that it provides t w o types of infrastructure: the HDSS and the sample surv ey . In addition to pro viding information with whic h to sample, the HDSS provides a platform on which a wide v ariet y of longitudinal studies can b e undertaken – link ed observ ational studies; randomized, con trolled trials, all kinds of com binations of these, etc. Moreov er, the p er- manen t HDSS infrastructure also provides a training platform that can supp ort a wide v ariety of health and b ehavioral science training, mentoring and appren ticing/interning and experience for y oung scien tists or health professionals. Ha ving the sample survey infrastructure provides a means of quic kly v alidating/calibrating studies conducted by the HDSS and pro vides another learning dimension for the educational and training activities that the system can supp ort. A p oten tial limitation of any mortality monitoring system is ‘demographic feasibility’, that is the abilit y to capture enough deaths in a giv en population to measure levels and/or c hanges in mortality , p oten tially by cause, through time. Death is a binomial pro cess defined by a probabilit y of dying, and as suc h, is go verned b y the c haracteristics of the binomial mo del. That mo del sp ecifies in simple terms the n um b er of deaths necessary to estimate the probabilit y of dying within a giv en margin of error with a given level of confidence. No amount of sophistication will release us from 18 that basic set of facts. The Hy ak system addresses this challenge by providing a means through whic h to c ho ose the b est possible sample given what w e kno w about the p opulation, and this in turn maximizes our ability to capture deaths. The fundamentals of the binomial mo del require that one m ust observe relatively large num b ers of deaths to measure mortalit y precisely and especially to measure changes in mortality with b oth precision and confidence. So in light of those inescapable realities, the Hy ak system pro duces the most information p er dollar sp en t, b ecause it captures more deaths p er dollar sp en t. Finally and perhaps most importantly , the Hy ak monitoring system is c heap er to run o ver a perio d of years compared to traditional cluster sample-based surv ey methods. Com bined with the fact that Hy ak also pro duces more useful information, this mak es Hy ak highly cost effectiv e – mor e b ang for less buck. Imp ortan tly , there are implemen tation considerations that m ust b e addressed b efore Hy ak can b e used at provincial or national scale to pro vide p opulation-representativ e estimates. These will need to b e resolved through additional theoretical w ork, simulation, and ultimately through a pilot study that conducts Hy ak on a large population dispersed o ver a large ph ysical space. Among man y , these critical questions need to b e answ ered: • How big do HDSS sites need to be to provide enough information for effectiv e informative sampling? • How man y HDSS sites are necessary for effectiv e informed sampling with respect to key demographic and epidemiological indicators? • How should HDSS sites b e disp ersed geographically? • How well does Hy ak work to provide disaggregated (fine-grained) estimates of key indicators b y sex, age, wealth/pov erty , space, time, etc? • How muc h do es the sampling frame affect Hy ak results, and what c heap, feasible solutions are there to obtaining frequen tly up dated sampling frames? • A detailed costing and cost comparison needs to b e done comparing the costs of the the HDSS site; the additional census, sampling, and in terviewing needed for Hy ak ; and a traditional household m ulti-stage cluster sample survey (like DHS) conducted in the same area. • How the metho d can be scaled up to a larger geographical area. W e envisage that only a subset of villages will b e sampled, and then a geostatistical mo del (W akefield et al., 2016) can b e used for spatial prediction to unobserved villages (a critical question is the n umber of villages needed to train the spatial mo del). Another important issue is to deal with the p oten tial problem of preferential sampling (Diggle et al., 2010) in which sampling locations are selected based on the exp ected size of the resp onse. In order to inform sampling historical data (for example, DHS surveys) may b e used to mo del to create a predictive surface, up on whic h sampling may b e based. Inv estigating this idea will b e the sub ject of a future pap er. 19 References Ab ouZahr, C., Cleland, J., Coullare, F., Macfarlane, S. B., Notzon, F. C., Setel, P ., Szreter, S., Anderson, R. N., Baw ah, A. a., Betr´ an, A. P ., Bink a, F., Bundhamc haro en, K., Castro, R., Ev ans, T., Figueroa, X. C., George, C. K., Gollogly , L., Gonzalez, R., Grzebien, D. R., Hill, K., Huang, Z., Hull, T. H., Inoue, M., Jakob, R., Jha, P ., Jiang, Y., Lauren ti, R., Li, X., Lievesley , D., Lop ez, A. D., F at, D. M., Merialdi, M., Mikk elsen, L., Nien, J. K., Rao, C., Rao, K., Sankoh, O., Shibuy a, K., Soleman, N., Stout, S., T angcharoensathien, V., v an der Maas, P . J., W u, F., Y ang, G., and Zhang, S. (2007). The wa y forward. L anc et , 370(9601):1791–9. Ab ouZahr, C., De Sa vigny , D., Mikkelsen, L., Setel, P . W., Lozano, R., and Lop ez, A. D. (2015a). T ow ards universal civil registration and vital statistics systems: the time is now. The L anc et , 386(10001):1407–1418. Ab ouZahr, C., De Savign y , D., Mikkelsen, L., Setel, P . W., Lozano, R., Nic hols, E., Notzon, F., and Lop ez, A. D. (2015b). Civil registration and vital statistics: progress in the data revolution for coun ting and accountabilit y . The L anc et , 386(10001):1373–1385. Ab ouzahr, C., Gollogly , L., and Stev ens, G. (2010). Better data needed: every one agrees, but no one w ants to pay . L anc et , 375(9715):619–21. Alk ema, L., Raftery , A., and Bro wn, T. (2008). Bay esian melding for estimating uncertain ty in national hiv prev alence estimates. Sexual ly tr ansmitte d infe ctions , 84(Suppl 1):i11–i16. Alk ema, L., Raftery , A., and Clark, S. (2007). Probabilistic pro jections of hiv prev alence using ba yesian melding. The Annals of Applie d Statistics , 1(1):229–248. Bc hir, A., Bh utta, Z., Bink a, F., Black, R., Bradsha w, D., Garnett, G., Ha yashi, K., Jha, P ., P eto, R., Sa wyer, C., Sc hw artl¨ ander, B., W alk er, N., W olfson, M., Y ach, D., and Zaba, B. (2006). Better health statistics are p ossible. L anc et , 367(9506):190–3. Besag, J., Y ork, J., and Molli ` e, A. (1991). Ba yesian image restoration, with t wo applications in spatial statistics (with discussion). A nnals of the Institute of Statistic al Mathematics , 43:1–59. Bo erma, J. T. and Stansfield, S. K. (2007). Health Statistics 1 Health statistics now : are w e making the righ t inv estments ? T ub er culosis , 369(9563):779–786. Bryce, J. and Stek etee, R. (2010). Con tin uous surv eys and qualit y managemen t in low-income coun tries: a go od idea. The Americ an journal of tr opic al me dicine and hygiene , 82(2):360; author reply 361–2. Bryce, J., Victora, C. G., Habic ht, J.-P ., V aughan, J. P ., and Blac k, R. E. (2004). The m ulti- coun try ev aluation of the in tegrated managemen t of c hildho o d illness strategy: lessons for the ev aluation of public health interv entions. A meric an journal of public he alth , 94(3):406–15. By ass, P ., Sank oh, O., T ollman, S. M., H¨ ogb erg, U., and W all, S. (2011). Lessons from history for designing and v alidating epidemiological surveillance in uncounted p opulations. PloS one , 6(8):e22897. Chip eta, M. G., T erlouw, D. J., Phiri, K. S., and Diggle, P . J. (2016). Adaptiv e geostatistical design and analysis for prev alence surveys. Sp atial Statistics , 15:70–84. Clark, S. J., G´ omez-Oliv´ e, F. X., Houle, B., Thorogo o d, M., Klipstein-Grobusch, K., Angotti, N., 20 Kabudula, C., Williams, J., Menk en, J., and T ollman, S. (2015). Cardiometab olic disease risk and hiv status in rural south africa: establishing a baseline. BMC public he alth , 15(1):135. Clark, S. J., Kahn, K., Houle, B., Arteche, A., Collinson, M. A., T ollman, S. M., and Stein, A. (2013). Y oung c hildren’s probability of dying before and after their mother’s death: a rural south african p opulation-based surv eillance study . PL oS Me d , 10(3):e1001409. Commission on P opulation and Dev elopment (2016). Strengthening the demographic evidence base for the p ost-2015 developmen t agenda: Rep ort of the secretary-general. T echnical report, United Nations. Data Rev olution Group: The UN Secretary General’s Indep endent Exp ert Advisory Group on a Data Revolution for Sustainable Developmen t (2014). A world that counts: Mobilising the data rev olution for sustainable developmen t. T ec hnical rep ort. Denison, D. and Holmes, C. (2001). Ba yesian partitioning for estimating disease risk. Biometrics , 57(1):143–149. Diggle, P . J., Menezes, R., and Su, T.-L. (2010). Geostatistical inference under preferential sam- pling. Journal of the R oyal Statistic al So ciety: Series C (Applie d Statistics) , 59:191–232. Diggle, P . J., T a wn, J. A., and Moy eed, R. A. (1998). Mo del-based geostatistics (with discussion). Applie d Statistics , 47:299–350. Gething, P . W., Patil, A. P ., Smith, D. L., Guerra, C. A., Ely azar, I. R., Johnston, G. L., T atem, A. J., and Hay , S. I. (2011). A new world malaria map: Plasmo dium falciparum endemicity in 2010. Malaria journal , 10(1):378. G´ omez-Oliv´ e, F. X., Angotti, N., Houle, B., Klipstein-Grobusc h, K., Kabudula, C., Menken, J., Williams, J., T ollman, S., and Clark, S. J. (2013). Prev alence of hiv among those 15 and older in rural south africa. AIDS c ar e , 25(9):1122–1128. Hill, K., Lop ez, A. D., Shibuya, K., Jha, P ., Ab ouZahr, C., Anderson, R. N., Baw ah, A. a., Betr´ an, A. P ., Bink a, F., Bundhamc haro en, K., Castro, R., Cleland, J., Coullare, F., Ev ans, T., Carrasco Figueroa, X., George, C. K., Gollogly , L., Gonzalez, R., Grzebien, D. R., Huang, Z., Hull, T. H., Inoue, M., Jakob, R., Jiang, Y., Lauren ti, R., Li, X., Liev esley , D., F at, D. M., Macfarlane, S., Mahapatra, P ., Merialdi, M., Mikk elsen, L., Nien, J. K., Notzon, F. C., Rao, C., Rao, K., Sank oh, O., Setel, P . W., Soleman, N., Stout, S., Szreter, S., T angc haro ensathien, V., v an der Maas, P . J., W u, F., Y ang, G., Zhang, S., and Zhou, M. (2007). Interim measures for meeting needs for health sector data: births, deaths, and causes of death. L anc et , 370(9600):1726–35. Horton, R. (2007). Coun ting for health. L anc et , 370(9598):1526. Houle, B., Clark, S. J., G´ omez-Oliv´ e, F. X., Kahn, K., and T ollman, S. M. (2014). The unfolding coun ter-transition in rural south africa: mortalit y and cause of death, 1994–2009. PL oS One , 9(6):e100420. Houle, B., Stein, A., Kahn, K., Madha v an, S., Collinson, M., T ollman, S. M., and Clark, S. J. (2013). Household con text and c hild mortalit y in rural south africa: the effects of birth spacing, shared mortality , household comp osition and so cio-economic status. International journal of epidemiolo gy , 42(5):1444–1454. Jha, P . (2012). Coun ting the dead is one of the world’s b est in vestmen ts to reduce premature mortalit y . Hyp othesis , 10(1). 21 Jha, P ., Ga jalakshmi, V., Gupta, P . C., Kumar, R., Mon y , P ., Dhingra, N., and P eto, R. (2006). Prosp ectiv e study of one million deaths in India: rationale, design, and v alidation results. PL oS me dicine , 3(2):e18. Kabaghe, A. N., Chip eta, M. G., McCann, R. S., Phiri, K. S., V an V ugt, M., T akk en, W., Diggle, P ., and T erlou w, A. D. (2017). Adaptiv e geostatistical sampling enables efficien t identification of malaria hotsp ots in rep eated cross-sectional surveys in rural malawi. PL oS One , 12(2):e0172266. Kabudula, C. W., Houle, B., Collinson, M. A., Kahn, K., T ollman, S., and Clark, S. (2016). Assess- ing changes in household so cio economic status in rural south africa, 2001–2013: a distributional analysis using household asset indicators. So cial Indic ators R ese ar ch , pages 1–27. Kahn, K., Collinson, M., G´ omez-Oliv´ e, F., Mokoena, O., Twine, R., Mee, P ., Afolabi, S., Clark, B., Kabudula, C., Khosa, A., et al. (2012). Profile: Agincourt health and so cio-demographic surv eillance system. International Journal of Epidemiolo gy , 41(4):988–1001. Kahn, K., T ollman, S., Collinson, M., Clark, S., Twine, R., Clark, B., Shabangu, M., G´ omez-Oliv ´ e, F., Mok o ena, O., and Garenne, M. (2007). Researc h in to health, p opulation and social transitions in rural south africa: Data and methods of the agincourt health and demographic surveillance system1. Sc andinavian Journal of Public He alth , 35(69 suppl):8–20. Lanjou w, P . and Iv asc henko, O. (2010). A new approach to pro ducing geographic profiles of hiv prev alence. T echnical Rep ort 5207, W orld Bank - P olicy Research W orking Paper Series. Lop ez, A. D., Lozano, R., Murray , C. J., and Shibuya, K. (2011). V erbal autopsy: innov ations, ap- plications, opp ortunities - improving cause of death measurement (article collection). Population He alth Metrics , 9. Mahapatra, P ., Shibuy a, K., Lop ez, A. D., Coullare, F., Notzon, F. C., Rao, C., and Szreter, S. (2007). Civil registration systems and vital statistics: successes and missed opp ortunities. The L anc et , 370(9599):1653–1663. Mathers, C. D., Bo erma, T., and Ma F at, D. (2009). Global and regional causes of death. British me dic al bul letin , 92:7–32. Mathers, C. D., F at, D. M., Inoue, M., Rao, C., and Lop ez, A. D. (2005). Coun ting the dead and what they died from: an assessment of the global status of cause of death data. Bul letin of the World He alth Or ganization , 83(3):171–7. Measure DHS (2012). Demographic and Health Surv eys. http://www.measuredhs.com . MEASURE Ev aluation (2012). SA VVY: Sample Vital Registration with V erbal Autopsy. http: //www.cpc.unc.edu/measure/tools/monitoring- evaluation- systems/savvy . Mikk elsen, L., Phillips, D. E., Ab ouZahr, C., Setel, P . W., De Savign y , D., Lozano, R., and Lop ez, A. D. (2015). A global assessmen t of civil registration and vital statistics systems: monitoring data qualit y and progress. The L anc et , 386(10001):1395–1406. Nagha vi, M., W ang, H., Lozano, R., Davis, A., Liang, X., Zhou, M., V ollset, S. E., Ozgoren, A. A., Ab dalla, S., Ab d-Allah, F., et al. (2015). Global, regional, and national age-sex sp ecific all-cause and cause-specific mortalit y for 240 causes of death, 1990-2013: a systematic analysis for the global burden of disease study 2013. L anc et , 385(9963):117–171. 22 Office of the Registrar General & Census Commissioner, India (2012). India’s Sample Registra- tion System. http://censusindia.gov.in/Vital_Statistics/SRS/Sample_Registration_ System.aspx . Phillips, D. E., Ab ouZahr, C., Lop ez, A. D., Mikkelsen, L., De Savign y , D., Lozano, R., Wilmoth, J., and Setel, P . W. (2015). Are well functioning civil registration and vital statistics systems asso ciated with b etter health outcomes? The L anc et , 386(10001):1386–1394. Ro we, A. K. (2009). Poten tial of in tegrated contin uous surv eys and quality managemen t to support monitoring, ev aluation, and the scale-up of health interv en tions in dev eloping countries. The A meric an journal of tr opic al me dicine and hygiene , 80(6):971–9. Rudan, I., Lawn, J., Cousens, S., Row e, A. K., Boschi-Pin to, C., T omasko vi ´ c, L., Mendoza, W., Lanata, C. F., Ro ca-F eltrer, A., Carneiro, I., Sc hellen b erg, J. a., Polasek, O., W eb er, M., Bryce, J., Morris, S. S., Blac k, R. E., and Campb ell, H. (2000). Gaps in p olicy-relev ant information on burden of disease in c hildren: a systematic review. L anc et , 365(9476):2031–40. Rue, H., Martino, S., and Chopin, N. (2009). Appro ximate ba y esian inference for latent gaussian mo dels b y using in tegrated nested laplace approximations. Journal of the r oyal statistic al so ciety: Series b (stat istic al metho dolo gy) , 71(2):319–392. Setel, P . W., Macfarlane, S. B., Szreter, S., Mikkelsen, L., Jha, P ., Stout, S., and AbouZahr, C. (2007). A scandal of invisibilit y: making ev eryone count b y counting every one. L anc et , 370(9598):1569–77. Thompson, S. K. and Seb er, G. A. (1996). A daptive sampling . Wiley . UNICEF - Statistics and Monitoring (2012). Multiple Indicator Cluster Surv eys (MICS). http: //www.unicef.org/statistics/index_24302.html . United Nations (2014a). Data R evolution for Sustainable Development . http://www.un.org/apps/ news/story.asp?NewsID=48594#.VEVQpoctuvJ . United Nations (2014b). Sustainable Development Go als . http://sustainabledevelopment.un. org/owg.html . United Nations (2016). Resolution 2016/1: Strengthening the demographic evidence base for the 2030 agenda for sustainable dev elopment. http://undocs.org/E/CN.9/2016/1 . United Nations. Statistical Division (2014). Principles and R e c ommendations for a Vital Statistics System . United Nations Departmen t of Economic and So cial Affairs, New Y ork, 3 edition. Victora, C. G., Blac k, R. E., Bo erma, J. T., and Bryce, J. (2011). Measuring impact in the Millen- nium Dev elopmen t Goal era and b eyond: a new approach to large-scale effectiv eness ev aluations. L anc et , 377(9759):85–95. W akefield, J., Simpson, D., and Go dwin, J. (2016). Comment: Getting in to space with a w eigh t problem. discussion of, “mo del-based geostatistics for prev alence mapping in low-resource set- tings”, b y P . J. Diggle and E. Giorgi. Journal of the A meric an Statistic al Asso ciation , 111:1111– 1119. W orld Health Organization (2013a). Strengthening civil registration and vital statistics for births, deaths and causes of death: resource kit. T echnical rep ort, W orld Health Organization. 23 W orld Health Organization (2013b). Strengthening civil registration and vital statistics systems through inno v ative approac hes in the health sector: Guiding principles and goo d practices. T ech- nical rep ort, W orld Health Organization. W orld Health Organization (2014). Improving mortalit y statistics through civil registration and vital statistics systems: Strategies for coun try and partner support. T ec hnical rep ort, W orld Health Organization. Y e, Y., W am uko ya, M., Ezeh, A., Emina, J., and Sank oh, O. (2012). Health and demographic surv eillance systems: a step to wards full civil registration and vital statistics system in sub- Sahara Africa? BMC public he alth , 12(1):741. 24 A App endix A.1 Optim um allocation sampling strategy details Supp ose w e hav e stratum, indexed by i = 1 , . . . , I . In our case the strata are areas. Let N i b e the p opulation of area i and N = P i N i the total p opulation in the study region. Let Y ik = 0 / 1 b e the indicator of whether child k in area i died, k = 1 , . . . , N i , i = 1 , . . . , I . Then w e are interested in T = P i P k Y ik , the total n umber of deaths. The fraction of deaths is y = b p = T / N . Let q i = N i / N and S i b e the standard deviation of the res ponse in stratum i where S 2 i = N i N i − 1 p i (1 − p i ) ≈ p i (1 − p i ) , whic h is estimated by s 2 i = n i n i − 1 b p i (1 − b p i ) ≈ b p i (1 − b p i ) . If w e use the usual estimator of b p i = P n i k =1 y ik /n i then the v ariance is v ar ( y ) = I X i =1 q 2 i (1 − f i ) S 2 i n i = I X i =1 q 2 i (1 − f i ) N i N i − 1 p i (1 − p i ) n i , where f i = n i / N i , whic h leads to v ar ( b T ) = N 2 I X i =1 q 2 i (1 − f i ) S 2 i n i = N 2 I X i =1 q 2 i (1 − f i ) p i (1 − p i ) n i − 1 . Substituting in b p i giv es the estimated v ariances. W e wish to choose n i , the n umber of samples to take in area i . Then the optim um allo cation, in the sense of minimizing v ar ( y ) (which is the same as minimizing the v ariance of T ) is Neyman allo cation in whic h n i = n q i S i P i q i S i . (5) Note: we really should b e minimizing MSE as our estimators are biased (since they are random effects mo dels with shrink age). In our setting, w e hav e an estimate of p i and so w e can use this in (5) which b ecomes n i ≈ n × q i p b p i (1 − b p i ) P i 0 q i 0 p b p i 0 (1 − b p i 0 ) . . (6) W e do not include the age-gender groups j in our sampling strata, but our mo del pro duces estimates b p ij so w e estimate b p i via b p i = J X j =1 N ij N i b p ij , to use in (6). 25 A.2 Village-lev el c haracteristics for the curren t and historic cohorts T ables A.1 and A.2 display the village characteristics for both the curren t-da y and historical cohorts. The curren t-day cohort is the fixed p opulation from which we dra w rep eated samples, while the historical cohort is used by the Hy ak and optimum sampling sc hemes to obtain estimated village- lev el probabilities of death. In our simulation, w e used villages 4, 7 and 8 as the HDSS sites. T able A.1: Village characteristics for curren t-day cohort. This cohort represents our fixed p opu- lation from whic h we draw rep eated samples. Village Num b er of Households Number of Children # Deaths P(Death) x 1 x 2 1 4221 12523 1654 0.13 0.56 0.70 2 1376 4150 119 0.03 0.92 0.32 3 3050 9172 169 0.02 0.89 0.55 4 3804 11331 483 0.04 0.92 0.56 5 1275 3802 492 0.13 0.39 0.68 6 1515 4550 156 0.03 0.58 0.17 7 3036 9011 929 0.10 0.77 0.98 8 2648 7870 554 0.07 0.32 0.07 9 1957 5841 658 0.11 0.55 0.83 10 3532 10630 500 0.05 0.57 0.47 11 2679 7981 1286 0.16 0.10 0.60 12 2034 6043 413 0.07 0.05 0.83 13 2082 6291 218 0.03 0.73 0.17 14 3320 9901 939 0.09 0.76 0.96 15 2466 7361 196 0.03 0.53 0.51 16 2467 7301 531 0.07 0.66 0.44 17 709 2092 230 0.11 0.04 0.51 18 1192 3610 725 0.20 0.02 0.76 19 3083 9300 600 0.06 0.62 0.27 20 836 2482 447 0.18 0.09 0.97 26 T able A.2: Village characteristics for historical cohort. The HDSS villages are 4, 7 and 8. Village Num b er of Households Number of Children # Deaths P(Death) x 1 x 2 1 1460 4331 587 0.14 0.56 0.70 2 4064 12001 331 0.03 0.92 0.32 3 524 1552 33 0.02 0.89 0.55 4 2927 8720 377 0.04 0.92 0.56 5 4022 11891 1499 0.13 0.39 0.68 6 4157 12450 393 0.03 0.58 0.17 7 2873 8532 919 0.11 0.77 0.98 8 1529 4540 322 0.07 0.32 0.07 9 4108 12152 1292 0.11 0.55 0.83 10 1570 4640 231 0.05 0.57 0.47 11 2789 8342 1444 0.17 0.10 0.60 12 3685 10931 693 0.06 0.05 0.83 13 1786 5242 165 0.03 0.73 0.17 14 674 2070 187 0.09 0.76 0.96 15 473 1402 31 0.02 0.53 0.51 16 3187 9550 735 0.08 0.66 0.44 17 4344 13080 1329 0.10 0.04 0.51 18 3449 10302 2058 0.20 0.02 0.76 19 3080 9191 666 0.07 0.62 0.27 20 468 1422 286 0.20 0.09 0.97 A.3 Additional sim ulation results T ables A.3, A.4, and A.5 summarize the results of the simulation study for n = 3 , 900 , n = 2 , 600 and n = 1 , 300, resp ectively . The num b er of av erage sampled deaths and bias, v ariance and MSE from (4) are displa yed for each combination of sampling strategy and analytical mo del. 27 T able A.3: Deaths, Bias, V ariance, MSE for cluster sampling, stratified sampling, Hy ak and optim um sampling for n = 3 , 900. Results from S = 100 simulations. There w ere 11,299 deaths in the sim ulated population from which s amples were tak en. ‘Cluster’ is shorthand for Two-stage Cluster Sample ; ‘ Hy ak ’ for HDSS with In- formative Sampling ; ‘Strata/Cov ariates’ for L o gistic R e gr ession Covariate Mo del and ‘Strata/Cov ariates/Space’ for L o gistic R e gr ession R andom Effe cts Covariate Mo del . It is not p ossible to fit the spatial model (IV) to the tw o-stage cluster sampling sc heme since there are data from 5 villages only . Design Mo del Deaths Bias V ariance ( × 10 3 ) MSE ( × 10 3 ) Cluster I. Na ¨ ıv e 342 1,072 192 1,342 I I. Strata 342 878 207 977 I I I. Strata/Co v ariates 342 644 775 1,190 IV. Strata/Co v ariates/Space 342 — — — Stratified I. Na ¨ ıv e 344 1,066 9 1,145 I I. Strata 344 871 26 785 I I I. Strata/Co v ariates 344 660 25 460 IV. Strata/Co v ariates/Space 344 225 99 150 Hy ak I. Na ¨ ıv e 409 1,181 8 1,402 I I. Strata 409 982 25 988 I I I. Strata/Co v ariates 409 640 22 431 IV. Strata/Co v ariates/Space 409 188 92 128 Optim um I. Na ¨ ıv e 356 1,079 7 1,171 I I. Strata 356 885 23 806 I I I. Strata/Co v ariates 356 642 23 436 IV. Strata/Co v ariates/Space 356 194 85 123 28 T able A.4: Deaths, Bias, V ariance, MSE for cluster sampling, stratified sampling, Hy ak and optim um sampling for n = 2 , 600. Results from S = 100 simulations. There w ere 11,299 deaths in the sim ulated population from which s amples were tak en. ‘Cluster’ is shorthand for Two-stage Cluster Sample ; ‘ Hy ak ’ for HDSS with In- formative Sampling ; ‘Strata/Cov ariates’ for L o gistic R e gr ession Covariate Mo del and ‘Strata/Cov ariates/Space’ for L o gistic R e gr ession R andom Effe cts Covariate Mo del . It is not p ossible to fit the spatial model (IV) to the tw o-stage cluster sampling sc heme since there are data from 5 villages only . Design Mo del Deaths Bias V ariance ( × 10 3 ) MSE ( × 10 3 ) Cluster I. Na ¨ ıv e 250 1,075 170 1,326 I I. Strata 250 881 190 966 I I I. Strata/Co v ariates 250 659 382 816 IV. Strata/Co v ariates/Space 250 — — — Stratified I. Na ¨ ıv e 256 1,075 11 1,166 I I. Strata 256 879 30 802 I I I. Strata/Co v ariates 256 664 27 468 IV. Strata/Co v ariates/Space 256 248 123 185 Hy ak I. Na ¨ ıv e 302 1,193 15 1,439 I I. Strata 302 992 41 1,025 I I I. Strata/Co v ariates 302 646 30 448 IV. Strata/Co v ariates/Space 302 209 109 152 Optim um I. Na ¨ ıv e 264 1,090 10 1,198 I I. Strata 264 893 31 829 I I I. Strata/Co v ariates 264 646 29 446 IV. Strata/Co v ariates/Space 264 223 109 159 29 T able A.5: Deaths, Bias, V ariance, MSE for cluster sampling, stratified sampling, Hy ak and optim um sampling for n = 1 , 300. Results from S = 100 simulations. There w ere 11,299 deaths in the sim ulated population from which s amples were tak en. ‘Cluster’ is shorthand for Two-stage Cluster Sample ; ‘ Hy ak ’ for HDSS with In- formative Sampling ; ‘Strata/Cov ariates’ for L o gistic R e gr ession Covariate Mo del and ‘Strata/Cov ariates/Space’ for L o gistic R e gr ession R andom Effe cts Covariate Mo del . It is not p ossible to fit the spatial model (IV) to the tw o-stage cluster sampling sc heme since there are data from 5 villages only . Design Mo del Deaths Bias V ariance ( × 10 3 ) MSE ( × 10 3 ) Cluster I. Na ¨ ıv e 113 1,079 193 1,358 I I. Strata 113 886 241 1,025 I I I. Strata/Co v ariates 113 662 1,252 1,690 IV. Strata/Co v ariates/Space 113 — — — Stratified I. Na ¨ ıv e 119 1,088 23 1,205 I I. Strata 119 895 62 863 I I I. Strata/Co v ariates 119 662 60 499 IV. Strata/Co v ariates/Space 119 325 196 301 Hy ak I. Na ¨ ıv e 138 1,193 24 1,447 I I. Strata 138 1,001 70 1,071 I I I. Strata/Co v ariates 138 655 61 491 IV. Strata/Co v ariates/Space 138 309 175 271 Optim um I. Na ¨ ıv e 122 1,100 27 1,238 I I. Strata 122 902 78 891 I I I. Strata/Co v ariates 122 658 68 500 IV. Strata/Co v ariates/Space 122 306 203 297 30 Figures A.1-A.3 displa y the distributions of the estimated probabilit y of dying produced b y eac h mo del (mo dels I, I I I & IV – Na ¨ ıve, Covariates and Covariates & Sp ac e ) under the Hy ak sampling strategy for n = 3 , 900 , n = 2 , 600 and n = 1 , 300, resp ectively . 0.05 0.10 0.15 0.20 0.25 0.30 P(death) Y oung F emales Y oung Males Old F emales Old Males ● ● ● ● ● ● ● ● ● ● ● ● ● ● ● ● ● ● ● ● ● ● ● ● ● ● ● ● ● ● ● ● ● ● ● ● ● ● ● ● ● ● ● ● ● ● ● ● ● ● ● ● ● ● ● ● ● ● ● ● ● ● ● ● ● ● ● ● ● ● ● ● ● ● ● ● ● ● ● ● ● ● ● ● ● ● ● ● ● ● ● ● ● ● ● ● ● ● ● ● ● ● ● ● ● ● ● ● ● ● ● ● ● ● ● ● ● ● ● ● ● ● ● ● ● ● ● ● ● ● ● ● ● ● ● ● ● ● ● ● ● ● ● ● ● ● ● ● ● ● ● ● ● ● ● ● ● ● ● ● ● ● ● ● ● ● ● ● ● ● ● ● ● ● ● ● ● ● ● ● ● ● ● ● ● ● ● ● ● ● ● ● ● ● ● ● ● ● ● ● ● ● ● ● ● ● ● ● ● ● ● ● ● ● ● ● ● ● ● ● ● ● ● ● ● ● ● ● ● ● ● ● ● ● ● ● ● ● ● ● ● ● ● ● ● ● ● ● ● ● ● ● ● ● ● ● ● ● ● ● ● ● ● ● ● ● ● ● ● ● ● ● ● ● ● ● ● ● ● ● ● ● ● ● ● ● ● ● ● ● ● ● ● ● ● ● ● ● ● ● ● ● ● ● ● ● ● ● ● ● ● ● ● ● ● ● ● ● ● ● ● ● ● ● ● ● ● ● ● ● ● ● ● ● ● ● ● ● ● ● ● ● ● ● ● ● ● ● ● ● ● ● ● ● ● ● ● ● ● ● ● ● ● ● ● ● ● ● ● ● ● ● ● ● ● ● ● ● ● ● ● ● ● ● ● ● ● ● ● ● ● ● ● ● ● ● ● ● ● ● ● Model I Model III Model IV T r uth Figure A.1: The distributions of the estimated probability of dying from mo dels I, I I I and IV under the Hy ak sampling strategy for n = 3 , 900. 31 0.05 0.10 0.15 0.20 0.25 P(death) Y oung F emales Y oung Males Old F emales Old Males ● ● ● ● ● ● ● ● ● ● ● ● ● ● ● ● ● ● ● ● ● ● ● ● ● ● ● ● ● ● ● ● ● ● ● ● ● ● ● ● ● ● ● ● ● ● ● ● ● ● ● ● ● ● ● ● ● ● ● ● ● ● ● ● ● ● ● ● ● ● ● ● ● ● ● ● ● ● ● ● ● ● ● ● ● ● ● ● ● ● ● ● ● ● ● ● ● ● ● ● ● ● ● ● ● ● ● ● ● ● ● ● ● ● ● ● ● ● ● ● ● ● ● ● ● ● ● ● ● ● ● ● ● ● ● ● ● ● ● ● ● ● ● ● ● ● ● ● ● ● ● ● ● ● ● ● ● ● ● ● ● ● ● ● ● ● ● ● ● ● ● ● ● ● ● ● ● ● ● ● ● ● ● ● ● ● ● ● ● ● ● ● ● ● ● ● ● ● ● ● ● ● ● ● ● ● ● ● ● ● ● ● ● ● ● ● ● ● ● ● ● ● ● ● ● ● ● ● ● ● ● ● ● ● ● ● ● ● ● ● ● ● ● ● ● ● ● ● ● ● ● ● ● ● ● ● ● ● ● ● ● ● ● ● ● ● ● ● ● ● ● ● ● ● ● ● ● ● ● ● ● ● ● ● ● ● ● ● ● ● ● ● ● ● ● ● ● ● ● ● ● ● ● ● ● ● ● ● ● ● ● ● ● ● ● ● ● ● ● ● ● ● ● ● ● ● ● ● ● ● ● ● ● ● ● ● ● ● ● ● ● ● ● ● ● ● ● ● ● ● ● ● ● ● ● ● ● ● ● ● ● ● ● ● ● ● ● ● ● ● ● ● ● ● ● ● ● ● ● ● ● ● ● ● ● ● ● ● ● ● ● ● ● ● ● ● ● ● ● ● ● Model I Model III Model IV T r uth Figure A.2: The distributions of the estimated probability of dying from mo dels I, I I I and IV under the Hy ak sampling strategy for n = 2 , 600. 32 0.05 0.10 0.15 0.20 0.25 0.30 0.35 P(death) Y oung F emales Y oung Males Old F emales Old Males ● ● ● ● ● ● ● ● ● ● ● ● ● ● ● ● ● ● ● ● ● ● ● ● ● ● ● ● ● ● ● ● ● ● ● ● ● ● ● ● ● ● ● ● ● ● ● ● ● ● ● ● ● ● ● ● ● ● ● ● ● ● ● ● ● ● ● ● ● ● ● ● ● ● ● ● ● ● ● ● ● ● ● ● ● ● ● ● ● ● ● ● ● ● ● ● ● ● ● ● ● ● ● ● ● ● ● ● ● ● ● ● ● ● ● ● ● ● ● ● ● ● ● ● ● ● ● ● ● ● ● ● ● ● ● ● ● ● ● ● ● ● ● ● ● ● ● ● ● ● ● ● ● ● ● ● ● ● ● ● ● ● ● ● ● ● ● ● ● ● ● ● ● ● ● ● ● ● ● ● ● ● ● ● ● ● ● ● ● ● ● ● ● ● ● ● ● ● ● ● ● ● ● ● ● ● ● ● ● ● ● ● ● ● ● ● ● ● ● ● ● ● ● ● ● ● ● ● ● ● ● ● ● ● ● ● ● ● ● ● ● ● ● ● ● ● ● ● ● ● ● ● ● ● ● ● ● ● ● ● ● ● ● ● ● ● ● ● ● ● ● ● ● ● ● ● ● ● ● ● ● ● ● ● ● ● ● ● ● ● ● ● ● ● ● ● ● ● ● ● ● ● ● ● ● ● ● ● ● ● ● ● ● ● ● ● ● ● ● ● ● ● ● ● ● ● ● ● ● ● ● ● ● ● ● ● ● ● ● ● ● ● ● ● ● ● ● ● ● ● ● ● ● ● ● ● ● ● ● ● ● ● ● ● ● ● ● ● ● ● ● ● ● ● ● ● ● ● ● ● ● ● ● ● ● ● ● ● ● ● ● ● ● ● ● ● ● ● ● ● ● Model I Model III Model IV T r uth Figure A.3: The distributions of the estimated probability of dying from mo dels I, I I I and IV under the Hy ak sampling strategy for n = 1 , 300. 33 Figures A.4-A.6 displa y the a v erage village- and strata-sp ecific estimates for the (unobserv ed) p opulation counts of death plotted against the true v alues across each of the four mo dels under the Hy ak sampling scheme for n = 3 , 900 , n = 2 , 600 and n = 1 , 300, respectively . 20 40 60 80 100 140 20 60 100 140 Y oung Females A verage Estimated Y ij T ruth 1 2 3 4 5 6 7 8 9 10 11 12 13 14 15 16 17 18 19 20 1 2 3 4 5 6 7 8 9 10 11 12 13 14 15 16 17 18 19 20 1 2 3 4 5 6 7 8 9 10 11 12 13 14 15 16 17 18 19 20 1 2 3 4 5 6 7 8 9 10 11 12 13 14 15 16 17 18 19 20 ● ● ● ● Model I Model II Model III Model IV 50 100 150 200 250 300 50 100 200 300 Old Females A verage Estimated Y ij T ruth 1 2 3 4 5 6 7 8 9 10 11 12 13 14 15 16 17 18 19 20 1 2 3 4 5 6 7 8 9 10 11 12 13 14 15 16 17 18 19 20 1 2 3 4 5 6 7 8 9 10 11 12 13 14 15 16 17 18 19 20 1 2 3 4 5 6 7 8 9 10 11 12 13 14 15 16 17 18 19 20 100 200 300 400 500 100 200 300 400 500 Y oung Males A verage Estimated Y ij T ruth 1 2 3 4 5 6 7 8 9 10 11 12 13 14 15 16 17 18 19 20 1 2 3 4 5 6 7 8 9 10 11 12 13 14 15 16 17 18 19 20 1 2 3 4 5 6 7 89 10 11 12 13 14 15 16 17 18 19 20 1 2 3 4 5 6 7 8 9 10 11 12 13 14 15 16 17 18 19 20 200 400 600 800 200 400 600 800 Old Males A verage Estimated Y ij T ruth 1 2 3 4 5 6 7 8 9 10 11 12 13 14 15 16 17 18 19 20 1 2 3 4 5 6 7 8 9 10 11 12 13 14 15 16 17 18 19 20 1 2 3 4 5 6 7 8 9 10 11 12 13 14 15 16 17 18 19 20 1 2 3 4 5 6 7 8 9 10 11 12 13 14 15 16 17 18 19 20 Figure A.4: The a verage village- and strata-sp ecific estimates for the (unobserv ed) p opulation coun ts of death plotted against the true v alues across each of the four mo dels under the Hy ak sampling scheme for n = 3 , 900. Plotting symbols indicate village n umbers. 34 20 40 60 80 100 140 20 60 100 140 Y oung Females A verage Estimated Y ij T ruth 1 2 3 4 5 6 7 8 9 10 11 12 13 14 15 16 17 18 19 20 1 2 3 4 5 6 7 8 9 10 11 12 13 14 15 16 17 18 19 20 1 2 3 4 5 6 7 8 9 10 11 12 13 14 15 16 17 18 19 20 1 2 3 4 5 6 7 8 9 10 11 12 13 14 15 16 17 18 19 20 ● ● ● ● Model I Model II Model III Model IV 50 100 150 200 250 300 50 100 200 300 Old Females A verage Estimated Y ij T ruth 1 2 3 4 5 6 7 8 9 10 11 12 13 14 15 16 17 18 19 20 1 2 3 4 5 6 7 8 9 10 11 12 13 14 15 16 17 18 19 20 1 2 3 4 5 6 7 8 9 10 11 12 13 14 15 16 17 18 19 20 1 2 3 4 5 6 7 8 9 10 11 12 13 14 15 16 17 18 19 20 100 200 300 400 500 100 200 300 400 500 Y oung Males A verage Estimated Y ij T ruth 1 2 3 4 5 6 7 8 9 10 11 12 13 14 15 16 17 18 19 20 1 2 3 4 5 6 7 8 9 10 11 12 13 14 15 16 17 18 19 20 1 2 3 4 5 6 7 89 10 11 12 13 14 15 16 17 18 19 20 1 2 3 4 5 6 7 8 9 10 11 12 13 14 15 16 17 18 19 20 200 400 600 800 200 400 600 800 Old Males A verage Estimated Y ij T ruth 1 2 3 4 5 6 7 8 9 10 11 12 13 14 15 16 17 18 19 20 1 2 3 4 5 6 7 8 9 10 11 12 13 14 15 16 17 18 19 20 1 2 3 4 5 6 7 8 9 10 11 12 13 14 15 16 17 18 19 20 1 2 3 4 5 6 7 8 9 10 11 12 13 14 15 16 17 18 19 20 Figure A.5: The a verage village- and strata-sp ecific estimates for the (unobserv ed) p opulation coun ts of death plotted against the true v alues across each of the four mo dels under the Hy ak sampling scheme for n = 2 , 600. Plotting symbols indicate village n umbers. 35 20 40 60 80 100 140 20 60 100 140 Y oung Females A verage Estimated Y ij T ruth 1 2 3 4 5 6 7 8 9 10 11 12 13 14 15 16 17 18 19 20 1 2 3 4 5 6 7 8 9 10 11 12 13 14 15 16 17 18 19 20 1 2 3 4 5 6 7 8 9 10 11 12 13 14 15 16 17 18 19 20 1 2 3 4 5 6 7 8 9 10 11 12 13 14 15 16 17 18 19 20 ● ● ● ● Model I Model II Model III Model IV 50 100 150 200 250 300 50 100 200 300 Old Females A verage Estimated Y ij T ruth 1 2 3 4 5 6 7 8 9 10 11 12 13 14 15 16 17 18 19 20 1 2 3 4 5 6 7 8 9 10 11 12 13 14 15 16 17 18 19 20 1 2 3 4 5 6 7 8 9 10 11 12 13 14 15 16 17 18 19 20 1 2 3 4 5 6 7 8 9 10 11 12 13 14 15 16 17 18 19 20 100 200 300 400 500 100 200 300 400 500 Y oung Males A verage Estimated Y ij T ruth 1 2 3 4 5 6 7 8 9 10 11 12 13 14 15 16 17 18 19 20 1 2 3 4 5 6 7 8 9 10 11 12 13 14 15 16 17 18 19 20 1 2 3 4 5 6 7 8 9 10 11 12 13 14 15 16 17 18 19 20 1 2 3 4 5 6 7 8 9 10 11 12 13 14 15 16 17 18 19 20 200 400 600 800 200 400 600 800 Old Males A verage Estimated Y ij T ruth 1 2 3 4 5 6 7 8 9 10 11 12 13 14 15 16 17 18 19 20 1 2 3 4 5 6 7 8 9 10 11 12 13 14 15 16 17 18 19 20 1 2 3 4 5 6 7 8 9 10 11 12 13 14 15 16 17 18 19 20 1 2 3 4 5 6 7 8 9 10 11 12 13 14 15 16 17 18 19 20 Figure A.6: The a verage village- and strata-sp ecific estimates for the (unobserv ed) p opulation coun ts of death plotted against the true v alues across each of the four mo dels under the Hy ak sampling scheme for n = 1 , 300. Plotting symbols indicate village n umbers. 36 Figures A.7-A.10 display the av erage village- and strata-specific estimates for the (unobserved) p opulation coun ts of death plotted against the true v alues across each of the four mo dels under the tw o-stage cluster sampling sc heme for n = 5 , 200 , n = 3 , 900 , n = 2 , 600 and n = 1 , 300, resp ectiv ely . 20 40 60 80 100 140 20 40 60 80 120 Y oung Females A verage Estimated Y ij T ruth 1 2 3 4 5 6 7 8 9 10 11 12 13 14 15 16 17 18 19 20 1 2 3 4 5 6 7 8 9 10 11 12 13 14 15 16 17 18 19 20 1 2 3 4 5 6 7 8 9 10 11 12 13 14 15 16 17 18 19 20 ● ● ● Model I Model II Model III 50 100 150 200 250 300 50 100 200 300 Old Females A verage Estimated Y ij T ruth 1 2 3 4 5 6 7 8 9 10 11 12 13 14 15 16 17 18 19 20 1 2 3 4 5 6 7 8 9 10 11 12 13 14 15 16 17 18 19 20 1 2 3 4 5 6 7 8 9 10 11 12 13 14 15 16 17 18 19 20 100 200 300 400 100 200 300 400 Y oung Males A verage Estimated Y ij T ruth 1 2 3 4 5 6 7 8 9 10 11 12 13 14 15 16 17 18 19 20 1 2 3 4 5 6 7 8 9 10 11 12 13 14 15 16 17 18 19 20 1 2 3 4 5 6 7 8 9 10 11 12 13 14 15 16 17 18 19 20 200 400 600 800 200 400 600 800 Old Males A verage Estimated Y ij T ruth 1 2 3 4 5 6 7 8 9 10 11 12 13 14 15 16 17 18 19 20 1 2 3 4 5 6 7 8 9 10 11 12 13 14 15 16 17 18 19 20 1 2 3 4 5 6 7 8 9 10 11 12 13 14 15 16 17 18 19 20 Figure A.7: The a verage village- and strata-sp ecific estimates for the (unobserv ed) p opulation coun ts of death plotted against the true v alues across each of the four mo dels under the tw o-stage cluster sampling scheme for n = 5 , 200. Plotting symbols indicate village n umbers. 37 20 40 60 80 100 140 20 40 60 80 120 Y oung Females A verage Estimated Y ij T ruth 1 2 3 4 5 6 7 8 9 10 11 12 13 14 15 16 17 18 19 20 1 2 3 4 5 6 7 8 9 10 11 12 13 14 15 16 17 18 19 20 1 2 3 4 5 6 7 8 9 10 11 12 13 14 15 16 17 18 19 20 ● ● ● Model I Model II Model III 50 100 150 200 250 300 50 100 200 300 Old Females A verage Estimated Y ij T ruth 1 2 3 4 5 6 7 8 9 10 11 12 13 14 15 16 17 18 19 20 1 2 3 4 5 6 7 8 9 10 11 12 13 14 15 16 17 18 19 20 1 2 3 4 5 6 7 8 9 10 11 12 13 14 15 16 17 18 19 20 100 200 300 400 100 200 300 400 Y oung Males A verage Estimated Y ij T ruth 1 2 3 4 5 6 7 8 9 10 11 12 13 14 15 16 17 18 19 20 1 2 3 4 5 6 7 8 9 10 11 12 13 14 15 16 17 18 19 20 1 2 3 4 5 6 7 8 9 10 11 12 13 14 15 16 17 18 19 20 200 400 600 800 200 400 600 800 Old Males A verage Estimated Y ij T ruth 1 2 3 4 5 6 7 8 9 10 11 12 13 14 15 16 17 18 19 20 1 2 3 4 5 6 7 8 9 10 11 12 13 14 15 16 17 18 19 20 1 2 3 4 5 6 7 8 9 10 11 12 13 14 15 16 17 18 19 20 Figure A.8: The a verage village- and strata-sp ecific estimates for the (unobserv ed) p opulation coun ts of death plotted against the true v alues across each of the four mo dels under the tw o-stage cluster sampling scheme for n = 3 , 900. Plotting symbols indicate village n umbers. 38 20 40 60 80 100 140 20 40 60 80 120 Y oung Females A verage Estimated Y ij T ruth 1 2 3 4 5 6 7 8 9 10 11 12 13 14 15 16 17 18 19 20 1 2 3 4 5 6 7 8 9 10 11 12 13 14 15 16 17 18 19 20 1 2 3 4 5 6 7 8 9 10 11 12 13 14 15 16 17 18 19 20 ● ● ● Model I Model II Model III 50 100 150 200 250 300 50 100 200 300 Old Females A verage Estimated Y ij T ruth 1 2 3 4 5 6 7 8 9 10 11 12 13 14 15 16 17 18 19 20 1 2 3 4 5 6 7 8 9 10 11 12 13 14 15 16 17 18 19 20 1 2 3 4 5 6 7 8 9 10 11 12 13 14 15 16 17 18 19 20 100 200 300 400 100 200 300 400 Y oung Males A verage Estimated Y ij T ruth 1 2 3 4 5 6 7 8 9 10 11 12 13 14 15 16 17 18 19 20 1 2 3 4 5 6 7 8 9 10 11 12 13 14 15 16 17 18 19 20 1 2 3 4 5 6 7 8 9 10 11 12 13 14 15 16 17 18 19 20 200 400 600 800 200 400 600 800 Old Males A verage Estimated Y ij T ruth 1 2 3 4 5 6 7 8 9 10 11 12 13 14 15 16 17 18 19 20 1 2 3 4 5 6 7 8 9 10 11 12 13 14 15 16 17 18 19 20 1 2 3 4 5 6 7 8 9 10 11 12 13 14 15 16 17 18 19 20 Figure A.9: The a verage village- and strata-sp ecific estimates for the (unobserv ed) p opulation coun ts of death plotted against the true v alues across each of the four mo dels under the tw o-stage cluster sampling scheme for n = 2 , 600. Plotting symbols indicate village n umbers. 39 20 40 60 80 100 140 20 40 60 80 120 Y oung Females A verage Estimated Y ij T ruth 1 2 3 4 5 6 7 8 9 10 11 12 13 14 15 16 17 18 19 20 1 2 3 4 5 6 7 8 9 10 11 12 13 14 15 16 17 18 19 20 1 2 3 4 5 6 7 8 9 10 11 12 13 14 15 16 17 18 19 20 ● ● ● Model I Model II Model III 50 100 150 200 250 300 50 100 200 300 Old Females A verage Estimated Y ij T ruth 1 2 3 4 5 6 7 8 9 10 11 12 13 14 15 16 17 18 19 20 1 2 3 4 5 6 7 8 9 10 11 12 13 14 15 16 17 18 19 20 1 2 3 4 5 6 7 8 9 10 11 12 13 14 15 16 17 18 19 20 100 200 300 400 100 200 300 400 Y oung Males A verage Estimated Y ij T ruth 1 2 3 4 5 6 7 8 9 10 11 12 13 14 15 16 17 18 19 20 1 2 3 4 5 6 7 8 9 10 11 12 13 14 15 16 17 18 19 20 1 2 3 4 5 6 7 8 9 10 11 12 13 14 15 16 17 18 19 20 200 400 600 800 200 400 600 800 Old Males A verage Estimated Y ij T ruth 1 2 3 4 5 6 7 8 9 10 11 12 13 14 15 16 17 18 19 20 1 2 3 4 5 6 7 8 9 10 11 12 13 14 15 16 17 18 19 20 1 2 3 4 5 6 7 8 9 10 11 12 13 14 15 16 17 18 19 20 Figure A.10: The av erage village- and strata-sp ecific estimates for the (unobserved) p opulation coun ts of death plotted against the true v alues across each of the four mo dels under the tw o-stage cluster sampling sc heme for n = 1 , 300. Plotting sym b ols indicate village n umbers. 40 Figures A.11-A.14 display the a verage village- and strata-sp ecific estimates for the (unobserv ed) p opulation coun ts of death plotted against the true v alues across each of the four mo dels under the simple random sampling scheme for n = 5 , 200 , n = 3 , 900 , n = 2 , 600 and n = 1 , 300, resp ec- tiv ely . 20 40 60 80 100 140 20 60 100 140 Y oung Females A verage Estimated Y ij T ruth 1 2 3 4 5 6 7 8 9 10 11 12 13 14 15 16 17 18 19 20 1 2 3 4 5 6 7 8 9 10 11 12 13 14 15 16 17 18 19 20 1 2 3 4 5 6 7 8 9 10 11 12 13 14 15 16 17 18 19 20 1 2 3 4 5 6 7 8 9 10 11 12 13 14 15 16 17 18 19 20 ● ● ● ● Model I Model II Model III Model IV 50 100 150 200 250 300 50 100 200 300 Old Females A verage Estimated Y ij T ruth 1 2 3 4 5 6 7 8 9 10 11 12 13 14 15 16 17 18 19 20 1 2 3 4 5 6 7 8 9 10 11 12 13 14 15 16 17 18 19 20 1 2 3 4 5 6 7 8 9 10 11 12 13 14 15 16 17 18 19 20 1 2 3 4 5 6 7 8 9 10 11 12 13 14 15 16 17 18 19 20 100 200 300 400 100 200 300 400 Y oung Males A verage Estimated Y ij T ruth 1 2 3 4 5 6 7 8 9 10 11 12 13 14 15 16 17 18 19 20 1 2 3 4 5 6 7 8 9 10 11 12 13 14 15 16 17 18 19 20 1 2 3 4 5 6 7 8 9 10 11 12 13 14 15 16 17 18 19 20 1 2 3 4 5 6 7 8 9 10 11 12 13 14 15 16 17 18 19 20 200 400 600 800 200 400 600 800 Old Males A verage Estimated Y ij T ruth 1 2 3 4 5 6 7 8 9 10 11 12 13 14 15 16 17 18 19 20 1 2 3 4 5 6 7 8 9 10 11 12 13 14 15 16 17 18 19 20 1 2 3 4 5 6 7 8 9 10 11 12 13 14 15 16 17 18 19 20 1 2 3 4 5 6 7 8 9 10 11 12 13 14 15 16 17 18 19 20 Figure A.11: The av erage village- and strata-sp ecific estimates for the (unobserved) p opulation coun ts of death plotted against the true v alues across each of the four mo dels under the simple random sampling sc heme for n = 5 , 200. Plotting symbols indicate village n umbers. 41 20 40 60 80 100 140 20 60 100 140 Y oung Females A verage Estimated Y ij T ruth 1 2 3 4 5 6 7 8 9 10 11 12 13 14 15 16 17 18 19 20 1 2 3 4 5 6 7 8 9 10 11 12 13 14 15 16 17 18 19 20 1 2 3 4 5 6 7 8 9 10 11 12 13 14 15 16 17 18 19 20 1 2 3 4 5 6 7 8 9 10 11 12 13 14 15 16 17 18 19 20 ● ● ● ● Model I Model II Model III Model IV 50 100 150 200 250 300 50 100 200 300 Old Females A verage Estimated Y ij T ruth 1 2 3 4 5 6 7 8 9 10 11 12 13 14 15 16 17 18 19 20 1 2 3 4 5 6 7 8 9 10 11 12 13 14 15 16 17 18 19 20 1 2 3 4 5 6 7 8 9 10 11 12 13 14 15 16 17 18 19 20 1 2 3 4 5 6 7 8 9 10 11 12 13 14 15 16 17 18 19 20 100 200 300 400 100 200 300 400 Y oung Males A verage Estimated Y ij T ruth 1 2 3 4 5 6 7 8 9 10 11 12 13 14 15 16 17 18 19 20 1 2 3 4 5 6 7 8 9 10 11 12 13 14 15 16 17 18 19 20 1 2 3 4 5 6 7 8 9 10 11 12 13 14 15 16 17 18 19 20 1 2 3 4 5 6 7 8 9 10 11 12 13 14 15 16 17 18 19 20 200 400 600 800 200 400 600 800 Old Males A verage Estimated Y ij T ruth 1 2 3 4 5 6 7 8 9 10 11 12 13 14 15 16 17 18 19 20 1 2 3 4 5 6 7 8 9 10 11 12 13 14 15 16 17 18 19 20 1 2 3 4 5 6 7 8 9 10 11 12 13 14 15 16 17 18 19 20 1 2 3 4 5 6 7 8 9 10 11 12 13 14 15 16 17 18 19 20 Figure A.12: The av erage village- and strata-sp ecific estimates for the (unobserved) p opulation coun ts of death plotted against the true v alues across each of the four mo dels under the simple random sampling sc heme for n = 3 , 900. Plotting symbols indicate village n umbers. 42 20 40 60 80 100 140 20 60 100 140 Y oung Females A verage Estimated Y ij T ruth 1 2 3 4 5 6 7 8 9 10 11 12 13 14 15 16 17 18 19 20 1 2 3 4 5 6 7 8 9 10 11 12 13 14 15 16 17 18 19 20 1 2 3 4 5 6 7 8 9 10 11 12 13 14 15 16 17 18 19 20 1 2 3 4 5 6 7 8 9 10 11 12 13 14 15 16 17 18 19 20 ● ● ● ● Model I Model II Model III Model IV 50 100 150 200 250 300 50 100 200 300 Old Females A verage Estimated Y ij T ruth 1 2 3 4 5 6 7 8 9 10 11 12 13 14 15 16 17 18 19 20 1 2 3 4 5 6 7 8 9 10 11 12 13 14 15 16 17 18 19 20 1 2 3 4 5 6 7 8 9 10 11 12 13 14 15 16 17 18 19 20 1 2 3 4 5 6 7 8 9 10 11 12 13 14 15 16 17 18 19 20 100 200 300 400 100 200 300 400 Y oung Males A verage Estimated Y ij T ruth 1 2 3 4 5 6 7 8 9 10 11 12 13 14 15 16 17 18 19 20 1 2 3 4 5 6 7 8 9 10 11 12 13 14 15 16 17 18 19 20 1 2 3 4 5 6 7 8 9 10 11 12 13 14 15 16 17 18 19 20 1 2 3 4 5 6 7 8 9 10 11 12 13 14 15 16 17 18 19 20 200 400 600 800 200 400 600 800 Old Males A verage Estimated Y ij T ruth 1 2 3 4 5 6 7 8 9 10 11 12 13 14 15 16 17 18 19 20 1 2 3 4 5 6 7 8 9 10 11 12 13 14 15 16 17 18 19 20 1 2 3 4 5 6 7 8 9 10 11 12 13 14 15 16 17 18 19 20 1 2 3 4 5 6 7 8 9 10 11 12 13 14 15 16 17 18 19 20 Figure A.13: The av erage village- and strata-sp ecific estimates for the (unobserved) p opulation coun ts of death plotted against the true v alues across each of the four mo dels under the simple random sampling sc heme for n = 2 , 600. Plotting symbols indicate village n umbers. 43 20 40 60 80 100 140 20 60 100 140 Y oung Females A verage Estimated Y ij T ruth 1 2 3 4 5 6 7 8 9 10 11 12 13 14 15 16 17 18 19 20 1 2 3 4 5 6 7 8 9 10 11 12 13 14 15 16 17 18 19 20 1 2 3 4 5 6 7 8 9 10 11 12 13 14 15 16 17 18 19 20 1 2 3 4 5 6 7 8 9 10 11 12 13 14 15 16 17 18 19 20 ● ● ● ● Model I Model II Model III Model IV 50 100 150 200 250 300 50 100 200 300 Old Females A verage Estimated Y ij T ruth 1 2 3 4 5 6 7 8 9 10 11 12 13 14 15 16 17 18 19 20 1 2 3 4 5 6 7 8 9 10 11 12 13 14 15 16 17 18 19 20 1 2 3 4 5 6 7 8 9 10 11 12 13 14 15 16 17 18 19 20 1 2 3 4 5 6 7 8 9 10 11 12 13 14 15 16 17 18 19 20 100 200 300 400 100 200 300 400 Y oung Males A verage Estimated Y ij T ruth 1 2 3 4 5 6 7 8 9 10 11 12 13 14 15 16 17 18 19 20 1 2 3 4 5 6 7 8 9 10 11 12 13 14 15 16 17 18 19 20 1 2 3 4 5 6 7 8 9 10 11 12 13 14 15 16 17 18 19 20 1 2 3 4 5 6 7 8 9 10 11 12 13 14 15 16 17 18 19 20 200 400 600 800 200 400 600 800 Old Males A verage Estimated Y ij T ruth 1 2 3 4 5 6 7 8 9 10 11 12 13 14 15 16 17 18 19 20 1 2 3 4 5 6 7 8 9 10 11 12 13 14 15 16 17 18 19 20 1 2 3 4 5 6 7 8 9 10 11 12 13 14 15 16 17 18 19 20 1 2 3 4 5 6 7 8 9 10 11 12 13 14 15 16 17 18 19 20 Figure A.14: The av erage village- and strata-sp ecific estimates for the (unobserved) p opulation coun ts of death plotted against the true v alues across each of the four mo dels under the simple random sampling sc heme for n = 1 , 300. Plotting symbols indicate village n umbers. 44 Figures A.15-A.18 display the a verage village- and strata-sp ecific estimates for the (unobserv ed) p opulation counts of death plotted against the true v alues across each of the four mo dels under the optim um sampling scheme for n = 5 , 200 , n = 3 , 900 , n = 2 , 600 and n = 1 , 300, resp ectively . 20 40 60 80 100 140 20 60 100 140 Y oung Females A verage Estimated Y ij T ruth 1 2 3 4 5 6 7 8 9 10 11 12 13 14 15 16 17 18 19 20 1 2 3 4 5 6 7 8 9 10 11 12 13 14 15 16 17 18 19 20 1 2 3 4 5 6 7 8 9 10 11 12 13 14 15 16 17 18 19 20 1 2 3 4 5 6 7 8 9 10 11 12 13 14 15 16 17 18 19 20 ● ● ● ● Model I Model II Model III Model IV 50 100 150 200 250 300 50 100 200 300 Old Females A verage Estimated Y ij T ruth 1 2 3 4 5 6 7 8 9 10 11 12 13 14 15 16 17 18 19 20 1 2 3 4 5 6 7 8 9 10 11 12 13 14 15 16 17 18 19 20 1 2 3 4 5 6 7 8 9 10 11 12 13 14 15 16 17 18 19 20 1 2 3 4 5 6 7 8 9 10 11 12 13 14 15 16 17 18 19 20 100 200 300 400 100 200 300 400 Y oung Males A verage Estimated Y ij T ruth 1 2 3 4 5 6 7 8 9 10 11 12 13 14 15 16 17 18 19 20 1 2 3 4 5 6 7 8 9 10 11 12 13 14 15 16 17 18 19 20 1 2 3 4 5 6 7 8 9 10 11 12 13 14 15 16 17 18 19 20 1 2 3 4 5 6 7 8 9 10 11 12 13 14 15 16 17 18 19 20 200 400 600 800 200 400 600 800 Old Males A verage Estimated Y ij T ruth 1 2 3 4 5 6 7 8 9 10 11 12 13 14 15 16 17 18 19 20 1 2 3 4 5 6 7 8 9 10 11 12 13 14 15 16 17 18 19 20 1 2 3 4 5 6 7 8 9 10 11 12 13 14 15 16 17 18 19 20 1 2 3 4 5 6 7 8 9 10 11 12 13 14 15 16 17 18 19 20 Figure A.15: The av erage village- and strata-sp ecific estimates for the (unobserved) p opulation coun ts of death plotted against the true v alues across each of the four mo dels under the optim um sampling scheme for n = 5 , 200. Plotting sym b ols indicate village n umbers. 45 20 40 60 80 100 140 20 60 100 140 Y oung Females A verage Estimated Y ij T ruth 1 2 3 4 5 6 7 8 9 10 11 12 13 14 15 16 17 18 19 20 1 2 3 4 5 6 7 8 9 10 11 12 13 14 15 16 17 18 19 20 1 2 3 4 5 6 7 8 9 10 11 12 13 14 15 16 17 18 19 20 1 2 3 4 5 6 7 8 9 10 11 12 13 14 15 16 17 18 19 20 ● ● ● ● Model I Model II Model III Model IV 50 100 150 200 250 300 50 100 200 300 Old Females A verage Estimated Y ij T ruth 1 2 3 4 5 6 7 8 9 10 11 12 13 14 15 16 17 18 19 20 1 2 3 4 5 6 7 8 9 10 11 12 13 14 15 16 17 18 19 20 1 2 3 4 5 6 7 8 9 10 11 12 13 14 15 16 17 18 19 20 1 2 3 4 5 6 7 8 9 10 11 12 13 14 15 16 17 18 19 20 100 200 300 400 100 200 300 400 Y oung Males A verage Estimated Y ij T ruth 1 2 3 4 5 6 7 8 9 10 11 12 13 14 15 16 17 18 19 20 1 2 3 4 5 6 7 8 9 10 11 12 13 14 15 16 17 18 19 20 1 2 3 4 5 6 7 8 9 10 11 12 13 14 15 16 17 18 19 20 1 2 3 4 5 6 7 8 9 10 11 12 13 14 15 16 17 18 19 20 200 400 600 800 200 400 600 800 Old Males A verage Estimated Y ij T ruth 1 2 3 4 5 6 7 8 9 10 11 12 13 14 15 16 17 18 19 20 1 2 3 4 5 6 7 8 9 10 11 12 13 14 15 16 17 18 19 20 1 2 3 4 5 6 7 8 9 10 11 12 13 14 15 16 17 18 19 20 1 2 3 4 5 6 7 8 9 10 11 12 13 14 15 16 17 18 19 20 Figure A.16: The av erage village- and strata-sp ecific estimates for the (unobserved) p opulation coun ts of death plotted against the true v alues across each of the four mo dels under the optim um sampling scheme for n = 3 , 900. Plotting sym b ols indicate village n umbers. 46 20 40 60 80 100 140 20 60 100 140 Y oung Females A verage Estimated Y ij T ruth 1 2 3 4 5 6 7 8 9 10 11 12 13 14 15 16 17 18 19 20 1 2 3 4 5 6 7 8 9 10 11 12 13 14 15 16 17 18 19 20 1 2 3 4 5 6 7 8 9 10 11 12 13 14 15 16 17 18 19 20 1 2 3 4 5 6 7 8 9 10 11 12 13 14 15 16 17 18 19 20 ● ● ● ● Model I Model II Model III Model IV 50 100 150 200 250 300 50 100 200 300 Old Females A verage Estimated Y ij T ruth 1 2 3 4 5 6 7 8 9 10 11 12 13 14 15 16 17 18 19 20 1 2 3 4 5 6 7 8 9 10 11 12 13 14 15 16 17 18 19 20 1 2 3 4 5 6 7 8 9 10 11 12 13 14 15 16 17 18 19 20 1 2 3 4 5 6 7 8 9 10 11 12 13 14 15 16 17 18 19 20 100 200 300 400 100 200 300 400 Y oung Males A verage Estimated Y ij T ruth 1 2 3 4 5 6 7 8 9 10 11 12 13 14 15 16 17 18 19 20 1 2 3 4 5 6 7 8 9 10 11 12 13 14 15 16 17 18 19 20 1 2 3 4 5 6 7 8 9 10 11 12 13 14 15 16 17 18 19 20 1 2 3 4 5 6 7 8 9 10 11 12 13 14 15 16 17 18 19 20 200 400 600 800 200 400 600 800 Old Males A verage Estimated Y ij T ruth 1 2 3 4 5 6 7 8 9 10 11 12 13 14 15 16 17 18 19 20 1 2 3 4 5 6 7 8 9 10 11 12 13 14 15 16 17 18 19 20 1 2 3 4 5 6 7 8 9 10 11 12 13 14 15 16 17 18 19 20 1 2 3 4 5 6 7 8 9 10 11 12 13 14 15 16 17 18 19 20 Figure A.17: The av erage village- and strata-sp ecific estimates for the (unobserved) p opulation coun ts of death plotted against the true v alues across each of the four mo dels under the optim um sampling scheme for n = 2 , 600. Plotting sym b ols indicate village n umbers. 47 20 40 60 80 100 140 20 60 100 140 Y oung Females A verage Estimated Y ij T ruth 1 2 3 4 5 6 7 8 9 10 11 12 13 14 15 16 17 18 19 20 1 2 3 4 5 6 7 8 9 10 11 12 13 14 15 16 17 18 19 20 1 2 3 4 5 6 7 8 9 10 11 12 13 14 15 16 17 18 19 20 1 2 3 4 5 6 7 8 9 10 11 12 13 14 15 16 17 18 19 20 ● ● ● ● Model I Model II Model III Model IV 50 100 150 200 250 300 50 100 200 300 Old Females A verage Estimated Y ij T ruth 1 2 3 4 5 6 7 8 9 10 11 12 13 14 15 16 17 18 19 20 1 2 3 4 5 6 7 8 9 10 11 12 13 14 15 16 17 18 19 20 1 2 3 4 5 6 7 8 9 10 11 12 13 14 15 16 17 18 19 20 1 2 3 4 5 6 7 8 9 10 11 12 13 14 15 16 17 18 19 20 100 200 300 400 100 200 300 400 Y oung Males A verage Estimated Y ij T ruth 1 2 3 4 5 6 7 8 9 10 11 12 13 14 15 16 17 18 19 20 1 2 3 4 5 6 7 8 9 10 11 12 13 14 15 16 17 18 19 20 1 2 3 4 5 6 7 8 9 10 11 12 13 14 15 16 17 18 19 20 1 2 3 4 5 6 7 8 9 10 11 12 13 14 15 16 17 18 19 20 200 400 600 800 200 400 600 800 Old Males A verage Estimated Y ij T ruth 1 2 3 4 5 6 7 8 9 10 11 12 13 14 15 16 17 18 19 20 1 2 3 4 5 6 7 8 9 10 11 12 13 14 15 16 17 18 19 20 1 2 3 4 5 6 7 8 9 10 11 12 13 14 15 16 17 18 19 20 1 2 3 4 5 6 7 8 9 10 11 12 13 14 15 16 17 18 19 20 Figure A.18: The av erage village- and strata-sp ecific estimates for the (unobserved) p opulation coun ts of death plotted against the true v alues across each of the four mo dels under the optim um sampling scheme for n = 1 , 300. Plotting sym b ols indicate village n umbers. 48
Original Paper
Loading high-quality paper...
Comments & Academic Discussion
Loading comments...
Leave a Comment