Identifying Depression on Twitter
Social media has recently emerged as a premier method to disseminate information online. Through these online networks, tens of millions of individuals communicate their thoughts, personal experiences, and social ideals. We therefore explore the pote…
Authors: Moin Nadeem
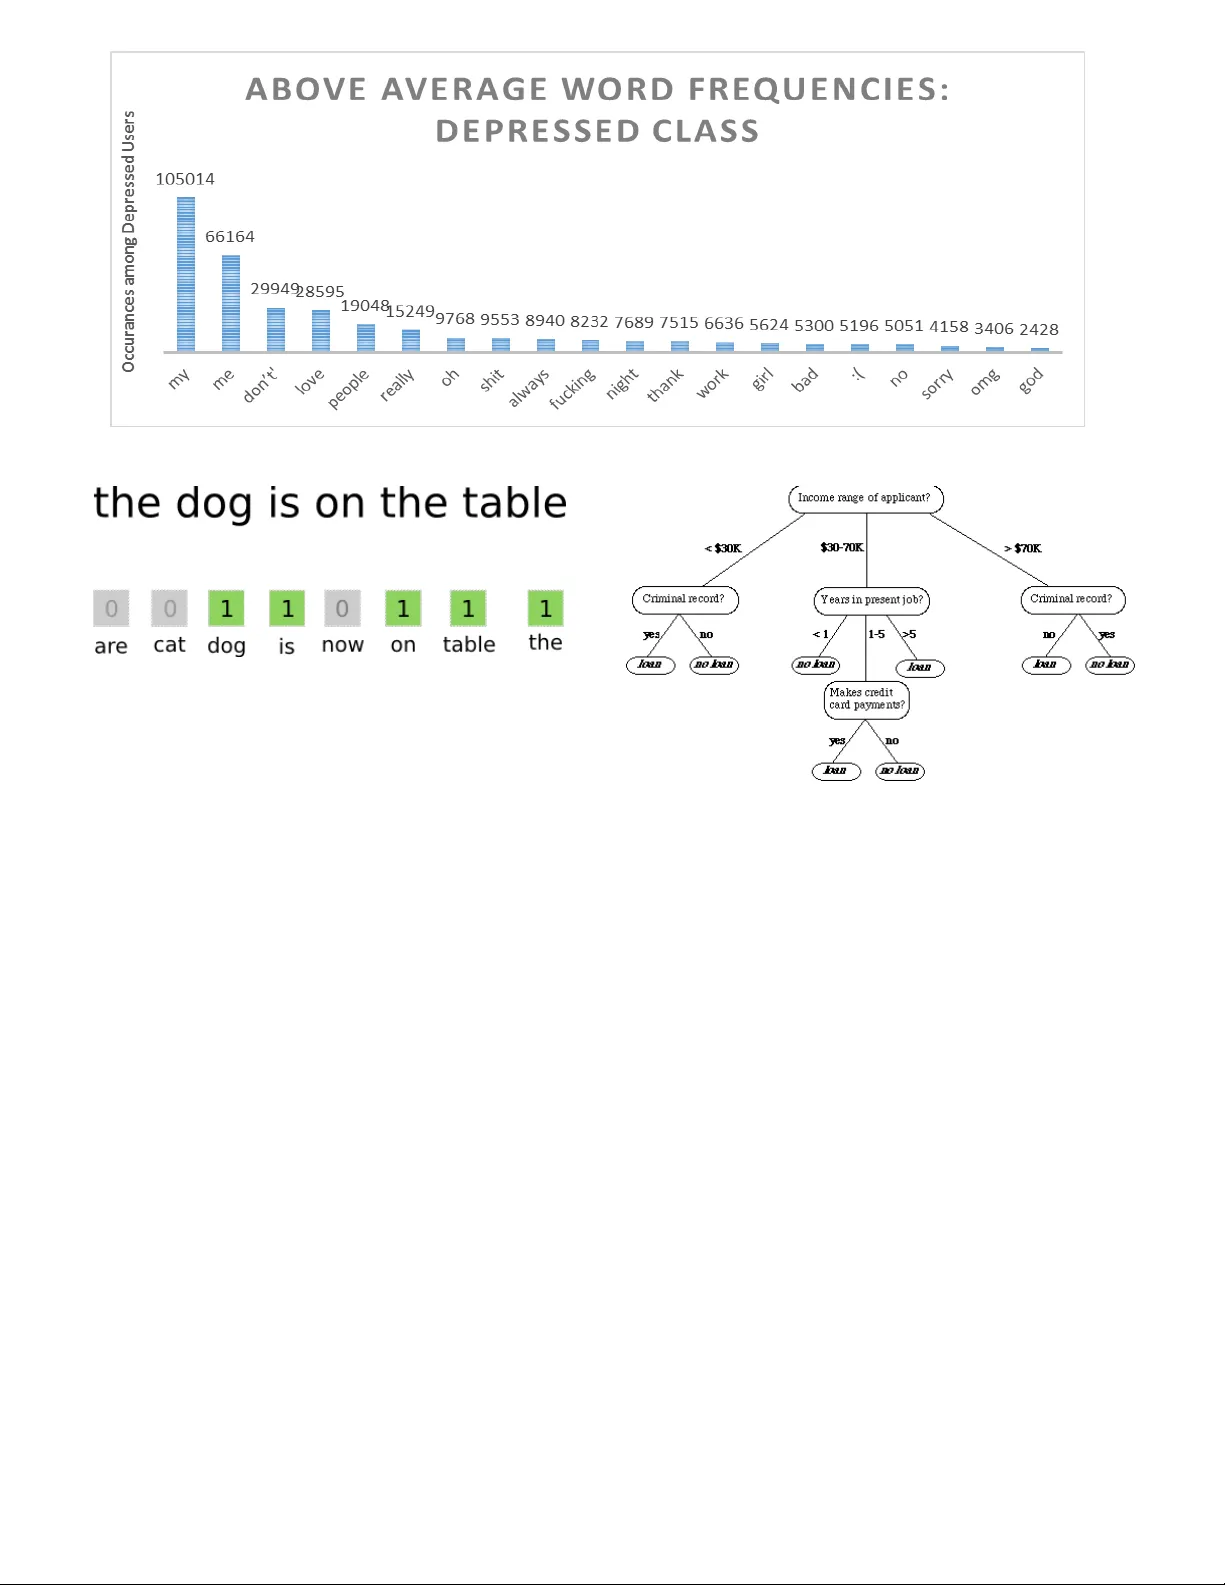
1 Identifying Depr ession on T witter Moin Nadeem 1 , Mike Horn. 1 , Glen Coppersm ith 2 , Johns Hopk ins University and D r. Sandip Sen 3 , PhD, U niversity of Tulsa 1 Advanced Place ment Research, Jenks High Schoo l , Jenks , OK 74037, USA 2 Department of Co mputer Science , Jo hns Hopkins University , B altimore , MD 21218 , USA 3 Department of Co mputer Science , Universit y of Tulsa , Tulsa, OK 74104, USA Social media ha s recently emerged as a pr e m ier method to disseminate information on li ne. Th rough these online networks, tens of m illions of indiv i duals comm unicate their thoughts, p ersonal experiences, and social ideals. W e therefore explore the potential of social media to predict, even prior to onset, Major Depressive Disorder (MDD) in online personas. We employ a crowdsourced method t o co mpile a list of Tw itter users w ho profess t o being diag nosed w ith depression. Using up to a year of pri or social media postings, we utilize a Bag of Words approach to quantify each tweet [1]. Lastly, we leverage seve ral statistical classifiers to provide esti mates to th e risk of depression. Our w ork posits a ne w methodology for constructing our classifier by treating social as a text-classification prob lem, rather than a behavioral one on social media platfor ms. By using a corpus of 2.5 M tweets, w e achieved a n 81 % acc uracy rate in classification, w ith a precision score of .86. We believe that t his method may be helpful in developing tools that estimate the risk of an in dividual b eing depressed, can be employed by physicians, concerned individual s, and healthcare agencies to ai d in diagnosis, even possibly ena bling those suffering f rom depression to be more p roactive about recovering from their mental hea lth. Index Terms — Depression, Machine Learning, Social Media, Twitter I. I NTRODUCTI ON ental health is and contin ues to be a prominent plague for the civilized world. It is es timated that one in four American citizens su ffers from a diagnosable mental disorder in any given year [1]. W hen combined with the 2015 US Census for Residents 1 8 and older, these s tatistics create a picture of 80 million suffering United States citize ns [2] . One in three of these citizens who suffer from a mental ill ness may suffer from clinical depressio n, thus launching a wealth of studies to tackle this matter [3]. Fro m this substantive field, we choose to focus o n Major Depressive Disord er, commo nly referred to as clinical dep ression. Not only do nearly 300 million people w orld wide suffer from clinical depression, bu t the probab ility for an individual to encounter a majo r depressive episode within a period of one year is 3 – 5 % for males and 8 – 10% for females [4] . Yet, these effects of depressio n reach further than simpl y societal happiness: Depressio n takes a toll on U.S. b usinesses that amounts to over $70 b illion annually lost in medical expenditures, prod uctivity, and similar costs. An additio nal $23 billion in other co sts may accrue on behalf of an individual, thus affectin g workdays, di minishing work habit s, and potentially inciting co mplications with concentratio n, memory, and decision -making behaviors. This also stems further tha n simply the economic sphere, and often co-occurs with other illnesses and mental conditions. One in four cancer p atients experience d epression, one in three heart attack survivors u ndergo depression, and up to 7 5% of individuals diagnosed with an eating disorder will encounter the disease [5]. Major depressive disord er has also presented itself as the leading cau se of disability worldwide a mong individuals five and older , and has been correlated with a higher risk for broken bones in women [6]. While these fact ors may be seemingly absurd on their own, they often coalesce into an undue burden on a n ailing patient, thus va stly degrading the quali ty of life for an individual a nd their peers. Any individual suffering t hrough one or more of these mental illnesses will likel y experience a sno wball effect towards others, therefore expo nentially increasin g the likelihood of suicide [ 7]. Levine et al. deter mined that three people co mm it s uicide for every t wo that are involved in a homicide, thus reinforcin g our claim on the validit y of the problem at hand [ 8]. Nevertheless, over t wo-thirds of 30,0 00 suicides reported in the past year w ere due to depression [9] . Mann et al. determined t hat untreated dep ression is the number one risk for suicides a mong youth, and suicid e itself is the third leading cause of deat h among children [10] . Clearly, depression has the potential to manifest itself within a cornucopia of other social is sues, and therefore b ecomes a problem of high priorit y for our society to solve. However, current met hods to identify, suppor t, and treat clinical depression ha ve been considered inefficient. Only 87% of the governments i n the world provide some for m of primary care to combat mental illnesses, a nd 30% of world governments provide no i nstitution at all for mental outreach [11]. T he bulk of the complications with a mental healt h diagnosis lie within the fact that no laborato ry test has been created; the diagnosis is simply derived fro m a patient’s s elf- reported experiences, behav ior questionnaires, surveys, a nd a single mental health statu s examination. These examinations for estimating the degree of depression within individ uals are typically administered in the form of questionnaires, whic h vastly vary in form and lengt h; the most popular o f these are the Center of Epide miologic Studies Depression Scale (CES-D) [ 12] , B eck’s Depression Scale (BDI) [13] , and Zung’s Self -Rating Depression Scale (SDS) [14] . Results on these examinations are co mmonly determined from the patie nt themselves, or a third -part y observation, but never fro m empirical data. T hus, these questionnaires often lend the mselves flaws though subj ective human testing, and may be easily manipulated to ac hieve a pre-deter min ed pr ognosis. T hese results often coincide with M 2 effort to gain anti - depressants, o r otherwise mask one’s depression from a friend or family member. Further more, these questionnaires are ofte n costly, and further the econo mic burden of receiving treat ment for depression s ignificantl y. Yet, before even examini ng flaws with the current methods of treating depr ession, one must simpl y be identified with the illness: the World Health Organization repo rts that the vast major ity of depressed individuals ne ver seek out treatment [15] . This is particularl y troubling for the younger generation, which co mmonly will resort to b lame and stifled self-esteem before seeking help. Even during visits with a primary health care physicia n, depression often goes unrecognized, and therefore undiagnosed [16] . Yet, when Majo r Depressive Disorder ( MDD) is properly identified, contained, and treat ed, it may have far -reac hing impacts upon society. Up to 8 0% of those treated for depression showed an i mprovement in their s ymptoms within four to six weeks [ 10], thus bettering their li ves, productivity, and boosting the econo my. A study funded b y the National Institute of Mental Health dev eloped a test to determine the effectiveness of depression tre atment. Known as the Sequenced Trea tment Alternatives to Relieve Depres sion (STAR*D): it rep orted depression re mission rates of over 65 percent after six months of tre atment [17]. Therefore, it has become patently obvious t hat our largest contrib ution to combating clinical dep ression in the United States would lie wi thin i mproving techniques to identify Major Dep ressive Disorder, rather than in its trea tment methods. We therefore explore, develop, and test a n algorithm to identify M ajor Depressive Disorder (M DD) via social media. Peo ple increasingly utilize social media platfor ms to share their innermost tho ughts, desires, and voice their op inion on social matters. P ostings on these sites are made in a naturalistic manner, and t herefore provides a solution to t he manipulation which self -reported d epression questionnaires often encounter. We have concluded that social media provides a means to cap ture an individuals present state o f mind, and is even effective at representing feelings o f worthlessness, guilt, helples sness, and the levels of sel f -hatred that would often c haracterize clinical depressio n. We pursue the hypothesis that social media, through word vectorization, may be utilized to constr uct statistical models to d etect and even predict Majo r Depressive Disorder, and possibly even compliment and exte nd traditional ap proaches to depr ession diagnosis. Our main contributions to this paper are as follows: 1) We utilize a dataset created by Coppersmith et al . for the Computational Linguistic s and Clinical Psychology (CLPsych) 2015 Shared Task. The d ata was collected fr o m Twitter users who stated a diagnosis of depression, and then was nor malized across a standard d emographic distribution. Each user in t his dataset is anonymized for privacy purposes. 2) We sift through the pro vided models to refine several statistical measures and used them to quantify an individual’s social media b ehavior across the maximum of three thousand tweets, as re commended by Tsuga wa et al [18] . 3) We compare the behaviors o f the depressed user clas s that of the standard, and utilize a B ag of Words ap proach to tokenize the models p rovided by the CLPsych Shared Task. We p rocess the tokenization through a Vecto rizer to quantify the features. 4) We leverage the signal s derived fro m th e Bag o f Words approach to d evelop, and contrast several MDD classifiers, and pro vide a statistical analysis to evaluate the results of each one. O ur best model demonstrated promise in predicting t he mental health condition o f a user with an accurac y of 82% and a precision score of .86. This research is novel i n its use as foundational T ext Classification syste m, while many other co mmon projects provide an analysis as to whether or not a user is depressed, we focus our rea ch onto whether their t weets are depressive in nature or not on a docu ment-level basi s. We believe this researc h could further the underl ying infrastructure for ne w mechanisms which ma y identify depression and related variables, and may even frame directions which could guide valuable interventio ns for a user. Ultimately, we desire for this research to b e built upon with increased feat ures, therefore levera ging the power of statistical model s to save lives. II. L ITERAT URE REVIEW Rich bodies of work on depr ession have been perfor med within the psychiatry, psyc hology, medicine, and sociolinguistic fields to id entify and correlate Maj or Depressive Disorder and its symptoms. In the areas o f medicine and psycholog y, several questio nnaire-based measures rating depressio n have been propo sed. CES - D [12] , BDI [13] , and SDS [14] esti mate the severity of depression in individuals from a variet y of self -reported answers to questionnaires ranging fro m 17 questions to 20 q uestions. Yet, few approaches utilize o bjective information to deter mine their prognosis. Redei et al. has disco vered biological markers for early- onset Major Dep ressive Disorder, which could increa se specify in the diagnosis for cli nical depression. T heir analysis of 26 ca ndidate’s blo od transcriptomic markers in a sa mple of 15 – 19 year-old subjects resul ted in a correct d iagnosis for 11 out of 14 candidates who suffered from depression; anot her panel was able to d istinguish between MDD or comorbid anxiety for 18 individua ls [19]. Redei et al. is notable for being the first significant a pproach towards identifying depression from a medical p erspective, although n umerous exist from a data scie nce perspective [1 9]. 3 Approaches that utilize ob jective information, s uch as log data about an individual ’s activities to predict d epressio n have been studied r ecently. Resnik et al . has for mulated a method for identifying d epression in individuals thro ugh analyzing textual data written by these individuals. T hey obtained topics fro m the essays written by college st udents by applying latent Dirichle t allocation (LDA), a pop ular topic - extraction model within Machine Learning [20]. T hrough using these discovered to pics from a statistical model, they were able to estimate dep ression and neuroticis m in college students with an r value of .45 , thus discovering a slight correlation bet ween neuroticism, dep ression, and acade mic works by college attendees. R esnik et al. becomes relevant for their novel use of topic modeling; otherwise these acad emic works are often a poor dataset to derive diagnoses fro m [2 0]. If not academic papers, resear chers have discovered a deep correlation bet ween the troves of data ava ilable under social media profiles a nd depression diagnoses. In 201 1, Moreno et a l . selected profiles fro m social media mogul Facebook, and evaluated per sonally written bod ies of text, henceforth referred to as a ‘status update’ [21]. Through a set of criteria standardi zed by the America n Psychiatric Association kno wn as Diagnostic Criteria for Major Depressive Disorder and Depressive Episodes (DSM) , they were able to determine that 2 5% of 200 selected profiles displayed signs of depr ession, and 2.5% met criteria for a Major Depressive Episod e. Park et a l . discovered the sa me method may be utilized for T witter through analyzing T witter users with and without depression and their online acti vities. Using a simple regressi ve analysis, Tsugawa et al . discovere d that frequencies of word usage are useful as features towards identifying depression on T witter, and therefore is notab le for furthering the search of which features to utilize in order to estimate the severity of dep ression [ 22]. The most prominent of t hese studies have been conducted b y de Choudhury et a l ., who have pioneered sever al novel aspects into the stat istical models they de velop. Mo st prominently, the specificity o f their research has notabl y differentiated from many others in the field, as the y focused on providing an estimate a s to risk of depression throug h the user’s behavior, rather tha n their status updates [23] . In their study, they developed the usage of features such a s e motion, egonetwork (ie. monitori ng the social activities of one with their close friends), linguistic styles, depressive la nguage, and demographics to feed into t heir statistical model [2 3]. De Choudhury et al . d iscovered that the onset of depr ession through social media may have been able to b e characteri zed through a decrease in social activity, raised negative effect, a highly clustered egonet work (ie. highly clustered social groups, as opposed to an open -graph model), heightened relational and medicinal conce rns, and a greater expres sion of religious involveme nt. Fed into a Support Vector Machine, a dimension-reduced co alition of these features o ffered a 72% accuracy rate, thus toppling a nything pre -existing research within the field [23]. Lastly, Coppers mith et al . developed a Shared Task for the Computational Linguistic and Clinical P sychology (CLPsych) conference. T hrough this shared task, Coppersmith et al . distributed a standardized dataset o f depressed, Post - Traumatic Stress Disord er (PTSD), and co ntrol users to all competitors in order to normalize fundamental co mputational technologies which ofte n were at play [24]. T his shared task was distributed to se veral participants, includin g the University of Maryland [25] , the University of Pennsylvania’s World Well-Bein g Project [ 26] , t he University of Minnesota - Duluth, and MIQ [24] (a small tea m composed of Microsoft, IHMC, and Qntfy). As we work with the dataset from Coppersmith et a l [24], it i s im perative to summarize each competitor’s contributions b elow. 1) UMD utilized a supervi sed topic model appro ach to discover groupings of words that provided max imal impact to differentiate bet ween the three provided classes for each user. Further more, rather than treat e ach tweet as its own document, or treat each user as one collecti ve document, they chose to se nsibly concatenate all tweets from a given week as a si ngle document [20]. 2) The WWBP tea m utilized straightforward regressio n models with a wide variet y of features, includi ng inferring topics automatical l y, and binary unigram vecto rs (ie. “did this user ever tweet this word?”). These topic models provided varying interpretatio ns on which groups o f words belonged together, th us providing insig ht as to which approach b est expresses mental healt h-related signals [26] . 3) The team from Dulut h took a powerful approach to this by decoupling the po wer of an open -vocabulary appro ach Figure 1 show s the ROC curves fo r each particular model for each combination of classes. I n particular, University of M aryland’s approach consistently outperformed co mpetitors. 4 to simple, raw language features. Quite importantly, this open vocabulary appro ach might have bee n simplistic in nature but achieved an a verage precision in the ran ge of .70 - .76 , wh ile co mplex machine learnin g or complex weighting schemes perfor med just as well [27]. 4) The Microsoft-IHMC -Qntfy joint tea m utilized a character language model (CLMs) to determine how likely a given sequence o f characters is to b e generated by each classification cla ss, and provided a score for each string. The beaut y of this approach lied within scoring extremely short text, cap turing informa tion for creative spellings, abbreviatio ns, and other textual phenomena which derives fro m Twitter’s unique 140 -character limit [24] . Our study builds upon prio r mentioned work and contributes towards enha ncing lexical methods for text classification. With our pr esent work we: (1) further explo re the capability for individual so cial media status upd ates to be utilized as a feature in deter mining or furthering a diag nos is of depression or not; (2 ) examine, compare, and analyze t he effectiveness of several s upervised statistical models to predict text classification; and (3 ) demonstrate that we may use the se features to further the identi fication of depressive disor der s in a cohort of individuals who may otherwise have slipped under the radar. III. A I MS This study aims to establis h the feasibility of co nsistently detecting, identifying, and pur sing the diagnosis o f individuals Twitter posts, henceforth re ferred to as ‘tweets ’, Using solely these tweets, we ai m to design and implement an au tomated computational classi fier which may be able to p arallel the performance and prec ision of a concerned human i ndividual. The feasibility of this a utomated predictio ns will be cross - validated and critiqued throu gh standard P recision, Recall, and F1 scores, as w ell a s Recipient Oper ating Classification curves. The definitio n of these metrics are as follows: A. Precision Precision is the fraction of retr ieved documents that are relevant to the quer y. In our circumstances, it ans wers the question: “How man y of the users we iden tified as depressed are actually d epressed?” B. Recall Recall is the probab ility that a relevant document is retrieved by the query. Wit hin our situation, it ans wers t he question “Out of a ll of the depressed user s, how many d id we properly detect? ” C. F1 Sco re (F-Measure) An F1 score is the har monic mean of Precision and Recall; it therefore is co mmonly utilized as a clas sification evaluation metric due to weighing each metric evenly. IV. M ETHOD A. Data In this study, we gathered in formation fro m the Shared Task organizers of the C LPsych 2015 conference. This dataset was developed fro m an amalgamation of users with public Twitter accounts who posted a status update in the for m of a statement of diagnosis, s uch as “I was diagno sed with X today”, where X would represent either depr ession or PTSD [24]. For each user, up to 30 00 of their most recent public tweets were included in t he dataset, and each user was isolated from the others. It should be noted that this 300 0 tweet l imit derives from T witter’s archival polices [22] , and that most tweets concentrated long a fter a two -month timespan ma y possibly lower the effective ness of a classifier, as s hown by Tsugawa et al. [ 18] . Before releasing the dataset to participants, Copp ersmith et al. matched age a nd gender to the de mographics of the population, ultimately designing a dataset which consisted of 574 individuals (~63% o f the dataset) with no mental health condition, and 326 users (~36% of the dataset) with a mental health condition of dep ression. For the purpo ses of our research, this resulted in 1,2 53,594 do cuments (tweets) as control variables, and 742,560 docu men ts with a mental health condition of depressed. Lastly, each user, and the user s they interacted with, had been anonymized the dataset t o ensure their privac y would be protected. In additio n, Shared T ask participants were required to sign a privacy agree ment, institute security meas ures on the data, and obtain the app roval of an ethics revie w board in order to secure the dataset. Da ta had been distributed in compliance with T witter company polic y and ter ms of service. B. Features We next present a set o f attributes which can be u sed to characterize the beha vioral and linguistic differences o f the two classes – one o f which consists of t weets which exhibits behavior reflective of clinical depression. No te that these measures are on a docu ment-level i.e. r ather than treating each user as a single unit, we e xamine each tweet a s its own isolated docu ment. Therefore, our research ass umes a more granular scope, and becomes unique in nature. We utili ze a Bag of Words approach, which utilizes word occurrence freque ncies to q uantify the content o f a t weet, i.e. putting all words within a bag and measuring how commonly each w ord appeared. T sugawa et al. d emonstrated that a Bag of Wo rds app roach can be quite useful for identi fying depression, as he obtained a maximum r correlation 5 Figure 3. A visual representation o f the Bag of Words approach: w e attempt to quantify depression thro ugh an analysis of word f requencies. coefficient o f 0.43 among co mmon words [ 18]. Fig 3 d epicts some words which were more profound within the depr essed class than the control, as well as their frequencies. Many within this field decid e to normalize term frequencies based off of do cument length, howe ver, we determined no quantitative ad vantage during pr eliminary testing as the document len gth was consistent b etween tweets. By feeding these i nto our statistical model, our goal i s to quantify depression, and ultimately an estimate as to t he likelihood of depr ession within an individual. C. Classifiers We em plo y four different types of binar y classifiers in order to esti mate the likelihood of d epression within users. For each classifier, we utilize Scikit -Learn from Pedregosa e t al. to implement the learni ng algorithm [32]. W e chose to evaluate Linear, Non -Linear, and T ree-based appr oaches in order to shallowly explore foundational learning mode l s against our dataset. Ulti mately, we decided upon Decision Trees, a Linear Support Vector Classifier, a Logistic Regressive appro ach, as well as a Naïve Ba yes algorithm. In this section, we attempt to explain how these al gorithms work, as well as our imp lementation of them. Figure 4. A v isualization of a Decision Tree algorit hm evaluating whether or not to a pprove a loan for an applicant 1) Decision Trees Decision Trees are widely utilized within the Machine Learning field as they are strai ghtforward in n ature: the y simply pose a series of caref ully crafted questions in attempt s to classify the task, similar to how the popular ga me ’ 20 Questions’ works. Yet, there may be hundred s of thousands o f possible combinations for these trees, therefore we utilize H unt’s Algorith m to populate the trees [28] . Hunt’s Algorith m : With Hunt’s Algorith m [28], a d ecision tree is grown in a recursive fashion b y partitioning the training record s into successively purer (i.e . a subset of the origi nal set where all classes hold the same value). Let D t represent the set of training records which associate with node t , and y = { y 1 , y 2 , …., y c } represent the class lab els. Therefore, Hunt’s algor ithm can become a recursive ap proach towards solving de cision trees through the follo wing: Step 1: If all of the reco rds in D t belong to the same cla ss y t , we address t as a lea f node, and lab el it y t . Step 2: If D t contains record s which belong to more than o ne class, we create an a ttribute test cond ition in or der to partition the records into smaller sub sets. We crea te a child node for each of these outcomes, a nd therefore distribute all o f the records in D t to the children based off of the outcomes. We then apply the algorithm recur sively to the child node. Figure 2 de m onstra tes abnormally high w ord o ccurrences w ithin the depressed class. 6 Figure 5. Visualizat ion of a Support Vector Machine: if the white and black dots repre sent the cla sses, H 1 does not separate the cla sses, H 2 minimally separat es the classes, and H 3 maximally separa tes the classes. 2) Support Vector Machine Clas sifiers A Support Vector Machine (SVM) constructs a hyperplane, or a set thereof within a high -dimensional sp ace, which can be utilized for class ification [29]. W e use a Linear SVM , which sim p ly means we utilize a strai ght line to differentiate the white do ts from the black ones. Algorithmically: Provided a training dataset of n points of form ( X 1 , Y 1 ), ….., (X n , Y n ), where Y i is either 1 or -1, indicating each possible class of whic h the point X i may belong. Each X i is a p -dimensional real vector, where we desire to d etermine the “maximum - margi n hyperplane” which divides the group of points X i for which Y i = 1 from the points for which Y i = -1, such that the distance bet ween the hyperplane and the nearest point X i from either group is maxi mized. We define our hyperplane as a set of points satisfying • – B = 0, where is the normal vector to the hyperplane. The par ameter deter mines the offset of the hyperplane from the origi n along normal vector . 3) Logistic Regression Developed by Cox et al . in 1958, Logistic Regression is a binary logistic model used to estimate the p robability of a binary response based one or more predictors (in our case, features) [30 ]. While it may technicall y not qualify as a classification method, it r epresents a discrete c hoice model, and we therefore use it as s uch. Figure 6. Our standard Logistic Functio n σ(t); the steeper the curve, the more difficult a diagno sis of depressed can be. Therefore, w e aim to modify this curve to opti mize for accuracy in diag nosis We define the relations hip between our binary depende nt variable and our features t hrough eq uation (1). (1) In (1), β 0 + β 1 x represents the par ameters of best fit for the success case, hence ‘depression’. Therefore, F(x) rep resents the probability of the depende nt variable t equaling the depressed case, and inherits a non-dep ressed bias (i.e. all tex t is of the control case, unles s significant d ata has been pr ovided to prove other wis e) . 4) Naïve Bayes A Naïve Bayes classifier i s one of the simplest available within the Machine Learni ng field, yet is still co mpetitive with Support Vector Ma chines, and likes thereof [31]. B ased off of the popular Bayes’ theore m from statistics, it relie s upon an underlying assumptio n that each feature is independen t of another, thus vastly si mplifying the computational s pace. For example, a fruit may be clas sified as an apple if it is red, round, and roughly 10 centimeter s in diameter. Under the independence assumptio n of the Naïve Bayes al gorithm, these features would be independen t of each other, regard less of any possible corr elation between size, shape, and color of a fruit [31]. We apply a Multino mial approach to the Naïve Ba yes algorithm. Equations (2) and (3 ) detail the Naïve Ba yes algorithm, while equatio n (4) details our multinomial approach to Bayes’ theore m. (2) (3) 7 (4) V. R ESULTS In this section, w e i nvestigate and d iscuss the degree of accuracy to which the p resence of active dep ression within a body of text may be ascertai ned fro m th e features extracted from our user’s linguistic hist ory. Classifiers were co nstructed by Machine Learning as d etailed in Section 5.3 for estimating the presence of active depr ession, and we utilized a 6-fold cross-validation to veri fy our results. We utilize precisio n, recall, F-measures, and accuracy of the estimatio n as indices to evaluate depressio n accuracy, as detailed within Section 4. Lastly, we develop and exa mine Receiver Operating Characteristic curves to p rovide an illustration as to t he performance of a binary clas sifier system over vario us discrimination thresholds. Table 3 sho ws the acc uracy as to which our constructed classifiers were able to discern the class of a s mall bo dy of text. The classificatio n accuracies are the avera ge values given by 6-fold cross -validation, and our input was the 846,496 dimensional feature space provided by the Bag of Word s approach we used to vectorize the tweet. In imple mentation, we used employed a CountVectorizer with default settings from Scikit-Learn de veloped by Pedregosa et al [3 2]. Table 3 will depict the single sce nario in which we anal yzed the use of bigrams (ie. frequencies of word couplings, as oppo sed to singular words) in our classi fiers, albeit to no success. As Twitter has implemented a 1 40-character li mit upon their status updates, we found that unigrams were able to capture a significant amount o f data present; additionall y, a negligible advantage in classificatio n accuracy did simply not outweigh additional co mputational resources required for a bigram - based approach [33] . Furthermore, T able 3 demonstrates that the presence o f active depression within textual b odies may be most accuratel y estimated with 86% accurac y for a unigram -based Naï ve Bayes approac h. As Section 5.3.4 detailed , a multinomial approach to Bayes’ theore m brought a simple Naïve Ba yes classification algorith m up to the likes of Support Vec tor Machines (SVMs). Neve rtheless, while our Naïve Bayes may have produced the best accura cy, it fell behind o ther models in respect to prec ision, recall, and F -measure (scoring a 0.81, 0.82, and 0.81 resp ectively). In particular, our Naïve Ba yes classifier fell short to Logistic Regression i n our classification tas k. While our Naïve Bayes approac h may have attained a prec ision and F -measure score of 0.81 , a Logistic Regression model scored a precision score of 0.86 , and outperformed any other classi fier with an F1 -score of 0.84 . A Linear SVM attained the highest recall score (0.83) o ut of all, but fell behind in precision (0 .83) and accuracy (0.82) (5) In order to quantitatively measure the performance of a classifier’s ROC curve, we investigate its Area under Curve (AUC) metric. As an i ntegral is the de- facto method to easil y measure an area under the cur ve for a function, we develop equation (5) to evaluate eac h classifier’s performance [34 ] . We found that a Naïve Ba yes appro ach scored the highest out of all our classifiers with a ROC AUC score of 0.94 (Fig. 7) . Logistic Regression sco red second, with a 0.91, trailing behind were Linear SVMs (0.8 0), Ridge Classifiers (0.74), and a Decision Tree (0 .64). An ROC AUC score o f 0.50 is essentially guessing, a nd an ROC AUC score o f 1 is considered per fect [34] . Classification Al gorithm Precision Recall F1 -Score Accuracy Samples Decision Tre es 0.67 0.68 0.75 0.67 332421 Linear Support V ector Classifier 0.83 0.83 0.83 0.82 332421 Naïve Bayes w/ 2-grams 0.82 0.82 0.82 0.82 332421 Logistic Regression 0.86 0.82 0.84 0.82 332421 Naïve Bayes w / 1-gram 0.81 0.82 0.81 0.86 332421 Ridge Classifi er 0.81 0.79 0.78 0.79 332421 Table 1: Our gener ated classification repo rt from various m odels; bo lded text demonstra tes the winner in t hat category. Figure 7 show s Receiver Operating Cha racteristic (ROC) curves for o ur various training models. 8 At this point, in order to select a preferred model for further research and po tential industrial applicatio ns, we must ascertain as to what we desire from our classi fier. We defined our measures for a n ideal classifier to detect d epression as the following: (1) If prioritization is necessar y, we believe in an overbearing approac h over an underbearing one, as our research deals with the potent ial identification o f depression rather than treatment. We aim for a co ntrol-biased model, and therefore prioritize rec all over precision. In lay terms, we emphasize the ability to identi fying most depressed individuals at the risk of iden tifying a few false po sitives. (2) We prioritize accurac y over an F1 -score: a model which identifies dep ression well is more importa nt than one which beco mes unreliable through a myriad o f false positives. (2.1) As a subset of (2), we evaluate ROC curves alongside accurac y. (3) Computational resources a nd time are to be considered, esp ecially if coupled with a decentralized application. If (1) is to be heeded , a Linear Support Vector Ma chine would be preferred over all other applications. Yet, (2 ) prioritizes accurac y over an F-measure, th us reinforcing a Naïve Bayes approach to our classificatio n task. A Naïve Bayes approac h attained an average of an 86% acc uracy, and consistently perfor med four points ahead of any other classifier. (2.1) solidifies our choice: a multinomial app roach towards a Naïve Ba yes classifier is to be explo red for further research, as well as potent ial industrial applicatio ns. VI. C ONCLUSIONS AN D FUTURE WORK We have demonstrated the po tential of using t witter as a tool for measuring and pred icting major dep ressive disorder in individuals. First, we compiled a dataset in conjunction with Johns Hopkins Universit y from public self -professions ab out depression. Next, we pr oposed a B ag of Words approach towards quantifying this datas et, and created an 8 46,496 dimensional feature space as our input vector. Finall y, we leveraged these distin guishing attributes to build, co mpare, and contrast several stat istical classifiers which may predict the likelihood o f depression within an individual. Our aim was to establish a method by which recognition of depression through analysis of large - scale records o f user’s linguistic history in social media may be possible, and we yielded promising results with an 86% classificatio n accuracy. The following specific result s were obtained: a multinomial approach to the Naïve B ayes’ alg or ithm yielded an A- grade ROC AUC score of 0.9 4, a precision score of 0.8 2, and an 86% accurac y; a Bag of Words appro ach was determined to be a useful feature set, and we deter mined bigrams to present no significant advantage o ver a unigram-ba sed appro ach. Among future directions, we hope to understand how spatiotemporal behavior may lead to the develop ment of Major Depressive Disorder . The ability to estimate, extrapolate, and interpret daily variations in depression may prove itself as a useful too l for identifyi ng depression prior to mild onset, and therefore expand its potential to save li ves. Determining techniques that may be used in a medical context to identify clinical dep ression from the behavior o f social media users’ is an important t ask to benef it the populous. VII. A CKNOWLEDGEMENT S This research paper was made possible through the help and support fro m everyone, including parents, teac hers, family, friends, and in esse nce: all sentient bei ngs. However, please allow me to especiall y dedicate my ackno wledgeme nt of gratitude towards the follo wing significant advisors and contributors. First and fore most, I would like to thank Mr. Mike Ho rn for his support and encoura gement. He has p ushed me along throughout this process, s upported my various undertakin gs, and has fully revolutionized my senior year in high school. From the bottom of my heart, thank you Mr. Hor n. Secondly, I would like to thank Mr. Glen Copper smith of Johns Hopkins Universit y, as well as Mr. W ill Jack of the Massachusetts Institute o f Technolog y. Mr. Coppersmith has shared with me his dataset, t hus making the entire pap er possible, as well as pro vided invaluable insight, g uidance, and support in a time of dire need. Mr. Jack has pro vided a tender hand during late hours, and helped me unde rstand various Machine Learning principle s which other wise were alien to me. I began this paper q uite clueless about the real m of Machine Learning tech nologies, but as a result of Mr. Coppersmith’s and Mr. J ack’s guidance, have not o nly been able to survive but also t hrive. Finally, I would like to tha nk Dr. Sandip Sen at the University of Tulsa. He too k my young, frankly naïve mind in, and fostered a level of curiosit y which brought me here. Dr . Sen opened my mind to the re alm of computatio nal sciences, and I would not be where I am today without him. I sincerely thank my mentors, parents, family, and frie nds who have advised and pushed me forward throug hout this endeavor. The p roduct of this research paper would not be possible without all of t hem. R EFERENCES [1] US Burden of Disease Collaborators, “The sta te of US health, 1990 - 2010: b urden of di seases, injuries, and risk factors.,” JAMA , vol. 310, no. 6, pp. 591 – 608, 2013. [2] US Census Bureau, “Census 2 010,” US Census Bureau , 2010. [Online]. Available: http://quickfacts.census.go v/qfd/states/13/ 13135.html. [3] L. A. Pratt and D. J. Brody, “Depression in the U.S. Household Population, 20 09 - 201 2.,” NCHS Data Bri ef , no. 17 2, pp. 1 – 8, 2014. [4] L. A ndrade, J. J. Caraveo-Anduaga, P. Berglund, R. V. Bijl, R. De Graaf, W . Volle bergh, E. Dragomirecka, R . K ohn, M. K eller, R. C. Kessler, N. Kawakami, C. Kili??, D . Offord, T. B. Ustun, and H. U. Wittchen, “The epid emiolo gy of major depre ssive episodes: Resul ts from the Inter nati onal Consortium of Psychiatric Epidemiol ogy (ICPE) Surveys,” Int. J. M ethods Psychiatr. Res. , vol. 12, no. 1, pp. 3 – 21, 2 003. [5] M. Hew itt an d J. H. Rowl and, “Mental health serv ice use among adult cancer survivors: A nalyses of the Nat ional Health Interv iew Survey,” J . Clin. Oncol. , vol . 20, no. 23, pp. 4581 – 45 90, 2002. [6] D. Michelson, C. Stratakis, L. Hill, J. R ey nolds, E. Galliven, G. Chrousos, and P. Gold, “Bone Mineral Density in Women with Depression,” N. En gl. J. Med. , vol. 335, no. 16, pp. 1176 – 1181, 199 6. [7] S. E. Chance, S. L. Reviere, J. H. R oger s, M. E. James, S. Jessee, L. Rojas, C . A. Hatcher, and N. J. K aslow , “An empirical study of th e psychodynami cs of suicide: A p reliminary report,” Depression , vol. 4, no. 2, pp. 89 – 91, 1996. 9 [8] R. S. Lev ine, I. G oldzweig, B. K ilbourne , and P. Juarez, “Firearms, youth homicide, and p ublic health.,” J. Health Care P oor Un derserved , vol. 23, no. 1, pp. 7 – 19, 2012. [9] R. C. W. Hall, D. E. Platt, and R. C. W. Hall, “Suicide risk assessment: A review of risk factors for suicide in 100 p atients who made severe suicide attempts: Evaluation of suic ide risk in a t ime of managed care,” Psychosom. J. Consult. Liaison Psychiatry , vol. 40, no. 1 , pp. 18 – 27, 1999. [10] J. J. Mann, A . Apter, J. Bertolote, A. Beautrais, D. C urrier, A. Haas, U. Hegerl , J. Lonnqvist, K. Malone, A. Marusic, L. Mehlum, G. Patton, M. Phillips, W. Rutz, Z . Rihmer, A. Schmidtke, D. Shaffer, M. Silverman, Y. Takahashi, A. Varnik, D. Wasserman, P. Yip, and H. Hendin, “Suicide p reve ntion strategies: a s ystematic review.,” JAMA , vol. 294, no. 16, pp. 206 4 – 2074, 2005. [11] R. Detels, The scope and concerns of public health . Oxford University Press, 2009. [12] L. Radloff , “The CED -D scale: a self-report d epression scale for research i n the general population.,” Appl. Psychol. Meas. , vol. 1, no. 3, pp. 385 – 401, 197 7. [13] A. T. Beck, C . H. W ard, M. Mendelson, J. Mock, and J. Erbaugh, “An inventory for measurin g d epressio n,” Arch. Ge n. Psych iatry , vol. 4, no. 6, pp. 561 – 571, 1 961. [14] W. W. Zung, C. B. R ichards, and M . J. Short, “Self -rating depression sca le in an outpatient c linic. Further validation of the SDS.,” Arc h. Gen. Psychiatry , vol . 13, no. 6, pp. 508 – 515, 1 965. [15] M. Marcus, M. T. Yasamy, M. van Ommere n, and D. Chisholm, “Depre ssion, a global publ ic health co ncern,” WHO Department o f Mental Health and Substance A buse , 2012. [Online]. Av ailable: http://www .who.int/mental_healt h/management/depre ssion/who_paper_ depression_w fmh_2012.pdf. [16] B. G. Tiemens, J. Ormel, J. a Jenner, K. van d er Meer , T. W. Van Os, R. H. van den Brink, a Smit, and W. van den Brin k, “Training primary - care physicians to recognize, diagnose and manage d epression: does it improve patient outcomes?,” Psychol. Med. , vol. 29, no. 4, pp. 833 – 845, 1999. [17] M. Siny or, A. Schaffer, and A . Levitt, “The Se quenced Treatme nt Alternatives to Reliev e Depression (STAR*D) trial: A review,” Canadian Jour nal of Psychiatry , vol. 55, no. 3. pp. 126 – 135, 20 10. [18] S. Tsugawa, Y. Kikuchi, F . Kishino, K. Nakajima, Y. Itoh, and H. Ohsaki, “Recognizing De pression from Twitter Activity,” in Proceedings of the 33rd Annual ACM Conference on Human Factors in Computing Sys tems - CHI ’15 , 2015, pp. 3187 – 3196. [19] K. Pajer, B. M. Andrus, W. Gardner, a Lourie, B . Strange, J. Campo, J. Bridge, K. Blizinsky, K. Dennis, P. Vedell, G. a Ch urchill , and E. E. Redei, “ Discovery of blo od transcr iptomic m arkers f or depre ssion i n animal models and pi lot validation in subjects with early-onset maj or depression,” Tr ansl. Psychiatry , vol. 2, no. 4, p. e101, 2012. [20] P. Resnik, A. Garr on, and R. Resnik, “U sing Topic Modeling to I mprove Predictio n of Ne uroticism and Depression in College Students,” in Proceedings of the 2013 Conference on Empirical Methods in Natural Language Proce ssing (EMNLP) , 2013, no. O ctober, pp. 1348 – 1353. [21] M. A. Mor eno, L . A. Jelenchick, K. G. Egan, E. Cox, H. Young, K . E. G annon, and T. Be cker, “Feel ing bad on Facebook: depre ssion disclosures b y college stu dents on a social networ kin g site,” Depress. Anxiety , vol. 28, no. 6, pp. 447 – 455, J un. 2011. [22] S. Tsugawa, Y. Mogi, Y. Kikuchi, F. Kishino, K. Fujita, Y. Itoh, and H. Ohsak i, “On estimating depressive tendencies of Twitter users u tilizing their twee t data,” in Proceedings - IEEE V irtual Reality , 2013. [23] M. De Choudhury, M. Gamon, S. Counts, and E. Horvitz, “Predicting Depression via Social Media,” Seventh Int. AAAI Conf. Weblogs Soc. Media , vol. 2, pp. 128 – 137, 2013. [24] G. C. Qntfy, M . Dredze, C. H arman, K. Hollingshead Ihmc, and M. Mitchell , “CLPsych 2015 Shared Task: De pression and PTSD on Twitter,” pp. 31– 39, 2015. [25] P. Resnik, W. Armstro ng, L. Claudino, and T. Nguyen, “The Unive rsity of Ma ryland CLPsych 2015 Shared Task System,” n o. c , pp. 54– 60, 2015. [26] D. Preot, M. S ap, H. A. Sch wartz, an d L. Ungar, “Mental Illness Detection at the W orld Well-Being Project for the CLPsych 2015 Shared Task,” pp. 40– 45, 2015. [27] T. Pedersen, “Screenin g Twitter Use rs for Depression and PTSD with Lexical Decision Lists,” pp. 46– 53, 2 015. [28] C. Kingsford a nd S. L . Salzbe rg, “What are decision tre es?,” Nat. Biotechnol. , vol . 26, no. 9, pp. 1011 – 3, 2 008. [29] W. S. Noble, “What is a su pport vector mac hine?,” Nat. Biotechnol. , vol. 24, no. 12, pp. 1565 – 1567, 2006. [30] S. L. Gortmaker, D. W. Hosme r, and S. Lemeshow , “Applied L ogistic Regressio n.,” Contemporary Sociolog y , vol. 23, no. 1. p. 159, 1994. [31] I. Rish, “A n empirical study of the naive Baye s classifier,” IJCAI 2001 Work. Empir. met hods Artif. Intell. , v ol. 22230, pp. 41 – 46, 2001. [32] F. Pedregosa, G. Varoquaux, A. Gramfort, V. Michel, B. Thirion, O. Grisel, M. Blondel, P. Prettenhof er, R. We iss, V. Dubourg , J. Vanderplas, A. Passos, D. C ourna peau, M. Brucher, M. Perrot, a nd É. Duchesnay, “Scikit - learn: Machine Learning in Python,” … Mach. Learn. … , vol . 12, pp. 2825 – 2830, 2012. [33] B . O’Dea, S. Wan, P. J. Batterham , A. L . Calear, C. Paris, and H. Christensen, “ Detecting suicidality o n Twitter,” Internet Interv. , vol. 2 , no. 2, pp. 183 – 188, May 2015. [34] C. D. Brown and H. T. Davis, “Receiv er operating characteristics curves and related decision measures: A tutorial,” Chemom. Intell. Lab. S yst. , vol. 80, no. 1, pp. 24 – 38, 2006.
Original Paper
Loading high-quality paper...
Comments & Academic Discussion
Loading comments...
Leave a Comment