Multi-View Treelet Transform
Current multi-view factorization methods make assumptions that are not acceptable for many kinds of data, and in particular, for graphical data with hierarchical structure. At the same time, current hierarchical methods work only in the single-view s…
Authors: Brian A. Mitchell, Linda R. Petzold
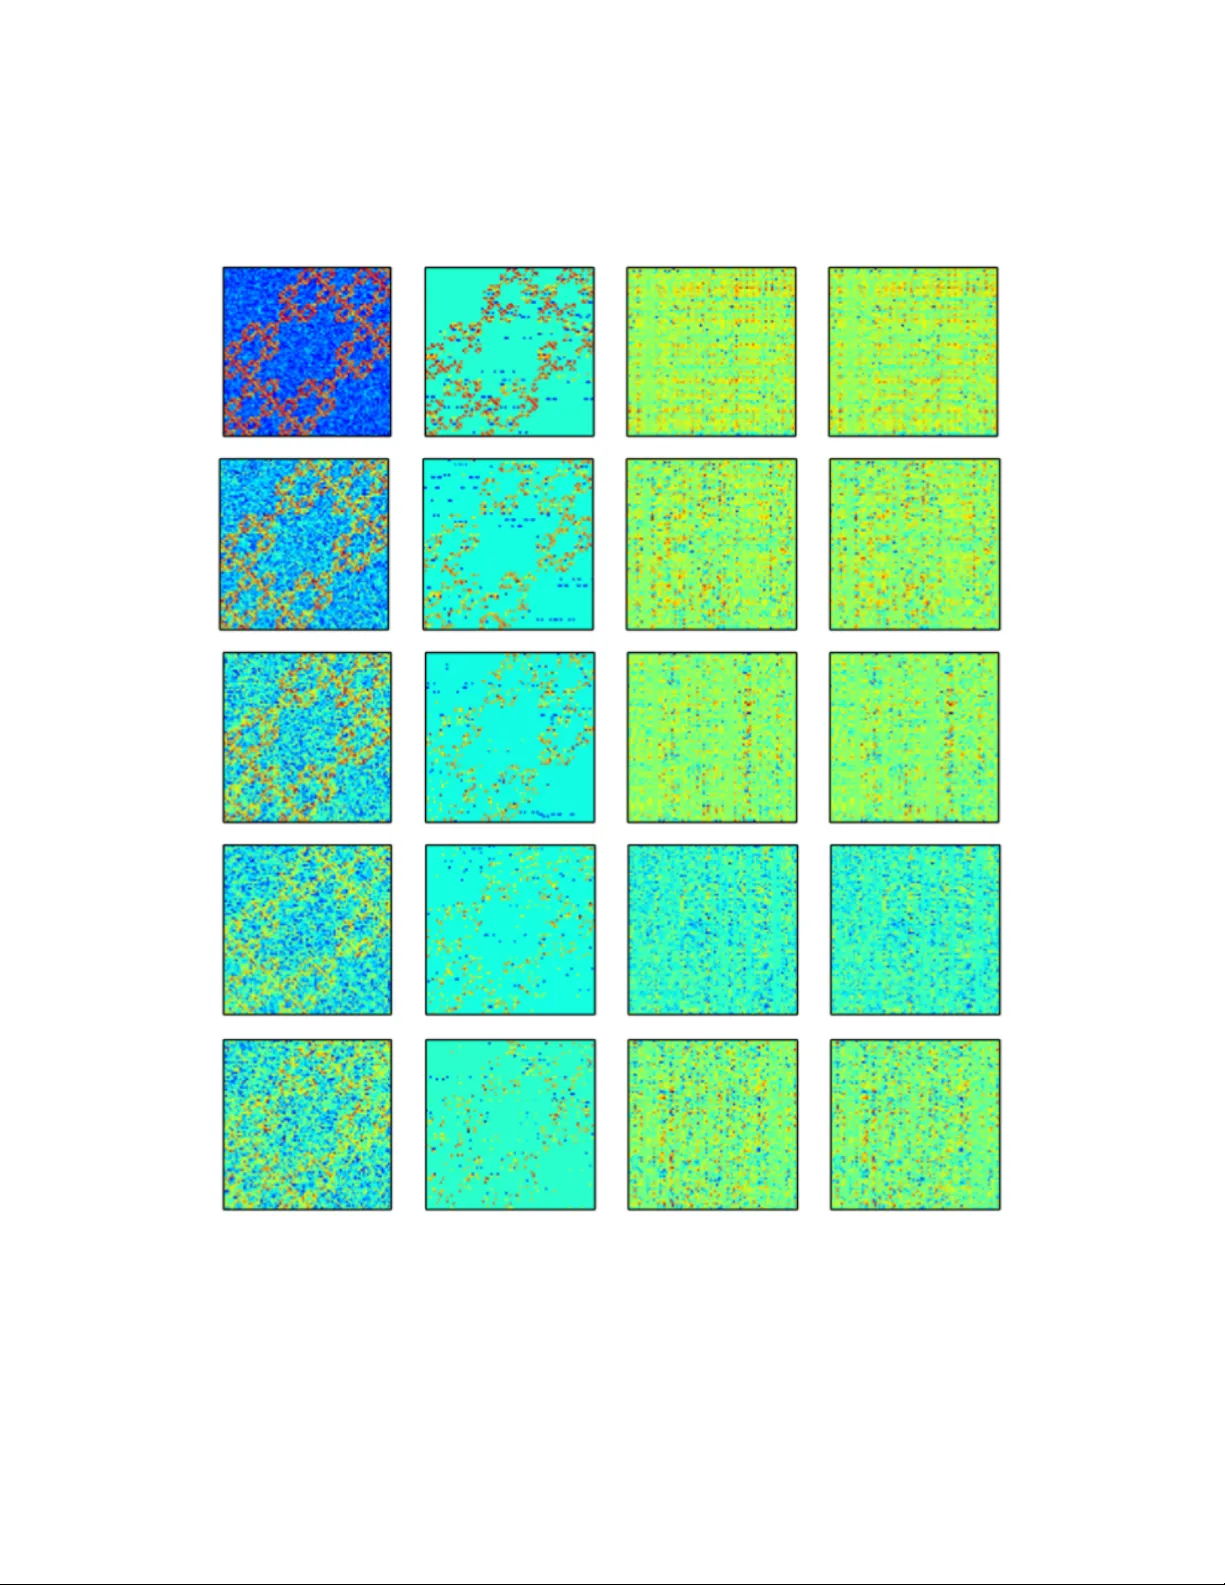
Multi-View T reelet T ransform Brian A. Mitc hell Departmen t of Computer Science Univ ersity of California at Santa Barbara San ta Barbara, CA 93106 brian_a_mitchell@cs.ucsb.edu Linda R. P etzold Departmen t of Computer Science Departmen t of Mechanical Engineering Univ ersity of California at Santa Barbara San ta Barbara, CA 93106 petzold@cs.ucsb.edu Abstract Curren t multi-view factorization metho ds make assumptions that are not acceptable for many kinds of data, and in particular, for graphical data with hierarc hical structure. A t the same time, current hierarchical metho ds w ork only in the single-view setting. W e generalize the T reelet T ransform to the Multi-View T reelet T ransform (MVTT) to allo w for the capture of hierarc hical structure when multiple views are av ailable. F urther, we sho w ho w this generalization is consistent with the existing theory and ho w it migh t b e used in denoising empirical netw orks and in computing the shared resp onse of functional brain data. 1 In tro duction Muc h of the fo cus of mo dern machine learning and data analysis inv olv es the collection and analysis of data from m ultiple p ersp ectives, or views, of the same phenomenon. In every application there is a common desire to b etter understand the mathematical structure of this phenomenon. One approach to quan tifying this structure is to jointly factorize the data matrices, where success is often measured by the total reconstruction error across all views: Error = M X i =1 || A i − F i || + R. Here, || · || is some matrix norm, F i is the reconstruction of A i after factorization, R is a regularizer, and M is the total n um ber of views. There are effectiv ely tw o approaches to capturing consensus structure in m ulti-view factorization: construction of a common basis or construction of a common co efficient matrix. The fundamen tal assumption for the former is that all views b elong to the same space, whereas for the latter, the assumption is that the relativ e imp ortance of the basis vectors is inv arian t across views. Though our metho d is not strictly a matrix factorization as w e do not minimize an ob jective of the form given abov e, we compute a common basis across all views. A frequently made assumption when computing suc h a basis is that the data matrices being factorized are lo w-rank [ 19 ]. When trying to capture structure in systems where suc h an assumption do es not hold, these factorization metho ds do p o orly . Several metho ds [ 12 , 6 , 20 ] hav e b een prop osed recently that allow for a differen t assumption to be made in computing a basis for some dataset, namely , that the data ha ve a hierarc hical structure. W e generalize one of these metho ds, the T reelet T ransform, to the multi-view setting and provide a discussion on the theoretical issues raised by this generalization. While our metho d can b e applied to collections of asymmetric or non-square data matrices, we fo cus on its application to collections of symmetric matrices, namely , adjacency matrices of graphs. W e show ho w the Multi-View T reelet T ransform (MVTT) outp erforms low-rank metho ds and the single view T reelet T ransform in capturing the hierarchical structure of a synthetic dataset. F urther, we giv e an example of how our metho d can reduce dep endence on ad-ho c denoising metho ds. Finally , w e demonstrate its excellen t p erformance on an fMRI shared response problem when compared with existing metho ds. 2 Related w ork The main contribution of this w ork is a generalization of the metho ds used to compute hierarc hical bases, sp ecifically , the T reelet T ransform. F or this, we draw heavily from [ 20 ]. As [ 20 ] is similar in its goals and approach to [ 12 , 6 ], we hav e also drawn from these works. Sp ecifically , the authors in [ 20 ] ha v e dev elop ed a metho d for computing a sparse, hierarc hical basis. W e hav e found that the p erformance of these metho ds can b e improv ed in the setting where multiple views of some phenomenon are av ailable. In generalizing the work of [ 20 ], w e compute a consensus representation across views in the form of a single basis. Other w orks inv olve computing a common basis in the multi-view setting, but there are none that exploit the hierarchical structure of the data. In [ 19 ], the data is assumed to ha ve a low-rank structure; the algorithms prop osed in [ 2 , 16 , 9 , 4 ] all place constrain ts on the basis that can b e computed, though none explicitly compute a single basis. A num b er of metho ds exist that compute a co efficient matrix as their consensus representation. Many of these metho ds are a form of Multi-View Non-Negativ e Matrix F actorization [ 18 , 13 , 7 , 14 ]. A similar approach is tak en in computational neuroscience under the lab el of the Shared Resp onse Mo del (SRM) [ 17 ]. In this mo del, a multi-view matrix factorization, assuming low-rank data, is computed with a consensus co efficient matrix. 3 T reelet T ransform The T reelet T ransform is presented in [ 20 ] as a sequence of lo cal PCA’s. With eac h iteration of the algorithm, t w o similar columns are rotated to create a normalized “sum” column and a normalized “difference” column. The difference column is excluded from further iterations, and as suc h, increasingly abstract, smo oth represen tations are computed ov er the data with subsequen t iterations. The construction of these increasingly smo oth representations gives rise to the interpretation of this algorithm as inducing a hierarchical clustering on the data. The complete algorithm is shown in Algorithm 1. Figure 1: Sho wn is an example of one iteration of the T reelet T ransform algorithm once tw o similar sum columns, u and v are found. A rotation, J is computed and then applied to the data matrix at iteration (i.e. hierarc hical level) l − 1 that rotates these tw o columns into s (a new sum column) and d (a new difference column). 2 Algorithm 1 1: pro cedure TreeletTransform ( X , L ) 2: Compute the cov ariance, Σ 1 , and correlation co efficient matrices, ρ 1 , from X 3: l ← 1 , S ← { 1 , ..., M } , B 1 ← I 4: while l < L do 5: ( j, k ) = argmax ( j,k ) ρ [ j, k ] 6: Compute J suc h that J T Σ l J [ j, k ] = J T Σ l J [ k , j ] = 0 7: Drop column j from S 8: B l +1 ← B l J 9: Σ l +1 ← J T Σ l J 10: X l +1 ← J T X l 11: ρ l +1 ← J T ρ l 12: l + + 13: return B L Of note is the problem of selecting the parameter L , that is, the n um ber of rotations to p erform, which is equal to the height of the hierarchical tree. In [ 20 ] it is suggested to use the b est K-basis metho d, whic h raises the issue of selecting K . W e tak e a differen t approach: w e prop ose a metho d for learning K based on the data while lea ving L as a parameter. This choice is based on the applications demonstrated in this pap er, the data for which all ha ve about the same hierarc hical depth. W e fix L = p/ 2 for all exp eriments, based on the empirical p erformance of this v alue. With regard to our metho d for learning K , w e defer discussion of this issue until the exp erimental section. 4 Multi-View T reelet T ransform T o understand our generalization of the T reelet T ransform to the m ulti-view setting, it is imp ortan t to first make the connection b etw een the T reelet T ransform and matrix factor- ization, as is done in [ 12 , 15 ]. Each step of the T reelet T ransform attempts to reduce the ob jectiv e off ( J T Σ l − 1 J ) as muc h as p ossible, by zeroing the largest off-diagonal element of Σ l − 1 . Here, l is the level of the hierarchical clustering and off ( · ) is the off-diagonal norm: off ( A ) = P j 6 = k A 2 j,k . This is exactly the approach taken in the Jacobi diagonalization algo- rithm, where this iteration is taken to conv ergence. In the multi-view setting, it is not p ossible to zero the largest off diagonal elemen t of Σ l − 1 i , for all 1 ≤ i ≤ M , with a single rotation J . Instead,w e find a J that reduces a new ob jective, P M i off ( J T Σ l − 1 i J ) , as muc h as possible, on eac h iteration. This new ob jective is minimized in Joint Jacobi Diagonalization [ 3 ] where the goal is to find a single basis consisting of a pro duct of Jacobi rotations that diagonalizes a giv en collection of matrices. W e use this algorithm for computing joint rotations in MVTT. T o compute J in the multi-view setting, w e must first find the tw o most similar columns across all views. Thus w e m ust compute ( i, j, k ) = argmax ( i,j,k ) ,j ∈{ 1 ,...,M } [ ρ 1 [ j, k ] , ..., ρ M [ j, k ]] . where Σ i is the cov ariance matrix of the i ’th view and ρ i [ j, k ] is the correlation co efficien t, Σ i [ j,k ] √ Σ i [ j,j ]Σ i [ k,k ] . Giv en the j ’th and k ’th columns, the question remains as to the c hoice of the rotation angle that will appropriately rotate them in eac h view. The approach taken by the authors of [ 3 ], is to minimize P M i off ( J T Σ l − 1 i J ) by finding a simultaneous diagonalization of all Σ l − 1 i . They note that this ob jective is minimized if we pick c = r x + r 2 r , s = s y − iz 2 r ( x + r ) , r = p x 2 + y 2 + z 2 , where [ x, y , z ] T is an eigenv ector asso ciated with the largest eigenv alue of 3 G = M X i h (Σ l − 1 i ) h (Σ l − 1 i ) T , and h is given by h (Σ l − 1 i ) = [Σ l − 1 i [ j, j ] − Σ l − 1 i [ k , k ] , Σ l − 1 i [ j, k ] + Σ l − 1 i [ k , j ]] . The required rotation matrix J is then equal to the identit y except for the following submatrix: J [ j, j ] J [ j, k ] J [ k , j ] J [ k , k ] = c − s s c . With the rotation matrices computed in this manner, we compute a T reelet T ransform for m ulti-view data. 5 Theoretical prop erties Theoretical results are difficult to deriv e for this metho d. The consistency arguments used by the authors of [ 20 ] in Theorem 1 rely on the fact that the T reelet T ransform is a contin uous function of the sample cov ariance matrix. This is not the case for MVTT, as the eigen v ectors of the sample cov ariance matrix are not contin uous functions of it, th us the joint rotations computed in eac h step of MVTT are not con tinuous functions of the sample co v ariance. As MVTT breaks the analytical notion of consistency as defined by the authors of [ 20 ], it also breaks their analytical estimates of conv ergence. W e th us resort to numerical results to demonstrate theoretical prop erties such as conv ergence. Note that in this section, when we discuss conv ergence, we mean conv ergence in the mean. That is, for a sequence of random v ariables { X n } and the exp ectation op erator, E, this sequence conv erges to X in the mean if lim n →∞ E ( | X n − X | ) = 0 . 5.1 Synthetic data In this section, w e construct synthetic datasets using the Kroneck er Graph mo del. The Kronec ker Graph is a hierarc hical graph with self-similar structure and has b een used to mo del the time evolution of empirical graphs [ 11 ]. W e generate a Kroneck er Graph of depth three, G K , by taking a 3x3 initiator matrix and raising it to the third Kroneck er p ow er. The k ’th Kroneck er p ow er of a matrix is the Kroneck er pro duct of this matrix with itself k times. Then, assuming Gaussian, additive noise, we compute new edge weigh ts for G K as follows: w n ( j, k ) = w t ( j, k ) + N (0 , 1) , where w t is the true edge weigh t, w n is the noisy edge weigh t, N (0 , 1) is the Gaussian distribution of mean 0 and standard deviation 1, and is the noise level. 5.2 Conv ergence One of the motiv ations for this work w as to find a metho d capable of disco vering the structure of the true cov ariance matrix in the case where the size of our sample cov ariance matrices is fixed (e.g. our data is a graph with a fixed num ber of no des). In this case, we would like to show that the MVTT of the sample cov ariances is an increasingly go o d estimate of the T reelet T ransform of the true cov ariance for large M . More formally , where T l is the T reelet T ransform op erator for L = l , M T l is the MVTT op erator for L = l , ˆ Σ i is the i ’th sample co v ariance matrix, and Σ is the true co v ariance matrix, we measure the error as 4 E M = || 1 M M X i M T l ( ˆ Σ i ) ! − T l (Σ) || 2 F . Ideally , E M w ould conv erge to 0 as M → ∞ . This would imply that for large M , our metho d is consistent and that we are able to completely recov er all information lost to noise with the MVTT. As shown in Figure 2, MVTT is not capable of completely recov ering the true T reelet T ransform from noisy cov ariance matrices and as M → ∞ , E M con verges to some small num b er. Figure 2: The first three plots demonstrate conv ergence of E M for v arious M and . The final plot demonstrates that the rate of conv ergence of MVTT is appro ximately a linear function of the noise level. T o numerically demonstrate conv ergence of E M , w e p erformed b o otstrap resampling. F or a fixed noise level, B , and a fixed num ber of views, M B , we generated 20 collections of M B graphs, each with noise level B . F or each collection, w e computed E M , then av eraged this error across all collections for a fixed B and M B . The results of this test are given in Figure 2. Of note is the effect of the v alue of M on the v alue of E M for a given . Increasing v alues of M ha ve a greater effect on reducing the error for higher noise lev els. Thus one of the strengths of MVTT as opp osed to the single view T reelet T ransform is in finding hierarchical structure in data with high noise levels. As E M app ears to b e an exp onential function of M , we also estimated the rate of conv ergence as the rate of decay of this exp onential function. These results are also given in Figure 2 and expanded up on in the Supplemen t. Here w e will simply p oint out that the rate of con vergence is a decreasing function of the noise level, showing that MVTT conv erges faster for higher noise lev els. This prop erty may b e quite v aluable in cases where the noise lev el is high, but additional views are difficult to obtain. 5 6 Exp erimen ts 6.1 Denoising via basis co efficien t thresholding T o illustrate the ability of MVTT to capture consensus structure, we first show ho w it can b e used to remov e noise from data. As in wa v elet signal pro cessing, we can remov e certain kinds of noise from our data by thresholding insignificant basis co efficien ts. Giv en the following represen tation of each N elemen t data p oin t, X j , in the N x N matrix X : X j = N X k c k τ k , where τ k is the k ’th basis vector and c k is the k ’th basis co efficien t. The denoising problem can b e defined as follows: w e wan t to find some threshold, T , such that || X t − X d || 2 F , where || · || F is the F robenius norm, X t is the true data matrix, and X d is the denoised data matrix, is as small as p ossible. In the synthetic case, we can compute this v alue directly , and so we can directly optimize it in computing T . But in the exp erimental setting, we likely will not kno w the v alue of X t , so finding T becomes more complex. Similar to the work in [ 8 ], w e use a hypothesis test to assign a p-v alue to each co efficient. Then, accepting a F alse Disco very Rate (FDR) as a parameter, we find a threshold for the basis co efficients. Specifically , consider the following tw o-tailed hypothesis test: H 0 : c k = 0 H A : c k 6 = 0 Assuming all c k are drawn from a Gaussian distribution cen tered at 0 with v ariance given b y the v ariance of all c k , we then hav e a metho d for directly computing a p-v alue, p k , for eac h c k . Sorting the collection of all p k , the FDR p f is the largest p k for whic h the null h yp othesis is not rejected. W e then use the corresponding c f as a hard threshold for the basis co efficients. 6.1.1 Synthetic data Using the noisy Kroneck er Graph model describ ed ab ov e, we test our thresholding approach on noise lev els in [0 , 0 . 5] . In these results, we provide a qualitative comparison with the m ulti-view factorization metho d min W i , 1 ≤ i ≤ M ; S M X i || X i − W i S || F W T i W i = I , 1 ≤ i ≤ M , whic h w e refer to as non-probabilistic SRM, keeping with the terminology used in [ 17 ]. W e refer to the probabilistic solution of this optimization problem, also given in [ 17 ], simply as SRM. W e intend for this comparison to provide additional insight into the relative strengths of each metho d prior to our quantitativ e comparison later in Section 6.2. W e also sought to compare single-view with m ulti-view denoising. T o do so, we generated 100 views of a noisy Kroneck er graph, computed the error of MVTT and the single view T reelet T ransform, a veraged both ov er all views, to ok the difference, and av eraged this v alue o v er 30 trials. Results from b oth exp eriments are display ed in Figure 3. Of note is the fact that neither the probabilistic nor the non-probabilistic versions of SRM are able to capture the structure of the Kroneck er Graph, where MVTT can. 6.1.2 Empirical data T o further demonstrate the utilit y of MVTT for denoising, we tested it on a functional brain net work derived from fMRI. A functional brain net work can b e constructed by a veraging 6 Figure 3: F rom the left, we hav e the original noisy image, the image denoised with MVTT, the image denoised with SRM, and the image denoised with non-probabilistic SRM. The plot is of the av erage error of the multi-view approach subtracted from the av erage error of the single-view approach; the mean of 30 trials of this exp eriment are plotted. v oxel-lev el activ ations ov er larger brain regions and computing a correlation net work b etw een region-lev el time series. Such net w orks ha ve b een prov en useful in identifying a num b er of scien tifically and p otentially clinically significant phenomena. F or example, Sc hizophrenia has b een identified as a disease characterized by an altered functional netw ork top ology [ 21 ]. F urther, it has b een sho wn [ 1 ] that h uman functional brain netw orks hav e a hierarc hical structure. As these net w orks are also usually collected in replicate, they are an excellen t c hoice for a dataset on which to test the denoising ability of MVTT. Using the functional net works of 20 healthy sub jects at rest [ 21 ], we compared the output of MVTT with that obtained using domain sp ecific assumptions. Namely , these authors assume that the netw ork should b e connected and hav e a specific connection density . Our results are shown in Figure 4. Figure 4: Denoised empirical functional netw orks. The leftmost image is the empirical functional netw ork, the middle image is the denoised version pro duced by MVTT, and the righ tmost image is the output of the metho d given in [21]. 7 Figure 4 demonstrates the similarity betw een the output of the denoising algorithm of [ 21 ] and that produced b y MVTT. With an FDR of 0.015, we find the results given in T able 1. The authors of [ 21 ] consider a connection density b etw een 0.04 and 0.16 physiologically reasonable. MVTT pro duces a denoised graph that approximates their assumptions while b eing highly correlated with their output. MVTT is thus able to capture the structure of the empirical functional netw orks with a more general set of assumptions. T able 1: MVTT Denoising of F unctional Netw orks from [21] Measuremen t V alue Standard Deviation Connection Density 0.147 0.066 Num b er of Connected Comp onents 1.65 0.853 P earson Correlation 0.462 0.037 6.2 Shared resp onse The Shared Resp onse Problem (SRP) is form ulated in [ 17 ] as one of computing correlations b et ween v oxel-lev el fMRI timeseries. Because of their scien tific and clinical potential, w e reformulate the SRP based on correlations betw een functional netw orks. Giv en the hierarc hical structure of functional net w orks and the ability of MVTT to capture this structure, MVTT would seem an excellen t to ol for finding consensus structure across replicates which may hav e a shared resp onse. T o compute the shared resp onse, we use the R aider dataset first presen ted in [ 10 ]. Our metho d for computing the shared response is similar to that presented by the authors in [ 17 ]. F or eac h hemisphere, we split the dataset into a training half and testing half based on time. Both the training and testing sets are then split in to t wo groups of sub jects, G 1 and G 2 . MVTT and SRM are b oth run on the training halv es of G 1 and G 2 , resulting in bases Q 1 and Q 2 for MVTT and W 1 i and W 2 i for SRM where 1 ≤ i ≤ M . Q 1 and Q 2 and the co efficien t matrices returned by SRM, S 1 and S 2 , are then registered by solving orthogonal Pro crustes problems. Denoising is p erformed then the Pearson Correlation is computed b et ween groups of testing sub jects as a measure of the shared resp onse b etw een these tw o groups. The av erages ov er five differen t sub ject partitions are given in T able 2. T able 2: Shared Resp onse of R aider Dataset Metho d LH-Corr LH-STD RH-Corr RH-STD None 0.363 0.006 0.542 0.005 MVTT-feature space 0.691 0.002 0.705 0.002 MVTT-lab el space 0.687 0.003 0.6994 0.001 SRM-feature space 0.048 0.004 0.088 0.009 SRM-lab el space 0.095 0.003 0.173 0.004 The results in T able 2 are consisten t with the experiments shown in Section 6.1.1: SRM is unable to capture the hierarchical structure of the functional netw orks and information is lost in pro jecting the data onto the bases returned by it. On the other hand, MVTT is successful in capturing the consensus structure in the hierarchical graphs and as such, the computed shared resp onse using MVTT is higher. The feature and lab el space results are giv en after denoising with an FDR of 0.01 and it should b e noted that the denoising pro cess resulted in a reduction in the p erformance of SRM, with original feature space correlations of 0.324 ( σ = 0 . 007 ) and 0.201 ( σ = 0 . 003 ) for the right and left hemispheres resp ectively . 7 Conclusion W e hav e introduced a nov el metho d, the Multi-View T reelet T ransform, and shown numer- ically that it has desirable con v ergence prop erties. Moreo v er, we ha ve shown how it may b e applied to three problems to achiev e state-of-the-art results: the denoising of syn thetic, 8 hierarc hical graphs, the denoising of empirical functional netw orks, and a reformulation of the Shared Resp onse Problem. 9 References [1] Bassett, D.S., Bullmore, E., V erchinski, B.A., Mattay , V.S., W einberger, D.R., and Linden b erg, A.M. (2008). Hierarchical organization of human cortical netw orks in health and schizophrenia. The Journal of Neur oscienc e 28 (37): 9239-9248. [2] T enen baum, J.B. and F reeman, W.T. (2000). Sep erating style and conten t with bilinear mo dels. Neur al Computation 12 (6): 1247-1283. 2000. [3] Cardoso, J.F. and Souloumiac, A. (1996). Jacobi angles for simultaneous diagonalization. SIAM Journal on Matrix A nalysis and A pplic ations 17 (1): 161-164. [4] Hardo on, D.R., Szedmak, S., and Shaw e-T aylor, J. (2004). Canonical correlation analysis; An ov erview with application to learning metho ds. Neur al Computation 16 (12): 2639- 2664. [5] Kumar, A., Rai, P ., and Daume, H. (2011). Co-regularized multi-view sp ectral clustering. A dvanc es in Neur al Information Pr o c essing Systems 24 : 1413-1421. [6] Coifman, R.R. and Maggioni, M. (2006). Diffusion wa v elets. Applie d and Computational Harmonic A nalysis 21 (1): 53-94. [7] Hidru, D. and Goldenberg, A. (2014). EquiNMF: graph regularized m ultiview nonnegative matrix factorization. arXiv :1409.4018. [8] Abramo vich, F. and Benjamini, Y. (1996). A daptive thresholding of w av elet co efficients. Computational Statistics and Data A nalysis 22 (4): 351-361. [9] Sharma, A., Kumar, A., and Daume, H. (2012). Generalized multiview analysis: a discriminativ e laten t space. Computer V ision and Pattern R e c o gnition : 2160-2167. [10] Haxb y , J.V., Guntupalli, J.S., Connolly , A.C., Halchenk o, Y.O., Conroy , B.R., Gobbini, M.I., Hanke, M., and Ramadge, P .J. (2011). A common, high-dimensional mo del of the represen tational space in human ven tral temp oral cortex. Neur on 72 (2): 404-416. [11] Lesk ov ec, J., Chakrabarti, D., Kleinberg, J., F aloutsos, C., and Ghahramani, Z. (2010). Kronec ker graphs: an approac h to mo deling net wor ks. Journal of Machine L e arning R ese ar ch 11 (3): 985-1042. [12] K ondor, R., T enev a, N., Garg, V. Multiresolution matrix factorization. International Confer enc e on Machine L e arning 31 : 1620-1628. [13] Liu, J., W ang, C., Gao, J., and Han, J. (2013). Multi-view clustering via join t non- negativ e matrix factorization. Pr o c e ddings of the SIAM Confer enc e on Data Mining . [14] Lyu, S. and W ang, X. (2013). On algorithms for sparse multi-factor NMF. A dvanc es in Neur al Information Pr o c essing Systems 26 : 602-610. [15] K ondor, R., T enev a, N., and Mudrakarta, P .K. (2015). Parallel MMF: a multiresolution approac h to matrix computation. arXiv :1507.04396. [16] Ab di, H. (2007). Partial least squares regression. Encyclop e dia for r ese ar ch metho ds for the so cial scienc es : 792-795. [17] Chen, P .H., Chen, J., Y esh urun, Y., Hasson, U., Haxby , J.V., and Ramadge, P .J. (2015). A reduced-dimension fMRI shared response mo del. A dvanc es in Neur al Information Pr o c essing Systems 28 : 460-468. [18] Kuang, D., Ding, C., and Park, H. (2012). Symmetric nonnegative matrix factorization for graph clustering. Pr o c e e dings of the SIAM Confer enc e on Data Mining . [19] T ang, W., Lu, Z., and Dhillon, I.S. (2009). Clustering with multiple graphs. Pr o c e e dings of the International Confer enc e on Data Mining 9 : 1016-1021. [20] Lee, A.B., Nadler, B., and W asserman, L. (2008). T reelets-an adaptive multi-scale basis for sparse unordered data. The A nnals of A pplie d Statistics 2 (2): 435-471. [21] V ertes, P .E., Bloch-Alexander, A.F., Gogtay , N., Giedd, J.N., Rap op ort, J.L., and Bullmore, E.T. (2011). Simple mo dels of human brain functional netw orks. Pr o c e e dings of the National A c ademy of Scienc es 109 (15): 5868-5873. 10 Supplemen tal material 8 Theoretical prop erties 8.1 Synthetic data T o provide additional motiv ation and intuition for why MVTT and the T reelet T ransform should capture the structure of a Kroneck er graph, consider the following simple hierarchical clustering pro cedure. 1. Break the adjacency matrix of G K , A G K , up into contiguous, non-o verlapping blocks of 3x3 matrices. 2. Apply a normalized b o x filter to each blo ck, B , call the returned av erage A B . 3. Compress all entries of B into a single entry with v alue A B . 4. Iterate ov er this approach. If this pro cedure is p erformed repeatedly , we obtain the results sho wn in Figure 1. Thus w e can see that hierarc hical clustering via iterativ e smoothing can capture self-similar, hierarc hical structure in graphs. 8.2 Stability T o further explore the theoretical prop erties of MVTT, we pro vide an analysis of its stability b elo w. T able 3: Stabilit y of MVTT Noise Level Stabilit y Standard Deviation 0.1 0.248 0.027 0.2 0.239 0.063 0.3 0.248 0.039 0.4 0.214 0.054 0.5 0.340 0.206 F or tw o distinct collections of M views, C 1 and C 2 , we w ould like for C 1 and C 2 to b e reasonably “close” . W e can define this "closeness" as stabilit y if we then define stability as the standard deviation ov er all E M , for a given noise level and v alue of M . C 1 and C 2 are confirmed to b e close in T able 1, with one exception for = 0 . 5 . The reduction in stabilit y for this noise lev el arises from v ariable p erformance for lo w v alues of M (sho wn in Figure 2), a result whic h is consisten t with our findings for con v ergence and denoising. Sp ecifically , the T reelet T ransform for high levels of noise returns a basis that increasingly reflects the structure of this noise and as such, for lo w v alues of M , the output of MVTT is less stable. 8.3 Rate of con v ergence Another finding concerning the conv ergence of MVTT is that E M app ears to b e an exp onen- tially decaying function of M , for example, of the form: E M = e rM + Bias ( ˆ Θ , Θ) , Figure 5: Iterativ e smo othing is capable of capturing self-similar structure in this Kroneck er Graph. where ˆ Θ is the estimator given by the av erage of M T l o ver all M views and Θ is T l (Σ) . Bias ( ˆ Θ , Θ) is then the v alue of E M > 0 to which the error estimates con v erge. This observ ation is confirmed in Figure 2 of the main text, where it is shown that the rate of con vergence of MVTT is a decreasing linear function of the noise level. And since the rate of con vergence is 0 when = 0 , for some s < 0 , w e ha ve the followi ng relationship for the error: E M = e sM + Bias ( ˆ Θ , Θ) 9 Exp erimen ts 9.1 Denoising of syn thetic data T o provide a more complete qualitative picture of the p erformance of MVTT relative to SRM and non-probabilistic SRM in denoising Kroneck er graphs, we give additional examples b elo w. 9.2 Shared resp onse computation The num b er of basis vectors computed b y SRM was set to the maxim um p ossible for b oth Kronec ker graph denoising as well as shared resp onse computation. The motiv ation for this is given in Figures 3 and 4. Of note is the fact that even assuming that the Kroneck er graph is full rank, there is significant distortion in the reconstruction by the probabilistic v arian t of SRM. 12 Figure 6: Noise lev els of graphs are given top to b ottom: 0.1, 0.2, 0.3, 0.4, 0.5. Left to right, the images are of the original noisy Kroneck er graph, the graph denoised with MVTT, the graph denoised with SRM, and the graph denoised with non-probabilistic SRM. 13 Figure 7: Reconstruction of Kronec ker graph by non-probabilistic SRM for v arious num b ers of basis v ectors. T op to bottom, left to right: 9, 18, 27, 36, 45, 54, 63, 72, and 81 (full rank). Figure 8: Reconstruction of Kroneck er graph b y probabilistic SRM for v arious num bers of basis vectors. T op to b ottom, left to right: 9, 18, 27, 36, 45, 54, 63, 72, and 81 (full rank). 14
Original Paper
Loading high-quality paper...
Comments & Academic Discussion
Loading comments...
Leave a Comment