Diffusion Component Analysis: Unraveling Functional Topology in Biological Networks
Complex biological systems have been successfully modeled by biochemical and genetic interaction networks, typically gathered from high-throughput (HTP) data. These networks can be used to infer functional relationships between genes or proteins. Usi…
Authors: Hyunghoon Cho, Bonnie Berger, Jian Peng
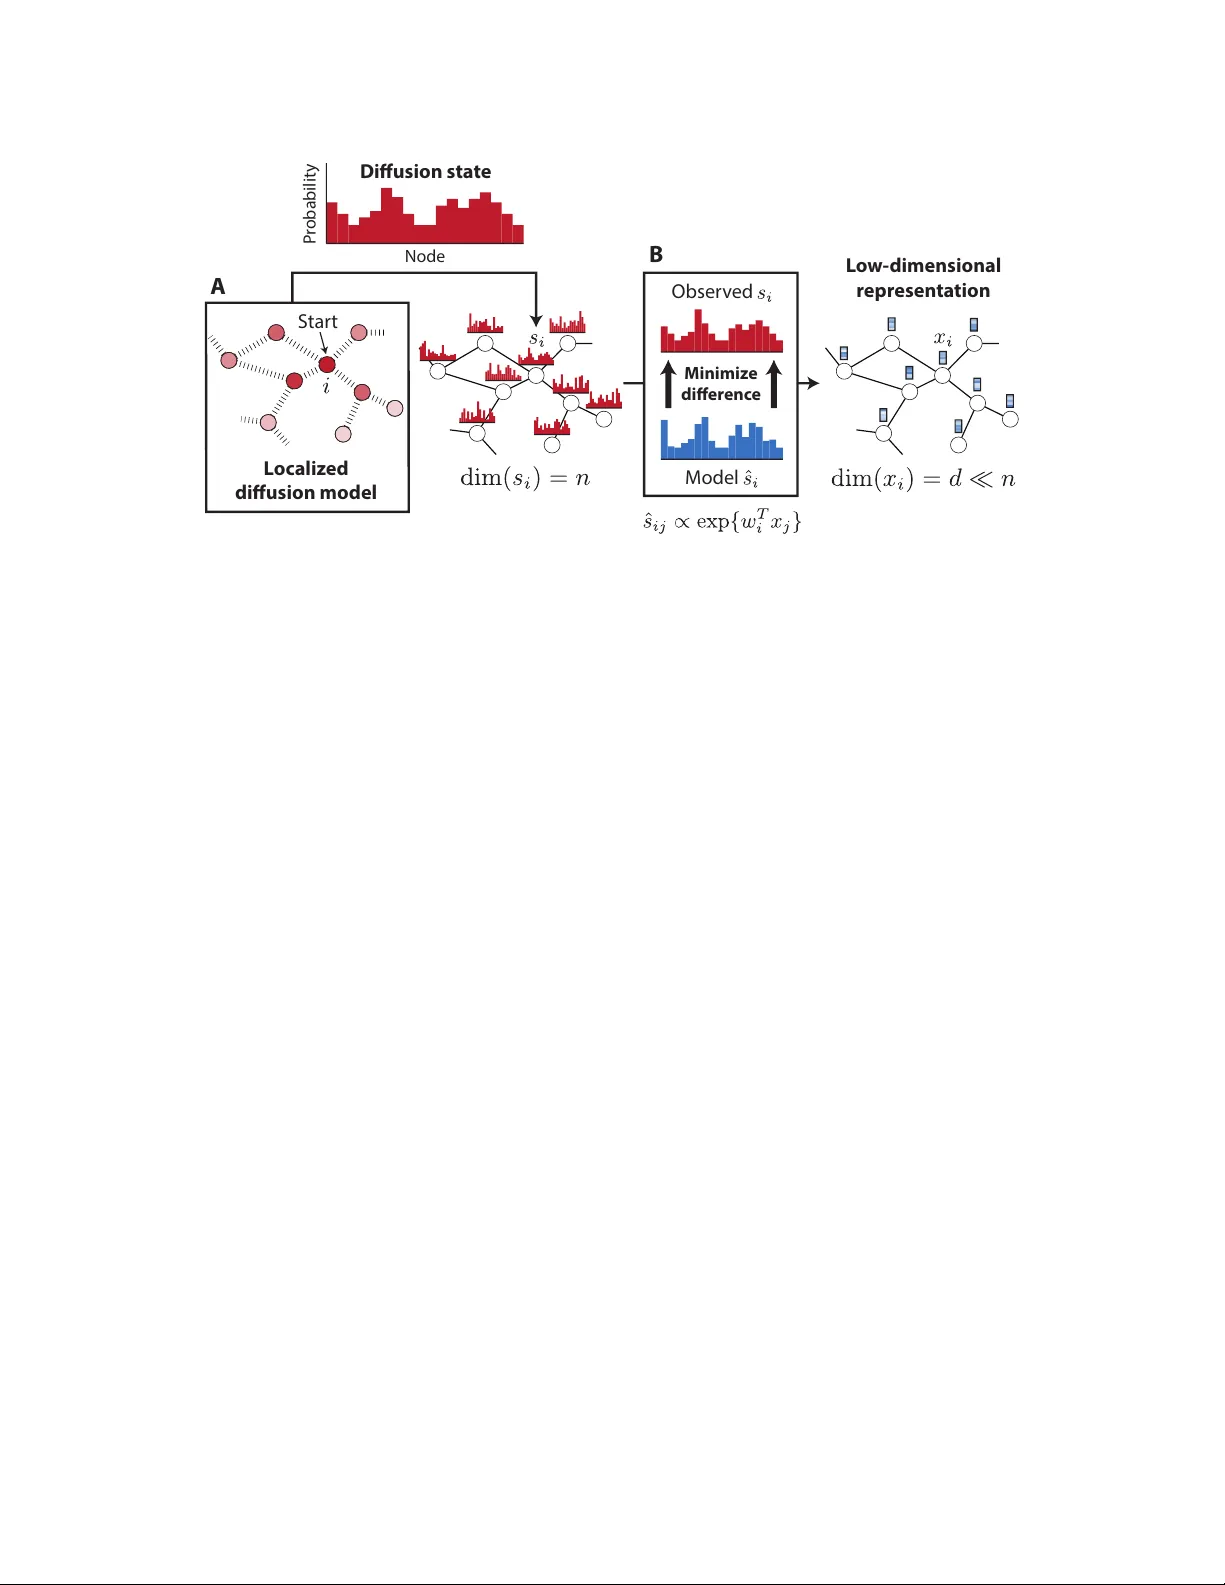
Diffusion Comp onen t Analysis: Unra v eling F unctional T op ology in Biological Net w orks Hyungho on Cho 1 , Bonnie Berger 1 , 2 , ∗ and Jian P eng 1 , 2 , 3 , ∗ 1 Computer Science and Artificial In telligence Lab oratory , MIT, Cam bridge, MA, USA 2 Departmen t of Mathematics, MIT, Cambridge, MA, USA 3 Departmen t of Computer Science, Universit y of Illinois at Urbana-Champaign, Champaign, IL, USA ∗ Corresp onding authors: b ab@mit.e du and jianp eng@il linois.e du Abstract Complex biological systems ha ve b een successfully mo deled b y biochemical and genetic in- teraction netw orks, t ypically gathered from high-throughput (HTP) data. These netw orks can b e used to infer functional relationships b et ween genes or proteins. Using the in tuition that the topological role of a gene in a net w ork relates to its biological function, local or diffusion- based “guilt-b y-asso ciation” and graph-theoretic metho ds ha ve had success in inferring gene functions. Here we seek to improv e function prediction b y in tegrating diffusion-based metho ds with a no v el dimensionality reduction technique to ov ercome the incomplete and noisy nature of net w ork data. In this paper, w e in tro duce diffusion component analysis (DCA), a framework that plugs in a diffusion mo del and learns a low-dimensional vector representation of eac h no de to enco de the top ological properties of a net work. As a pro of of concept, w e demonstrate DCA’s substan tial improv ement o v er state-of-the-art diffusion-based approaches in predicting protein function from molecular interaction net works. Moreo ver, our DCA framew ork can integrate m ultiple netw orks from heterogeneous sources, consisting of genomic information, bio c hemical exp erimen ts and other resources, to ev en further improv e function prediction. Y et another lay er of performance gain is achiev ed b y in tegrating the DCA framew ork with supp ort vector mac hines that take our node vector representations as features. Overall, our DCA framework pro vides a no vel representation of no des in a net work that can be used as a plug-in arc hitecture to other mac hine learning algorithms to decipher top ological prop erties of and obtain nov el insights into in teractomes. 1 1 This paper was selected for oral presentation at RECOMB 2015 and an abstract is published in the conference pro ceedings. 1 In tro duction Cellular processes are executed through complex interactions b et ween molecules, suc h as proteins, DNA, RNA and small comp ounds. Recently-dev elop ed high-throughput (HTP) exp erimen tal tech- niques, such as y east tw o-h ybrid screens and genetic in teraction assa ys, ha ve help ed to identify molecular in teractions in bulk and enabled researchers to piece together large-scale interaction net works from these data [1, 2, 3]. Protein-protein in teraction and genetic interaction netw orks are the largest and most commonly- used datasets to study how molecules and their interactions determine the function of biological pro cesses. Ho wev er, net works generated from such data are often incomplete, noisy and difficult to interpret. Th us, w e seek to design efficien t algorithms to obtain accurate and comprehensiv e functional annotations of genes and proteins in these less-than-perfect net works. Graph-theoretic methods hav e been prop osed for the functional annotation of genes whic h use the intuition that in teracting genes close together in netw ork top ology are more likely to p erform similar functions [4, 5, 6, 7, 8, 9, 10, 11]. A t yp e of random-w alk diffusion algorithm, also known as random w alk with restart (R WR), has been extensiv ely studied in the context of biological net w orks and effectively applied to protein function prediction and enrichmen t analysis [4, 12, 13, 14, 15]. The k ey idea b ehind suc h algorithms is to propagate information along the netw ork, in order to exploit b oth direct and indirect link ages betw een genes. T ypically , a distribution of top ological similarit y is computed for each gene, in relation to other genes in the net work, so that researc hers can select the most related genes in the resulting distribution [12, 13, 14, 15] or, rather, select genes that share the most similar distributions [4]. Suc h diffusion-based metho ds hav e b een shown to b e useful for protein function prediction, mainly due to their ability to capture fine-grain topological prop erties, whic h can b e less clear in the direct in teractome neighborho o d of a gene. Nev ertheless, diffusion algorithms are still far from satisfactory , partially due to the noisy and incomplete nature of high-throughput data. Even the yeast protein in teractome, the highest quality data gathered for an y organism, includes a large num b er of false positive and false negativ e in teractions [1, 16, 17, 18]. Dimensionalit y reduction tec hniques such as principle comp onen t analysis (PCA) ha ve b een effectiv ely used for de-noising and impro ving accuracy in high dimensional biological data. The purp ose of PCA is to reduce the dimensionalit y of a dataset b y linearly pro jecting it on to a lo wer dimensional space, while retaining most of the original dataset’s v ariance. In man y predictiv e mac hine learning applications, using PCA to de-noise the input data has b een sho wn to b e effectiv e b ecause it mak es the mo del more resistan t to ov erfitting. How ev er, to our b est knowledge, little effort has b een made in the spirit of dimensionality reduction and de-noising for impro ving diffusion- based function prediction approac hes for biological netw orks. Here w e seek to improv e function prediction by in tegrating diffusion-based metho ds with a nov el dimensionality reduction technique, sp ecifically designed to capture the diffusion patterns of a net w ork, to ov ercome the incomplete and noisy nature of net work data. In this pap er, w e prop ose Diffusion Comp onen t Analysis (DCA), a nov el analytical framework that com bines diffusion-based metho ds and dimensionality reduction to better extract top ological net work information in order to facilitate accurate functional annotation of genes or proteins. The k ey idea b ehind DCA is to obtain informative, but low-dimensional features, which enco de the inheren t top ological prop erties of each no de in the netw ork. W e first run a diffusion algorithm on a molecular net w ork to obtain a distribution for eac h no de which captures its relation to all other nodes in the net work. W e then approximate each of these distributions by constructing a multinomial logistic mo del, parametrized b y lo w-dimensional feature vectors, for eac h node. F eature v ectors of all nodes are obtained by minimizing the Kullback-Leibler (KL) div ergence (relativ e entrop y) b et w een the diffusion and parameterized-multinomial logistic distributions. Akin 1 to PCA, which reveals the in ternal lo w-dimensional linear structure of the data that b est explains the v ariance, DCA computes a lo w-dimensional vector-space representation for all no des in the net work suc h that the diffusion in the net work can be b est explained. Moreo ver, DCA can b e naturally extended to integrate multiple heterogeneous netw orks by p erforming diffusion on separate net works and join tly optimizing feature vectors. T o e v aluate the p erformance of DCA, w e first applied DCA to predict protein function in y east molecular in teraction netw orks and achiev ed substantial improv emen t ov er existing metho ds. W e next demonstrated the integrativ e capacit y of DCA by using it to integrate heterogeneous net works based on genomic information, bio c hemical exp erimen ts and other resources from the STRING database and further improv ed functional annotation. In addition, w e trained a supp ort v ector mac hine with our no de-vector represen tation as features to b e used as a metric for “distance b et w een genes for impro v ed protein function prediction, as SVMs performed better than k-nearest neigh b or search. Ov erall, when tested on the STRING netw orks with third level functional anno- tations from MIPS, our DCA framework is able to achiev e 71.29% accuracy , which is remark ably 12.31% higher than the previous state-of-the-art, diffusion-based metho d. Lo w-dimensional feature v ector represen tation learned by DCA can readily be plugged into other existing machine learning algorithms to decipher functional properties of and obtain nov el insigh ts in to in teractomes. 2 Diffusion Comp onen t Analysis Biological net works provide a useful topological structure ov er whic h information ab out certain no des in a graph can b e propagated to shed light on the prop erties of no des that are less charac- terized. This relies on the assumption that the no des that are “similar” or “close” to each other in the graph will tend to ha ve similar prop erties, which is in tuitiv ely the case for biological functions or disease asso ciations, where lo calized groups of interacting genes or proteins giv e rise to a sp ecific molecular phenotype. Con ven tional approaches to finding no des that are top ologically asso ciated with a given node inv olv e either directly taking the neigh b orho od in the graph, or using lo calized diffusion mo dels to select top no des in the resulting distribution (whic h we refer to as diffusion state ), or to select nodes with similar distributions. The diffusion-based methods are shown to b e effectiv e in v arious settings, mainly due to their ability to capture fine-grain topological properties that lie beyond the direct neighborho o d of a no de. Our DCA framework substantially adv ances previous diffusion-based metho ds b y providing a w ay to extract top ological information enco ded in the diffusion states using a compact, lo w-dimensional vector representation of nodes in a graph (Figure 1). 2.1 Random w alk with restart review The random walk with restart (R WR) metho d has b een w ell-established for analyzing netw ork structures. By allowing the restart of random w alk in eac h step with a probability , R WR can take in to consideration both local and global top ology within the net w ork to iden tify the relev ant or imp ortan t no des in the net w ork. Let A denote the adjacency matrix of a (w eigh ted) molecular in teraction net work G = ( V , E ) with n no des, each denoting a gene or a protein. Each en try B i,j in the transition probability matrix B , which stores the probabilit y of a transition from no de i to no de j , is computed as B i,j = A i,j P j 0 A i,j 0 . 2 L o w - dimensional r epr esen ta tion L o c aliz ed diusion mo del S tar t Obser v ed M odel M inimiz e di er enc e P r obabilit y Node D iusion sta t e A B Figure 1: Diffusion Comp onen t Analysis. (A) Random w alks with restart are used to com- pute the diffusion state for each no de in a netw ork. (B) Lo w-dimensional feature vectors describing the top ological properties of eac h no de are obtained by minimizing the a verage KL-div ergence b e- t ween the observed diffusion states and the parameterized-multinomial logistic distributions. F ormally , the R WR from a no de i is defined as: s t +1 i = (1 − p r ) s t i B + p r e i (1) where p r is the probabilit y of restart, controlling the relative influence of local and global top ological information in the diffusion, with higher c hances of restart placing greater emphasis on the local structure; e i is a n -dimensional distribution v ector with e i ( i ) = 1 and e i ( j ) = 0 , ∀ j 6 = i ; s t is a n -dimensional distribution vector in which each entry holds the probability of a no de b eing visited after t steps in the random w alk. The first term in the ab o v e up date corresp onds to follo wing a random edge connected to the curren t node, while the second term corresp onds to restarting from the initial no de i . At the fixed p oin t of this iteration w e obtain the stationary distribution s ∞ i . Consisten t with a previous w ork [4], w e define the diffusion state s i = s ∞ i ∈ ∆ n of each no de i to the stationary distribution of random walk with restart (R WR) starting at eac h no de, where ∆ n denotes the n -dimensional probabilit y simplex. In tuitiv ely , the j th elemen t, s ij , represen ts the probabilit y of R WR starting at node i ending up at no de j in equilibrium. When the diffusion states of t wo no des are close to one another, it implies that they are in similar p ositions within the graph with resp ect to other no des, which migh t suggest functional similarit y . This insigh t provided the basis for sev eral diffusion-based metho ds [4, 12, 19, 8] that aim to predict c haracteristics of genes or proteins by using the diffusion states to b etter capture top ological asso ciations. Instead of simply using the probability in the diffusion state, the diffusion state distance (DSD) approac h, using L 1 distances b et ween diffusion states, ac hiev ed the state-of-the-art performance on predicting protein functions on y east int eractomes [4]. 2.2 No v el dimensionality reduction A key observ ation b ehind our approach is that the diffusion states obtained in this manner are still noisy , in part due to the low quality and high dimensionalit y of the original netw ork data. Just a few missing or spurious interactions in the netw ork can ha ve significan t impact on the result of 3 random walks, and the fact that most biological net works are incomplete greatly exacerbates this problem. Moreo ver, the high dimensionalit y of the diffusion state makes it not readily useful as top ological features for netw ork-based classification or regression tasks. With the goal of noise and dimensionalit y reduction, we approximate each diffusion state s i with a m ultinomial logistic mo del based on a latent v ector represen tation of no des that uses far few er dimensions than the original, n -dimensional state. Sp ecifically , w e compute the probability assigned to node j in the diffusion state of no de i as ˆ s ij := exp { w T i x j } P j 0 exp { w T i x j 0 } , (2) where ∀ i, w i , x i ∈ R d for d n . Eac h no de is given tw o v ector represen tations, w i and x i . W e refer to w i as the context feature and x i as the no de feature of node i , b oth capturing the intrinsic top ological properties in the netw ork. If w i and x j are close in direction and with large inner pro duct, no de j should b e frequently visited in the random walk starting from no de i . Ideally , if the v ector representation w and x is able to capture fine-grain top ological prop erties, we can use it to retriev e genes with similar functions or use it as features for other net work-based mac hine learning applications. While it is p ossible to enforce equality betw een these t wo v ectors, decoupling them leads to a more manageable optimization problem and also allo ws our framework to b e readily extended to the m ultiple netw ork case, which is further described in the next section. Giv en this mo del, w e formulate the follo wing optimization problem that tak es a set of observed diffusion states s = { s 1 , . . . , s n } as input and finds the lo w-dimensional vector represen tation of no des w and x that b est appro ximates s according to the m ultinomial logistic mo del. T o obtain w and x for all no des, w e use KL-div ergence (relative en tropy) as the ob jective function, which is a natural c hoice for comparing probabilit y distributions, to guide the optimization: minimize w,x C ( s, ˆ s ) = 1 n n X i =1 D KL ( s i k ˆ s i ) . (3) By writing out the definition of relative entrop y and ˆ s , w e can express the ob jective as C ( s, ˆ s ) = 1 n n X i =1 H ( s i ) − n X j =1 s ij w T i x j − log n X j 0 =1 exp { w T i x j 0 } , (4) where H ( · ) denotes the en tropy . Similar to PCA which finds the lo w-dimensional linear structure of the data to best explain the data v ariance, DCA computes a lo w-dimensional vector-space rep- resen tation for all no des in the netw ork data suc h that the diffusion on the net work can b e b est explained. T o optimize this ob jective function, w e computed the gradien ts with resp ect to the parameters w and x : ∇ w i C ( s, ˆ s ) = 1 n n X j =1 ( ˆ s ij − s ij ) x j , (5) ∇ x i C ( s, ˆ s ) = 1 n n X j =1 ( ˆ s j i − s j i ) w j . (6) Both the ob jective function and the gradien ts can b e computed in O ( n 2 d ) run time complexity . W e use a standard quasi-Newton metho d L-BF GS [20] with these gradien ts to find the low-dimensional v ector represen tations w and x corresp onding to a lo cal optimum of this optimization problem. W e use uniform random n um b ers from [ − 0 . 05 , 0 . 05] to initialize the v ectors and observed that the optimization can almost surely find go o d local optimal solutions. 4 2.3 No v el integration of heterogeneous net works Our framework giv es rise to a nov el approach to in tegrating heterogeneous data sources. As h uge amoun t of in teraction data generated from wide v ariet y of exp erimen tal and computational studies for molecular net works, in tegration approac hes hav e b een used to com bine them to a netw ork mo del and iden tify genes’ functions [5, 8, 21, 22, 23, 24]. A common approac h taken b y previous w ork is based on weigh ting the net works in some manner to get an in tegrated netw ork b efore analyzing the top ological prop erties of eac h node [5, 23, 25]. F or example, in the STRING database, confidence scores from heterogeneous sources including co-expression relationship, genomic con text, exp erimen tal interactions and literature evidence, are combined by the Ba y es metho d: p i,j = 1 − Q k (1 − p ( k ) i,j ), where p ( k ) i,j ∈ [0 , 1] is the probability confidence of in teraction ( i, j ) from netw ork k ∈ { 1 , 2 , ..., K } deriv ed by the same data source. Ho wev er, b y collapsing the netw orks in to a single representativ e net work, we lose imp ortan t netw ork-specific patterns. P erforming random w alk directly on the in tegrated net work can b e problematic, since edges from m ultiple sources are mixed. Here, w e naturally extend our DCA approach to integrate netw ork data from diverse sources. W e first perform random w alks on eac h individual net w ork k separately and obtain net w ork-sp ecific diffusion states s ( k ) i for each node i . W e also construct the multinomial distribution ˆ s ( k ) ij from the follo wing logistic model, ˆ s ( k ) ij := exp { w ( k ) T i x j } P j 0 exp { w ( k ) T i x j 0 } , (7) where for each no de i in net work k , w e assign it a net work-specific context vector represen tation w ( k ) i , whic h also enco des the intrinsic top ological prop erties of netw ork dataset k ; for no de features x , we allow them to b e shared across all K net works. Finally , we jointly optimize the following ob jective function, minimize w,x C ( s, ˆ s ) = K X k =1 1 n n X i =1 D KL ( s ( k ) i k ˆ s ( k ) i ) , (8) b y the quasi-Newton L-BFGS metho d. Note that it is p ossible to w eight the divergence term of eac h net w ork differen tly , but we give equal imp ortance to eac h net work in this w ork for simplicit y . 2.4 Ev aluation of DCA in protein function prediction T o assess the quality of vector represen tations obtained b y DCA, w e considered the task of pro- tein function prediction from protein interaction net w orks. In protein-protein in teraction netw orks, functional relationship b et ween proteins is b eliev ed to correlate with the pro ximity among proteins in the net work structure, since interacting proteins are often inv olv ed within the same biologi- cal pro cesses. Thus using functional annotations from w ell characterized proteins to predict the function of unlab eled proteins can b e effective if we hav e a go o d wa y to compute the top ological pro ximity or similarity b et ween proteins. Giv en a distance metric that w ell captures the topologi- cal similarit y of proteins, we are able to predict function of a protein from the known functions of closest proteins rank ed b y this distance metric. This mak es function prediction a goo d example to ev aluate how go o d the top ological and diffusion information are enco ded by DCA. T o predict protein function using DCA, we compute the similarity b et ween any tw o proteins in the net work based on their lo w-dimensional vector representations. F or a pair of proteins i and j , 5 w e used the cosine distance betw een their no de features as following. D cos ( i, j ) = 1 − x T i x j k x i kk x j k (9) After the distances are computed, w e use weigh ted ma jorit y vote with ten closest proteins to assign functions to unlab eled proteins. Unless otherwise noted, we use ma jorit y vote with cosine distances to carry out function prediction based on our v ector represen tation of proteins. F urthermore, since DCA giv es lo w-rank features for eac h protein in the netw ork, they can b e readily used as feature v ectors for mac hine learning algorithms in v arious applications, such as classification or clustering. T o demonstrate the potential of DCA as a plug-in framework for existing machine learning algorithms, we formulate the protein function prediction task as a multi- lab el classification problem and applied an off-the-shelf supp ort vector mac hine (SVM). Since there are proteins with m ultiple functional annotations, w e train a SVM for eac h function category and then assign functions to a protein with annotations with highest output v alues from SVM. W e denote this metho d as DCA-SVM. 3 Results Here w e ev aluate the abilit y of our DCA framework to unco ver functional relationships in the in ter- actome of yeast, whic h is one of the few organi sms for whic h a comprehensiv e annotation of proteins is av ailable. With the com bination of noise reduction via dimensionality reduction, impro ved in- tegration of m ultiple heterogenous netw orks, and the use of supp ort vector machines, our DCA framew ork is able to achiev e 71.29% accuracy with fiv e-fold cross-v alidation on the STRING net- w orks with third lev el functional annotations from MIPS, whic h is remark ably 12.31% higher than the previous state-of-the-art diffusion state distance (DSD) method. The details of our exp erimen ts follo w. 3.1 Net w orks and annotations W e obtained a collection of protein-protein interaction (PPI) netw orks of yeast from the STRING [25] database v9.1, which is based on a v ariet y of data sources, including high-throughput interaction assa ys, curated PPI databases, and conserved co expression. W e excluded the net work constructed from text mining of academic literature to preven t confounding caused by links based on functional similarit y . The resulting collection consisted of six heterogenous netw orks ov er 6,400 proteins, with the num b er of edges v arying from 1,361 to 314,013. Ev ery edge in these netw orks is asso ciated with a weigh t b et w een 0 and 1 represen ting the probabilit y of edge presence, which we factor in to the calculation of transition probabilities in the random w alk pro cess. F or metho ds that tak e a single netw ork as input, w e used STRING’s approach to in tegrate the netw orks: w e assign p i,j = 1 − Q k (1 − p ( k ) i,j ) as the probabilit y of each edge in the com bined net work, where p ( k ) i,j is the probabilit y associated with the same edge in net w ork k . 536,207 edges were pro duced after the in tegration. F urthermore, we built a PPI net work of 6,071 yeast proteins based on 135,374 physical interac- tions rep orted in the BioGRID [26] database v3.2.117. W e considered every edge in the database to b e undirected for simplicit y , although our metho d can be easily applied to directed net works as w ell. F or pairs of no des with m ultiple edges, w e merged the redundant edges and assigned a weigh t corresp onding to the num ber of merged edges to pro duce a w eigh ted graph. W e used this net w ork as an additional test case for our framew ork. 6 T o train and test function prediction metho ds, w e obtained functional annotations for y east proteins from the Munich Information Cen ter F or Protein Sequences (MIPS) F unctional Catalogue [27]. The biological functions in this database are organized in a three-la y ered hierarch y , where the top lev el (MIPS1) consists of 17 functions, the second (MIPS2) consists of 74 functions, and the third (MIPS3) consists of 154 functions. Imp ortantly , eac h protein can ha v e more than one asso ciated function. All of our exp eriments were rep eated for eac h lev el of annotations to test the metho ds in different c hallenging settings, with MIPS3 b eing the most difficult due to the largest n umber of candidate lab els. 3.2 P erformance metrics F or each function prediction metho d, we repeatedly held out 20% of the annotated proteins as the v alidation set and used the remaining 80% to predict their functions. W e used t wo prediction p erformance metrics that are commonly used in this field. First, w e calculate the ac cur acy b y assigning top function to each protein in the v alidation set and measuring how often our prediction is one of the known functions of the protein. Second, we consider the micro-a verage F1 sc or e . T o calculate this metric, we assign top α predictions to eac h protein, construct a 2-by-2 contingency table for each function b y treating it as a binary classification problem, and compute the F1 score using the com bined table where each entry is summed across all functions. W e used α = 3 for the results presen ted in this pap er, following previous work [4, 28]. 3.3 DCA substan tially improv es functional annotation The results for protein function prediction using the STRING netw ork (without text mining) are summarized in Figure 2. W e used restart probabilit y of 0.5 for random walks and obtained 500- dimensional vector representation for eac h no de via DCA. W e observed that our p erformance is stable for different v alues of restart probability b et ween 0.5 and 0.9. W e compared our framew ork to tw o other baseline metho ds. The first baseline is neighb orho o d majority vote (NMV) [28], in whic h predictions are pro duced by prioritizing the functions based on the num b er of times they tag proteins that are directly connected to the target protein. This metho d is not able to mak e use of any information associated with proteins that are more than one hop aw ay from the target. This issue is addressed by the second baseline we considered: diffusion state distanc e (DSD), whic h is the current state-of-the-art, diffusion-based metho d [4]. Here, the diffusion state of each no de is obtained in a similar fashion as DCA. Then for eac h target protein, k most similar proteins, based on the L1 distance metric imp osed ov er the diffusion states, are tak en for a ma jorit y vote. In particular, eac h protein casts a v ote for each of its asso ciated functions with weigh t equal to the recipro cal of the distance to the target protein, and finally the functions are prioritized b y the sum of these votes. W e used k = 10, following the original work that introduced this metho d [4]. The diffusion states can capture longer-range top ological prop erties in addition to the lo cal neigh b orho od, which allo ws DSD to achiev e a large improv emen t in prediction p erformance ov er NMV, as can be seen in Figure 2. Ho wev er, through our DCA frameworks substantial adv ances, it ac hiev es a significan t impro v ement ov er DSD on all three levels of MIPS (Figure 2). This result highligh ts that, b y reducing each diffusion state into a low-dimensional vector using DCA, one can capture functional asso ciations betw een proteins more accurately . One of the strengths of DCA is its ability to easily and principally integrate topological infor- mation from multiple netw orks. This integration is ac hieved b y learning a canonical vector repre- sen tation of proteins that explains their diffusion patterns across all net works, while sim ultaneously capturing netw ork-sp ecific effects using context-specific feature v ectors (see 2.3). In tuitively , this 7 NMV DSD DCA DCAi DCAi-SVM Ac curacy F1 Score MIPS1 MIPS2 MIPS3 MIPS1 MIPS2 MIPS3 0.4 0.5 0.6 0.7 0.8 0.9 0.4 0.5 0.6 0.7 0.3 NMV DSD DCA DCAi DCAi-SVM Figure 2: Protein function prediction p erformance on y east STRING netw orks. DCA (diffusion comp onen t analysis) has substan tially greater accuracy than b oth NMV (neigh b or ma jor- it y v ote) and DSD (diffusion state distance) across all three MIPS levels. W e used 500 dimensions for DCA, DCAi, and DCAi-SVM. approac h is able to capture more fine-grain topological patterns whic h would not b e visible if we w ere to flatten the netw orks in to a single represen tativ e net work, as most do, before analyzing the top ology . By integrating the STRING netw orks with our approach and using the canonical v ectors to guide the ma jority v ote for function prediction based on pairwise cosine distances (denoted as DCAi), w e achiev e impro vemen t on all lev els of MIPS on top of DCA with STRING’s in tegration (Figure 2). This result suggests that functional relations can b e b etter explained by individually mo deling diffusion patterns within each netw ork. T o demonstrate the p oten tial of DCA as a plug-in framew ork for machine learning algorithms, w e cast the protein function prediction task as a multi-label classification problem and applied an off-the-shelf supp ort vector machine (SVM) to olb o x, LIBSVM [29], with the node represen tation from DCA as input features. W e used the radial basis function k ernel and p erformed a nested fiv e-fold cross-v alidation within the training data to select the optimal parameters. The candidate v alues for parameter selection w ere { 0 . 5 , 0 . 25 , 0 . 125 } for the v ariance parameter g and { 0 . 5 , 1 , 2 } for the cost parameter C . With this pip eline, we trained a binary classifier for each function and obtained a p er-class probability score for each protein in the v alidation set. Note that an SVM do es not provide probabilit y outputs b y itself, but LIBSVM supp orts an additional routine to train a logistic mo del on top of the SVM output via cross-v alidation to estimate the probabilities. These probabilit y scores are then used to prioritize candidate functions for each protein, after whic h the prediction performance was ev aluated. Simply b y using an off-the-shelf SVM in this manner with the v ectors from DCAi (denoted as DCAi-SVM), we were able to obtain yet another substan tial p erformance gain in function prediction on all three levels of MIPS, as shown in Figure 2. While one could also apply an SVM with the original, high-dimensional diffusion states as feature represen tation, we found that it p erforms significan tly worse than training the SVM on the DCA v ectors with STRING’s integration (for fair comparison), denoted as DCA-SVM, which suggests 8 Number of Dimensions 0 100 200 300 400 500 Number of Dimensions 0 100 200 300 400 500 Ac curacy F1 Score 0 0.1 0.2 0.3 0.4 0.5 0.6 0.7 0 0.1 0.2 0.3 0.4 0.5 DSD NMV DSD NMV DCA PCA NMF DCA PCA NMF Figure 3: Comparison with other dimensionality reduction metho ds. DCA (diffusion comp onen t analysis) has muc h greater accuracy than principal component analysis (PCA) and non-negativ e matrix factorization (NMF) for different n um b ers of dimensions, esp ecially for few er dimensions. The results are based on ma jorit y v ote prediction where the neigh b orho od is defined with cosine distance. STRING netw orks and MIPS3 annotations are used. Baseline p erformances of NMV and DSD are shown as constants. that DCA is able to find a higher quality feature representation of the input data using muc h fewer dimensions (Supplementary T able 1). F urthermore, DCA-SVM p erforms w orse than DCAi-SVM with our no vel in tegration, implying that eac h of the impro vemen ts w e made is necessary to ac hieve the best p erformance ov erall (Supplemen tary T able 1). After observing the p otential in using few er dimensions to enco de top ological information, we then asked whether other conv en tional approac hes to dimensionality reduction can achiev e similar p erformance impro vemen ts. T o this end, we compared DCA to principal comp onen t analysis (PCA) and non-negativ e matrix factorization (NMF) for differen t n um b ers of dimensions, and the results based on ma jority v ote prediction based on cosine distances are summarized in Figure 3. W e found that DCA significan tly outperforms both PCA and NMF ov erall. The performance gap is ev en more noticeable for few er num b er of dimensions ( ≤ 200), whic h suggests that DCA is effective at extracting meaningful top ological asso ciations even in a highly constrained setting, where the con ven tional approaches tend to suffer, presumably due to the fact that they aim to find a linear em b edding to explain v ariance within the data without directly mo deling the diffusion states as probabilit y distributions. In addition, our results show that the p erformance of DCA is stable ov er a wide range of v alues for the n um b er of dimensions, implying that our framework is robust to o verfitting. Surprisingly , DCA can ac hieve p erformance comparable to DSD, whic h used n = 6400 dimensions, using only 20 dimensions. F urthermore, we found that training SVMs with feature represen tations from PCA and NMF p erform relatively p o orly , whic h provides additional evidence that DCA finds a go o d feature represen tation using a small num b er of dimensions (Supplementary T able 1). In summary , compared to DSD, which is the current state-of-the-art function prediction metho d based on diffusion, we were able to achiev e a 12.31% increase in accuracy and 8.43% increase in 9 the micro-a verage F1 score (see 3.2) on MIPS3, resulting in 71.29% accuracy and 50.40% F1 score, b y using the full DCA framework, which com bines our dimensionality reduction, a nov el netw ork in tegration approac h and SVM classifiers. This is a notable impro vemen t, giv en that DSD impro v es up on NMV — a naive metho d solely based on local top ology — by only 6.94% in accuracy and 4.41% in F1 score on the same data. W e also observed improv ed p erformance o ver DSD in a differen t y east PPI net w ork, constructed only from physical interactions in the BioGRID database (Supplemen tary T able 2). 4 Discussion W e ha v e presen ted Diffusion Comp onen t Analysis (DCA), a nov el analytical method for biological net work analysis. DCA exploits the top ology of the netw ork by diffusion and then computes a low- dimensional but highly informativ e v ector represen tation for no des in the netw ork to appro ximate the diffusion information. DCA can b e naturally extended to in tegrating m ultiple heterogeneous net works by first p erforming diffusion on separate net works and then join tly optimizing feature v ectors. W e ha ve demonstrated DCA in e xploiting functional top ology in molecular netw orks by accu- rately predicting protein function from molecular interaction net work data. W e hav e demonstrated substan tial impro vemen ts ov er the state-of-the-art diffusion-based approach and other dimension- alit y reduction approaches. DCA accurately enco des b oth lo cal and global top ological prop erties for all genes in the netw ork, and th us is v ery useful for predicting gene functions that cannot be simply inferred from the direct in teractome. F urthermore, lo w-dimensional v ectors computed by DCA are a highly informativ e feature for describing the role of proteins in terms of functional top ology , making them readily incorporable into existing mac hine learning methods. In the future, we plan to pursue further improv emen ts in function prediction with DCA. F or example, in this w ork, w e simply used the straigh tforward implemen tation of the sup ervised m ul- tilab el SVM, which is not ideal and prone to o verfitting for sp ecies (e.g. Human and Mouse) with n umerous functional lab els but only sparsely annotated genes. W e b elieve that functional lab el similarit y [7, 30] and gene on tology hierarc h y [31, 32, 33] can b e applied with DCA to address the c hallenges of sup ervised multi-label function prediction. Other features, suc h as sequence or ev o- lutionary information, which provide extra information, can b e naturally combined with DCA. W e also hop e to explore other netw ork-based applications, including iden tifying functional modules, net work-guided enrichmen t analysis, disco vering new gene ontology terms from molecular net work data and netw ork-based approac hes for cancer genomics [12, 34, 35, 36, 37, 38]. References [1] Charlotte M Deane, Luk asz Salwinski, Ioannis Xenarios, and Da vid Eisenberg. Protein interac- tions tw o metho ds for assessment of the reliability of high throughput observ ations. Mole cular & Cel lular Pr ote omics , 1(5):349–356, 2002. [2] Eric M Phizic ky and Stanley Fields. Protein-protein in teractions: metho ds for detection and analysis. Micr obiolo gic al r eviews , 59(1):94–123, 1995. [3] Assen Roguev, Marianna Wiren, Jonathan S W eissman, and Nev an J Krogan. High-throughput genetic in teraction mapping in the fission yeast Schizosacc harom yces p ombe. Natur e metho ds , 4(10):861–866, 2007. [4] Mengfei Cao, Christopher M. Pietras, Xian F eng, Kathryn J. Dorosc hak, Thomas Schaffner, Jiso o Park, Hao Zhang, Lenore J. Cow en, and Benjamin J. Hescott. New directions for 10 diffusion-based netw ork prediction of protein function: Incorporating path wa ys with confi- dence. Bioinformatics , 30(12), 2014. [5] Sara Mostafa vi, Deba jyoti Ra y , Da vid W arde-F arley , Chris Grouios, Quaid Morris, and Others. GeneMANIA: a real-time multiple association netw ork integration algorithm for predicting gene function. Genome biolo gy , 9(Suppl 1):S4, 2008. [6] Elena Nabiev a, Kam Jim, Amit Agarwal, Bernard Chazelle, and Mona Singh. Whole-proteome prediction of protein function via graph-theoretic analysis of interaction maps. Bioinformatics , 21(SUPPL. 1), 2005. [7] Hua W ang, Heng Huang, and Chris Ding. F unction-function correlated multi-label protein function prediction o ver interaction net works. Journal of c omputational biolo gy , 20(4):322– 343, 2013. [8] P eggy I W ang, Sohyun Hw ang, Ro dney P Kincaid, Christopher S Sulliv an, Insuk Lee, and Ed- w ard M Marcotte. RIDDLE: reflectiv e diffusion and local extension rev eal functional asso cia- tions for unannotated gene sets via pro ximit y in a gene net work. Genome biolo gy , 13(12):R125, 2012. [9] Hon Nian Chua, Wing-Kin Sung, and Limso on W ong. Exploiting indirect neigh bours and top o- logical weigh t to predict protein function from protein–protein in teractions. Bioinformatics , 22(13):1623–1630, 2006. [10] Tijana Milenk oviæ and Nata ˇ sa Prˇ zulj. Unco vering biological net work function via graphlet degree signatures. Canc er informatics , 6:257, 2008. [11] Ulas Karaoz, TM Murali, Stan Letovsky , Y u Zheng, Chunming Ding, Charles R Cantor, and Simon Kasif. Whole-genome annotation b y using evidence in tegration in functional-link age net works. Pr o c e e dings of the National A c ademy of Scienc es of the Unite d States of A meric a , 101(9):2888–2893, 2004. [12] Enrico Glaab, Ana ¨ ıs Baudot, Natalio Krasnogor, Reinhard Sc hneider, and Alfonso V alencia. Enric hNet: netw ork-based gene set enrichmen t analysis. Bioinformatics , 28(18):i451—-i457, 2012. [13] Sebastian K¨ ohler, Sebastian Bauer, Denise Horn, and Peter N Robinson. W alking the in terac- tome for prioritization of candidate disease genes. The A meric an Journal of Human Genetics , 82(4):949–958, 2008. [14] Ch ung-Shou Liao, Kanghao Lu, Mic hael Ba ym, Rohit Singh, and Bonnie Berger. Iso- RankN: sp ectral metho ds for global alignment of multiple protein net works. Bioinformatics , 25(12):i253—-i258, 2009. [15] Sak et Navlakha and Carl Kingsford. The p o w er of protein in teraction netw orks for asso ciating genes with diseases. Bioinformatics , 26(8):1057–1063, 2010. [16] Sean R Collins, P atric k Kemmeren, Xue-Chu Zhao, Jac k F Greenblatt, F orrest Sp encer, F rank C P Holstege, Jonathan S W eissman, and Nev an J Krogan. T o ward a comprehensive atlas of the ph ysical interactome of Sacc harom yces cerevisiae. Mole cular & c el lular pr ote omics : MCP , 6(3):439–450, 2007. [17] Anne-Claude Gavin, P atrick Aloy , P aola Grandi, Roland Krause, Markus Bo esc he, Martina Marzio c h, Christina Rau, Lars Juhl Jensen, Sonja Bastuc k, Birgit D ¨ ump elfeld, Angela Edel- mann, Marie-Anne Heurtier, V erena Hoffman, Christian Ho efert, Karin Klein, Man uela Hudak, Anne-Marie Mic hon, Malgorzata Sc helder, Markus Sc hirle, Marita Remor, T atjana Rudi, Sean Ho oper, Andreas Bauer, T ewis Bouwmeester, Georg Casari, Gerard Drewes, Gitte Neubauer, 11 Jens M Rick, Bernhard Kuster, Peer Bork, Rob ert B Russell, and Giulio Superti-F urga. Pro- teome survey rev eals mo dularit y of the yeast cell mac hinery . Natur e , 440(7084):631–636, 2006. [18] Nev an J Krogan, Gerard Cagney , Haiyuan Y u, Gouqing Zhong, Xingh ua Guo, Alexandr Ignatc henko, Joyce Li, Shuy e Pu, Nira Datta, Aaron P Tikuisis, Than uja Punna, Jos´ e M P eregr ´ ın-Alv arez, Mic hael Shales, Xin Zhang, Michael Da vey , Mark D Robinson, Alb erto Pac- canaro, James E Bray , Anthon y Sheung, Bry an Beattie, Da wn P Richards, V eronica Canadien, A tanas Lalev, F rank Mena, Peter W ong, Andrei Starostine, Myra M Canete, James Vlasblom, Sam uel W u, Chris Orsi, Sean R Collins, Shamanta Chandran, Robin Ha w, Jennifer J Rilstone, Kiran Gandi, Natalie J Thompson, Gab e Musso, Peter St Onge, Shaun Ghanny , Mandy H Y Lam, Gareth Butland, Amin M Altaf-Ul, Shigehik o Kanay a, Ali Shilatifard, Erin O’Shea, Jonathan S W eissman, C James Ingles, Timothy R Hughes, John Parkinson, Mark Gerstein, Shoshana J W o dak, Andrew Emili, and Jac k F Greenblatt. Global landscap e of protein com- plexes in the y east Saccharom yces cerevisiae. Natur e , 440(7084):637–643, 2006. [19] Kath y Macrop ol, T olga Can, and Am buj K Singh. RR W: repeated random w alks on genome- scale protein netw orks for lo cal cluster discov ery. BMC bioinformatics , 10(1):283, 2009. [20] Ciy ou Zh u, Richard H Byrd, P eih uang Lu, and Jorge No cedal. Algorithm 778: L-BFGS-B: F ortran subroutines for large-scale b ound-constrained optimization. ACM T r ansactions on Mathematic al Softwar e (TOMS) , 23(4):550–560, 1997. [21] Lourdes P e ˜ na Castillo, Murat T asan, Chad L My ers, Hyunju Lee, T rupti Joshi, Chao Zhang, Y uanfang Guan, Michele Leone, Andrea Pagnani, W an Kyu Kim, and Others. A critical assess- men t of Mus musculus gene function prediction using integrated genomic evidence. Genome biolo gy , 9(Suppl 1):S2, 2008. [22] Soh yun Hwang, Seung Y Rhee, Edw ard M Marcotte, and Insuk Lee. Systematic prediction of gene function in Arabidopsis thaliana using a probabilistic functional gene netw ork. Natur e pr oto c ols , 6(9):1429–1442, 2011. [23] Insuk Lee, Shailesh V Date, Alex T Adai, and Edward M Marcotte. A probabilistic functional net work of y east genes. Scienc e , 306(5701):1555–1558, 2004. [24] Bo W ang, Aziz M Mezlini, F eyyaz Demir, Marc Fiume, Zh uo wen T u, Mic hael Brudno, Ben- jamin Haib e-Kains, and Anna Goldenberg. Similarit y netw ork fusion for aggregating data t yp es on a genomic scale. Natur e metho ds , 11(3):333–337, 2014. [25] Andrea F ranceschini, Damian Szklarczyk, Sune F rankild, Mic hael Kuhn, Milan Simono vic, Alexander Roth, Jianyi Lin, Pablo Minguez, P eer Bork, Christian v on Mering, and Others. STRING v9. 1: protein-protein interaction net works, with increased cov erage and integration. Nucleic acids r ese ar ch , 41(D1):D808—-D815, 2013. [26] Chris Stark, Bobb y-Jo e Breitkreutz, T eresa Reguly , Lorrie Boucher, Ash ton Breitkreutz, and Mik e T y ers. BioGRID: a general rep ository for in teraction datasets. Nucleic acids r ese ar ch , 34(suppl 1):D535—-D539, 2006. [27] Andreas Ruepp, Alfred Zollner, Dieter Maier, Ka j Alb ermann, Jean Hani, Martin Mokrejs, Igor T etko, Ulric h G ¨ uldener, Gertrud Mannhaupt, Martin M ¨ unsterk¨ otter, and Others. The F unCat, a functional annotation sc heme for systematic classification of proteins from whole genomes. Nucleic acids r ese ar ch , 32(18):5539–5545, 2004. [28] Benno Sc hwik o wski, Peter Uetz, and Stanley Fields. A netw ork of protein-protein in teractions in y east. Natur e biote chnolo gy , 18(12):1257–1261, 2000. [29] Chih-Ch ung Chang and Chih-Jen Lin. LIBSVM: a library for support v ector machines. ACM T r ansactions on Intel ligent Systems and T e chnolo gy (TIST) , 2(3):27, 2011. 12 [30] Emre Sefer and Carl Kingsford. Metric lab eling and semi-metric embedding for protein an- notation prediction. In R ese ar ch in c omputational mole cular biolo gy , pages 392–407. Springer, 2011. [31] Wy att T Clark and Predrag Radiv o jac. Information-theoretic ev aluation of predicted on tolog- ical annotations. Bioinformatics , 29(13):i53–i61, 2013. [32] Sara Mostafa vi and Quaid Morris. Using the Gene Ontology hierarc h y when predicting gene function. In Pr o c e e dings of the twenty-fifth c onfer enc e on unc ertainty in artificial intel ligenc e , pages 419–427. AUAI Press, 2009. [33] Xiao yu Jiang, Naoki Nariai, Martin Steffen, Simon Kasif, and Eric D Kolaczyk. In tegra- tion of relational and hierarchical net work information for protein function prediction. BMC bioinformatics , 9(1):350, 2008. [34] Alex J Cornish and Florian Marko w etz. SANT A: quan tifying the functional conten t of molec- ular net w orks. PL oS c omputational biolo gy , 10(9):e1003808, 2014. [35] Jan usz Dutko wski, Michael Kramer, Mic hal A Surma, Rama Balakrishnan, J Mic hael Cherry , Nev an J Krogan, and T rey Idek er. A gene ontology inferred from molecular netw orks. Natur e biote chnolo gy , 31(1):38–45, 2013. [36] Matan Hofree, John P Shen, Hannah Carter, Andrew Gross, and T rey Idek er. Netw ork-based stratification of tumor m utations. Natur e metho ds , 10(11):1108–15, 2013. [37] Igor Ulitsky and Ron Shamir. Identification of functional mo dules using netw ork top ology and high-throughput data. BMC systems biolo gy , 1:8, 2007. [38] Nir Y osef, Lior Ungar, Einat Zalckv ar, Adi Kimc hi, Martin Kupiec, Eytan Ruppin, and Ro ded Sharan. T ow ard accurate reconstruction of functional protein netw orks. Mole cular systems biolo gy , 5(1), 2009. 13 Supplementary T able 1 Summary of function prediction performance on STRING networks for all three levels of MIPS annotations. NMV denotes Neighborhood Majority V ote. DSD denotes Diffusion State Distance method of Cao et al., 2014. DS-SVM denotes training SVM on the full n-dimensional diffusion states. The numbers appended to DCA (diffusion component analysis), PCA (principal component analysis), NMF (nonnegative matrix factorization) represent the number of dimensions used for each dimensionality reduction method. DCAi incorporates our novel network integration approach. Mean Stdev Mean Stdev Mean Stdev Mean Stdev Mean Stdev Mean Stdev NMV 70.30% 1.77% 52.26% 0.82% 60.39% 1.50% 41.66% 0.81% 52.05% 1.55% 37.57% 0.93% DSD 74.03% 1.22% 54.63% 0.73% 65.46% 1.57% 45.75% 0.76% 58.99% 1.58% 41.98% 0.82% DS-SVM 76.26% 1.16% 56.56% 0.63% 69.20% 1.82% 48.87% 0.51% 64.80% 1.78% 45.69% 0.69% DCA-5 65.32% 1.29% 48.45% 0.73% 53.30% 1.44% 36.95% 0.92% 45.66% 1.41% 33.06% 0.85% DCA-10 72.05% 1.24% 52.85% 0.72% 62.48% 1.54% 43.74% 0.95% 55.25% 1.60% 39.82% 0.99% DCA-20 74.28% 1.31% 54.39% 0.77% 65.52% 1.53% 46.35% 0.93% 59.68% 1.45% 43.16% 0.82% DCA-50 76.77% 1.41% 56.39% 0.78% 69.09% 1.57% 49.23% 0.91% 63.92% 1.63% 46.62% 1.04% DCA-100 76.55% 1.26% 56.69% 0.73% 69.43% 1.51% 49.25% 0.97% 64.03% 1.77% 46.79% 1.06% DCA-200 76.89% 1.35% 56.92% 0.80% 69.78% 1.32% 49.85% 0.90% 64.44% 1.65% 47.37% 0.97% DCA-500 76.63% 1.30% 56.93% 0.72% 69.70% 1.41% 49.99% 0.83% 64.40% 1.69% 47.14% 1.05% DCA-500-SVM 78.75% 0.84% 58.05% 0.62% 74.55% 1.08% 52.36% 0.64% 69.91% 1.82% 48.73% 0.59% PCA-5 31.74% 1.25% 29.02% 0.74% 16.38% 1.05% 12.98% 0.63% 10.53% 0.89% 8.70% 0.58% PCA-10 31.21% 1.45% 28.86% 0.80% 16.42% 1.08% 13.06% 0.59% 10.62% 0.86% 8.65% 0.58% PCA-20 31.34% 1.37% 28.85% 0.63% 16.23% 1.09% 13.06% 0.55% 10.51% 0.91% 8.68% 0.59% PCA-50 31.51% 1.51% 28.95% 0.69% 16.22% 1.09% 13.00% 0.55% 10.47% 0.98% 8.66% 0.55% PCA-100 54.90% 1.44% 42.68% 0.75% 39.97% 1.41% 28.89% 0.81% 31.89% 1.45% 23.51% 0.74% PCA-200 71.34% 1.35% 52.45% 0.79% 61.65% 1.49% 42.76% 0.87% 55.29% 1.73% 39.78% 1.14% PCA-500 74.06% 1.1 1% 54.47% 0.75% 67.51% 1.49% 47.00% 0.91% 60.87% 1.87% 43.89% 1.10% PCA-500-SVM 74.29% 1.84% 54.13% 0.67% 66.92% 1.20% 45.94% 0.86% 59.73% 1.26% 40.75% 0.60% NMF-5 25.05% 1.34% 25.15% 0.71% 9.94% 0.82% 9.68% 0.49% 6.07% 0.69% 5.75% 0.45% NMF-10 25.85% 1.37% 26.05% 0.82% 11 . 1 2 % 0.91% 10.26% 0.55% 7.05% 0.82% 6.49% 0.46% NMF-20 26.51% 1.1 1% 26.55% 0.59% 11 . 4 9 % 1.05% 11 . 0 7 % 0.60% 7.75% 0.89% 7.21% 0.51% NMF-50 27.02% 1.36% 27.17% 0.69% 13.45% 1.09% 12.32% 0.55% 9.41% 0.95% 8.36% 0.51% NMF-100 31.08% 1.25% 29.72% 0.81% 16.53% 1.17% 14.42% 0.62% 12.72% 1.06% 10.92% 0.58% NMF-200 47.92% 1.48% 39.19% 0.75% 33.58% 1.40% 25.01% 0.77% 28.48% 1.46% 20.96% 0.90% NMF-500 59.45% 1.48% 45.39% 0.77% 48.07% 1.55% 34.06% 0.82% 42.92% 1.58% 31.10% 0.91% NMF-500-SVM 62.57% 1.20% 45.59% 0.46% 51.35% 1.74% 33.93% 0.72% 44.94% 2.19% 31.26% 1.36% DCAi-500 78.53% 1.36% 57.96% 0.79% 71.95% 1.36% 51.96% 0.90% 66.33% 1.50% 48.41% 0.88% DCAi-500-SVM 81.54% 1.27% 58.23% 0.75% 75.83% 1.68% 53.53% 0.67% 71.29% 1.41% 50.40% 1.10% STRING MIPS1 MIPS2 MIPS3 Accuracy F1 score Accuracy F1 score Accuracy F1 score 14 Supplementary T able 2 Summary of function prediction performance on BioGRID physical PPI networks for all three levels of MIPS annotations. NMV denotes Neighborhood Majority V ote. DSD denotes Diffusion State Distance method of Cao et al., 2014. DS-SVM denotes training SVM on the full n-dimensional diffusion states. The numbers appended to DCA (diffusion component analysis), PCA (principal component analysis), NMF (nonnegative matrix factorization) represent the number of dimensions used for each dimensionality reduction method. Mean Stdev Mean Stdev Mean Stdev Mean Stdev Mean Stdev Mean Stdev NMV 51.82% 1.51% 43.53% 0.86% 44.33% 1.60% 32.30% 0.97% 40.60% 1.51% 30.91% 0.81% DSD 67.42% 1.26% 51.15% 0.77% 55.32% 1.48% 40.97% 0.91% 51.08% 1.59% 38.64% 0.99% DS-SVM 67.86% 1.54% 51.69% 0.82% 56.26% 2.09% 41.03% 0.99% 50.09% 1.44% 37.86% 0.68% DCA-5 54.67% 1.41% 43.54% 0.78% 42.77% 1.43% 31.07% 0.93% 38.10% 1.32% 27.94% 0.81% DCA-10 63.09% 1.38% 48.21% 0.75% 50.95% 1.51% 37.16% 0.90% 46.88% 1.62% 34.89% 1.03% DCA-20 66.29% 1.37% 50.59% 0.73% 54.93% 1.71% 40.29% 0.95% 51.54% 1.51% 38.26% 0.94% DCA-50 67.04% 1.52% 51.38% 0.83% 56.63% 1.33% 41.47% 0.94% 52.70% 1.59% 39.53% 1.08% DCA-100 66.73% 1.42% 51.49% 0.80% 56.56% 1.55% 41.39% 0.97% 52.69% 1.62% 39.65% 1.06% DCA-200 67.23% 1.65% 51.54% 0.89% 57.29% 1.40% 41.75% 0.88% 52.88% 1.63% 39.81% 1.05% DCA-500 67.47% 1.45% 51.92% 0.75% 57.54% 1.32% 41.87% 0.81% 52.83% 1.67% 39.85% 1.00% DCA-500-SVM 71.75% 1.37% 53.57% 1.13% 59.92% 1.01% 43.40% 0.83% 54.56% 1.31% 39.91% 1.10% PCA-5 38.20% 1.57% 32.94% 0.83% 20.15% 1.31% 16.65% 0.72% 14.71% 1.12% 12.14% 0.65% PCA-10 43.78% 1.48% 36.22% 0.79% 26.99% 1.40% 20.91% 0.76% 20.43% 1.24% 16.08% 0.76% PCA-20 53.49% 1.40% 41.66% 0.76% 38.91% 1.43% 28.59% 0.87% 32.10% 1.59% 24.56% 0.94% PCA-50 59.60% 1.64% 46.10% 1.06% 46.57% 1.72% 34.25% 1.03% 42.29% 1.57% 31.66% 1.03% PCA-100 62.50% 1.44% 48.47% 0.78% 50.90% 1.52% 37.15% 0.89% 46.42% 1.59% 35.18% 1.06% PCA-200 65.14% 1.38% 49.64% 0.81% 53.36% 1.54% 39.22% 0.88% 48.53% 1.71% 37.21% 1.10% PCA-500 66.31% 1.42% 50.60% 0.82% 56.02% 1.35% 40.76% 0.82% 50.94% 1.50% 38.62% 0.97% PCA-500-SVM 67.12% 1.17% 50.46% 0.63% 53.93% 1.06% 38.28% 0.69% 47.22% 1.44% 34.88% 0.93% NMF-5 27.65% 1.27% 27.41% 0.80% 12.21% 0.90% 11 . 3 0 % 0.58% 7.15% 0.89% 6.82% 0.47% NMF-10 31.33% 1.27% 28.73% 0.73% 14.54% 0.97% 12.75% 0.57% 9.77% 0.99% 8.78% 0.58% NMF-20 33.48% 1.23% 30.81% 0.68% 17.79% 1.16% 15.54% 0.64% 12.31% 1.05% 11 . 11 % 0.63% NMF-50 37.95% 1.44% 33.72% 0.82% 22.97% 1.12% 19.50% 0.70% 19.01% 1.04% 16.01% 0.72% NMF-100 56.73% 1.55% 45.31% 0.85% 45.38% 1.44% 34.18% 0.89% 42.38% 1.61% 32.41% 1.19% NMF-200 62.45% 1.58% 47.86% 0.88% 51.10% 1.52% 37.44% 0.95% 46.71% 1.53% 35.70% 1.04% NMF-500 64.43% 1.54% 49.36% 0.84% 53.84% 1.42% 38.86% 0.90% 49.45% 1.49% 37.12% 0.95% NMF-500-SVM 63.23% 1.12% 48.21% 0.80% 51.98% 1.68% 37.40% 0.98% 47.09% 1.18% 34.44% 0.80% BioGRID MIPS1 MIPS2 MIPS3 Accuracy F1 score Accuracy F1 score Accuracy F1 score 15
Original Paper
Loading high-quality paper...
Comments & Academic Discussion
Loading comments...
Leave a Comment