Rank discriminants for predicting phenotypes from RNA expression
Statistical methods for analyzing large-scale biomolecular data are commonplace in computational biology. A notable example is phenotype prediction from gene expression data, for instance, detecting human cancers, differentiating subtypes and predict…
Authors: Bahman Afsari, Ulisses M. Braga-Neto, Donald Geman
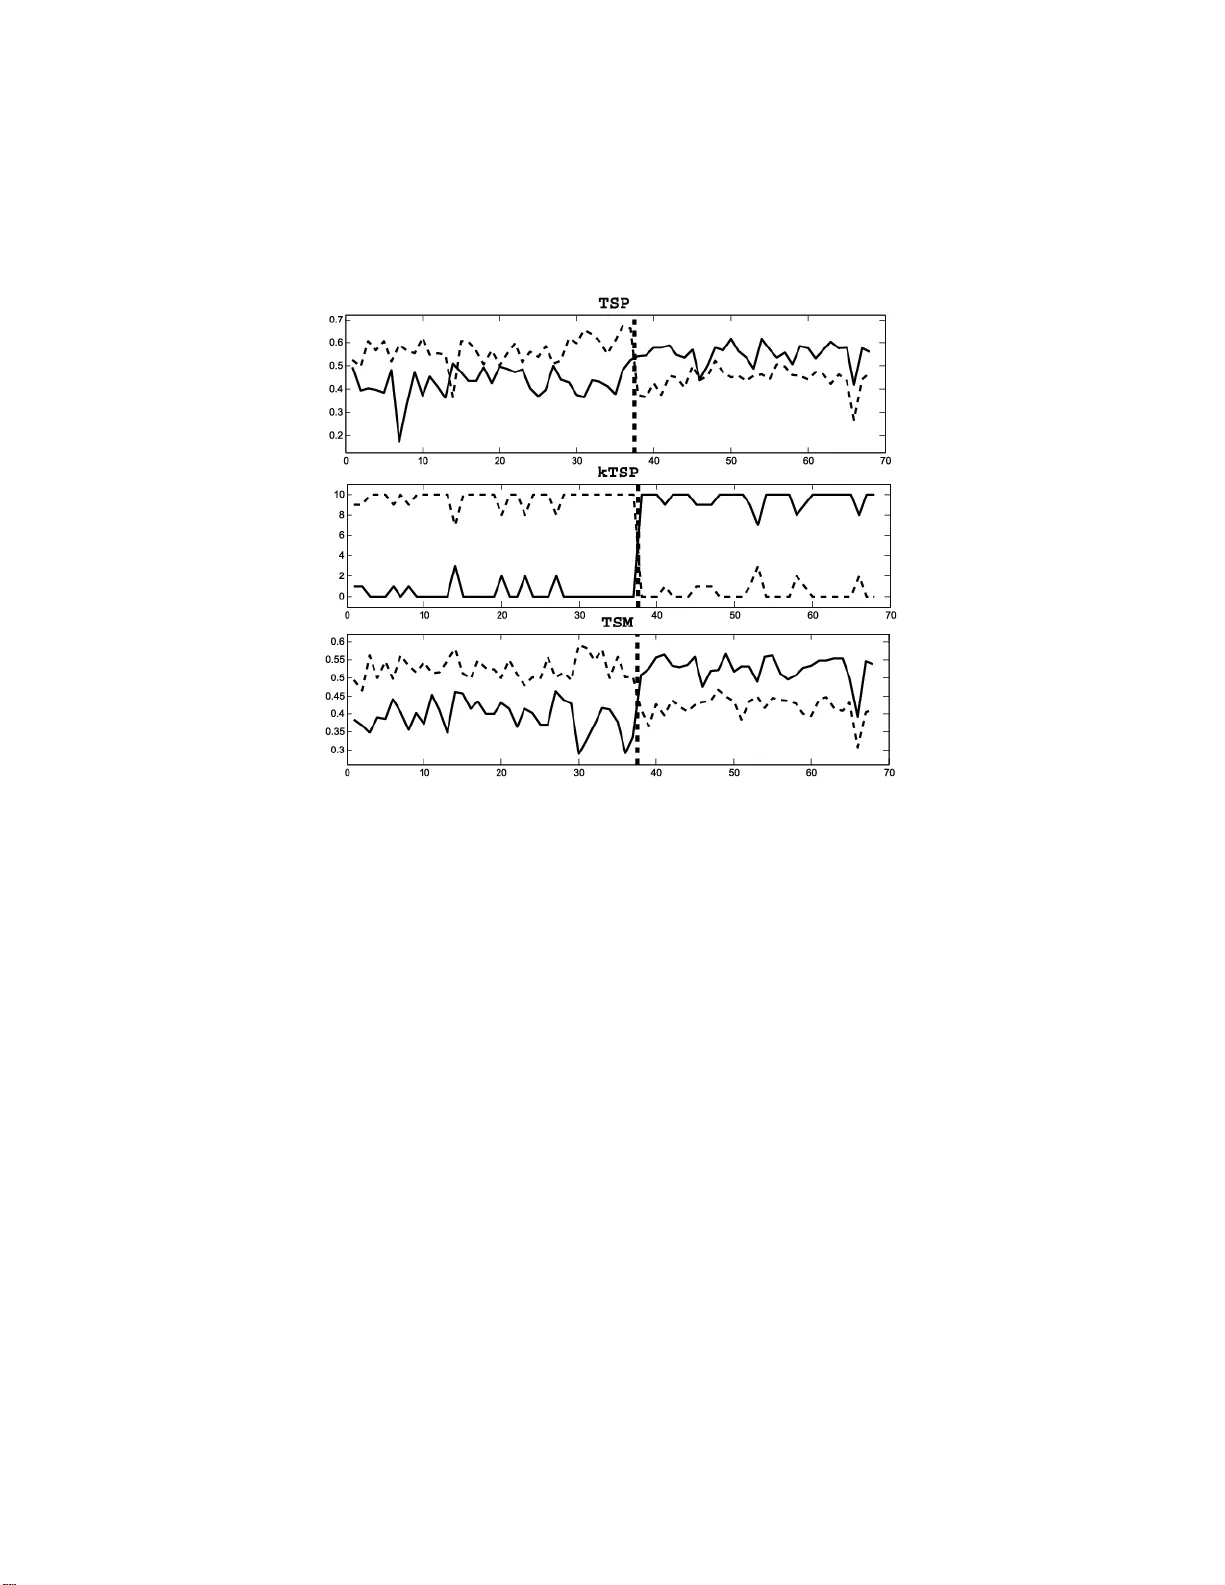
The Annals of Applie d Statistics 2014, V ol. 8, No. 3, 1469–149 1 DOI: 10.1214 /14-A OAS738 c Institute of Mathematical Statistics , 2014 RANK DISCRIMINANTS F OR PRED IC TING PHENOTYPES FR OM RNA EXPRE SSION By Bahman Afsa ri 1 , ∗ , Ulisses M. Braga-Neto 2 , † and Donald Geman 1 , ∗ Johns Hopkins University ∗ and T exas A&M University † Statistical meth od s for analyzing large-scale biomolecular data are commonplace in comput ational biology . A notable example is phenotype prediction from gene expression data, for instance, de- tecting human cancers, differentiating subt yp es and p redicting clini- cal outcomes . Still, clinical applications rema in sca rce. One reason is that the complexity of the decision rules that emerge from standard statistical learning imp edes biological un derstanding, in particular, any mechanistic interpretation. Here we explore decision ru les for bi- nary class ification utilizing only the ordering of expression among sever al genes; the basic building blo cks are then tw o-gene expression comparisons. The si mplest ex ample, just one comparison, is the TSP classifier, which has app eared in a v ariety of cancer-related discov ery studies. Decision rules based on multiple comparisons can better ac- commodate class heterogeneit y , and thereb y increase accuracy , and migh t provide a link with biological mec h anism. W e consider a gen- eral framew ork (“rank-in-context”) for designing discriminan t func- tions, including a data-driven selection of the number and identity of the genes in the su p p ort (“con text”). W e then sp ecialize to tw o examples: v oting among sev eral pairs and comparing the median ex- pression in tw o groups of genes. Comprehensive exp eriments assess accuracy relative to other, more complex, metho ds, and reinforce ear- lier observ ations that simple classifiers are competitive. 1. In tro du ction. Statistical m etho ds for analyzing high-dimensional bio- molecular data generate d with high-throughput tec hn ologies p er m eate the literature in computational biolog y . Such analyses ha ve un co ve r ed a great deal of information ab out biological pro cesses, suc h as imp ortan t m u tations Received December 2012; revised March 2014 . 1 Supp orted b y NIH-NCRR Gran t UL1 RR 02 5005. 2 Supp orted b y the National Science F oundation through a w ard CCF-0845407. Key wor ds and phr ases. Cancer cla ssification, gene expression, rank dis criminant, order statistics. This is an electronic repr int of the original article published b y the Institute o f Ma thema tical Statistics in The Annals of Applie d Statistics , 2014, V ol. 8, No. 3, 1469–14 91 . This r eprint differs from the o r iginal in pagination and typog raphic detail. 1 2 B. AFSARI, U. M. BRA GA-NETO AND D. GEMAN and lists of “marke r genes” asso ciated with common diseases [Jones et al. ( 2008 ), T h omas et al. ( 200 7 )] and ke y in teractions in transcriptional regula- tion [Auffra y ( 2007 ), Lee et al. ( 2008 )]. Our int erest here is learning classifiers that can distinguish betw een cellular p henot yp es fr om mRNA transcript lev- els collected fr om cells in assa yed tissue, with a pr imary fo cus on the struc- ture of the prediction r ules. Our w ork is m otiv ated b y applicat ions to genetic diseases suc h as cancer, where malignan t ph enot yp es arise f r om th e net ef- fect of in teractions among m u ltiple genes and other molecular agen ts w ithin biologica l net works. Statistica l metho d s can en hance our understanding b y detecting the pr esence of disease (e.g., “tumor” vs “normal”), discrimin at- ing among cancer subtyp es (e.g., “GIST” vs “LMS” or “BR CA1 m utation” vs “ no BR CA1 m utation”) and predicting clinical outcomes (e.g., “p o or prognosis” vs “goo d pr ognosis”). Whereas the need for statistical metho ds in biomedicine con tinues to gro w, th e effect s on clinical practice of existing classifiers based on gene expression are widely ac kn o wledged to remain limited; see Altman et al. ( 2011 ), Marshall ( 20 11 ), Ev ans et al. ( 2011 ) and th e discu ssion in Winslo w et al. ( 201 2 ). One barrier is the study-to-study div ersit y in rep orted predic- tion accuracies and “signatures” (lists of discriminating genes). Some of this v ariation can b e attributed to the o verfitting that results from the unf a vo r - able ratio of the sample size to the num b er of p oten tial biomarkers, that is, the infamous “small n , large d ” dilemma. Typically , the n u mb er of samples (c hips, profiles, p atien ts) p er class is n = 10–1000, whereas the n u m b er of features (exons, transcripts, genes) is usually d = 1000–50 ,000; T able 1 dis- pla ys the sample s izes and the n um b ers of features f or t we n t y-one p u blicly a v ailable data sets in volving tw o ph enot yp es. Complex decision ru les are obstacles to mature applications. The classi- fication metho d s ap p lied to biologica l data were usually designed for other purp oses, such as impro ving statistic al learning or applications to vision and sp eec h , with little emphasis on tr ansparency . Sp ecifically , the rules gen- erated b y nearly all standard, off-the-shelf tec hniques applied to genomics data, s u c h as neural net w orks [Bicciato et al. ( 2003 ), Blo om et al. ( 200 4 ), Khan et al. ( 2001 )], multiple decision trees [Boulesteix, T utz and Strim- mer ( 2003 ), Zhang, Y u and Singer ( 2003 )], supp ort v ector mac hines [Peng et al. ( 2003 ), Y eang et al. ( 200 1 )], b o osting [Qu et al. ( 2002 ), Dettling and Buhlmann ( 2003 )] and linear discriminan t analysis [Guo, Hastie and Tibshi- rani ( 2007 ), Tibshirani et al. ( 200 2 )], u s ually inv olv e nonlinear functions of h u ndreds or thousands of genes, a great many p arameters, and are therefore to o complex to c haracterize mec hanistically . In cont rast, follo w-up studies, for instance, ind ep endent v alidation or ther- ap eutic devel opmen t, are usu ally based on a relativ ely small num b er of biomark ers and usually require an un derstanding of the r ole of the genes RANK DISCRIMINA NTS 3 T able 1 The data sets: twenty-one data sets involving two dise ase-r elate d phenotyp es (e.g., c anc er vs normal tissue or two c anc er subtyp es), il lustr ating the “smal l n , lar ge d ” situation. The m or e p atholo gic al phenotyp e is lab el e d as class 1 when this information is avail able Study Class 0 (size) Class 1 (size) Prob es d Reference D1 Colon Normal (22) T umor (40) 2000 Alon et al. ( 1999 ) D2 BRC A1 Non-BRCA1 ( 93) BRC A1 (25) 1658 Lin et al. ( 2009 ) D3 CNS Classic (25) Desmoplastic (9) 7129 P omero y et al. ( 2002 ) D4 DLBC L DLBCL (58) FL (19) 7129 Shipp et al. ( 2002 ) D5 Lung Mesothelioma (150) ADCS (31) 12 , 533 Gordon et al. ( 2002 ) D6 Marfan Normal (41) M arfan (60) 4123 Y ao et al. ( 2007 ) D7 Crohn’s Normal (42) Crohn’s (59) 22 , 283 Burczynski et al. ( 2006 ) D8 Sarcoma GIST (37) LMS (31) 43 , 931 Price et al. ( 2007 ) D9 Squamous Normal (22) Head–neck (22) 12 , 625 Kuriakose , Chen et al. ( 2004 ) D10 GCM Normal (90) T umor (190) 16 , 063 Rama sw amy et al. ( 2001 ) D11Leukemia 1 ALL (25) AML (47) 7129 Golub et al. ( 1999 ) D12Leukemia 2 AML1 (24) AML2 (24) 12 , 564 Armstrong et al. ( 2002 ) D13Leukemia 3 ALL(710) AML (501) 19 , 896 K ohlmann et al. ( 2008 ) D14Leukemia 4 N ormal (138) AML (403) 19 , 896 Mi lls et al. ( 2009 ) D15 Prostate 1 Normal (50) T umor (52) 12 , 600 Singh et al. ( 2002 ) D16 Prostate 2 Normal (38) T umor (50) 12 , 625 Stuart et al. ( 2004 ) D17 Prostate 3 N ormal (9) T umor (24) 12 , 626 W elsh et al. ( 2001 ) D18 Prostate 4 Normal (25) Primary (65) 12 , 619 Y ao et al. ( 2004 ) D19 Prostate 5 P rimary (25) Metastatic (65) 12 , 558 Y ao et al. ( 2004 ) D20 Breast 1 ER-p ositiv e (61) ER-negative(36) 16 , 278 Enerly et al. ( 2011 ) D21 Breast 2 ER-p ositive (127) ER-negative (80) 9760 Buffa et al. ( 2011 ) and gene pro du cts in the cont ext of molecular pathw a ys. Ideally , the d e- cision rules could b e interpreted mec hanistically , for instance, in terms of transcriptional regulation, and b e robust w ith r esp ect to parameter set- tings. Consequen tly , what is notably missing from the large b o d y of work applying classificat ion metho dology to computational genomics is a solid link with p otentia l mec h an ism s, whic h seem to b e a necessary condition for “translational medicine” [Winslow et al. ( 2012 )], that is, drug dev elopment and clinical diagnosis. These translatio nal ob jectiv es, and small-sample issues, argue for limit- ing the num b er of parameters and in tro ducing strong constraints. The t wo principal ob jectiv es for the family of classifiers describ ed here are as follo ws: • Use elementa ry and paramete r-free building blo c ks to assemble a classifier whic h is determined by its sup p ort. • Demonstrate that suc h classifiers can b e as discriminating as those that emerge from the most p o w erf ul metho d s in statistical learning. The bu ilding blo cks we c h o ose are tw o-gene comparisons, whic h w e view as “biologic al switc hes” wh ic h can b e dir ectly related to r egulatory “motifs” 4 B. AFSARI, U. M. BRA GA-NETO AND D. GEMAN or other prop erties of transcrip tional net works. Th e d ecision rules are then determined b y expression orderings. Ho we v er, explicitly connecting statisti- cal classification and molecular mechanism for particular diseases is a ma jor c hallenge and is well b eyond the scop e of this pap er; by our construction w e are an ticipating our longer-term goa l of incorp orating mechanism b y delin- eating candidate motifs using p rior biolog ical kno wledge. Some commen ts on th e r elationship b et we en comparisons and regulation app ear in the con- cluding sectio n. T o meet our sec ond ob j ectiv e, w e measure the p erformance of our comparison-based classifiers r elativ e to t wo p opular alternativ es, namely , supp ort ve ctor mac hines and P AM [Tibshiran i et al. ( 2002 )], a v arian t of linear d iscriminan t analysis . The “metric” c hosen is the estimated err or in m u ltiple runs of tenfold cross-v alidation for eac h of the t we n t y-one real data sets in T able 1 . (Compu tational cost is not considered; applying any of our comparison-based decision rules to a new sample is virtually instanta neous.) Whereas a comprehensiv e simula tion study could b e condu cted, f or example, along the lines of th ose in Guo, Hastie and Tibsh irani ( 2005 ), Zhang et al. ( 2006 ) and F an and F an ( 2008 ) based on Gaussian mo dels of microarra y data, r ather our inten tion is different: sho w that ev en wh en the num b er of parameters is s m all, in fact, the decision rule is determined by the supp ort, the accuracy measured by cross-v alidation on real data is n o w orse than with curr en tly a v ailable classifiers. More precisely , all the classifiers studied in this pap er are based on a gen- eral r ank discriminant g ( X ; Θ), a real-v alued fu nction on the ranks of X o ve r a (p ossibly ordered) subset of genes Θ, called the c ontext of the classi- fier. W e are searc hing for characte ristic p erturbations in this ordering from one p h enot yp e to another. T he TSP classifier is the simplest examp le (see Section 2 ), and the decision rule is illustrated in Figure 1 . This data set has expression profiles for t w o kinds of gastroin testinal cancer (gastroin testinal stromal-GIST, leiom y osarcoma-LMS) whic h are difficu lt to distinguish clin- ically b ut requir e v ery differen t treatmen ts [Price et al. ( 2007 )]. Eac h p oin t on th e x -axis corresp onds to a sample, and the ve rtical dashed line separates the tw o p henot yp es. The y -axis rep resen ts expression; as seen, the “rev ersal” of the order in g of the expressions of the tw o genes identi fies the phenot yp e except in t wo samples. Eviden tly , a great deal of information ma y b e lost by con v erting to ranks, particularly if th e expression v alues are high resolution. But there are tec h- nical adv an tages to basing prediction on ranks, including redu cing study-to- study v ariations due to data normalization and prep ro cessing. Rank-based metho ds are eviden tly in v ariant to general m on otone transformations of the original expr ession v alues, suc h as the widely-used quantile normalization [Bloate d, Irizarry and Sp eed ( 2004 )]. Th u s, metho ds based on ranks can RANK DISCRIMINA NTS 5 Fig. 1. R esults of thr e e r ank-b ase d classifiers for differ entiating two c anc er subtyp es, GIST and LMS. The tr aining set c onsists of 37 GIST samples and 31 LMS samples (sep- ar ate d by the vertic al dashe d li ne); e ach sample pr ovides me asur ements for 43,931 tr an- scripts. TSP : expr ession values for the two genes sele cte d by the TSP algorithm. KTSP : the numb er of votes for e ach class among the K = 10 p ai rs of genes sele cte d by the KTSP algorithm. TSM : me dian expr essions of two sets of genes sele cte d by the TSM al gorithm. com bine in ter-study microarra y data without the need to p erform data nor- malizatio n, thereby increasing sample size. Ho we v er, our principal motiv ation is complexit y reduction: sev erely limit- ing the n u m b er of v ariables and parameters, and in fact in tro d ucing what w e call r ank-in-c ontext (RIC) discr im in an ts whic h dep end on th e training d ata only through the con text. The classifier f is then defin ed by thresh olding g . This implies that, given a con text Θ, the RIC classifier corresp onds to a fixe d decision b oundary , in the sense that it do es not dep end on the train- ing data. This su fficiency prop erty helps to redu ce v ariance b y rend ering the classifiers r elativ ely in s ensitiv e to small d isturbances to the ranks of the training data and is therefore esp ecially suitable to small-sample settings. Naturally , the p erformance critically dep ends on the appropr iate choic e of Θ. W e prop ose a s im p le yet p o w erful pro cedure to select Θ from the training data, partly inspir ed by the prin ciple of analysis of v ariance and inv olving the sample means and sample v ariances of the empirical distribution of g under the t w o classes. In particular, we d o not b ase the choice d ir ectly on minimizing er r or. 6 B. AFSARI, U. M. BRA GA-NETO AND D. GEMAN W e consider t wo examples of th e general framework. The first is a new metho d for learnin g the con text of KTSP , a previous extension of TSP to a v ariable num b er of p airs. T he decision ru le of th e KTSP classifier is th e ma jorit y vote among the top k pairs of genes, illustrated in Figure 1 f or k = 10 for the s ame data s et as ab ov e. In previous statistica l and applied w ork [T an et al. ( 200 5 )], the parameter K (the n u mb er of comparisons) w as determined by an inner loop of cross-v alidation, wh ic h is sub ject to o ve rfitting with small samples. W e also pr op ose comparing the median of expression b et we en t w o sets of genes; this T op-Sc oring Me dian ( TSM ) rule is also illus trated in Figure 1 . As can b e seen, the difference of the medians generally has a larger “margin” than in the sp ecial case of singleton sets, that is, TSP . A summary of all the m etho ds is giv en in T able 2 . After reviewing related w ork in the follo wing sectio n, in Section 3 w e present the classificatio n scenario, p rop ose our general statistical framework and fo cus on t wo examples: KTSP and TSM . T he exp er im ental resu lts are in Section 4 , where comparisons are drawn, and we conclude with some discussion ab out the underlying biology in Section 5 . 2. Previous and related wo rk. Ou r work build s on previous studies an- alyzing transcriptomic data solely based on the r elative expr ession among a small num b er of trans cripts. The simp lest example, the T op-Scoring P air ( TSP ) classifier, w as in tro duced in Geman et al. ( 200 4 ) and is b ased on t wo genes. V arious extensions and illustrations app eared in Xu et al. ( 2005 ), Lin et al. ( 2009 ) and T an et al. ( 2005 ). Applications to p h enot yp e classifi- cation in clud e differen tiating b etw een stomac h cancers [Price et al. ( 2007 )], predicting treatmen t resp onse in breast cancer [W eic hselbaum et al. ( 2008 )] and acute my eloid leuk emia [Raponi et al. ( 2008 )], detecting BR CA1 m u - tations [Lin et al. ( 2009 )], grading p rostate cancers [Zhao, Logothetis and Gorlo v ( 2010 )] and separating div erse h u man pathologies assa yed through blo o d-b orne leuk o cytes [Edelman et al. ( 2009 )]. In Geman et al. ( 2004 ) and subsequent pap ers ab out TSP , th e discrim - inating p o wer of eac h pair of genes i, j wa s measured by the absolute dif- ference b etw een th e probabilities of the ev en t that gene i is exp ressed more than gene j in the tw o classes. These pr obabilities we re estimated from training data and (binary) classification resu lted f r om v oting among all to p- scoring pairs. In Xu et al. ( 2005 ) a secondary score wa s introd uced which pro v id es a unique top-scoring pair. In addition, v oting w as extended to the k highest-scoring pairs of genes. The motiv ation for this KTSP classifier and other extensions [T an et al. ( 2005 ), Anderson et al. ( 200 7 ), Xu, Geman and Winslo w ( 2007 )] is that more genes ma y b e needed to detect cancer pathogenesis, esp ecially if the principle ob jectiv e is to c haracterize as we ll as recognize the pr o cess. Finally , in a precursor to th e work here [Xu, Ge- man and Winslow ( 2007 )], the t wo genes in TSP we re r eplaced by tw o RANK DISCRIMINA NTS 7 T able 2 Summary of r ank di scriminants. Fi rst c olumn: the r ank-b ase d classifiers c onsider e d in this p ap er. Se c ond c olumn: the struc tur e of the c ontext Θ k , the genes app e aring in the classifier; for k TSP and TSM , Θ k c ontains 2 k genes . Thir d c olumn: the f orm of the r ank discriminant; the classifier is f ( X ) = I ( g ( X ) > 0) . F ourth c olumn: the sele ction of the c ontext fr om tr aining data. F or a fixe d k we sele ct Θ k to maxim i ze ˆ δ , and then cho ose k to maximize ˆ δ normali ze d by ˆ σ Pa rameters Discriminant Pa rameter selection General (Θ k , k ) g ( X ; Θ k ) Θ k ⊂ { 1 , . . . , d } ˆ δ (Θ k ) = b E ( g ( X ; Θ k ) | Y = 1) − b E ( g ( X ; Θ k ) | Y = 0) Θ ∗ k = arg max Θ k ˆ δ (Θ k ) ˆ σ (Θ k ) = q d V ar( g | Y = 0) + d V ar( g | Y = 1) k ∗ = arg max k ˆ δ (Θ ∗ k ) ˆ σ (Θ ∗ k ) Examples TSP Θ = ( i, j ) g TSP = I ( X i < X j ) − 1 2 Θ ∗ = arg max ( i,j ) ∈ Θ ˆ s ij ˆ s ij = P ( X i < X j | Y = 1) − P ( X i < X j | Y = 0) KTSP Θ k = { i 1 , j 1 , . . . , i k , j k } g KTSP = P k r =1 [ I ( X i r < X j r ) − 1 2 ] Θ ∗ k = arg max Θ k P k r =1 ˆ s i r j r TSM Θ k = G + k ∪ G − k g TSM = med j ∈ G + k R j − med i ∈ G − k R i G − k = { i 1 , . . . , i k } R i : rank of gene i in G + k ∪ G − k Θ ∗ k ≈ arg max Θ k P i ∈ G − k ,j ∈ G + k ˆ s ij G + k = { j 1 , . . . , j k } 8 B. AFSARI, U. M. BRA GA-NETO AND D. GEMAN equally-sized sets of genes and th e av erage ranks w ere compared. Sin ce the direct extension of TSP score maximization was computationally imp ossi- ble, and lik ely to b ad ly ov er fi t th e data, the sets we r e selected b y splitting top-scoring pairs and rep eated ran d om sampling. Although ad ho c, th is pro cess f urther demonstr ated the discriminating p o wer of ran k statistics for microarra y data. Finally , there is some related w ork ab out ratios of concen trations (which are natural in chemical terms) for diagnosis and prognosis. T hat w ork is not rank-based but retains in v ariance to s caling. Golub et al. ( 1999 ) dis- tinguished b et ween malignan t pleural m esothelioma (MPM) and adeno car- cinoma (ADCA) of the lung b y com b ining multiple ratios into a sin gle d i- agnostic to ol, and Ma et al. ( 2004 ) found th at a tw o-gene expression ratio deriv ed from a ge n ome-wide, oligon ucleotide m icroarra y analysis of estrogen receptor (ER)-p ositive , in v asive breast cancers p redicts tu mor relapse and surviv al in patien ts tr eated with tamo xifen, which is crucial for early-stage breast cancer managemen t. 3. Rank-in-con text classification. In this section w e in tr o duce a general framew ork f or rank-based classifiers using comparisons among a limited n u m b er of gene expressions, called the c ontext . In addition, we d escrib e a general metho d to select the con text, whic h is insp ired b y the analysis of v ariance paradigm of classical statistics. These classifiers ha v e the RIC prop erty that they dep en d on the sample training data solely through the con text selection; in other wo rds, give n the con text, the classifiers hav e a fixed decision b ound ary and do not dep end on a n y further learning from the training data. F or example, as will b e seen in later sections, the T op-Sc oring Pair ( TSP ) classifier is RIC. Once a pair of genes (i.e. , th e conte xt) is sp ec- ified, th e TSP decision b oundary is fi xed and corresp onds to a 45-degree line going through the origin in the feature space defin ed b y the t wo genes. This prop ert y confers to RIC classifiers a minimal-tr aining prop ert y , whic h mak es them insensitive to small disturbances to the ranks of the training data, redu cing v ariance and o v erfi tting, and r en dering them esp ecially s uit- able to the n ≪ d settings illustrated in T able 1 . W e will demonstrate the general R I C framew ork with t wo sp ecific examples, namely , the p reviously in tro duced KTSP classifier based on ma jority voting among comparisons [T an et al. ( 2005 )], as w ell as a new classifier based on the comparison of the m ed ians, the T op-Sc oring M e dians ( TSM ) classifier. 3.1. RIC discriminant. Let X = ( X 1 , X 2 , . . . , X d ) denote the expression v alues of d genes on an expression microarra y . Our ob jectiv e is to u se X to distinguish betw een t w o conditions or ph enot yp es for the cells in the assa yed tissue, denoted Y = 0 and Y = 1. A classifier f asso ciates a lab el f ( X ) ∈ RANK DISCRIMINA NTS 9 { 0 , 1 } with a gi v en expression v ector X . Practical classifiers are infer r ed from training d ata, consisting of i.i.d. pairs S n = { ( X (1) , Y (1) ) , . . . , ( X ( n ) , Y ( n ) ) } . The classifiers w e consider in this pap er are all defined in terms of a general r ank-in- c ontext discriminant g ( X ; Θ( S n )), whic h is defin ed as a real-v alued function on the ranks of X ov er a sub set of genes Θ( S n ) ⊂ { 1 , . . . , d } , wh ich is determined by the training d ata S n and is called th e c ontext of the classifier (the order of indices in the con text ma y m atter). The corresp onding RIC classifier f is defined by f ( X ; Θ( S n )) = I ( g ( X ; Θ ( S n )) > t ) = 1 , g ( X ; Θ( S n )) > t , 0 , otherwise, (1) where I ( E ) denotes the indicator v ariable of ev ent E . T he thresh old pa- rameter t can b e adj usted to achiev e a d esir ed sp ecificit y and sensitivit y (see Section 3.4 b elo w); otherwise, one usually sets t = 0. F or simp licit y we will w r ite Θ ins tead of Θ( S n ), with the imp licit u nderstandin g that in RIC classification Θ is selected from the training data S n . W e will consider t wo families of RIC classifiers. Th e first example is the k - T op Sc oring P airs ( KTSP ) classifier, whic h is a ma jorit y-v oting rule among k pairs of genes [T an et al. ( 2005 )]; K TSP wa s the winn ing entry of the In ternational Conference in Mac h ine Learning and App lications (ICMLA) 2008 c hallenge for micro-arra y classification [Geman et al. ( 2008 )]. Here, the context is partitioned in to a set of gene pairs Θ = { ( i 1 , j 1 ) , . . . , ( i k , j k ) } , where k is a p ositive o dd intege r, in suc h a w a y that all pairs are d isjoin t, that is, all 2 k genes are distinct. The RIC d iscriminant is giv en by g KTSP ( X ; ( i 1 , j 1 ) , . . . , ( i k , j k )) = k X r =1 I ( X i r < X j r ) − 1 2 . (2) This KTSP RIC discriminant simply coun ts p ositiv e and negativ e “v otes” in fa v or of ascending or d escending ranks , resp ectiv ely . The KTSP classifier is given by ( 1 ), w ith t = 0, whic h yields f KTSP ( X ; ( i 1 , j 1 ) , . . . , ( i k , j k )) = I k X r =1 I ( X i r < X j r ) > k 2 ! . (3) The KTSP classifier is thus a ma jorit y-v oting ru le: it assigns lab el 1 to the exp r ession pr ofi le if the num b er of ascending rank s exceeds the n umb er of d escending r anks in the con text. The choic e of od d k a v oids the p os- sibilit y of a tie in the vot e. If k = 1, then the KTSP classifier reduces to f TSP ( X ; ( i, j )) = I ( X i < X j ), the T op-Sc oring Pair ( TSP ) classifier [Geman et al. ( 2004 )]. The second example of an RIC classifier w e prop ose is the T op Sc oring Me dian ( TSM ) classifier, whic h compares the median rank of t wo sets of 10 B. AFSARI, U. M. BRA GA- NETO AND D. GEM AN genes. The median rank has the adv ant age that for any individu al sample the median is the v alue of one of th e genes. Hence, in this sense, a comparison of medians f or a given sample is equiv alen t to the comparison of tw o-gene expressions, as in the TSP decision ru le. Here, the conte xt is partitioned in to t wo sets of genes, Θ = { G + k , G − k } , such th at | G + k | = | G − k | = k , where k is again a p ositiv e o d d integ er, and G + k and G − k are disjoin t, that is, all 2 k genes are d istinct. Let R i b e the rank of X i in the conte xt Θ = G + k ∪ G − k , suc h that R i = j if X i is the j t h smallest v alue among the gene expression v alues indexed b y Θ. T he RIC discriminant is giv en by g TSM ( X ; G + k , G − k ) = med j ∈ G + k R j − med i ∈ G − k R i , (4) where “med” denotes the median op erator. The TSM classifier is then giv en b y ( 1 ), with t = 0, wh ic h yields f TSM ( X ; G + k , G − k ) = I med j ∈ G + k R j > med i ∈ G − k R i . (5) Therefore, the TSM classifier outputs 1 if the median of ranks in G + k exceeds the med ian of ranks in G − k , and 0 otherwise. Notice th at this is equiv alen t to comparing the medians of the ra w expr ession v alues directly . W e remark that an ob vious v ariation would b e to co m pare the a verag e ran k rather than the median rank, wh ic h corresp onds to the “TSPG” appr oac h d efined in Xu, Geman and Winslo w ( 2007 ), except that in that study , the con text for TSPG w as selected by splitting a fixed num b er of TSP s . W e observ ed that the p erformances of the mean-rank and median-rank classifiers are similar, with a sligh t sup eriorit y of the median-ran k (data not sho wn ). 3.2. Criterion for c ontext sele c tion. The p erformance of RI C classifiers critically dep ends on the appr opriate c hoice of the con text Θ ⊂ { 1 , . . . , d } . W e prop ose a simp le yet p o werful pr o cedure to select Θ fr om th e training data S n . T o m otiv ate the prop osed criterion, firs t note that a necessary condition for the con text Θ to yield a go o d classifier is th at the discriminan t g ( X ; Θ ) has su fficien tly d istinct distributions und er Y = 1 and Y = 0 . This can b e expressed by requiring that th e difference b et we en th e exp ected v alues of g ( X ; Θ) b etwe en the p opulations, namely , δ (Θ) = E [ g ( X ; Θ) | Y = 1 , S n ] − E [ g ( X ; Θ) | Y = 0 , S n ] , (6) b e maximized. No tice that this maximizat ion is with resp ect to Θ alone; g is fixed and chosen a priori. In practice, one emp loys the maxim um-likel iho o d empirical criterion ˆ δ (Θ) = b E [ g ( X ; Θ) | Y = 1 , S n ] − b E [ g ( X ; Θ) | Y = 0 , S n ] , (7) RANK DISCRIMINA NTS 11 where b E [ g ( X ; Θ) | Y = c, S n ] = P n i =1 g ( X ( i ) ; Θ) I ( Y ( i ) = c ) P n i =1 I ( Y ( i ) = c ) , (8) for c = 0 , 1 . In the case of KTSP , the criterion in ( 6 ) b ecomes δ KTSP (( i 1 , j 1 ) , . . . , ( i k , j k )) = k X r =1 s i r j r , (9) where the p airwise sc or e s ij for the pair of genes ( i, j ) is defined as s ij = P ( X i < X j | Y = 1) − P ( X i < X j | Y = 0) . (10) Notice that if the p air of r an d om v ariables ( X i , X j ) has a con tin uous distri- bution, so that P ( X i = X j ) = 0, then s ij = − s j i . In th is case X i < X j can b e r eplaced by X i ≤ X j in s ij in ( 10 ). The empirical criterion ˆ δ KTSP (( i 1 , j 1 ) , . . . , ( i k , j k )) [cf. equation ( 7 )] is ob- tained by substituting in ( 9 ) the empiric al p airwise sc or es ˆ s ij = b P ( X i < X j | Y = 1) − b P ( X i < X j | Y = 0) . (11) Here the empirical probab ilities are defined by b P ( X i < X j | Y = c ) = b E [ I ( X i < X j ) | Y = c ], for c = 0 , 1, w here the op erator b E is defined in ( 8 ). F or TSM , the criterion in ( 6 ) is giv en b y δ TSM ( G + k , G − k ) (12) = E h med j ∈ G + k R j − med i ∈ G − k R i | Y = 1 i − E h med j ∈ G + k R j − med i ∈ G − k R i | Y = 0 i . Prop osition S1 in Supplement A [Afsari, Braga-Neto and Geman ( 2014a )] sho w s that, under some assum ptions, δ TSM ( G + k , G − k ) = 2 k X i ∈ G − k ,j ∈ G + k s ij , (13) where s ij is d efined in ( 10 ). The difference b et w een the t wo criteria ( 9 ) for KTSP and ( 13 ) for TSM for selecting the con text is that the f ormer inv olv es scores f or k expression comparisons and the latter in volv es k 2 comparisons since eac h gene i ∈ G − k is paired with eac h gene j ∈ G + k . Moreo v er, usin g the estimated solution to maximizing ( 9 ) (see b elo w ) to constru ct G − k and G + k b y pu tting the fi rst gene from eac h pair into on e and the second gene from eac h pair in to the other do es not w ork as w ell in m aximizing ( 13 ) as the algo rithms d escrib ed b elo w . 12 B. AFSARI, U. M. BRA GA- NETO AND D. GEM AN The distribu tional smo othness conditions Prop osition S 1 are ju s tified if k is not to o large (see Supp lemen t A [Afsari, Braga-Net o and Geman ( 2014a )]). Finally , the empirical criterion ˆ δ TSM ( G + k , G − k ) can b e calculated by substi- tuting in ( 13 ) the empiric al p airwise sc or es ˆ s ij defined in ( 11 ). 3.3. Maximization of the criterion. Maximizat ion of ( 6 ) or ( 7 ) works we ll as long a s the size of the con text | Θ | , that is, the num b er of con text genes, is k ept fixed, b ecause the criterion tends to b e monotonically increasing with | Θ | , whic h complicates selection. W e addr ess th is p r oblem by prop osing a mo dified criterion, whic h is p artly inspired by the prin ciple of analysis of v ariance in classical statistics. This m o dified criterion p enalizes the addition of more genes to the co ntext b y requiring that the v ariance of g ( X ; Θ) within the p opulations b e minimized. Th e latter is giv en by ˆ σ (Θ) = q d V ar( g ( X ; Θ ) | Y = 0 , S n ) + d V ar ( g ( X ; Θ ) | Y = 1 , S n ) , (14) where d V ar is the maximum-lik eliho od estimator of the v ariance, d V ar( g ( X ; Θ ) | Y = c, S n ) = P n i =1 ( g ( X ( i ) ; Θ) − b E [ g ( X ; Θ) | Y = c, S n ]) 2 I ( Y ( i ) = c ) P n i =1 I ( Y ( i ) = c ) , for c = 0 , 1 . The mo dified cr iterion to b e maximized is ˆ τ (Θ) = ˆ δ (Θ) ˆ σ (Θ ) . (15) The statistic ˆ τ (Θ) resembles the W elc h t w o-sample t -test statistic of classical h y p othesis testing [Casella and Berger ( 2002 )]. Direct m aximization of ( 7 ) or ( 15 ) is in general a h ard computational problem for the num b ers of genes t yp ically encountered in expression data. W e prop ose instead a greedy pro cedure. Assu ming that a predefi n ed range of v alues Ω for the con text size | Θ | is giv en, the pro cedu re is as follo ws: (1) F or eac h v alue of k ∈ Ω , an optimal context Θ ∗ k is c hosen that maxi- mizes ( 7 ) among all conte xts Θ k con taining k genes: Θ ∗ k = arg max | Θ | = k ˆ δ (Θ) . (2) An optimal v alue k ∗ is chosen that maximiz es ( 15 ) among all cont exts { Θ ∗ k | k ∈ Ω } obtained in the previous step: k ∗ = arg max k ∈ Ω ˆ τ (Θ ∗ k ) . RANK DISCRIMINA NTS 13 F or KTSP , the maximization in step (1) of the previous cont ext selectio n pro cedure b ecomes { ( i ∗ 1 , j ∗ 1 ) , . . . , ( i ∗ k , j ∗ k ) } = arg max { ( i 1 ,j 1 ) ,..., ( i k ,j k ) } ˆ δ KTSP (( i 1 , j 1 ) , . . . , ( i k , j k )) (16) = arg max { ( i 1 ,j 1 ) ,..., ( i k ,j k ) } k X r =1 ˆ s i r j r . W e prop ose a greedy approac h to this maximizatio n problem: initialize the list w ith the top-scoring pair of genes, then keep adding pairs to th e list wh ose genes hav e not app eared so far [ties are broken b y the secondary score prop osed in Xu et al. ( 2005 )]. This pro cess is rep eated u n til k pairs are c hosen and corresp onds essen tially to the s ame metho d that w as prop osed, for fixed k , in the original pap er on KTSP [T an et al. ( 2005 )]. Thus, the previously prop osed heuristic has a justification in terms of maximizing the separation b et we en the rank discriminan t ( 2 ) across the classes. T o obtain the optimal v alue k ∗ , one applies step (2) of the context selection pro cedure, with a range of v alues k ∈ Ω = { 3 , 5 , . . . , K } , for od d K ( k = 1 can b e added if 1- TSP is considered). Note that here ˆ σ KTSP (Θ) (17) = v u u t d V ar k X r =1 [ I ( X i ∗ r < X j ∗ r )] Y = 0 ! + d V ar k X r =1 [ I ( X i ∗ r < X j ∗ r )] Y = 1 ! . Therefore, the optimal v alue of k is selecte d b y k ∗ = arg max k =3 , 5 ,...,K ˆ τ KTSP (( i ∗ 1 , j ∗ 1 ) , . . . , ( i ∗ k , j ∗ k )) , (18) where ˆ τ KTSP (( i ∗ 1 , j ∗ 1 ) , . . . , ( i ∗ k , j ∗ k )) = ˆ δ KTSP (( i ∗ 1 , j ∗ 1 ) , . . . , ( i ∗ k , j ∗ k )) ˆ σ KTSP (( i ∗ 1 , j ∗ 1 ) , . . . , ( i ∗ k , j ∗ k )) (19) = P k r =1 ˆ s i ∗ r j ∗ r q d V ar( P k r =1 [ I ( X i ∗ r < X j ∗ r )] | Y = 0) + d V ar ( P k r =1 [ I ( X i ∗ r < X j ∗ r )] | Y = 1) . Finally , the optimal con text is then giv en b y Θ ∗ = { ( i ∗ 1 , j ∗ 1 ) , . . . , ( i ∗ k ∗ , j ∗ k ∗ ) } . F or TSM , the maximization in step (1) of th e con text selection p r o cedure can b e written as ( G + , ∗ k , G − , ∗ k ) = arg m ax ( G + k ,G − k ) ˆ δ TSM ( G + k , G − k ) = arg max ( G + k ,G − k ) X i ∈ G − k ,j ∈ G + k ˆ s ij . (20) 14 B. AFSARI, U. M. BRA GA- NETO AND D. GEM AN Finding the global m axim um in ( 20 ) is not feasible in general. W e consid er a sub optimal strategy for accomplishing this task: sequen tially construct th e con text by adding t w o genes at a time. Start b y selecti ng the TSP pair i, j and setting G − 1 = { i } and G + 1 = { j } . Th en select the pair of genes i ′ , j ′ distinct from i, j such that the su m of scores is maximized b y G − 2 = { i, i ′ } and G + 2 = { j, j ′ } , that is, ˆ δ TSM ( G + k , G − k ) is maximized ov er all sets G + k , G − k of size t w o, assumin g i ∈ G − k and j ∈ G + k . This inv olv es computing three new scores. Pro ceed in this w a y until k p airs hav e b een selected. T o obtain the optimal v alue k ∗ , one applies step (2) of the context selection pro cedure, with a r ange of v alues k ∈ Ω = { 3 , 5 , . . . , K } , for o d d K (the c hoice of Ω is dictated by the facts that k = 1 redu ces to 1- TSP , w hereas Prop osition S1 do es not hold for ev en k ): k ∗ = arg max k =3 , 5 ,...,K ˆ τ TSM ( G + , ∗ k , G − , ∗ k ) , where ˆ τ TSM ( G + , ∗ k , G − , ∗ k ) = ˆ δ TSM ( G + , ∗ k , G − , ∗ k ) ˆ σ TSM ( G + , ∗ k , G − , ∗ k ) = b E h med j ∈ G + , ∗ k R j − med i ∈ G − , ∗ k R i | Y = 1 i − b E h med j ∈ G + , ∗ k R j − med i ∈ G − , ∗ k R i | Y = 0 i (21) / d V ar med j ∈ G + , ∗ k R j − med i ∈ G − , ∗ k R i | Y = 0 + d V ar med j ∈ G + , ∗ k R j − med i ∈ G − , ∗ k R i | Y = 1 1 / 2 . Notice that ˆ τ TSM is d efined directly by replacing ( 4 ) in to ( 7 ) an d ( 14 ), and then u sing ( 15 ). In particular, it do es not use the app ro ximation in ( 13 ). Finally , the optimal con text is giv en b y Θ ∗ = ( G + , ∗ k ∗ , G − , ∗ k ∗ ). F or b oth KTSP and TSM classifiers, the step-wise pro cess to p erform the maximization of the criterion [cf. equations ( 16 ) and ( 20 )] do es n ot need to b e restarted as k in creases, since the su b optimal conte x ts are nested [b y con trast, the metho d in T an et al. ( 2005 ) emplo ye d cross-v alidation to c h o ose k ∗ ]. The detailed con text selection pro cedure for KTSP and TSM classifiers is given in Algorithms S1 and S2 in Supp lemen t C [Afsari, Braga-Neto and Geman ( 2014c )]. 3.4. Err or r ates. In this sectio n w e discuss the c hoice of the threshold t used in ( 1 ). Th e sensitivity is defin ed as P ( f ( X ) = 1 | Y = 1) and the sp e ci- ficity is d efined as P ( f ( X ) = 0 | Y = 0). W e are in terested in con trolling b oth, RANK DISCRIMINA NTS 15 Fig. 2. R OC curves for TSM . L eft: BRCA1 data. With the indic ate d thr eshold, we c an achieve sensitivity ar ound 0.9 at the exp ense of sp e cificity ar ound 0.6. Right: Pr ostate 4 data. The given thr eshold r e aches 0.88 sp e cifici ty at the exp ense of sensitivity ar ound 0.55. but trad e-offs are inevitable. The choi ce of wh ic h phenotype to d esignate as 1 is application-dep end en t; often sens itivit y is relativ e to the m ore malignan t one and this is the wa y we ha v e assigned lab els to the phenotypes. A giv en application ma y call for emphasizing sen sitivit y at the exp ense of sp ecificit y or vice versa. F or example, in detecting BRCA1 m utations or with aggres- siv e d iseases s uc h as pancreatic cancer, high sensitivit y is imp ortan t, whereas for m ore common and less aggressiv e cancers, suc h as prostate, it ma y b e preferable to limit the n umb er of false alarms and ac h iev e high sp ecificit y . In principle, selecting the appr opriate threshold t in ( 1 ) allo ws one to ac h iev e a desired trade-off. (A disadv an tage of TSP is the lac k of a discriminan t, and th u s a pro cedure to adju s t sensitivit y and sp ecificit y .) It shou ld b e noted, ho wev er, that in p ractice estimating the threshold on the trainin g data can b e d iffi cu lt; moreo ver, introd ucing a nonzero threshold mak es the decision rule somewhat more difficult to in terpr et. As an example, Figure 2 displays the R OC curv e of the TSM classifier for the BR C A1 and Prostate 4 studies, together w ith thresholds ac h ieving h yp otheticall y desired scenarios. 4. Exp eriment al results. A summary of the rank-based discriminan ts dev elop ed in the p r eceding sections is giv en in T able 2 . W e learned eac h dis- criminan t for eac h of the data sets liste d in T able 1 . Among an abundance o f prop osed methods for high-dimensional data classificati on [e.g., Bradley and Mangasarian ( 1998 ), Zh ang et al. ( 2006 ), Marron, T o dd and Ahn ( 2007 )], w e c hose t wo of the most effectiv e and p opular c hoices for predicting pheno- t yp es fr om exp ression data: P AM [Tibshirani et al. ( 2002 )], wh ic h is a form of LDA , and SVM-RFE [Guy on et al. ( 2 002 )], which is a form of linea r SVM . 16 B. AFSARI, U. M. BRA GA- NETO AND D. GEM AN Generalizati on errors are estimated with cross-v alidation, sp ecifically av- eraging th e results of ten rep etitions of 10-fold CV, as recommended in Braga-Ne to and Dougherty ( 2004 ) and Hastie, Tibsh irani and F r iedman ( 2001 ). Despite the inaccuracy of small-sample cross-v alidation estimates [Braga-Ne to and Dougherty ( 2004 )], 10-fold CV suffices to obtain the broad p ersp ectiv e on relativ e p erformance across many different data sets. The p roto cols f or training (including parameter selectio n ) are given b elo w. T o red u ce computation, w e filter the whole gene po ol without u sing the class lab els b efore selecting the con text for rank d iscriminant s ( TSP , KTSP and TSM ). Although a v ariet y of filtering metho ds exist in the literature, su c h as P AM [Tibshir ani et al. ( 2002 )], SIS [F an and L v ( 2008 )], Dan tzig select or [Candes and T ao ( 2007 )] and the Wilco xon-rank test [Wilco xon ( 1945 )], w e simp ly use an a v erage signal filter: select the 4000 genes with highest mean r ank (across b oth classes). In p articular, there is n o effort to detect “differen tially expressed” genes. I n th is wa y w e m in imize th e influen ce of the fi ltering metho d in assessing the p erformance of r ank discrimin an ts: • TSP : The sin gle pair maximizing s ij o ve r all pairs in th e 4000 filtered genes, br eaking scoring ties if necessary with the s econdary score p rop osed in Xu et al. ( 2005 ). • KTSP : The k disjoint p airs maximizing s ij o ve r all pairs in the 4000 filtered genes with the same tie-breaking metho d. The num b er of pairs k is determined via Algorithm S 1, within the r ange k = 3 , 5 , . . . , 9, a v oiding ties in v oting. Notice that k = 1 is exclud ed so that KTSP cannot reduce to TSP . W e tried also k = 3 , 5 , . . . , 49 and the cross-v alidated accuracies c hanged insignifican tly . • TSM : The con text is c hosen from the top 4000 genes b y th e greedy se- lection pro cedure describ ed in Algorithm S2. Th e size of the t wo sets for computing the median rank is selected in the range k = 3 , 5 , 7 , 9 (p r o vid- ing a un ique median and thereb y render in g Prop osition S1 applicable). W e also tr ied k = 3 , 5 , . . . , 49 and aga in the change s in the cross-v alidated accuracies were insignificant. • SVM-RFE : W e learned t w o linear SVM s us ing SV M -RFE : one with ten genes and one with a hundred genes. No filtering w as app lied, since SVM- RFE itself do es that. Since w e found that the c h oice of the slac k v ariable barely c h anges the results, w e fix C = 0 . 1. (In fact, the data are linearly separable in nearly all loop s .) On ly the r esults for SVM -RFE with a h un- dred genes are shown since it w as almost 3% b etter than with ten genes. • P AM : W e use the au tomatic filtering mec h anism pro vided by Tibshir ani ( 2011 ). The prior class lik eliho o d s were set to 0.5 and all other param- eters were set to default v alues. The most imp ortant parameter is the threshold; the automatic one c hosen b y the program results in relativ ely lo we r accuracy than the other metho d s (84.00%) on a v erage. Fixing the RANK DISCRIMINA NTS 17 threshold and c ho osing the b est one o ver all data sets only increases the accuracy b y one p ercen t. Instead, for eac h data set and eac h threshold, w e estimated the cross-v alidated accuracy for P AM and rep ort the accuracy of the b est thresh old for that data s et. T able 3 sho ws the p erformance estimates of the classifiers across 21 data sets. In addition, Figures S 1 and S2 in Supp lement B [Afsari, Braga -Neto and Geman ( 2014b )] display th e results in b ox plot format. T he a ve r ages are as follo ws : TSP (85.59%), KTSP (90.07%), TSM (88.9 7%), SVM- RFE (89.92 %) and P AM (88.19%). T h e differences in the a v erages among meth- o ds do not app ear substantia l, with the p ossible exception of TSP , w hic h lags b ehind the others. There are, ho wev er, clearly significant v ariations in p erformance within individual data sets. In order to examine these v ariations at a finer scale, p ossibly revea ling trends to s u pp ort practical recommendations, recall that for eac h data set and eac h method , w e did ten rep etitions of tenfold cross- v alidation, resulting in one hundred trained classifiers and estimat ed rates (on the left-out sub sets), whic h were a v eraged to provide a sin gle cross- v alidated classificatio n rate. Th e notc h -b o x es for eac h data set and metho d T able 3 Sensitivity/sp e cificity for differ ent classific ation metho ds. Over al l ac cur acy is c alculate d as the aver age of sensitivity and sp e cificity Data set TSP TSM KTSP SVM P AM Colon 88 / 88 86 / 88 87 / 86 87 / 73 83 / 81 BRC A 1 71 / 75 90 / 75 88 / 77 68 / 88 39 / 82 CNS 41 / 79 81 / 88 67 / 93 52 / 86 77 / 79 DLBCL 98 / 97 96 / 95 96 / 88 97 / 91 72 / 100 Lung 92 / 97 97 / 99 94 / 100 95 / 100 97 / 100 Marfan 82 / 93 89 / 90 88 / 96 99 / 93 88 / 87 Crohn’s 89 / 90 92 / 91 92 / 96 100 / 100 93 / 98 Sarcoma 83 / 78 88 / 89 93 / 91 97 / 94 93 / 100 Squamous 89 / 88 88 / 85 99 / 92 94 / 95 94 / 95 GCM 81 / 73 88 / 77 90 / 75 94 / 80 95 / 94 Leukemia 1 90 / 85 97 / 94 97 / 93 98 / 97 95 / 89 Leukemia 2 96 / 96 100 / 93 100 / 96 100 / 96 73 / 88 Leukemia 3 98 / 98 97 / 99 97 / 98 100 / 100 96 / 99 Leukemia 4 92 / 94 95 / 98 96 / 97 99 / 97 77 / 92 Prostate 1 95 / 93 89 / 96 90 / 95 91 / 95 89 / 91 Prostate 2 68 / 68 76 / 79 76 / 83 68 / 79 77 / 74 Prostate 3 97 / 79 99 / 90 99 / 83 99 / 100 98 / 100 Prostate 4 77 / 61 87 / 70 86 / 79 92 / 62 66 / 85 Prostate 5 97 / 99 97 / 98 95 / 99 100 / 99 99 / 100 Breast 1 82 / 90 82 / 91 85 / 91 77 / 88 95 / 98 Breast 2 83 / 82 73 / 89 75 / 87 71 / 86 86 / 88 18 B. AFSARI, U. M. BRA GA- NETO AND D. GEM AN are plotted in Figures S1 and S2 (Sup p lemen t B [Afsari, Braga-Neto and Geman ( 2014b )]). As is commonly d one, an y tw o metho ds will b e declared to b e “tied” on a giv en data set if the notc hes o v er lap; otherwise, that is, if the notc hes are disjoint, the “winner” is tak en to b e the one with the larger median. First, u sing the “notc h test” to compare the three RIC classifiers, KTSP sligh tly outp erf orms TSM , which in turn outp erforms TSP . More sp ecifically , KTSP has accuracy sup erior to b oth others on ten data sets. In terms of KTSP vs TSM , K TSP outp erforms on three d ata sets, vice v ersa on one data set and they tie on all others. Moreo v er, TSM outper f orms TSP on nine data s ets and vice versa on t wo data sets. As a result, if accuracy is the dominan t concern, w e recommend KTSP among the RIC classifiers, wh er eas if s im p licit y , transparency an d links to biologic al mec hanisms are important, one migh t prefer TSP . C omparisons with non-RIC metho ds (see b elo w) are based on KTSP , although substituting TSM do es not lead to app reciably differen t conclusions. Second, SVM p erforms b etter than P AM on six data sets and P AM on three d ata sets. Hence, in the remaind er of this section w e will compare KTSP with SVM . W e emphasize that the comparison b et we en P AM and SVM is on ou r particular d ata sets, u sing our particular measures of p er- formance, namely , cross-v alidation to estimate accuracy and the notc h test for pairwise comparisons. Results on other d ata sets or in other conditions ma y differ. Third, whereas th e o verall p erformance stat istics for KTSP and SVM are almost identic al, trend s do emerge based on sample size, which is obviously an imp ortan t p arameter and esp ecially usefu l h ere b ecause it v aries consid- erably among our data sets (T able 1 ). T o a vo id fine-tuning, w e only consider a coarse and somewhat arbitrary quantiza tion in to three categories: “smal l,” “medium” and “large” data sets, defined, resp ectiv ely , b y fewer than 100 (to- tal) samp les (t w elve d ata sets), 100–200 samples (five data sets) and more than 200 samples (four data s ets). O n small d ata sets, K TSP outp erforms SVM o n four data s ets and n ev er vice versa; for m ed ium data s ets, eac h outp erforms the other on one of the fiv e data sets; and SV M outp erform s KTSP on thr ee out of four large data sets and neve r vice v er s a. Another criterion is s p arsit y: the n umber of genes used by TSP is alw ays t wo and by SVM-RFE is alwa ys on e hundred. Av eraged across all data sets and lo ops of cross-v alidation, KTSP uses 12 .5 genes, TSM uses 10 .16 genes, and P A M uses 577 1 genes. Finally , we p erform ed an exp erim ent to r oughly gauge the v ariabilit y in selecting the genes in the supp ort of th e v arious classifiers. T aking adv ant age of the fact that w e train 100 d ifferen t classifiers for eac h metho d and data set, ea ch time with appro ximately th e same n um b er of examples, w e define a “consistency” measure for a p air of classifiers as the a v er age supp ort o v erlap RANK DISCRIMINA NTS 19 o ve r all distinct p airs of r u ns. That is, for an y give n data set and metho d , and any tw o lo ops of cross-v alidation, let S 1 and S 2 b e the sup p orts (set of selected genes) and define the o ve rlap as | S 1 ∩ S 2 | | S 1 ∪ S 2 | . This fraction is then a ve raged o v er all 100(99) / 2 pairs of lo ops, and ob viously ranges from zero (no consistency) to one (consistency in all lo ops). Whereas in 16 of the 21 d ata sets KTSP had a higher consistency score than SVM , the more imp ortant p oin t is that in b oth cases the scores are low in absolute terms, whic h coheres w ith other obser v ations ab out the enormous v ariations in learned genes signatures. 5. Discussion and conclusions. What migh t b e a “mec hanistic inte r pre- tation” of the TSP classifier, where the con text consists of only tw o genes? In Price et al. ( 2007 ), a rev ers al b etw een the t wo genes Prune2 and Obscur in is shown to b e an accurate test for separating GIS T and LMS. Providing an explanation, a hypothesized mec hanism, is not straigh tforward, although it has b een recen tly shown that b oth mo dulate RhoA activit y (whic h con trols man y signaling ev ent s): a sp lice v ariant of Pr une2 is rep orted to decrease RhoA activit y when ov er-expressed and Obscurin cont ains a Rho-GEF bind - ing d omain which helps to activ ate RhoA [F u nk ( 2012 )]. Generically , one of the most elemen tary regulatory motifs is simply A inhibits B (denoted A ⊣ B ). F or example, A may b e constitutiv ely “on” and B constitutiv ely “off ” after dev elopmen t. P erhaps A is a transcrip tion factor or inv olv ed in meth ylation of B . In the normal phenot yp e w e see A expressed , but p erhaps A b ecomes inactiv ated in the cancer phenot yp e, resulting in the expression of B , and h ence an expr ession reversal from n ormal to cancer. Still more generally , a v ariet y of regulatory feedbac k loops h a ve b een identified in mammals. F or instance, an example of a bi-stable loop is sh o wn b elo w . Due to the activ ation and suppr ession patterns depicted in Figure 3 , we migh t exp ect P ( X A 1 < X A 2 | Y = 0) ≫ P ( X A 1 < X A 2 | Y = 1) and P ( X B 1 < X B 2 | Y = 0) ≪ P ( X B 1 < X B 2 | Y = 1) . Thus, there are t w o exp ression rever- sals, one b et wee n the tw o miRNAs and one, in the opp osite dir ection, b e- t wee n the tw o mRNAs. Giv en b oth miRNA and m R NA data, we might then build a classifier b ased on these t wo switches. F or example, the rank Fig. 3. A bi-stable fe e db ack lo op. Mole cules A 1 , A 2 (r esp., B 1 , B 2 ) ar e fr om the same sp e cies, for example, two miRNAs (r esp., two mRNAs). L etters i n b oldfac e i ndic ate an “on ” state. 20 B. AFSARI, U. M. BRA GA- NETO AND D. GEM AN discriminant might simply b e 2- TSP , the n u m b er of reversals observed. Ac- cordingly , we ha ve argued th at expression comparisons ma y provide an ele- men tary bu ilding blo ck for a conn ection b et ween rank-based decision r ules and p oten tial mec hanisms. W e h a ve r ep orted extensiv e exp eriments w ith classifiers based on expres- sion comparisons with differen t diseases and microarray platforms and com- pared the results with other m etho ds wh ic h usually use significantly more genes. No one classifier, whether within the rank-based co llection or b et we en them and other method s suc h as SVM and P AM , uniformly dominates. The most appropriate one to use is likely to b e problem-dep enden t. Moreo v er, unt il m u c h larger data sets b ecome a v ailable, it w ill b e d ifficult to obtain highly accurate estimates of ge neralization errors. What d o es s eem apparen t is that our results supp ort the conclusions reac h ed in earlier studies [Dudoit, F rid ly and and Sp eed ( 2002 ), Braga-Neto ( 2007 ), W ang ( 2012 ), S imon et al. ( 2003 )] that simple classifiers are usually comp etitiv e w ith more complex ones with microarra y data and limited s amples. This has imp ortan t conse- quences for fu ture dev elopments in fun ctional genomics s in ce one key thrust of “p ersonalized m edicine” is an attempt to learn appropriate treatments for disease subtypes, whic h means sample sizes will not necessarily get larger and migh t ev en get smal ler . Moreo v er, as atten tion turns increasingly to ward treatmen t, p oten tially mechanistic characte rizations of statistic al decisions will b ecome of p aramoun t imp ortance f or translational medicine. SUPPLEMENT AR Y MA TERI AL Prop osition S1 (DOI: 10.121 4/14-A OAS738 S UPP A ; .p df ). W e p ro vide the statemen t and pro of of Prop osition S1 as w ell as statistical tests for the assumptions m ade in Prop osition S 1. Notc h-plots for classification accuracies (DOI: 10.121 4/14-A OAS738 S UPPB ; .p df ). W e pr ovide notc h-plots of the estimates of classification accuracy for eve r y method and every data set based on ten runs of tenfold cross- v alidation. Algorithms for KTS P and TSM (DOI: 10.1214 /14-A OAS738SUPPC ; .p d f ). W e provide a summary of the algorithms for learning the KTS P and TS M classifiers. REFERENCES Afsari, B. , Braga-Neto, U. M. and Geman, D. (2014a). Su pplement to “Rank discriminan ts for predicting phenotypes from RNA expression.” DOI: 10.1214 /14-AO AS738SUPP A . Afsari, B . , Braga-Neto, U. M. and Gema n, D. (2014b). Su pplement to “Rank discriminan ts for predicting phenotypes from RNA expression.” DOI: 10.1214 /14-AO AS738SUPPB . RANK DISCRIMINA NTS 21 Afsari, B. , Braga-Neto, U. M. and Geman, D. (2014c). Supplement to “Rank discriminan ts for predicting phenotypes from RNA expression.” DOI: 10.1214 /14-AO AS738SUPPC . Alon, U. , B arkai, N. , Notterman , D. et al. (1999). Broad patterns of gene exp ression revea led by clustering analysis of tumor and normal colon tissues prob ed by oligon u- cleotide arra ys. Pr o c. Natl. A c ad. Sci. U SA 96 6745–6750. Al tman , R. B. , Kr oeme r, H. K. , M cC ar ty, C. A . (2011). Pharmacogenomics: Will the promise b e fulfilled. Nat. R ev. 12 69–73 . Anderson, T. , Tchernyshyov, I. , Diez, R. et al. (2007). Disco vering robust protein biomarke rs for d isease from relativ e ex pression reversal s in 2-D D IGE data. Pr ote omics 7 1197–1 208. Armstro ng, S. A. , St aunton, J. E. , Sil verman, L. B. et al. (2002). MLL translocations sp ecify a distinct gene ex pression profile t hat d istinguishes a un ique leukemia. Nat. Genet. 30 41–47 . Auffra y, C. (2007). Protein subnetw ork mark ers improv e prediction of cancer outcome. Mol. Syst. Biol. 3 1–2. Biccia to, S . , P andin, M. , Didon ` e, G. and Bello, C. D. (2003). Pattern identifica- tion and cla ssification in gene expressio n data using an autoassociative neural net work mod el. Biote chnol. Bio eng. 81 594–606. Blo a te d , B. , Iriz arr y, R. and Speed, T. (200 4). A comparison of normalizatio n meth- ods for high d ensity oligonucleoti de arra y data based on v ariance and bias. Bi oinfor- matics 19 185–193 . Bloom, G. , Y ang, I. , Boul w are , D. et al. (2004). Multi-p latform, multisite, microarra y- based human t u mor class ification. A m . J. Pathol. 164 9–16 . Boulesteix, A. L. , Tutz, George. and Strimmer, K. (2003). A CAR T-b ased app roac h to disco ver emerging patterns in microarra y data. Bioinformatics 19 2465– 2472. Bradley, P. S. and Mangasaria n, O. L. (1998 ). F eature selection via vonca ve mini- mization and supp ort vector machines. In I CML 82–90. Morgan Kaufmann, Madison, WI. Braga-Neto, U. M. (2007). F ads and fallacies in the name of small-sample microarra y classification—a highlig ht of misunderstanding and erroneous usage in the applications of genomic signal processing. IEEE Signal Pr o c ess. Mag. 24 91–99 . Braga-Neto, U . M. and Dougher ty, E. R. (2004). Is cross-v alidation v alid for small- sample microarra y classification? Bioinformatics 20 374–3 80. Buff a, F. , Camps, C. , Winche ster, L. , Snell, C. , Gee , H. , Sheldon, H. , T a ylor, M. , Harris, A. and Ragoussis, J. (2011). microRNA -associated progression pathw ays and p otentia l therap eutic targets identified b y in tegrated mRN A and microRNA expression profiling in breast cancer. Canc er R es. 71 5635–5645. Burczynski, M. , Peterson, R. , Twine, N. et al. (2006). Molecular classification of Crohn’s disease and ulcerative colitis p atien ts using transcriptional profiles in periph eral bloo d monon uclear cells. Canc er R es. 8 51–61. Candes, E. and T ao, T. (2007). The Dan t zig selector: Statistical estimation when p is muc h larger than n . Ann. Statist. 35 2313–235 1. MR2382644 Casella, G. and Be r ger, R. L. (2002). Statistic al Infer enc e , 2nd ed. Duxbury , P acific Gro ve, CA. Dettling, M. and Buhlmann , P. (2003). Bo osting for tumor classification with gene expression data. Bioinformatics 19 1061–1069 . Dudoit, S. , Fridl y and , J. and Speed , T. P. (2002). Comparison of discrimination metho d s for the classification of tumors using gene expression data. J. Amer. Statist. Asso c. 97 77–87 . MR1963389 22 B. AFSARI, U. M. BRA GA- NETO AND D. GEM AN Edelman, L. , Toia, G. , Geman , D. et al. (200 9). Tw o-transcript gene expression classi- fiers in the diagnosis and prognosis of h uman diseases. BMC Genomics 10 583. Enerl y, E. , Steinfeld, I. , Klei vi, K. , Lei vonen, S.-K. et al. (2011). miRNA–mRNA integ rated analysis rev eals roles for miRNAs in primary breast tu mors. PL oS ONE 6 0016915 . Ev ans, J. P. , Me slin, E. M. , Ma r teau, T. M. and Caulfield, T. (2011). Deflating the genomic bubble. Scienc e 331 861–86 2. F an, J. and F an, Y. (2008). High-dimensional classification using features annealed in- dep endence rules. A nn. Statist . 36 2605–2637. MR2485009 F an, J. and L v, J. (2008). Sure ind ep en dence screening for ultrahigh d imensional feature space. J. R. Stat. So c. Ser. B Stat. Metho dol. 70 849–9 11. MR2530322 Funk, C. (2012). P ersonal communication. Institute for Systems Biology , Seattle, W A. Geman, D. , d’A vignon, C. , Naiman, D. Q. and W inslo w, R. L. (2004). Classifying gene exp ression profiles from pairwise mRNA comparisons. Stat. Appl. Genet. Mol. Biol. 3 Art. 19, 21 pp. (electronic). MR2101468 Geman, D. , Afsari, B. , T an, A . C. and Naiman, D. Q. (2008). Microarra y classificati on from severa l tw o-gene expression compariso ns. I n Machine L e arning and Applic ations, 2008. I CMLA’08. Seventh International C onf er enc e 583–58 5. IEEE, San Diego, CA. Golub, T. R. , Slonim, D. K. , T ama yo, P. et al. (1999). Molecular classification of cancer: Class discov ery and class prediction by gene exp ression monitoring. Scienc e 286 531–537 . Gordon, G. J. , Jensen, R. V. , Hsiao, L.-L. , Gu llans, S. R. , Blumenstock, J. E. , Ramasw amy, S. , Richards, W. G . , Su g arbaker, D. J. and Bueno, R. (2002 ). T ranslation of microarra y data in to clinicall y relev ant cancer d iagnostic tests using gene expression ratios in lung cancer and mesothelioma. Canc er R es. 62 4963– 4967. Guo, Y. , Hastie, T. and Ti bshirani, R. (2005). Regularized discriminant analysis and its application in microarra ys. Biostatistics 1 1–1 8. Guo, Y. , Hastie, T. and Tibshirani , R. (2007). Regularized linear discriminant analysis and its application in microarra ys. Bi ostatistics 8 86–100. Guyon, I. , Weston, J. , Barnhill, S. and V apnik, V. (2002 ). Gene selection for cancer classification using supp ort vector m achines. Mach. L e arn. 46 389–42 2. Hastie, T . , Tibshi rani, R. and Friedman, J. (2001). The Elements of Statistic al L e arn- ing: Data Mini ng, Infer enc e, and Pr e diction . Springer Series in Statistics . Springer, New Y ork. MR1851606 Jones, S. , Zhang, X. , P arsons, D. W. et al. (2008). Core signaling path wa ys in human pancreatic cancers reveal ed by gl obal genomic analyses. Scienc e 321 1801–1806 . Khan, J. , W ei, J. S. , Ringn ´ er, M. et al. (2001). Classification and diagnostic prediction of cancers using gene ex pression profiling and artificial neu ral netw orks. Nat. Me d. 7 673–679 . Ko h lmann, A. , Kipps, T. J. , Rassen ti , L. Z. and Do wnin g , J. R. (2008 ). A n inter- national standardization p rogramme tow ards the application of gene expression p ro- filing in routine leuk aemia diagnostics: The microarray inno vatio ns in leukemia study prephase. Br. J. Haematol. 142 802–807 . Kuriakos e, M. A. , Chen , W. T. et al. (2004). Selection and v alidation of d ifferentia lly expressed genes in head and nec k cancer. Cel l. Mol. Lif e Sci. 61 1372–1 383. Lee, E. , Chuang, H. Y. , Kim, J. W. et al. (2008). Inferring p athw ay activit y tow ard precise disease classificatio n . PL oS Comput. Biol. 4 e1000217 . Lin, X. , Afsari, B. , Marchionni, L. et al. (2009). The ordering of expression among a few genes can pro v id e simple cancer b iomarkers and signal BRCA1 mutations. BMC Bioinformatics 10 256. RANK DISCRIMINA NTS 23 Ma, X. J. , W ang, Z. , R y an, P. D. et al. ( 2004). A tw o-gene ex pression ratio predicts clinical outcome in breast cancer patien t s treated with tamoxifen. C anc er Cel l 5 607– 616. Marron, J. S. , Todd, M. J. and Ahn, J. (2007). Distance-w eigh ted discrimination. J. Amer . Statist. Asso c. 102 1267–1271 . MR2412548 Marshall, E. (2011). W aiting for the revo lution. Scienc e 331 526–529. Mills, K. I. , Kohlmann, A. , William s, P. M. , Wi eczorek, L. et al. (2009). Microarra y-based clas sifiers and prognosis mo dels identi fy subgroups with d istinct clin- ical outcomes and h igh risk of AML transformation of my elo dysplastic sy n drome. Blo o d 114 1063–10 72. Peng, S. , Xu, Q. , Ling, X. et al. (2003). Molecular classification of cancer types from mi- croarra y data using the com b in ation of genetic algori thms an d su p p ort vecto r mac h in es. FEBS L ett. 555 358–3 62. Pomer o y, C. , T ama yo, P. , G aasenbeek, M. et al. (2002). Prediction of central n ervous system embry onal tumour outcome based on gene expression. Natur e 415 436–44 2. Price, N. , Trent, J. , El-Naggar, A. et al. (2007). Highly accurate tw o-gene classi- fier for differentiating ga stroin testinal stromal tumors and leimy osarcomas. Pr o c. Natl. A c ad. Sci. USA 43 3414–3419. Qu, Y. , Adam, B. , Y asui, Y. et al. (200 2). Bo osted decision tree analysis of surface-enhanced laser d esorption/ionizatio n mass sp ectral serum p rofiles d iscriminates prostate cancer from noncancer patients. Cl in. Chem. 48 1835–1843. Ramasw amy, S. , T ama yo, P. , Rif kin , R. et al. (2001). Mu lticlass cancer diagnosis using tumor gene expression signatures. Pr o c. Natl. A c ad. Sci. USA 98 15149–15 154. Raponi, M. , Lancet, J. E. , F a n , H. et al. (2008). A 2-gene classifier for predicting response to the farnesyltransferas e inh ibitor tipifarnib in acute m yelo id leukemia. Bl o o d 111 2589–25 96. Shipp, M. , Ross, K. , T ama yo, P. et al. (2002). Diffuse large B-cell lymphoma outcome prediction by gene-expression profiling and superv ised mac h ine learning. Nat. Me d. 8 68–74. Simon, R. , Radmacher, M. D. , Dobbin, K. and McShane, L. M. (2003). Pitfalls in the use of DNA microarray d ata for diagnostic and p rognostic classification. J. Natl. Canc er Inst. 95 14–1 8. Singh, D. , Febbo, P. , Ross, K. et al. (2002). Gene expression correlates of clinical prostate cancer b ehavior. C anc er Cel l 1 203 –209. Stuar t, R. , W achsman, W. , Berr y, C. et al. (2004). In silico dissection of cell-typ e- associated pattern s of gene expression in p rostate cancer. Pr o c. Natl. A c ad. Sci. USA 101 615–620 . T an, A. C. , Nai man, D. Q. , Xu, L. et al. ( 2005). Simple decision rules for classifying human cancers from gene exp ression profiles. Bioinformatics 21 3896–3 904. Thomas, R. K. , Baker, A. C. , DeBiasi, R. M. et al. (2007). High- t hroughput on cogene mutatio n profiling in human cancer. Natur e Genetics 39 347–3 51. Tibshirani, R. (2011). P AM R Pa c k age. Av ailable at http://www- stat.stanford.edu/ ~ tibs/PAM/Rdist/index.html . Tibshirani, R. , Hastie, T. , Narasimhan , B. and Chu, G. (2002). Diagnosis of multiple cancer typ es by shrunken centroi ds of gene expression. Pr o c. Natl. A c ad. Sci. USA 99 6567–65 72. W ang, X. (2012). Robust tw o-gene class ifiers for cancer prediction. Genomics 99 90–95. Weichselbaum, R. R. , Ishw aranc, H . , Yoona, T. et al. (2008). An in terferon-related gene signature for D NA damage resistance is a p redictive marke r for chemotherapy and radiation for breast cancer. Pr o c. Natl. A c ad. Sci. USA 105 1849 0–18495 . 24 B. AFSARI, U. M. BRA GA- NETO AND D. GEM AN Welsh, J. , Sapinoso, L. , S u, A. et al. (2001). A nalysis of gene expression iden tifies candidate markers and pharmacological targets inprostate cancer. Canc er R es. 61 5974– 5978. Wilcox on, F. (1945). Individu al compari sons by ranking methods. Biometrics 80–83. Winslow , R. , Tra y anov a , N. , Geman, D. an d Miller, M. (2012). The emerging dis- cipline of computational medicine. Sci. T r ansl. Me d. 4 158rv11. Xu, L. , Geman, D. and Winslo w, R. L. (2007). Large-scale in t egration of cancer mi- croarra y d ata identifies a robust common cancer signature. BMC Bi oinformatics 8 275. Xu, L. , T an, A . C. , Naiman, D. Q. et al. (2005). Robust prostate cancer marke r genes emerge f rom d irect in tegration of in ter-study microarray data. BMC Bioinformatics 21 3905–39 11. Y ao , Z. , Jaeger, J. , Ruzzo, W. L. et al. (2004). Gene exp ression alterations in prostate cancer predicting tumor aggres sion and preceding developmen t of malignancy. J. Cl i . Onc ol. 22 2790–279 9. Y ao , Z. , Jaege r, J. , Ruzzo, W. et al. (2007). A Marfan syndrome gene expression phenotype in cultured skin fibroblasts. BMC Genomics 8 319. Yeang, C. , Ramasw amy, S. , T ama yo, P. et al. (2001). Molecular class ification of mul- tiple tumor types. Bioinformatics 17 S316–S322. Zhang, H . , Yu, C. Y . and Si nger, B. (2003). Cell and tumor classification using. Pr o c. Natl. A c ad. Sci. USA 100 4168–4172. Zhang, H. H. , Ahn, J. , Lin , X. and P ark, C. (2006). Gene selectio n using sup p ort vector machines with nonconv ex pen alt y . Bioinformatics 22 88–95. Zhao, H. , Logothetis, C. J. and Gorlo v, I. P. (2010). Usefulness of the top-scoring pairs of genes for prediction of prostate cancer progression. Pr ostate Canc er Pr ostatic Dis. 13 252–2 59. B. Afsari Dep ar tment of Electric al and Computer Engineering Johns Hopkins University Bal timore, Mar yland 21218 USA E-mail: bahman@jh u. edu U. M. Braga-Neto Dep ar tment of Electric al and Computer Engineering Texas A&M University College St at ion, Texa s 77843 USA E-mail: ub@ieee.org D. Geman Dep ar tment of Applied Ma them a tics an d St a tistics Johns Hopkins University Bal timore, Mar yland 21218 USA E-mail: geman@jh u. com
Original Paper
Loading high-quality paper...
Comments & Academic Discussion
Loading comments...
Leave a Comment