Highly comparative time-series analysis: The empirical structure of time series and their methods
The process of collecting and organizing sets of observations represents a common theme throughout the history of science. However, despite the ubiquity of scientists measuring, recording, and analyzing the dynamics of different processes, an extensi…
Authors: Ben D. Fulcher, Max A. Little, Nick S. Jones
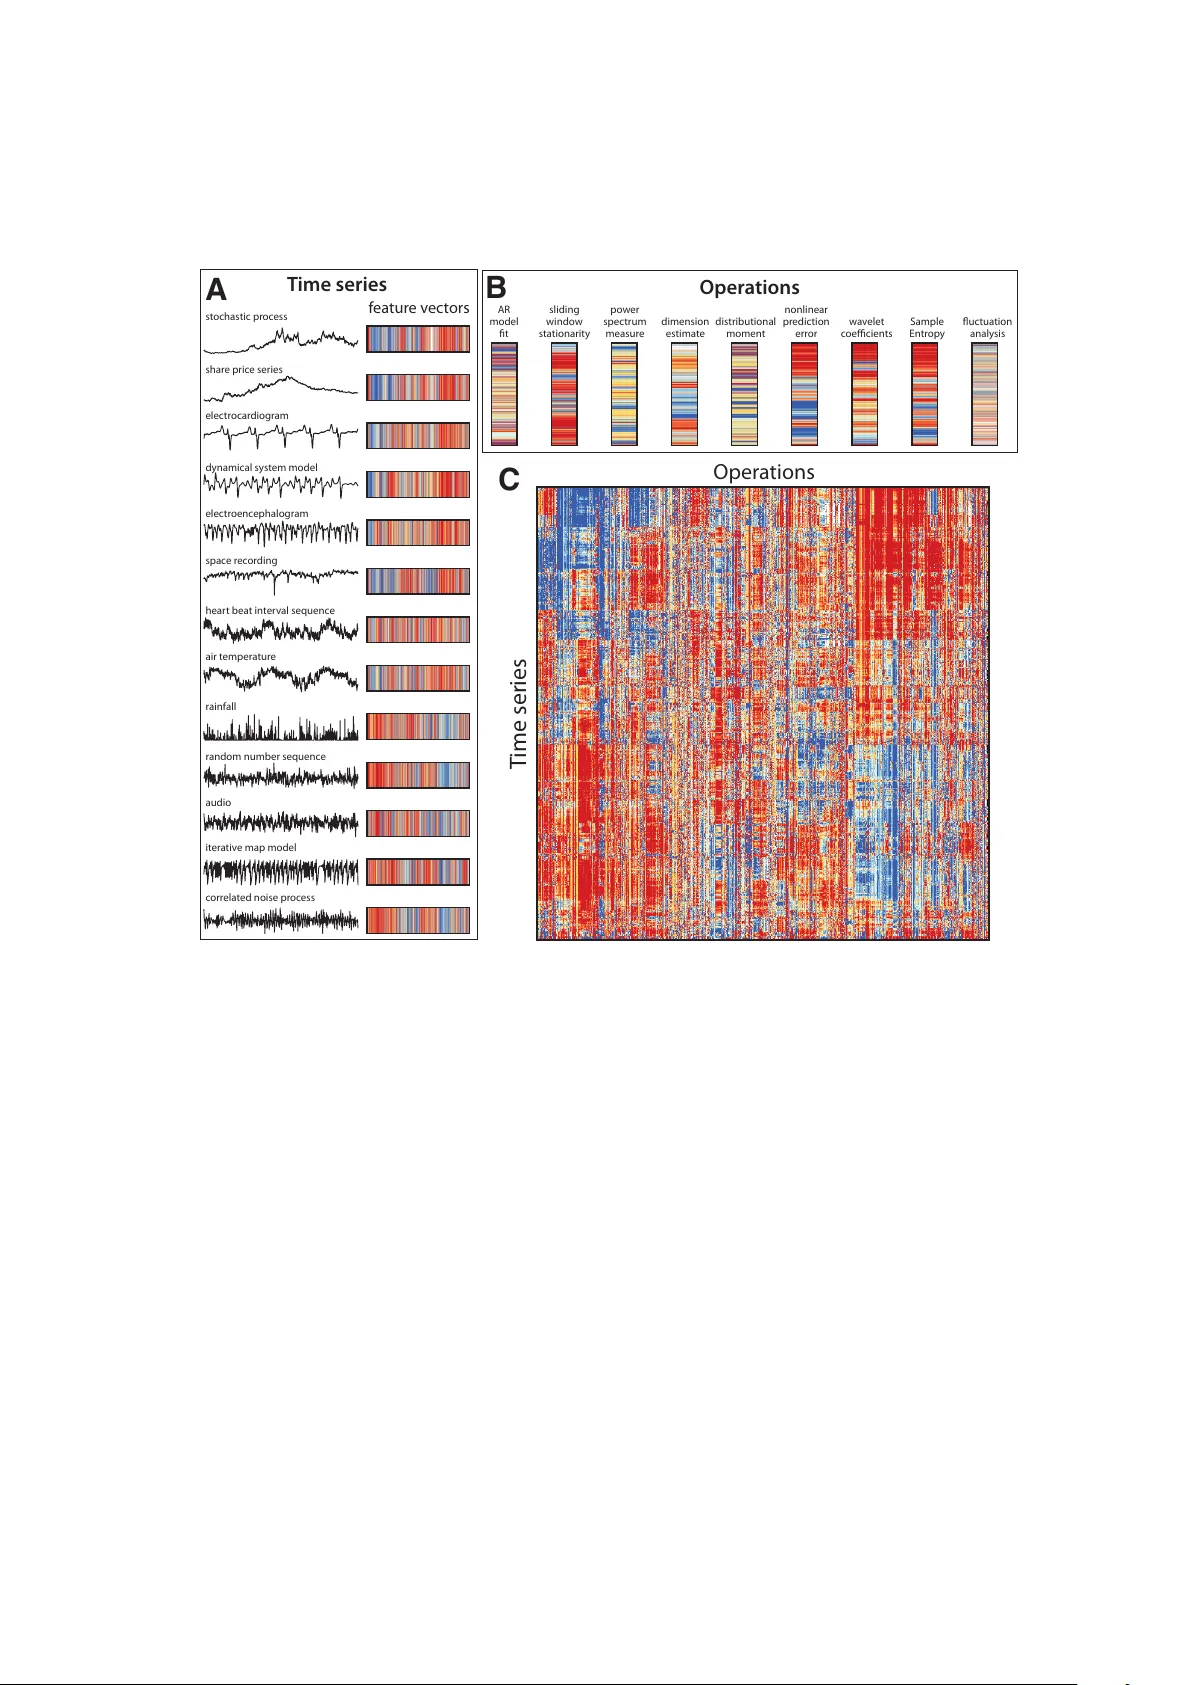
Highly comparativ e time-series analysis: The empirical structure of time series and their metho ds Ben D. F ulc her 1 , Max A. Little 1 , Nic k S. Jones 1 , 2 1 Departmen t of Ph ysics, Univ ersit y of Oxford 2 Departmen t of Mathematics, Imp erial College, London Summary The pro cess of collecting and organizing sets of observ ations represen ts a common theme through- out the history of science. Ho wev er, despite the ubiquit y of scientists measuring, recording, and analyzing the dynamics of different pro cesses, an extensive organization of scientific time-series data and analysis metho ds has never b een performed. Addressing this, annotated collections of ov er 35 000 real-w orld and mo del-generated time series and o ver 9 000 time-series analysis algorithms are analyzed in this w ork. W e in tro duce reduced representations of b oth time series, in terms of their prop erties measured by div erse scientific methods, and of time-series analysis methods, in terms of their b eha viour on empirical time series, and use them to organize these in terdisciplinary resources. This new approach to comparing across diverse scientific data and metho ds allo ws us to organize time-series datasets automatically according to their properties, retriev e alternatives to particular analysis metho ds developed in other scientific disciplines, and automate the selection of useful meth- o ds for time-series classification and regression tasks. The broad scientific utility of these to ols is demonstrated on datasets of electro encephalograms, self-affine time series, heart b eat in terv als, sp eec h signals, and others, in each case con tributing nov el analysis techniques to the existing liter- ature. Highly comparativ e tec hniques that compare across an interdisciplinary literature can thus b e used to guide more focused researc h in time-series analysis for applications across the scientific disciplines. 1 In tro duction Time series, measurements of a quantit y tak en ov er time, are fundamental data ob jects studied across the scien tific disciplines, including measurements of sto c k prices in finance, ion fluxes in astroph ysics, atmospheric air temp eratures in meteorology , and h uman heart b eats in medicine. In order to understand the structure in these signals and the mechanisms that underly them, scientists hav e developed a large v ariety of tec hniques: metho ds based on fluctu ation analysis are frequen tly used in Ph ysics [1], generalized autoregressiv e conditional heterosk edasticity (GAR CH) mo dels are common in Economics [2], and en tropy 1 measures lik e Sample Entrop y are p opular in medical time-series analysis [3], for example. But are these metho ds that hav e b een dev elop ed in different disciplinary contexts summarizing time series in unique and useful wa ys, or is there something to b e learned b y syn thesizing and comparing them? In this pap er, we address this question b y assem bling extensiv e annotated libraries of b oth time-series data, and metho ds for time-series analysis. W e use each to organize the other: metho ds are c haracterized b y their b eha viour across a wide v ariety of differen t time series, and time series are characterized b y the outputs of diverse scientific metho ds applied to them. The structure that emerges from these collections of data and metho ds provides a new, unified platform for understanding the interdisciplinary time-series analysis literature. Although a strong theoretical foundation underlies man y time-series analysis metho ds, their great n umber and interdisciplinary diversit y makes it v ery difficult to determine how metho ds dev elop ed in differen t disciplines relate to one another, and for scientists to select appropriate metho ds for their finite, noisy data. It is similarly difficult to determine ho w time series studied in one scien tific discipline compare to those studied in other disciplines, or to the dynamics defined b y theoretical time-series mo dels. The automated, data-driven tec hniques introduced in this work address these practical difficulties by allo wing div erse metho ds and data from across the sciences to b e compared in a unified representation. The high-throughput analysis of the DNA microarray in biology is now a standard complement to traditional, more fo cused research efforts; w e envisage the comparative tec hniques introduced in this work pro viding a similarly guiding role for scien tific time-series analysis. Previous comparisons of time-series analysis metho ds hav e b een p erformed only in sp ecific disciplinary con texts and on a small scale, and attempts to organize large time-series datasets hav e typically in volv ed time series of a fixed length and measured from a single system [4, 5]. This work therefore represents the first scientific comparison of its kind and is unprecedented in both its scale and interdisciplinary breadth. The pap er is structured as follows. In Sec. 2, w e describe our extensiv e, annotated libraries of scien tific time-series data and time-series analysis metho ds and in tro duce our computational framework. Then, in Sec. 3, we show ho w these div erse collections of b oth metho ds (Sec. 3.1) and data (Sec. 3.2) can be organized meaningfully: by represen ting metho ds using their b eha viour on the data, and represen ting time series b y their measured prop erties. Using this new ability to structure diverse collections of time series and their metho ds, w e introduce a range of useful tec hniques, including the abilit y to connect sp ecific pieces of time-series data to similar real-world and mo del-generated time series, and to link a sp ecific time-series analysis methods to a range of alternativ es from across the literature. The highly comparativ e analysis techniques are demonstrated using scien tific case studies in Sec. 4. The diverse range of scientific metho ds in our library are used to contribute new insigh ts into existing time-series analysis problems: unco vering meaningful structure in time-series datasets, and selecting relev ant metho ds for general time- series classification and regression tasks automatically . W e con trast our approac h, that compares across a wide, interdisciplinary time-series analysis literature, to that of con ven tional studies that fo cus on small sets of manually-selected tec hniques with minimal comparison to alternatives. Our main conclusions are summarized in Sec. 5. 2 2 F ramew ork W e assem bled annotated libraries of: (i) 38 190 univ ariate time series measured from div erse real-world systems and generated from a v ariety of syn thetic mo del systems, and (ii) 9 613 time-series analysis algorithms dev elop ed in a range of scientific literatures, as well as new analysis metho ds dev elop ed b y us in this w ork. Ov er 20 000 real-world time series were acquired, primarily from publicly-a v ailable databases, whic h hav e b een selected to encompass a represen tative sample of the t yp es of signals measured in scientific disciplines: from meteorology (e.g., temperature, air pressure, rainfall, river flow), medicine (e.g., heart-b eat in terv als, electro cardiograms, electro encephalograms), audio (e.g., h uman sp eec h, music, sound effects, animal sounds), astroph ysics (e.g., solar radio flux, interplanetary magnetic field), finance (e.g., exc hange rates, sto ck prices), and others. In addition, w e generated o ver 10 000 synthetic time series, including outputs from a range of nonlinear and chaotic maps, v arious dynamical systems/flows, correlated noise models, and other stochastic pro cesses. Although it is clearly unfeasible to pro duce exhaustiv e libraries of all types of scientific time-series data, we hav e attempted to b e as comprehensiv e and ev en-handed as possible. Ho wev er, emphasis w as inevitably giv en to time series in publicly-av ailable rep ositories, and outputs from time-series mo dels that were relativ ely simple to implement. A list of time series used in this w ork, including descriptions and references, is in the supplementary do cumen t Time Series List . Metho ds for time-series analysis take on a v ariety of forms, from simple summary statistics to statis- tical mo del fits. W e implemented each suc h metho d as an algorithm: an op er ation that summarizes an input time series with a single real num b er. Our library of o ver 9 000 suc h operations quantify a wide range of time-series prop erties, including basic statistics of the distribution (e.g., lo cation, spread, Gaussianit y , outlier prop erties), linear correlations (e.g., auto correlations, features of the p o wer sp ectrum), stationar- it y (e.g., StatAv, sliding window measures, unit root tests, prediction errors), information theoretic and en tropy measures (e.g., auto-mutual information, Approximate Entrop y , Lempel-Ziv complexit y), meth- o ds from the physical nonlinear time-series analysis literature (e.g., correlation dimension, Ly apunov exp onen t estimates, surrogate data analysis), linear and nonlinear mo del fits [e.g., go o dness of fit and parameter v alues from autoregressive mo ving av erage (ARMA), generalized autoregressive conditional heterosk edasticity (GARCH), Gaussian Pro cess, and state space models], and others (e.g., wa velet meth- o ds, properties of netw orks derived from time series, etc.). A large comp onen t of this w ork in v olved implemen ting existing time-series analysis metho ds (including publicly av ailable pack ages and to olb o xes) in the form of operations. In some cases it was necessary to form ulate new t yp es of op erations that appro- priately summarized the outputs of existing metho ds, and in other cases we developed new, qualitatively differen t t yp es of op erations, that are introduced for the first time in this work (see Sec. S1.1.2 of the SI). The collection is inevitably incomplete, and indeed this op erational framew ork is more suited to those metho ds that can b e automated than more subtle types of analysis that require delicate hands-on experi- men tation by a time-series analysis exp ert. How ev er, in the pro cess of collecting and implementing these metho ds, we made a concerted effort to incorporate and appropriately automate as man y distinct t yp es of scien tific time-series analysis metho ds as p ossible. The result is sufficiently comprehensive to achiev e the range of successful results reported in this w ork. Note that although w e list o ver 9 000 op erations, this num b er includes cases for whic h a single metho d is rep eated for multiple parameter v alues (e.g., cal- culating the auto correlation function at 40 differen t time lags constitutes 40 differen t operations despite 3 simply v arying a single parameter of a single metho d); the n umber of conceptually distinct metho ds is significan tly low er (one estimate arrives at appro ximately 1 000 unique op erations, cf. Sec. S1.1.2). A full list of op erations developed for this work, including references and descriptions, is in the supplementary do cumen t Op er ation List . A fundamental comp onen t of this w ork in volv es analyzing the result of applying a large set of op- erations to a large set of time series. This computation can b e visualized as a data matrix with time series as rows and operations as columns, as shown in Fig. 1C. Each element of the matrix, D ij , con tains the output of an op eration, F j , applied to a time series, x i , so that D ij = F j ( x i ). Correspondingly , time series are represented as feature v ectors con taining measuremen ts of an extensive range of their prop erties (Fig. 1A), and op erations are represen ted as feature vectors con taining their outputs across a time-series dataset (Fig. 1B). In order to allow operations with different ranges and distributions of outputs to b e compared meaningfully , w e applied an outlier-robust sigmoidal normalizing transformation to the outputs of eac h op eration, as describ ed in Sec. S1.2.2. Time series are compared using Euclidean distances calculated b etw een their feature v ectors, and op erations are compared using correlation-based distances measured b et ween their outputs (either linear correlation-based distances to capture linear relationships or normalized mutual information-based distances to capture p otentially nonlinear relation- ships, cf. Sec. S1.3.1). Thus time series are judged as similar that hav e many similar prop erties, and op erations are judged as similar that ha ve highly correlated outputs across a time-series dataset. Note that when op erations do not output a real num b er or are inappropriate (e.g., it is not appropriate to fit a p ositiv e-only distribution to non-p ositiv e data), these outputs are referred to as ‘sp ecial v alues’ and are treated as missing elements of the data matrix that can b e filtered out (cf. Sec. S1.1.5). The ric h structure in the data matrix shown in Fig. 1C, whic h combines the results of applying a wide range of scien tific time-series analysis methods to a diverse set of time series, thus encapsulates in teresting relationships b etw een differen t wa ys of measuring structure in time series (columns), and relationships b etw een data generated by different types of systems (ro ws). F or example, redundancy across analysis metho ds is indicated by a set of adjacent columns in the data matrix that displa y similar patterns (these operations exhibit similar behaviour across a great v ariety of d ifferent time series). In this w ork, w e introduce a range of simple tec hniques for extracting this kind of in teresting and scientifically meaningful structure from data matrices, as illustrated schematically in Fig. 2. In particular, w e show that represen ting time series in terms of their measured properties, and analysis metho ds in terms of their b eha viour on empirical data, can form a useful basis for answering the t yp es of questions depicted in Fig. 2, including the abilit y to structure collections of data (Fig. 2A) and metho ds (Fig. 2B), find matches to particular time series (Fig. 2C) or methods (Fig. 2D), and p erform time-series regression (Fig. 2E) or classification (Fig. 2F) automatically . Our approac h is unusual in that it is completely automated and uses no domain kno wledge ab out the time series, or any information ab out the theoretical assumptions underlying the analysis metho ds: we simply use the empirical behaviour of metho ds and time series as a platform for comparison. Using numerous examples from across science, w e demonstrate that our libraries of time-series data and their analysis methods are sufficiently comprehensive for this approac h to yield no vel and scien tifically meaningful results for a range of applications. 4 st ochastic pr oc ess shar e pr ic e ser ies dynamical sy st em model elec tr oenc ephalog r am spac e r ec or ding hear t bea t in t er v al sequenc e air t emper a tur e r ainfall r andom number sequenc e audio it er a tiv e map model c or r ela t ed noise pr oc ess elec tr ocar diog r am T ime series f ea tur e v ec t ors nonlinear pr edic tion er r or w a v elet c oecien ts uc tua tion analy sis distr ibutional momen t dimension estima t e po w er spec trum measur e sliding windo w sta tionar it y AR model t S ample En tr op y O per a tions T ime ser ies Oper a tions A B C Figure 1: A unified representation of time series and their analysis metho ds. A fundamental component of this work, which inv olves applying large num b ers of time-series analysis metho ds, or op erations, to large time- series datasets, can b e visualized as a data matrix, shown in C , where each column represen ts an op eration and each row represents a time series. Elemen ts of the matrix contain the (normalized) results of applying eac h op eration to eac h time series, and are visualized using colour: from blue (low op eration outputs) to red (high op eration outputs). W e note the similarity of this time-series data matrix to the DNA microarray used in biology , that sim ultaneously measures the expression levels under multiple conditions (our op erations) of large num b ers of genes (our time series). Ro ws and columns hav e b een reordered using link age clustering to place similar time series and similar op erations close to one another (cf. Sec. S1.3.2). Thus, time series (rows of the data matrix) are represented as feature vectors containing a large n umber of informative prop erties, illustrated in A , and op erations (columns of the data matrix) are represented as feature vectors containing their outputs across a set of time series, illustrated in B . In this figure, we use an in terdisciplinary set of 875 time series and 8 651 w ell-b eha ved op erations (cf. Sec. 1.1.5); the matrix in C has b een resized to approximately square prop ortions for the purp ose of visualization. The rich structure in this data matrix enco des relationships b et ween differen t scientific time series and diverse types of analysis methods, relationships that are in vestigated in detail in this work. 5 = oper a tion of t ype ‘ blue ’ = time ser ies of t ype ‘ g r een ’ c aptur es b ehaviour acr oss a r ange of empiric al time series c aptur es pr op er ties measur ed b y div erse scientic metho ds W hich methods help me t o classify time ser ies in m y da taset? O p er ation X O p er ation Y A ut omatic ally learn classiers 5E F X Y C ompar e all: op er ations X and Y p er form w ell t o gether D o an y e xisting time -ser ies analy sis methods v ar y with a numer ical label a ttached t o m y da ta? O p er ation X numer ical label oper a tion output 5D C ompar e all op er ations: op er ation X p er forms w ell X E A ut omat ed r egr ession W hich time -ser ies analy sis methods ar e similar t o the methods I use? C onnec ts scientic metho ds using their empiric al b ehaviour a pair of similar metho ds fr om a distant lit er atur e an unexp ec t ed metho d with similar b ehaviour m y fa v ourit e analy sis method D W ha t t ypes of r eal- w or ld and model- gener a t ed time ser ies ar e similar t o m y da ta? mat ching mo del- gener at ed data mat ching r eal data m y fa v ourit e time series 3B 4C, 4D C Ho w do scien tic methods r ela t e t o one another? 3A, 5B B 4A, 4B, 5A Is ther e an y struc tur e in m y time -ser ies da taset? clust ers of similar time series clust ers of similar metho ds A Figure 2: Key scientific questions that can b e addressed by represen ting time series by their prop- erties (measured by many types of analysis metho ds) and op erations by their b eha viour (across man y types of time-series data). W e show that this representation facilitates a range of versatile techniques for addressing scientific time-series analysis problems, that are illustrated schematically in this figure. The repre- sen tations of time series (rows of the data matrix, Fig. 1A) and op erations (columns of the data matrix, Fig. 1B), serv e as empirical fingerprin ts, and are shown in the top panel. Coloured borders are used to label differen t classes of time series and op erations, and other figures in this pap er that explicitly demonstrate each tec hnique are given in the b ottom righthand corner of each subfigure. A Time-series datasets can b e organized automatically , reveal- ing the structure in a giv en dataset (cf. Figs. 4A, 4B, 5A). B Collections of scien tific metho ds can b e organized automatically , highlighting relationships b etw een metho ds developed in different fields (cf. Figs. 3A, 5B). C Real-w orld and mo del-generated data with similar prop erties to a sp ecific time series target can b e identified (cf. Figs. 4C, 4D). D Given a sp ecific op eration, alternatives from across science can b e retrieved (cf. Fig. 3B). E Regression: the b eha viour of op erations in our library can b e compared to find op erations that v ary with a target c haracteristic assigned to time series in a dataset (cf. Fig. 5D). F Classification: operations can b e selected based on their classification p erformance to build useful classifiers and gain insigh ts in to the differences b et ween classes of labeled time-series datasets (cf. Fig. 5E). 6 3 Empirical structure In this section we inv estigate the empirical structure of our annotated libraries of time series and their metho ds using the t yp es of analysis depicted schematically in Figs. 2A–D. First, in Sec. 3.1, w e show that the op erations (columns of the data matrix in Fig. 1) can be organized in a meaningful w ay using their b ehaviour on a set of 875 different time series. Then, in Sec. 3.2, we p erform a similar treatmen t for time series (rows of the data matrix in Fig. 1). W e find that b y judging op erations and time series using a form of empirical fingerprint of their b eha viour facilitates a useful means of comparing them. 3.1 Empirical structure of time-series analysis metho ds First we analyze the structure in our library of time-series analysis op erations when applied to a rep- resen tative interdisciplinary set of 875 real-world and mo del-generated time series (a selection of time series in this set are illustrated in Fig. 1A). This carefully controlled set of 875 time series w as selected to encompass the different t yp es of scien tific time series as even-handedly as possible (for example, the full time-series library c on tains a large num b er of ECGs and rainfall time series; by using a con trolled set we a void emphasizing the b ehaviour of operations on these particular classes of time series that happen to b e more n umerous in our library , cf. Sec. S2.1). Op erations that returned less than 20% sp ecial-v alued outputs on this set of time series were analyzed: a collection of 8 651 op erations. In this section we sho w that the b eha viour of op erations on these 875 div erse scien tific time series becomes a useful form of empirical fingerprint for them that groups similar t yp es of op erations and distinguishes very different t yp es of op erations. W e used clustering [6] to uncov er structure in these 8 651 op erations automatically (as in Fig. 2B). Clustering can b e performed at different resolutions to produce different ov erviews of the time-series analysis literature. F or example, clustering the op erations into four groups using k -medoids clustering [6] is depicted in Fig. 3A, and reflects a crude but intuitiv e summary of the t yp es of metho ds that scien tists ha ve developed to study time series. Although highly simplified, the result shows that we can b egin to organize an in terdisciplinary metho dological literature in an automatic, data-driven w ay . Next w e ask a more subtle question: how many different t yp es of operations are required to provide a go od summary of the rich diversit y of b eha viours exhibited b y the full set of 8 651 scientific time-series analysis op erations? Clustering at finer levels allo ws us to prob e this, and to construct reduced sets of op erations that efficiently appro ximate the behaviours in the full library by eliminating metho dological redundancy . The quality of such reduced sets of operations is quantified using the r esidual varianc e measure, 1 − R 2 , where R is the linear correlation coefficient measured b etw een the set of distances b et w een time series in a reduced space, and those in the full space [8]. Using k -medoids clustering for a range of cluster n umbers, k , we found that a reduced set of 200 op erations pro vides a very go o d appro ximation to the full set of 8 651 op erations, with a residual v ariance of just 0.05 (cf. Sec. S2.2). These 200 op erations thus form a concise summary of the differen t b ehaviours of time-series analysis metho ds applied to scientific time series, and draw on techniques developed in a range of disciplines, including auto correlation, autom utual information, stationarity , entrop y , long-range scaling, correlation dimension, wa velet transforms, linear and nonlinear model fits, and measures from the p o wer spectrum 7 2. S ta tionarit y pr oper ties that change with time e .g ., mean in thr ee segments sliding windo ws discr et e par titions 4. N onlinear T ime -S eries A naly sis dimension estimat es L yapuno v exponents nonlinear pr edic tion er r or e .g ., time - delay embedding −2 0 2 −2 0 2 −2 0 2 x i x i-1 x i-2 3. I nf orma tion T heor y aut omutual inf or mation entr op y B A C C C C C C C A A A A A A B B B B B 1. Linear C orr ela tion shor t -range pr edic tabilit y ARM A models aut ocor r elation spec tral methods lag c orr elation fr equenc y P o w er c orr elogr am po w er spectrum time ser ies fr om r eal-w or ld and mo del sy st ems A pEn(2,0.2) A ut omutual I nf orma tion S hannon En tr op y L empel-Ziv C omple xit y R andomiz ed S ample En tr op y S ample En tr op y A ppr o xima t e En tr op y A B Figure 3: Structure in a library of 8 651 time-series analysis op erations. A A summary of the four main classes of op erations in our library , as determined b y a k -medoids clustering, reflects a crude but intuitiv e o verview of the time-series analysis literature. B A netw ork represen tation of the op erations in our library that are most similar to the Approximate En tropy algorithm, ApEn(2,0.2) [7], which were retriev ed from our library automatically . Each no de in the netw ork represen ts an operation and links enco de distances b et ween them (computed using a normalized mutual information-based distance metric, cf. Sec. S1.3.1). Annotated scatter plots show the outputs of ApEn(2,0.2) (horizontal axis) against a representativ e member of each shaded comm unity (indicated by a hea vily outlined no de, vertical axis). Similar pictures can b e pro duced b y targeting an y given operation in our library , thereby connecting different time-series analysis metho ds that nevertheless displa y similar b eha viour across empirical time series. (cf. supplementary do cumen t 200 Op er ations ). Constraints on the dynamics observ ed in empirical time series th us allows us to exploit redundancy in scien tific metho ds acting on them. In Sec. 3.2, this reduced set of op erations is used to organize our time-series library . As well as analyzing the ov erall structure in our library of op erations, it is also informative to explore the lo cal structure surrounding a given target op eration (as depicted in Fig. 2D). In this w ay , the b eha viour of any given operation can be con textualized with resp ect to alternativ es from across the time- series analysis literature, including metho ds dev elop ed in unfamiliar fields, or in the distant past. An example is shown in Fig. 3B for the Approximate En tropy algorithm, ApEn(2,0.2), a ‘regularity’ measure that has b een applied widely [7]. In Fig. 3B, no des in the netw ork are the most similar op erations to ApEn(2,0.2) in our library , and links indicate their similarities (using a m utual information-based distance metric to capture correlations across the set of 875 time series, cf. Sec. S1.3.1). The netw ork con tains differen t comm unities of similar operations, including metho ds based on Sample En tropy , Lempel-Ziv complexit y , automutual information, Shannon entrop y , and other Appro ximate Entropies. Inset scatter plots show the relationships b et w een ApEn(2,0.2) and the other op erations across different types of scien tific time series. W e thus disco ver that, even when mixed with 8 650 different operations, related families of entrop y measures are retrieved automatically and organized meaningfully by comparing their b eha viour across a con trolled set of 875 time series. Similar pictures can b e produced straightforw ardly for an y op eration in our library , as is done for fluctuation analysis and singular sp ectrum analysis, for example, in the SI (Sec. S2.4). 8 W e thus find that representing time-series analysis metho ds using an empirical fingerprin t of their b eha viour across 875 differen t time series pro vides a useful means of comparing and structuring a method- ological literature. Across the scien tific disciplines, there exists a v ast num b er of time-series analysis metho ds, but no framework with whic h to judge whether progress is really b eing made through the con- tin ual dev elopment of new types of metho ds. By comparing their empirical b eha viour, the techniques demonstrated ab ov e can be used to connect new methods to alternatives developed in other fields in a w ay that encourages interdisciplinary collab oration on the developmen t of nov el methods for time-s eries analysis that do not simply repro duce the b eha viour of existing methods. 3.2 Empirical structure of time series Ab o v e we studied the structure in our library of scientific op erations using their behaviour on empirical time series; in this section we analyze a collection of 24 577 time series in a similar wa y . Time series are compared using the set of 200 representativ e op erations formed abov e to measure their properties, pro viding an empirical means of comparing them and addressing useful scientific questions (as depicted in Figs. 2A, C). W e restricted our clustering analysis to this set of 24 577 time series, whic h is an appropriate subset of the full library of 38 190 time series that remo ves very short time series (of less than 1 000 samples) and filters ov er-represented classes of time series (as explained in Sec. S3.2). Finding structure in a set of time series of differen t lengths and measured in differen t w ays from different systems is a ma jor challenge [5]; w e show that this empirical fingerprint of 200 diverse time-series analysis op erations facilitates a meaningful comparison of scientific time series. First, w e formed 2 000 clusters of time series from our library (using complete link age clustering, cf. Sec. S3.2). Despite the size of our library and the div ersity of time series contained in it, most clusters group ed time series measured from the same system; some examples are shown in Fig. 4A (more examples are in Sec. S3.2.1). Since the clustering is done b y comparing a wide range of time-series prop erties, clusters app ear to group time series according to their dynamics, even when they ha ve different lengths. Some clusters contained time series generated by differen t systems, suc h as the cluster illustrated in Fig. 4B, that contains time series generated from three differen t iterativ e maps: the Cubic Map , the Sine Map , and the Asymmetric L o gistic Map [9]. Although this cluster contains time series of different lengths and generated from different maps, it groups outputs from each map with parameters that sp ecify a similar recurrence relationship, as sho wn in the inset plot of Fig. 4B. This cluster therefore distinguishes a distinct and meaningful class of dynamical b eha viour from a large library of time series (as do many other clusters, cf. Sec. S3.2.2). Con v entional measures of time-series similarity are often based on distances measured b et ween the time-series v alues themselves and are hence restricted to sets of time series of a fixed length [5]. Represen ting time series b y a diverse range of their prop erties is clearly a p ow erful alternativ e that captures important dynamical b ehaviour in general collections of scien tific time series. Our reduced representation of time series also allo ws us to retrieve a local neigh b orhoo d of time series with similar prop erties to any giv en target time series (note that this searc h is done across the full library of 38 190 time series). This automated pro cedure can b e used to relate real-world time series to similar, mo del-generated time series in a wa y that suggests suitable families of mo dels for understanding real-w orld systems (as depicted in Fig. 2C). An example is shown in Fig. 4C, where real-w orld and mo del-generated 9 S t o chastic sine map tar get: r eal-w orld mat ches: cloud amoun t lo w cloud c o v er w ea ther t ypes wind speed wind dir ec tion D ung T w o - W ell Oscilla t or Speech C ongestiv e Hear t F ailur e EC Gs Elec tr ooculog r ams C ubic M ap 2.75 2.8 2.65 2.75 2.8 Sine M ap 1.1 1.1 A symmetr ic L og istic M ap 4.25 4.35 4.20 4.30 4.15 0 0 1 1 op ening shar e pric es st o chastic mo dels O XIG B C A D Figure 4: Structure in a large, div erse library of scientific time series. Represen ting time series using an empirical fingerprint containing 200 of their measured prop erties, a diverse collection of 24 577 time series w as clustered in to 2 000 groups. A Most clusters formed in this w ay are homogenous groups of time series of a given real-w orld or mo del system; four such examples are shown. B A time-series cluster is plotted that con tains time series generated by three different iterative maps with parameters that sp ecify a common recurrence relationship. Time-series segments of 150 samples are plotted and lab eled with the parameter A of the map that generated them (b old lab els indicate 5 000-sample time series, the others are 1 000 samples long). Recurrence relationships, x n +1 ( x n ), are plotted and are similar for all time series. C An op ening share price series for Oxfor d Instruments (lab eled OXIG) is targeted; the most similar real-world time series are opening share prices of other stocks (red no des), and the most similar mo del-generated time series are from sto c hastic differen tial equations (blue nodes). Links in the netw ork represent similarities b et ween the time series judged using Euclidean distances, d , b etw een their normalized feature vectors (darker, thick er links hav e d < 3, cf. Sec. S1.3.1). D The most similar real-world time series to a Stochastic Sine Map target are meteorological pro cesses that display qualitatively similar ‘noisy switc hing’ dynamics. 10 matc hes to a series of op ening share prices for Oxfor d Instruments (OXIG) are plotted as a net work. Real-w orld matches are other op ening share price series, and model-generated matc hes are outputs from sto c hastic differential equations (SDEs). Indeed, the form of SDE mo dels suggested b y this set of matc hes, e.g., dX t = µX t dt + σ X t dW t , is the same as geometric Brownian motion, whic h is used in financial mo deling [10] (where X t represen ts the time series, W t denotes a Wiener process, and other v ariables are parameters). Matches to SDE mo dels with slightly differen t forms, e.g., dX t = a ( b − X t ) dt + σ √ X t dW t , suggest that other models with particular parameter v alues can also repro duce man y prop erties of the target share price series that are not unique to the geometric Bro wnian motion model. Although this is an extremely crude alternative to conv entional time-series modeling, it nev ertheless allo ws real-w orld time series to b e link ed to relev ant model systems in a completely automated and data-driv en wa y . Analogous insigh ts w ere gained for rainfall patterns, astrophysical recordings, h uman sp eech recordings, and others in Sec. S3.3. Applying the same metho d in ‘rev erse’, we also targeted time series generated b y mo dels and retrieved real-w orld time series with similar dynamics. F or example, in Fig. 4D, w e targeted a time series generated b y the sto chastic sine map model, which has a fixed probabilit y of additive uniformly-distributed noise at eac h time step that can switch the system betw een t wo stable limit cycles [11]. As exp ected, the closest mo del-generated matc hes were other sto c hastic sine map time series generated using the same parameters as the target (not sho wn here, cf. Sec. S3.3.2), while real-w orld matc hes were meteorological processes that exhibit the same qualitativ e ‘noisy switching’ dynamics (Fig. 4D). Thus, the dynamics sp ecified b y the sto c hastic sine map model were explicitly linked to that of relev ant real-world meteorological pro cesses automatically , suggesting that this type of sto c hastic switching mechanism may capture some of the prop erties of these meteorological systems. Using this simple, general metho d for connecting real- w orld and mo del dynamics, w e obtained similar results using noise-corrupted sine wa ves and self-affine time series in Sec. S3.3.2. W e ha ve in tro duced large, annotated collections of time series and their metho ds from across the scien tific disciplines and used the behaviour of each applied to the other to analyze structure in them. Although represen ting time series and their metho ds in terms of their empirical b eha viour migh t seem lik e an unusual idea that migh t not yield a particularly meaningful results, w e found that it indeed provides a p o w erful, data-driven means of in vestigating relationships betw een them. In particular, representing time series using 200 op erations and op erations using 875 time series app ears to be sufficient to organize them meaningfully . As illustrated in Figs. 2A–D, the metho ds w e introduce exploit this unified representation to connect individual pieces of time-series data to other time series with similar properties, and particular time-series analysis metho ds to alternatives with similar b eha viour. The examples shown here and in the comprehensiv e SI demonstrate the general applicabilit y of these techniques to a broad range of time-series analysis problems. 4 Applications In this section, w e sho w ho w our library of op erations can be used to pro vide new insights in to the analysis of sp ecific time-series datasets. W e emplo y the types of analysis demonstrated ab o ve, including organizing 11 sets of time series (depicted in Fig. 2A) and methods (Fig. 2B), and also in tro duce new tec hniques for selecting useful op erations for classification and regression tasks automatically (Figs. 2E, F). The broad utilit y of our highly comparativ e approac h to sp ecific scientific applications is shown using a wide range of scien tific case studies. Despite comparing across thousands of op erations, we find that the selection of useful operations can b e done in a statistically controlled manner using a m ultiple hypothesis testing framew ork describ ed in Sec. S1.3.6. A detailed analysis of eac h case study , including information ab out the dataset, statistical tests, interpretations of selected op erations, and further comparisons to the existing literature, can b e found in Sec. S4 (time-series regression) and Sec. S5 (time-series classification) of the SI. 4.1 EEG recordings In the first case study , w e show how the collectiv e b eha viour of our library of op erations can b e used to organize different t yp es of electroencephalogram (EEG) time series (cf. Fig. 2A), and w e assess whether progress is b eing made in a literature concerned with the classification of epileptic seizure EEGs (cf. Fig. 2F). The dataset contains 100 EEG signals from eac h of five classes: set A (healthy , eyes open), set B (healthy , eyes closed), set C (epileptic, not seizure, recorded from opp osite hemisphere of the brain to epileptogenic zone), set D (epileptic, not seizure, recorded within the epileptogenic zone), and set E (seizure) [12]. The tw o-dimensional Principal Comp onents pro jection of the dataset in the space of w ell-b eha ved operations is sho wn in Fig. 5A. This represen tation uses no kno wledge of the class lab els attac hed to the data, but simply organizes the time series according to their measured properties using our large and diverse library of op erations. The dataset is structured in a wa y that is consistent with its kno wn class structure: seizure time series (set E ) are particularly distinguished, and the t wo healthy (sets A and B ) and the tw o epileptic (sets C and D ) sets are close in this space. Dra wing on a large literature of time-series analysis op erations using low er-dimensional represen tations can evidently uncov er useful structure in time-series datasets, and indeed the same approac h was found to b e informative for a range of other systems (including p eriodic and noisy signals in Sec. S5.1.2, seismic signals in Sec. S5.2.3, emotional sp eec h recordings in Sec. S5.3.3, and RR interv als in Sec. S5.6.2). This dataset has previously been used to build classifiers that distinguish healthy EEGs from seizures using sets A and E . F or example, one study rep orts a supp ort vector mac hine classifier using op erations deriv ed from the discrete wa velet transform with a classification accuracy of at least 98.75% using re- sampled subsegments of this dataset [13]. Ho wev er, as sho wn in Fig. 5A, these tw o types of signals are separated automatically in the tw o-dimensional Principal Comp onen ts space of op erations, indicating that this task is relativ ely straigh tforward when exploiting a wide range of time-series analysis m ethods. Indeed, 172 different op erations in our library each individual ly discriminated betw een healthy EEGs and seizures with a 10-fold cross-v alidation linear classification rate exceeding 95%, with eigh t single op erations exceeding 98.75% (Sec. S5.4.3). These most successful operations are deriv ed from diverse areas of the time-series analysis literature, and provide in terpretable insights in to this classification problem: e.g., rev ealing that EEGs recorded during seizures hav e lo wer entrop y , low er correlation dimension estimates, lo wer long-range scaling exp onen ts , and distributions with a greater spread than those from healthy patien ts. In con trast to existing research that tends to focus on dev eloping increasingly complicated 12 health y ( A ) health y (B) epileptic ( C ) epileptic (D ) seizur e (E) F irst P r incipal C omponen t S ec ond P r incipal C omponen t A −1 0 1 2 3 A scaled, offset operation output D F A mean f or ecasting AR(3) c oecien t G aussian P r oc ess r eg r ession w a v elet scaling -1.0 -0.5 0.5 1.5 2.5 0.0 1.0 2.0 3.0 C D Mean of inertial particle trajectory (20%) p(AC): differenced time series (32%) E P ar k inson ’ s D isease H ealth y C on tr ol lo c a tion c on tr ol en tr opies pNN x linear mo dels sc aling |R| 0.9 1 0.8 0.7 0.6 0.5 <0.5 i ii iii iv 0 1 2 3 outlier measur e (13 ± 7 %) 0.6 0.6 1 1.2 mean (8 ± 5 %) 1 2 3 S ampEn(3,0.05) (15 ± 8 %) 0.4 0.8 1.2 v ar ianc e r a tio t est (14 ± 7 %) normal sinus r h ythm c ongestiv e hear t failur e B i ii iii iv Figure 5: Highly comparative tec hniques for time-series analysis tasks. W e dra w on our full library of time-series analysis metho ds to: structure datasets in meaningful w ays ( A ) and retrieve and organize useful op erations for classification ( B and E ) and regression tasks ( C and D ). A Five classes of EEG signals are structured meaningfully in a t wo-dimensional Principal Comp onents space of our library of op erations. B P airwise linear correlation coefficients measured b etw een the sixt y most successful op erations for classifying congestive heart failure and normal sin us rhythm RR in terv al series. Clustering reveals that most operations are organized into one of three groups (indicated b y dashed b o xes). Distributions of selected op erations, lab eled i , ii , iii and iv in the correlation matrix, are plotted for the tw o classes, including the mean ± standard deviation of their 10-fold cross-v alidation misclassification rate using a linear (threshold) classifier. C Segments of self-affine time series generated with scaling exp onen ts in the range − 1 ≤ α ≤ 3. D Five selected op erations with outputs that v ary appro ximately linearly with α for self-affine time series generated b y the F ourier filtering metho d (dots), and the random midp oin t displacement metho d (crosses). E A linear classifier that combines the outputs of tw o differen t op erations distinguishes Parkinsonian sp eec h recordings (red) from those of healthy con trols (blue) with a mean 10-fold cross-v alidation misclassification rate of 14%; the mean cross-v alidation misclassification rate of eac h individual op eration is given in parentheses. Some sample segments of time traces are annotated to the plot. 13 classifiers for this problem (cf. Sec. 5.4.3 for details), the comparative analysis p erformed here selects simple and in terpretable metho ds for the task automatically . Without p erforming suc h a comparison, it is difficult to assess whether metho dological progress is being made in a given literature, or whether man y simpler alternative metho ds may outp erform the current state of the art. 4.2 Heart rate v ariabilit y W e applied our highly comparativ e tec hniques to the problem of distinguishing ‘normal sinus rh ythm’ and ‘congestive heart failure’ heart-beat (RR) in terv al series. Man y existing studies hav e analyzed RR in terv al data, each rep orting the usefulness of a particular metho d, or a small set of me thods [14]. In con trast, we show how a range of useful methods for this task can b e selected from our library and organized in a wa y that syn thesizes a large and disparate literature on the sub ject, as w ell as identifying promising new types of analysis techniques. Our dataset con tains 105 recordings from eac h class, with lengths ranging from 800 to 19 900 samples (cf. Sec. S5.6.1). Although the analysis could hav e b een p erformed on a dataset of time series of a fixed length, here w e sho w how informative op erations can b e retriev ed ev en in the case where the time-series recordings are of very different lengths. The 60 most successful operations for this task (those with a mean 10-fold classification rate exceed- ing 85%), were retrieved from our library and are represented as a clustered pairwise similarit y matrix in Fig. 5B, where colour represen ts the linear correlation co efficien t measured b etw een the normalized outputs of all pairs of operations. Most op erations cluster in to three main groups of b eha viour: mea- sures of lo cation (e.g., mean, median), entrop y/complexity estimates and PNNx measures [14], and linear correlation-based metho ds (e.g., autoregressiv e mo del fits and p o wer sp ectrum scaling). Two other meth- o ds, in the bottom-left corner of the matrix in Fig. 5B, display relativ ely unique behaviour on the dataset: a discrete wa v elet transform-based op eration, and an outlier-adjusted autocorrelation measure. Example distributions from each of these families of successful op erations are plotted in panels of Fig. 5B: i an outlier measure returns the ratio of lag-3 auto correlations of the time series b efore and after removing 10% of outliers, ii the mean, iii the Sample En tropy [3], SampEn(3,0.05), and iv a v ariance ratio hypoth- esis test dev elop ed in the Economics literature [15]. Despite b eing selected in a completely automated w ay , eac h selected op eration provides an understanding of the dataset b y con tributing an interpretable measure of structural difference b et ween the tw o classes of RR interv als. F or example, the well-kno wn results that normal sinus rh ythm series tend to hav e longer inter-beat in terv als (higher mean, Fig. 5B ii ) and greater en tropy (higher Sample Entrop y , Fig. 5B iii ) than congestive heart failure series. This case study demonstrates the abilit y of our highly comparative approach to select and also or- ganize useful metho ds for time-series classification tasks automatically , using their empirical behaviour. The result provides in terpretable insigh ts in to the differences b et ween the known classes of time series. This case study represen ts another example of how an interdisciplinary metho dological literature can b e structured in a purely data-driven w ay (cf. Fig. 2B). How ever, unlike the treatment applied to general time-series analysis op erations in Sec. 3.1 ab ov e, here additional kno wledge (in the form of class labels assigned to the data) is used to guide the selection of useful metho ds, which are then organized according to their b ehaviour on the data. The resulting synthesis highligh ts similarities betw een different metho ds and distinguishes the no velt y of others, and could b e used to assess new con tributions to the literature. 14 F or example, a new scien tific pap er could introduce the v ariance ratio h yp othesis test [15]—a metho d originally developed in the Economics literature—as a nov el measure for analyzing heart rate v ariability data. How ever, as s ho wn Fig. 5B, the op eration b ehav es lik e a range of simple linear mo del-based meth- o ds on this dataset, i.e., it is immediately clear that it is not actually measuring a new prop ert y of these time series but is simply repro ducing the b eha viour of these existing op erations. On the other hand, a new operation that we de vised and introduce in this work, based on the impact of outliers on time-series auto correlation properties, is distinguished as b oth unique and useful for this dataset (detailed infor- mation about all selected op erations is in Sec. S5.6.3). Referencing our comparative framework in this w ay can th us help to ensure that new methods actually represen t new contributions to a given analysis literature. 4.3 Self-affine time series Fluctuation analysis has attracted substantial attention in the statistical ph ysics literature, and has b een used to provide evidence for scale-inv ariance in a v ariety of real-world pro cesses. But do these con ven tional metho ds outp erform alternativ e approaches, or do simpler, faster metho ds exist that display comparable (or even sup erior) p erformance? W e addressed this question b y generating a syn thetic dataset of self-affine time series and then searching our library (in a statistically controlled w ay , cf. Sec. S1.3.6) for op erations that v ary linearly with their known scaling exp onents (as depicted sc hematically in Fig. 2F). Self-affine time series can b e characterized b y a single scaling exp onen t, α , according to S ( f ) ∝ f − α , where S is the p o w er sp ectral densit y as a function of frequency , f [16]. Time series of 5 000 samples w ere generated with scaling exp onents uniformly distributed in the range − 1 ≤ α ≤ 3 b y t wo different methods: (i) 199 time series generated using the F ourier filtering metho d , and (ii) 199 time series generated using the r andom midp oint displac ement metho d [16] (cf. Sec. S4.3), as sho wn in Fig. 5C. In order to accurately c haracterize the scaling exp onen t, α , of these time series, operations must com bine lo cal and global information to capture the self-similarit y of the time series across multiple time scales. A selection of five op erations with the strongest linear correlations to α are plotted in Fig. 5D. As exp ected, man y fluctuation analysis-based operations p erform well on this task (cf. Sec. S4.3), including the scaling exp onen t estimated using detrended fluctuation analysis (DF A) [1], and a w av elet-based alternativ e (lab eled ‘DF A’, and ‘wa velet scaling’ in Fig. 5D, resp ectively). Ho wev er, other t yp es of op erations that are not based on fluctuation analysis also exhibit strong linear correlations with α : the auto correlation of residuals from a lo cal mean forecaster (lab eled ‘mean forecaster’ in Fig. 5D), the first- order coefficient of an autoregressive AR(3) mo del fitted to the time series (lab eled ‘AR(3) coefficient’), and the mea n log hyperparameter of the squared exp onen tial length scale from a Gaussian Pro cess regression on lo cal segments of the time series (labeled ‘Gaussian Pro cess regression’). Th us, as well as confirming the utilit y of metho ds based on fluctuation analysis to estimate the scaling exp onen t of self-affine time series, w e also disco vered a surprising selection of other useful metho ds that capture the kno wn v ariation in α by combining local and global structure in v arious wa ys. Many of these alternativ e metho ds require significan tly less computational effort and can be up dated iterativ ely , making them more suited to real-time applications than the slightly more accurate but also more computationally in tensive fluctuation-based methods. Our highly comparativ e approach to time-series regression, that 15 selects relev ant scientific op erations based on their empirical p erformance, can thus b e used to find fast appro ximations to traditional methods for real applications inv olving finite, noisy time series. This general approach could also b e used to select metho ds that help predict imp ortant diagnostic quantities assigned to physiological recordings, suc h as predicting the stage of sleep from an EEG recording or the arterial pH of a baby from its fetal heart rate time series recorded during lab or. Additional examples are presen ted in the SI, where we successfully selected in terpretable estimators of the v ariance of white noise added to p erio dic signals (Sec. S4.1) and the Lyapuno v exp onen t of Logistic Map time series (Sec. S4.2). The success of our highly comparativ e approach relies on our library of op erations being sufficiently comprehensiv e to pro duce useful and informative results. 4.4 P arkinsonian sp eec h This final case study inv olves the particularly challenging task of distinguishing stationary phonemes recorded from patients with Parkinson’s disease from those of health y controls [17]. Rather than imple- men ting a sp ecific set of standard sp eec h analysis tec hniques, the structure in the data was used to select appropriate operations from our general library . Using the pro cedure illustrated in Fig. 2F, w e found that our operation library is ric h enough to construct useful classifiers for this difficult task. The dataset con- tains 127 speech recordings from Parkinsonian patients and 127 sp eech recordings from health y controls, with recording lengths ranging from 50 ms to 1.25 s (cf. Sec. S5.5). W e found that man y of the most successful operations in our library for classifying Parkinsonian sp eec h were closely related to existing measures from sp eec h analysis (e.g., the ‘jitter’ summary statistic [17]), and we also iden tified some new tec hniques (cf. Sec. S5.5.2). Ho wev er, rather than restricting ourselv es to individual op erations, we also used forward feature selection to construct classifiers that com bine pairs of complementary op erations to achiev e improv ed out-of-sample classification p erformance (using appropriate partitions of data in to training and test sets, as describ ed in Sec. S1.3.5). An example t wo-feature linear discriminant classifier is shown in Fig. 5E, and com bines a new op eration in tro duced b y us in this w ork, that simulates an inertial particle that exp eriences an attractive force to the time series, with another op eration that constructs a sym b olic string from incremen tal differences of the time series using a three-letter alphab et (‘A’, ‘B’, ‘C’), and returns the probability of the w ord ‘AC’. The t wo op erations complement one another and the resulting classifier is simple, interpretable, and has a mean 10-fold cross-v alidation misclassification rate of 14%, whic h is comparable to the state-of-the-art in this literature (that typically treats un balanced datasets of fixed-length time series [17], cf. Sec. S5.5.2). Using our metho d, multi-feature classifiers for time series classification are constructed automatically , require no domain knowledge of the mec hanisms underlying the time series, and can b e extended to classifiers con taining three or more op erations straightforw ardly (although for this dataset we found minimal out- of-sample improv ement in classification rate on adding more than tw o features, cf. Sec. S5.5.3). T o further demonstrate the applicabilit y of our metho ds to div erse t yp es of time-series recordings, we analyzed t wo additional datasets in the SI, where an unkno wn seismic recording w as classified as an explo- sion rather than earthquake, consistent with previous studies (Sec. S5.2), and competitive multi-feature classifiers w ere constructed for distinguishing sev en differen t classes of emotional conten t in h uman sp eec h recordings (Sec. S5.3). Thus, despite using extremely simple statistical learning techniques (including 16 linear classifiers, forward feature selection, link age and k -medoids clustering, and Principal Comp onen ts Analysis), we are able to contribute meaningful results to a wide v ariety of scientific time-series anal- ysis problems. These simple metho ds hav e the adv antage of b eing transparen t and pro ducing readily in terpretable results to demonstrate our approach; more sophisticated metho ds should yield impro ved results and can b e explored in future w ork. On sev eral o ccasions we also found that new op erations dev elop ed by us in this w ork were amongst the most useful op erations for v arious analysis tasks, includ- ing the outlier auto correlation measure selected for classifying heat b eat in terv al data in Sec. 4.2 and the particle tra jectory-based operation for Parkinsonian sp eec h in Sec. 4.4. This highligh ts the b enefit of b eing creativ e in the dev elopment of new op erations for our library , as useful op erations are selected based on their p erformance on real datasets. The results of this section demonstrate that our library of op erations is sufficiently comprehensiv e to b e broadly useful in guiding the selection of methods for scien tific time-series analysis tasks. 5 Conclusions In summary , w e ha ve shown that in teresting and scientifically meaningful structure can b e discov ered automatically in extensive annotated collections of time-series data and time-series analysis metho ds from a wide selection of theoretical and empirical literatures. Relationships are determined b y comparing empirical b eha viour: the outputs of the metho ds applied to data, and the prop erties of the data as measured by the metho ds. Representing time series and op erations in this wa y turns out to pro vide a p ow erful framework for organizing general collections of time series and operations. By unifying a previously disjoin t in terdisciplinary literature, w e th us motiv ate a complementary and highly comparativ e approac h to time-series analysis that provides insigh ts into the prop erties of time series studied in science and the tec hniques that scientists hav e developed to study them. Using our framework, data analysts can now readily ask new types of questions of their time-series data and methods, as depicted in Fig. 2. In Sec. 3.1, w e demonstrated ho w time-series analysis operations can b e represented using their outputs across a controlled set of 875 real and mo del-generated time series from across the sciences. This form of empirical fingerprinting allo wed us to structure a large and diverse library of scien tific metho ds in a meaningful w ay . The result provides time-series analysts a new means of understanding the methods they use to analyze their data as part of a wider scientific context. F or example, data analysts can no w inv estigate relationships b et ween the set of methods familiar to them and extensiv e libraries of alternativ e metho ds that ma y hav e b een dev elop ed in differen t disciplinary contexts. F urthermore, new metho ds for time-series analysis can now b e compared to the existing literature (as represen ted in our library) to chec k for redundancy and hence help ensure that new methods for time- series analysis really constitute adv ances and do not simply repro duce existing behaviour. In Sec. 3.2, using the output of 200 diverse op erations as a form of empirical fingerprint for a time series allow ed us to iden tify meaningful clusters from a large and div erse library , and to retriev e meaningful matches to a given target time series. F or example, on receiving a new dataset a time-series analyst ma y wish to understand what k ey structures exist in it, or what other types of real-world and mo del-generated time series ha ve similar t yp es of dynamics: this can now be achiev ed in an automated, data-driven fashion. By 17 structuring datasets and connecting them to relev ant t yp es of real-w orld and mo del systems, the results pro vide an interdisciplinary context for the problem that can b e used to guide a more fo cused analysis. As well as providing useful to ols for understanding the structure in large collections of time series and their metho ds, in Sec. 4 we sho wed how additional kno wledge ab out particular datasets can b e incorp orated to automate the selection of useful analysis metho ds. Because each op eration provides an interpretable measure of some kind of structure in the time series, selecting op erations in this wa y yields insigh ts into the most informativ e prop erties of the data and how they v ary across the lab eled classes. The op erations are selected according to their b ehaviour , and the result connects a range of w ays of thinking ab out structure in time series to a given analysis problem. Using EEG seizure data (Sec. 4.1) we sho wed ho w difficult it can b e to assess existing studies that quote classification rates without comparison to alternativ e metho ds and demonstrated how our library of op erations can b e used to p erform this comparison. In Sec. 4.2, w e retriev ed and organized operations that help to distinguish health y and congestive heart b eat in terv als by comparing the b eha viour of all op erations on the data. Eac h operation pro vides an interpretable measure of structural difference b et ween the t wo classes, and the organization reveals which groups of op erations exhibit similar behaviour on the dataset and whic h are unique (Fig. 5B). These results suggest that only a reduced num b er of op erations need to b e measured to c haracterize and classify the heart b eat interv al data, information that could b e used b y a domain exp ert to guide the selection of a reduced set of unique analysis op erations. F urther inv estigation of the selected op erations b y a domain expert could also provide new insigh ts into the dynamical structure of heart b eat interv als for healthy patien ts and for v arious pathologies. A similar approac h was used to select op erations that most accurately predict the scaling exp onen t, α , of self-affine time series in Sec. 4.3, and w e also demonstrated how forw ard feature selection can b e used to construct in terpretable m ulti-feature classifiers for identifying Parkinsonian sp eec h recordings. The success of our approach in eac h case relied on our library of op erations b eing sufficiently comprehensiv e. Thus, although is far from complete, our library app ears to contain enough div ersity to pro vide go od classification p erformance and contribute useful insights into a range of time-series analysis problems. The results could b e impro ved further in the future by refining and gro wing the library with methods con tributed by time-series analysis experts. W e now revisit the analogy to the high throughput analysis of the DNA microarra y in biology , which is used routinely to guide more fo cused research efforts in that field. While time-series analysis has traditionally fo cused on the use of sp ecific metho ds and models motiv ated by domain knowledge, the highly comparative techniques in tro duced in this work represen t a similarly p o werful complemen t to this approac h. As v ast quantities of time-series data contin ue to be recorded, and new metho ds for their analysis are dev elop ed, this highly comparativ e approac h will allo w us to mak e sense of this large and complex resource and contribute to directing progress in an inherently interdisciplinary field. The results are wide-reaching, from the diagnosis of pathologies in medical recordings to the detection of anomalies in an industrial pro cess or on an assem bly line. W e hop e that our work, while stimulating theory , adds to the exp erimen tal and empirical asp ect of the study of time-series data. The Matlab source co de for all op erations used in this w ork can b e obtained from the authors via the website http: //www.comp- engine.org/timeseries/ , and instructions of ho w our framew ork can be applied to new datasets is summarized in Sec. S1.4 of the SI. 18 Ac knowledgemen ts The authors w ould like to thank Summet Agarwal, Siddarth Arora, Andrew Phillips, Stephen Blundell, and Anna Lewis for v aluable feedbac k and discussion on the man uscript, and Da vid Smith for assistance with net work visualization. Nic k Jones thanks the BBSR C and EPSRC BBD0201901, EP/H046917/1, EP/I005765/1 and EP/I005986/1. References [1] C. K. Peng, S. V. Buldyrev, A. L. Goldb erger, et al. Statistical properties of DNA sequences. Physic a A 221 , 180 (1995). [2] T. Bollerslev. Generalized autoregressive conditional heteroskedasticit y . J. Ec onometrics 31 , 307 (1986). [3] J. S. Ric hman and J. R. Mo orman. Physiological time-series analysis using approximate entrop y and sample en tropy . A m. J. Physiol. He art Cir c. Physiol. 278 , H2039 (2000). [4] T. W. Liao. Clustering of time series data – a survey . Pattern R e c o gn. 38 , 1857 (2005). [5] X. W ang, A. Mueen, H. Ding, et al. Experimental comparison of representation metho ds and distance measures for time series data. Data Min. Know l. Disc. (2012). [6] T. Hastie, R. Tibshirani, and J. F riedman. The Elements of Statistic al L e arning: Data Mining, Infer enc e, and Pr e diction . Springer, 2nd edition (2009). [7] S. M. Pincus, I. M. Gladstone, and R. A. Ehrenkranz. A regularit y statistic for medical data analysis. J. Clin. Monitor Comp. 7 , 335 (1991). [8] J. B. T enenbaum, V. d. Silv a, and J. C. Langford. A global geometric framework for nonlinear dimensionalit y reduction. Scienc e 290 , 2319 (2000). [9] J. C. Sprott. Chaos and Time-Series Analysis . Oxford Univ ersity Press, New Y ork (2003). [10] P . Samuelson. Rational theory of warran t pricing. Ind. Manag. R ev. 6 , 13 (1965). [11] U. S. F reitas, C. Letellier, and L. A. Aguirre. F ailure in distinguishing colored noise from c haos using the “noise titration” technique. Phys. R ev. E 79 , 035201(R) (2009). [12] R. G. Andrzejak, K. Lehnertz, F. Mormann, et al. Indications of nonlinear deterministic and finite- dimensional structures in time series of brain electrical activity: Dep endence on recording region and brain state. Phys. R ev. E 64 , 061907 (2001). [13] A. Subasi and M. Ismail Gursoy . EEG signal classification using PCA, ICA, LDA and supp ort v ector mac hines. Exp ert Syst. Appl. 37 , 8659 (2010). [14] M. Malik, J. T. Bigger, A. J. Camm, et al. Heart rate v ariability: Standards of measurement, ph ysiological in terpretation, and clinical use. Eur. He art J. 17 , 354 (1996). 19 [15] S. G. Cecc hetti and P .-s. Lam. V ariance-ratio tests: Small-sample prop erties with an application to in ternational output data. J. Bus. Ec on. Stat. 12 , 177 (1994). [16] H.-O. P eitgen, D. Saup e, Y. Fisher, et al. The Scienc e of F r actal Images . Springer (1988). [17] M. A. Little, P . E. McSharry , E. J. Hunter, J. Spielman, and L. O. Ramig. Suitability of dysphonia measuremen ts for telemonitoring of Parkinson’s Disease. IEEE T. Bio.-Me d. Eng. 56 , 1015 (2009). 20
Original Paper
Loading high-quality paper...
Comments & Academic Discussion
Loading comments...
Leave a Comment