Cancer gene prioritization by integrative analysis of mRNA expression and DNA copy number data: a comparative review
A variety of genome-wide profiling techniques are available to probe complementary aspects of genome structure and function. Integrative analysis of heterogeneous data sources can reveal higher-level interactions that cannot be detected based on indi…
Authors: Leo Lahti, Martin Sch"afer, Hans-Ulrich Klein
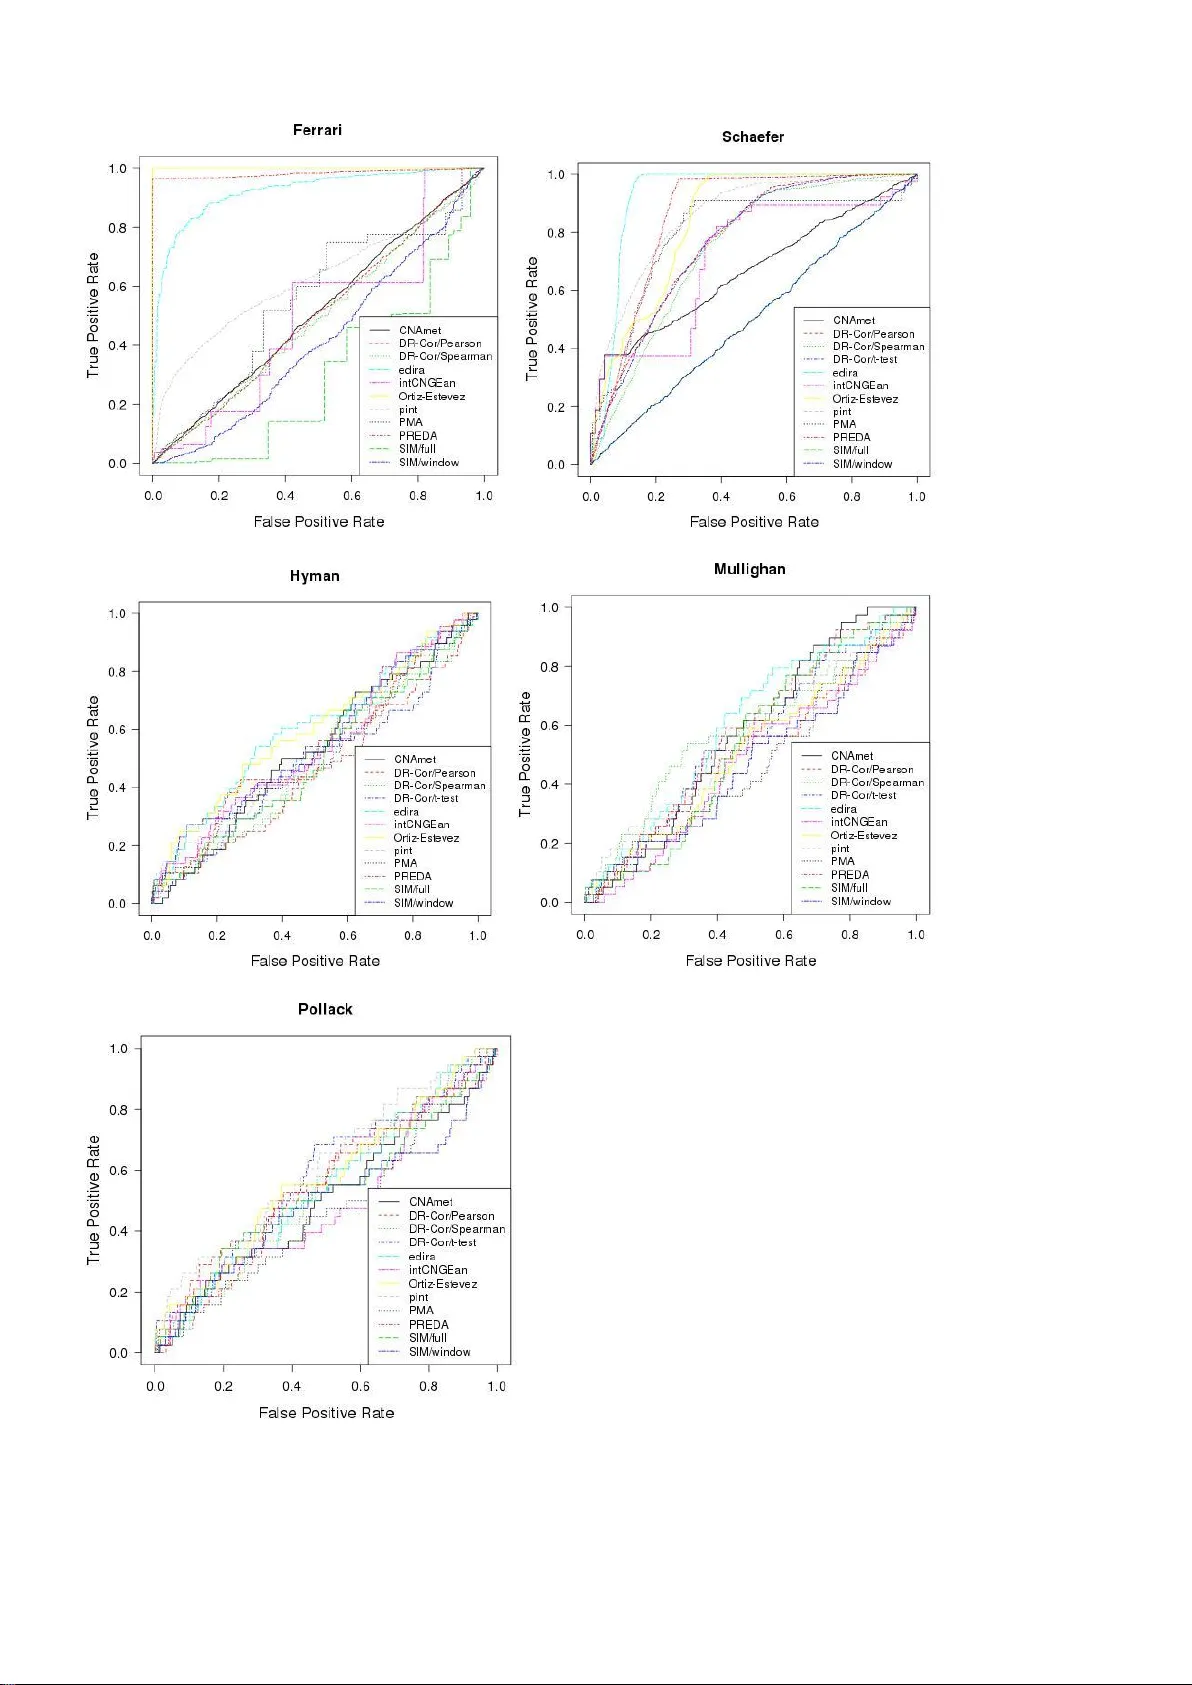
PREPRINT VERSION November 19, 2011. In review. Cancer gene prio ritization by in tegrative ana lysis of mRNA expression a nd DNA copy number data: a com parative revie w Leo Lahti (1,2), Martin Sch äfer (3), Han s-Ulrich Klein (4), S ilvio Bicciato (5) an d Martin D ugas (4) (1) Aalto Univ ersity, Depar tment of I nformation and C omputer Science , Adaptive Informatics Rese arch Centr e and Helsinki I nstitute for Inform ation Technolog y HII T, P.O. Box 15400, FI-00076 Aalto, Fin land, (2) Univ ersity of Helsinki, Depa rtment of Ve terinary Bioscience, P.O. B ox 66, FI- 00014, Finland. (3) Depa rtment of St atistics, TU Dortmund Univ ersity, Vogelpothsweg 87, 44221 Dor tm und, Germany (4) I nstitute of Med ical Inform atics, University of Mü nster, Albert-Schw eitzer-Cam pus 1 - A11, D- 48149 Münster, Germ any (5) Center for Geno me Research, Univ ersity of Mo dena and Regg io Em ilia, via G. Campi, 287 - 41100 Modena, I taly Abstract A variety of genome -wide profiling t echniques are ava ilable to prob e complemen tary aspec ts of genome stru cture and function. Integra tive analysis of h eterogeneous da ta sources can reveal highe r-level interactions that cannot be detected based on individual ob servations. A s tandard integrat ion task in canc er studies is to identify altered genomic regions tha t induce chang es in the expression of the associated ge nes based on j oint analysis of genome-wide gene expression and co py number p rofiling measu rements. In this review, we prov ide a compari son among various mode ling procedur es for integra ting genome-wide profiling da ta of gene cop y number and transcriptional a lterations and highlight comm on approaches to genomic da ta integration. A tr ansparent benchmarking pro cedure is introduced to quan titatively compar e the cancer gene prioritizat ion performanc e of the alternative methods. The be nchmarking algorithm s and data sets ar e available at http://intcom p.r-forge.r-project.org Keywords: algor ithms, cancer, data integration, DN A copy numb er, gene expr ession, microarr ays I NTRODUCTIO N Genome- wide profiling technologies, in p articular microarrays and next generation se quencing , are used to characterize disease-associated changes at various levels of genom e function. I dentification of the key players - genes, chromosom al regions, or biological processes - is a f undamental step towards mechanistic characte rization of the disease and revealing molecular targets for potential therapeutic intervention. Genomic, transcriptom ic, epigenomic, and proteom ic measurem ents characterize different aspec ts of genome regulation and function that are particularly relevant for cancer research [1 - 2]. Integrative analysis has been us ed to priori tize disease genes or chromosom al regions for experimental testing, to discover disease subtypes [3 -4], or to predict patient surviv al or other clinical variables [5]. Co-occurring genomic observations are increasingly available in private and public repositories, such as the Cancer Genome Atlas database [6] and the Leukemia Gene Atlas [7], which prom otes wide access to data resources. However, the lack of algorithmic implementations still represents a bottleneck hampering integra tive approache s. The i ntegration of gene expression ( GE) and copy number (CN) data to identify DNA copy number alt erations that induce changes i n the expression levels of the associated genes is a comm on task in cancer studies [ 8], and the detection of chromosomal regions with exceptional ly high st atistical association between CN and GE can pinpoint disease genes and po tential cancer m echanisms [9 -10]. First hig h-throughput analy ses were reported ab out a decade ago [11-13], evidencing a clear cis-dosage effect of CN alterations on GE levels [14-16]. Although the downstream effect of CN alteration on gene expression is still a focus of ongoing resea rch [17-18], a system atic quantitativ e comparison of alternative approaches for integrating GE/CN data sets has been missing, as clearly highlighted by the recent review by H uang et al [8] . Hence, we desig ned a transparent and quanti tative benchmark ing procedure to compare publicly available methods f or cancer gene prioritization from the integrative analysis of CN/GE profiling data. This benchmark approach was applied t o assess and compare the perform ance of 12 algorithm s on t wo simulated data sets and three real case st udies. In the following sections, we ove rview available methodolog ies for cancer gene prioritiz ation based on GE/CN data integra tion, introduce the analysis pipeline, and discuss benchmarking results. PREPRINT VERSION November 19, 2011. In review. Quantifying a ssociations between gene ex pression and copy number Two-step approaches Several approaches separately assess t he alterations in each data set and compare results from CN and GE analyses to detec t sim ultaneous chang es, m ostly modeling changes in GE based on the CN signals [16,19]. This corresponds t o the biological i ntuition conce rning the cis-reg ulatory effect of CN alterations. In the first step samples are grouped based on hard CN calls, call probabili ties [ 20 ] or quantiles (DR-SAM [21]). In the secon d step, diffe rential gene expre ssion is quantified between such groups using e.g., standard approac hes for GE data analysis as t-test [13], nonparam etric alternatives [22] or permutation tests [23-24]. Some methods focus on regions rather than probes/gene s [19, 24]. Comparison of gene e xpression levels between the sample groups with distinct copy number status on a particul ar chromosomal region i s ai med to reveal copy number - induced transcriptional re sponses, t ypically within the affected reg ion. Regression approaches Another class of tools uses regression model s with CN as the predic tor and GE as the response variable, again following biological i ntuition concerning the cis -regulatory effect of CN alterations. Both linear [12] and non-linear regression models [25] have been proposed. Regression models have been designed both based on one- to - one cor respondence between CN and GE probes [ 26] and multi ple/multivariate linear regression [14, 26-28]. Correlation-based approa ches The DR-Correlate [21] and a modified version of Ortiz-Estev ez algorithm [16] use correlation-based analysis to scan over the genom e to detect loci with excepti onally high association s b etween CN/GE. Schäfer et al. [29] substitu te the sample means by the reference medians, and Lipson et al. [3 0] use quantile-based analysis to obtain improved correlation coefficients. Canonical correlation analysis (CCA) identifies linear combinations of CN and GE probes that are maxim ally correlated. Various modifications f or dimensionality reduction and model r egularization have bee n proposed based on principal component analysis [31] and penalized approaches based, e.g., on LASSO or elastic net t o obtain sparse version s of CCA [5, 32 -33], or based on variants that focus on specific types of dependency [34]. Regularization can reduce over fitting, and sparsity can si mplify interpretation of the result s, but determ ining appropriate regularization parameters may represent a challenging issue. Latent variable models Latent variable approache s model directly the dat a-generating processes and noise. The pint/simcca [34] decomposes GE and CN data sets into shared and independen t Gaussian components based on regularized probabilistic CCA. T he algorithm by [4] is a related model suited for sample cl assification and subtype discovery. La tent matrix decomposition m odels an d iterat ive, depende ncy- seeking pro jections hav e also been suggested based on g eneralized sing ular-value decom position [3] and independ ent com ponent analysis [35]. Benchmarking the algorithms Manual litera ture search in PubMed and Google Scholar using combinations of the keywords ‘gene expression’, ‘copy number’, ‘integration’, and curation of the Bioconducto r repository (htt p://www.bioconduc tor.org) were performed t o identify available implem entations, yielding 12 algorithm s that were applicable for cancer gene prioritization based on integrative analysis of GE/CN data (Table 1). The source code for Ortiz -Estevez [1 6] was obtained from the authors. An aut omated benchmarking pipeline (‘intcomp’) was cr eated to compare method performance on two simula ted data sets and three real case studies. Calculations were carried out in R ( 2.13.2 [36] and intcomp v . 0.3.27). The com pariso n pipeline is available through R-Forg e (http://intcom p.r-forge.r- project.org/) and the algor ithm versions are detailed in the package v ignette. Each method was used to pri oritize candidate cancer genes, followed by comparison to a golden standard list of known cancer genes, and ranking of the methods based on (i) true positive rate among the top findings, (ii) receiver operating characteristic (ROC ) analysis of the overall prioritized gene list, and ( iii) running times. Since only a subset of genes are likely to be cancer-associated, the standard Area Under Curve (AUC) analysis, which considers the overall prioritized gene list, was complemented by investigating the true positiv e rate among the top findings. This is more appropriate in particular for methods such as CNAmet, Orti z-Estevez, or PREDA/SODEGI R, which have originally been desig ned to detect altered chromosom al regions rather than to priori tize individual genes. Default parameters for each method were used where possible. The following exceptions were made to apply t he algorithms to canc er gene prioritiza tion. I n DR -Correlate [21], empir ical p-v alues from 1000 random gene permutations were used t o rank the genes. The DR -Correlate t-test o ption was not app licable on the Ferr ari simulations due t o the low number of replicate sam ples. CNAm et [24, 37] requires called CN values and prov ides separate lists for amplifications and deletions ; thus, the two lists were pooled and ranked based on the p -v alues. Moreover, to enable an unbiased AUC comparison of CNAmet with all other me thods (that priorit ize all genes), random ranks were assigned to genes labeled by CNAmet with no p -value (non-significant genes). With PREPRINT VERSION November 19, 2011. In review. intCNGEan [20], the weig hted Mann-Whitney test with uni variate analysis was used with an effectiv e p -value threshold of 0.1. In pint/simcca [34], segm ented CN data was used only when the resolution of the CN platform was higher than the r esolution of the GE microarray. In PREDA/SODEGI R we use d ‘spline’ for smoothing, 1000 random g ene orderings of the out put regions, and the median AUC as an un biased output for g ene prior itization. For all methods, each CN probe/segment has been matched to the closest/corresp onding GE probe within the same chromosom al arm [34, 38], although the preprocessing of CN data depends partially on th e platform res olution [ 8] . On the latest hig h-density SNP arrays, for instance, segm entation strategies ar e essential for estimating t he CN for individual genes [8]. Various approaches consider to investigate onl y certain genomic r egions at a ti me, e.g. to avoid bias, and propose differ ent strateg ies to select t he size of the chromosom al region, including fixed window s in t erms of consecutive probes or base pairs [28, 30, 34], chromosom e arms or minimal common regions [26] or performing kernel regression [1 9] where the probe sig nals are modeled with a sm oothing f unction which accoun ts for the non- uniform distributio n of the genes a long the g enome. Simulated data Two simulated data sets were generated following Schäfer et al. ([29]; ' Schäfer' dat a set) and Bicciato et al. ( [19]; 'Ferr ari' dat a set). For the 'Schäfer' data set, CN and GE values are drawn from a normal mixture where t wo components r epresent aberrations of different ext ent for each locus; 100 samples were created for each input with mixture proportions of either 10% or 90% for the affected and normal regions. Varying noise levels were imposed using multiple variance parameters ( 0.25, 0.5, 1, 2 and 4 tim es an adjusted median absolute deviation of t he data). The dat a points are organiz ed in 16 equally sized blocks to mimic affected regions. The 'Ferrari' data with 6 samples was created by manipulating a renal cell carcinoma dat a set through per mutation of loci and adding or subtracting cons tants t o both CN and GE values within 10 blocks of 10 Mbp. Norm al control data was generate d by subtr acting the median across the samples [19]. Real case st udies Benchmark ing on real case studies is cr ucial, but defining the ground truth is more challenging than in simulation studies. We investigated two breast cancer data sets [ 12- 13] and a l eukem ia study [39] using expert-curated lists of know n breast cancer genes [40], and leukemia genes from the Cancer Gene Census [41] as the ground truth for the com parisons, respectively . T he ‘Hyman’ dat a set [13] contains 14 breast cancer cell lines, preprocessed as in [3]. The 'Pollack' data set [12] conta ins 41 breast cancer s amples. The 'Mullig han' data set consists of 171 acute lym phoblastic leuk emia (ALL) sa mples divided in 9 subt ypes [39, 42]. CN dat a ( Affym etrix Human Mapping 500K) was downloaded from ftp://ftp.st jude.or g and no rmalized w ith CRMA v2 [43]. The log-additive model from the CRMA v1 algorithm [44] was use d for probe summ arization. Data values from Nsp and Sty array of the 500K array set were combined and segmented with CBS [45]. Gene expression profiles of the same ALL specimens, m easured with the Affym etrix HG-U133A platform were obtained f rom GEO (GSE12995; [46] and prepro cessed with the RPA algorithm ( R/Bioconductor ; [47]) and EntrezID-based custom chi p definition file (v13; [48]). The r eference for GE a nd CN data was defined as the m edian nor malized log -ratios across all samples. Probes with no EntrezID or location information and probes mapping to multiple locations or in se x chromosom es were excluded. GE and CN probes were matched by selecting for each gene the closest CN probe. Missing values w ere imputed by Gaussian random sam ples using the mean and v ariance of the d ata. Impleme ntation CN preprocessi ng Methodolo gical character Significance s coring Reference CNAme t (R) called custom statistic ; two-step PPT; aberrant re gions Hautaniemi et al ., 2004; Louhimo and Hau taniemi 2011 DR -Correlate / t-test ( BC) raw/seg mented two-ste p PPT; p-values Salari et al. 20 10 DR -Correlate ( BC) raw/seg mented COR PPT; p-values Salari et al. 20 10 / Pearson, Spear man edira (R) raw/seg mented custom statistic ; COR NT; p-values Schäfer et al. 2 009 intCNGEan (R) cghCall object custom statistic ; two-step PNT; p-values van Wieringe n et al. 2009 Ortiz-Rivas (R) raw/seg mented two-ste p PNT; p-values Ortiz et al. 201 1 PMA (CRA N) raw/seg mented LV; COR PLV; p-values Witten et al. 20 09 PREDA (BC) raw/seg mented custom statistic ; two-step PPT; aberrant re gions/ Bicciato et al. 2009; q-values Ferrari et al., 20 11 pint/simcca (BC) raw/seg mented LV; COR PLV; custom st atistic Lahti et al. 200 9 SIM (BC) raw/seg mented REG PT; p-values Meneze s et al. 2009 PREPRINT VERSION November 19, 2011. In review. Table 1 Summary of the com parison algorithm s. The implementations are available through Bioconductor (BC); CRAN; or R source code (R ). The copy number preprocessing methods required by each alg orithm are listed. Abbreviations: Correlation analysis (COR), regressio n analysis ( REG), latent variables analysis (LV), param etric test (PT), nonparametric test (NT), permuta tion test based on statistic of nonparametric test (PNT), permutation test based on statisti c of param etric test (PPT), pe rmutation test based on laten t variable score (PLV). Results The overall cancer gene prioritization performance for the complete gene lists quantified by the AUC analysis is summarized in Figure 1 (for the ROC curves, see Supplementary Figure S1). The highest median ranking acr oss the five benchmarking data sets was obtained by edira (1), followed by Ortiz -Estevez (4) and pint/simcca (4) . of these three methods outper formed the other method s on at least one data set. Note t hat the performance of edira regarding the 'Schäfer' data set and of PREDA/SOD EGIR regarding the 'Ferrari' data set needs to be interpreted carefully, because these sim ulations were origin ally constructed to follow t he particular modeling assumptions of these algorithm s in the orig inal publications [19, 29]. Considering the true positive rate among the top -200 genes of each algor ithm, pint/simcca had the highest median ranking ( 1), followed by edira, Ortiz-Estevez and PREDA /SODEGI R (3; Figur e 2). These four methods had systematically the highest median rankings with multiple thresholds (20, 50, and 100 top genes); Notably, although edira and PREDA/SOD EGI R had the highest scores in the AUC a nal ysis on the Schäfer data, most of ot her algorithms out perform ed these methods with respect to known true positiv es among the top findings in this data set. Differences regarding the running times were considerable (Supplem entary Table 1). Evaluations were performed on a 64-bit Linux machine with 2 AMD Opteron 2382 processors (K10 architecture, 4 kernels per process or, 2.6 GHz, 32 GB RAM); edira and PMA were the fastest methods with less than one minute running t ime in all data sets, closely follow ed by Ortiz-Estevez with a maxim um runni ng ti me of less than 3 minutes. The number o f permutations in significance testing affects remarkably t he running t imes of CN Amet, DR -Correlate, intCNGEan and PREDA, althoug h in the latest version of PR EDA a parallelized v ersion of the algorithm has been imple mented to reduce the com putation tim e [49]. Figure 1 Area under curve (AUC) values i n ROC analysis quantify cancer gene prioritization performance of t he methods for the 5 benchmarking data sets. High val ues indi cate high true positive vs. false positive ratio among the top findings; the dashed line i ndicates t he expected AUC value f or a random gene list ( AUC = 0.5). The m ethods have been ordered by their median rank across all data sets. For the ROC cur ve s, see Supplementary Fig ure S1. PREPRINT VERSION November 19, 2011. In review. Figure 2 True positive rates among the top -200 genes from each comparison algorithm across the 5 benchmarking data sets. The overall true positive rate is low in real case studies and the scale for the ‘Hym an’, ‘Mullighan’ and ‘Pollack’ data sets has been accordingly adjusted to hig hlight the diffe rences . T he m ethods have been ordered as in Figure 1. Discussion Prioritization of disease genes is a key-modeling task in functional genom ics [50-53]. This review provides an overview and quantitative benchmarking of publicly available algorithms for de tecting associations between GE and CN alterations. This complements the recent review by Huang et al., [8], who pointed ou t the lack of quantitative comparisons of the available me t hods. The ‘ intcomp ’ benchmarking package applied in this review is freely available at R-forg e (http://intcom p.r-forge.r-project.org/), fac ilitating t ransparent comparisons a nd the addition of new alg orithms, benchmark ing procedures, and validation d ata sets. The comparison of 12 dif ferent algorithms with respec t t o their perfo rmance in cancer gene prioritization revealed systematic differences between the methods across different da ta sets, preprocessing scenarios, and sample sizes. The model perform ance is in general better in the simulation studies, compared to the real cancer data sets, suggesting that m anually curated cance r gene lists m ay be only rough approxim ations of the grou nd truth in the rea l case studies and that the simulations may have lower noise levels. Simulation procedures are only rough approximations of the biolo gical reality and the simulat ion approach can remark ably affect model perform ance. For instance, variants of DR- Correlate and CNAm et performed well with ‘Schäfer’ simula ted data but their performance dropped close to random expectation in t he ‘Ferrari’ data set. T he ‘Ferrari’ simulations assum e that the CN effect is visible i n all t umor samples, which can be particularly disadvantageous for methods that assume high variation from heterogeneous aberration profiles across the samples, including DR - Correlate. The ‘Ferrari’ and ‘Schäfer’ simulated data sets were originally introduced in the PREDA/SODEGI R and edir a publications which potentially causes positive bias on these methods in the respective data sets. Overall, edira, Ortiz-Estevez, and pint/simcca consistently outperformed the other methods. Considering both relative performance and running time, edira and Ortiz-Estev ez see m to of fer a good trade-off but all methods have acce ptable running times for practical applicat ions. The choice of preprocessing and model parameters can have a remarkable effect on t he res ults. The key decisions in the context of GE/CN dat a are associated with selecting t he CN preprocessing approach [54], size of the investigated regions, and the matching approach for the integrated data sets. These and related issues are extensively discussed in t he recent review by Huang et al. [8]. It is also possible to utilize class information of the samples, for instance by i ncluding both tumor and referen ce samples as in the DR -SA M al gorithm [21]. However, in many cases the references are i ncluded as a pooled control for two -color microarray experiments but not as a separate group, as with the Hyman and Pollack data sets. Moreover, genomic aberrations often affect only a subset of the cancer patients, and multiple cancer subtypes may be present, as for instance in the Mullighan data set. Further integrative tasks include modeling of trans -regulatory effects of CN aberrations on genes outside the affected region [55- 56], disease subtype discovery [4], prediction of patient survival or of clinical covariates [57] and integrativ e analysis of other dat a sources such as methylation [58], micro-RNA [59-60], or protein expressio n [61] . However, fewer implementations for such task s ar e cu rrently available. Availability of reference PREPRINT VERSION November 19, 2011. In review. implem entations for new com putational approaches would facilitate benchmark ing and optimiz ing the algorithm s. The standardized benchm arking pipeline introdu ced in this review can be adjusted to incorpora te additional algorithms and da ta sets as they become av ailable. C ONCLUSION A variety of methods is available for the integrative analysis of gene expression and copy number data. The algorithms can be classified as two -step, regression, correlation-based, and latent variable approaches. Implem entation quality, running time and accuracy of the algorithm, as well as preprocessing , sample size and availability of control samples need to be considered when selecting the appropriate com putational method. The benchmarking pipeline re veals system atic diffe rences i n cancer g ene prior itization per formance of available implem entations across five cas e studies. K EY P OINTS – The integrative analysis algorithm s for gene expressio n and copy number data include two -step, regression, correlation- based, and latent v ariable approaches – The benchm arking pi peline reveals systematic differences in the cancer gene pr ioritizat ion performance of currently av ailable implementatio ns – Implem entation qual ity, running tim e and accuracy of the algorithm, as well as data preprocessing , sample size and av ailability of con trol samples need to be considered when select ing the analy sis approach F UNDING This work was supported by EuGESMA COST Action BM0801 (European Genom ics and Epigenom ics Study on MDS and AML). LL has been suppo rted by Helsinki Inst itute for Inform ation Technology H IIT and Finnish Center of Excellence on Adaptive Informatics Research (AIRC). MD is supported by t he European Leukemia Network of Excellence (LSHC- CT - 2004); Deutsche Kinderkrebsstiftung [grant number DKS 2010.21] and Carreras Foundation [grant num ber DJ CLS 09/04]. MS is supported by the Deutsche Forschung sgemeinschaft (Research Training Group Statistical Modeling). SB is supported from AIRC Special Program Molecular Cl inical Oncology “5 per mille”. A CKNOWLEDGEMENTS We would like to thank Francesco Fer rari for prov iding the simulated data set for this st udy. R EFERENCES [1] Chin L, Gray J. T ranslating insights from the ca ncer genome into clinical p ractice. Nature 2008; 452 :553-563. [2] Hawkins R, Hon G Re n B. Next -generation geno mics: an integrative approach. Nat R ev Genet 2010; 11:476 -486. [3] Berger J, Hautaniemi S, Mitra S, Astola J. Jointly analyzing gene expressio n and cop y number data in breast cancer u sing data reduction models . IEEE/ACM Tr Comp B iol Bioinf 2006; 3:2 -16. [4] Shen R, Olshen A, Lada nyi M. Integrati ve clustering of multip le genomic data types usin g a jo int latent variable model with application to breast and lung cancer subt ype analysis. Bioinformatics 2009; 25:2906-2912. [5] Witten D, T ibshirani R. Extensions of sparse canonical correlatio n analysis, with app lications to genomic data. Stat Appl Genet Mo l Biol 200 9; 8:28. [6] The Cancer Geno me Atlas Research Net work. Comprehensive ge nomic characterizatio n defines human gliob lastoma genes and core path ways. Natu re 2008; 455:1061-68. [7] Gröttrup S, Hebestre it K, Klein H-U, Ruckert C, Bartenhagen C, Dugas M. T he Leukemia Gene Atlas - A public platform to suppor t leukemia research. In: 19th An nual Internation al Conference on Intelligen t Systems for Molecula r Biology , Vienna, Austria, 2011. [8] Huang N, Shah PK, Li C. Lessons fro m a decade of integrating cancer co py number altera tions with gene expressio n profiles. Brief Bioinfo rm. Onli ne September 23, 2 011. [9] De S, Bab u M. Genomic neighborhood and the regulation of gene expr ession. Cu rr Op Cell Biol 2010; 2 2:7. [10] Lee H, Kong S, P ark P. Integrative anal ysis reveals the direct and indirec t interactions bet ween DNA cop y num ber aberrations and gene express ion changes. Bio informatics 20 08; 24:889 -896. PREPRINT VERSION November 19, 2011. In review. [11] Phillips J, Ha yward S, Wang Y et al. T he Consequences of Chro mosomal Aneuploid y on Gene Expression P rofiles in a Cell Line Model for Prostate Carcinogenesis. Cancer Res 20 01; 61:8143- 9. [12] Pollack J, So rlie T, Perou C et al. Microar ray analysis reveals a major direct role of DNA cop y number alteration in the transcriptional progra m of human breast tumors. PNAS 2001; 99:1296 3-8. [13] Hyman E, Kauraniemi P , Hautaniemi S et al. I mpact of DNA Ampli fication on Gene Expr ession Patterns in Breast Cancer. Cancer Res 2002; 62 :6240-5. [14] Gu W, Choi H, Ghosh D. Glo bal associations bet ween cop y number and transcript mRN A microarray data: a n empirical study. Cancer In formatic s 20 08; 6:17 -23. [15] Myllykangas S, Junnila S, Kokkola A et al. Integrated ge ne copy number and expression microar ray analysis of gastric cancer highlights potential tar get genes. Int J Cance r 2008; 123 :817-25. [16] Ortiz-Estevez M, De Las Rivas J, Fontanillo C, Rubio A. Segmentation of genomic and transcripto mic microarra ys data reveals major correlation between DNA cop y number aberrations and gene -loci expression. Genomics 2011; 97:86-93 . [17] Harvey R, Mulligha n C, Wang X et al . Identification o f novel cluster groups i n pediatric high -risk B-prec ursor acute lymphoblastic leuke mia with gene expression p rofiling: correlatio n with genome -wide DNA copy number alteratio ns, clinical characteristics, and outco me. Blood 2010; 116:4874 -84. [18] Yuan Y, Rueda O, Curti s C, Markowetz F. Penalized regression elucidaes aberr ation hotspo ts mediating subtype -specific transcriptional responses i n breast cancer. Bioinforma tics. Ep ub ahead of print, 201 1. [19] Bicciato S, Spinelli R, Zampieri M et al. A computational pro cedure to identify significant overlap of differentially expressed and geno mic imbalanced regions in ca ncer datasets. Nu cleic Acids Res 2009; 37:50 57-70. [20] van Wieringen W, van de Wiel M . Nonpara metric testing for DNA copy number ind uced differential mRNA gene expression. Biomet rics 2009; 6 5:19 -29. [21] Salari K, Tib shirani R, Pollack J. DR-Integrator: A new analytic tool for integrati ng DNA co py number and gene expression data. Bio informatics 2010; 26:414-6. [22] van Wieringen W, B elien J, Vosse S et al. ACE -it: a tool for geno me- wide integration of gene dosage and RNA expression data. Bio informatics 2006; 22:1919 -20. [23] Akavia U, Litvin O, Kim J. An integrated approach to unco ver drivers of cancer. Ce ll 2010 ; 143:1005 -17. [24] Hautaniemi S, Ringnér M, Ka uraniemi P et al. A strategy for identifyi ng putative causes o f gene expression variatio n in human cancers. J Franklin In stitute 2004; 341 :77-88. [25] Solvang H, Lingjaerd e O, Frigessi A, Borresen-Dale A, Kristense n V. Linear and non -linear dep endencies between copy number aberr ations and mRNA expres sion reveal distinct molecular pathways in br east cancer. BMC Bioinformatics 2 011; 12:197. [26] Menezes R, Boetze r M, Sieswerda M et al. Integrated analysis of DN A copy number and g ene expression microar ray analysis using gene sets. BMC Bioinformatics 2009; 10:2 03. [27] Peng J, Zhu J, Ber gamaschi A et al. Regularized multivariate regression for identifying m aster predictor s with application to integrative genomics study of brea st cancer. Ann App Sta t 2010; 4:53 -77. [28] Stranger B, Forr est M, Dunning M et al. Relative i mpact of nucleotide and co py number variation on gene expression phenotypes. Scien ce 2007; 3 15:848 -853. [29] Schäfer M, Schwender H, Merk S et al. Integrati ve analysis o f copy number alterations an d gene expression: a bivaria te assessment of equall y directed abnormalities. Bio informatics 2009; 25: 3228-35. [30] Lipson D, Ben-Dor A, Dehan E, Yakhini Z. Joint analysis of DNA copy numbers a nd gene expression levels. I n: Jonassen I, Kim, J ( eds.). Proc Algorithms in Bioinfor matics: 4th International Wo rkshop WABI 20 04. Germany: Springer, 2004. [31] Soneson C, Lilljeb jorn H, Fioretos T , Fontes M. Integrative analysis o f gene expression an d copy number alteratio ns using canonical corr elation analysis. BMC Bioinformatic s 201 0; 11:191. [32] Parkhomenko E, T ritchler D, Beyene J. Sparse Canon ical Corre lation Analysis with Application to Geno mic Data Integration. Sta t App Genet Mol Biol 2009; 8 :1. [33] Waaijenbor g C, Verselewel de W itt Hamer PC, Zwinderman AH. Q uantifying the associati on between gene e xpressions and DNA-markers b y penalized canonical cor relation analysi s. Stat Ap pl Genet Mol B iol 2008; 7:3. [34] Lahti L, Myllykangas S, Kn uutila S, Kas ki S. Dependency d etection with similarit y constraints. In: P roc MLSP'09 IEEE International Works hop on Machine Learni ng for Signal Processing XIX, Piscataway, NJ , USA: IEEE 20 09; pp. 89 - 94. [35] Sheng J, Deng H, Calhou n V, Wang Y. Integrated anal ysis of gene expression a nd copy number data on gene shaving using independent co mponent analysis. IEEE Tr Comp Biol Bioinf Epub ahead of print, 2011 . [36] R Development Core Team. R: A Langua ge and Environment for Stat istical Computing. R Foundation for Statist ical Computing, Vienna, Aus tria, 2009 . [37] Louhimo R, Ha utaniemi S. CNAmet: a n R package for inte grating copy number, methylation and exp ression data. Bioinformatics 2 011; 27:887 -8. [38] Haverty P, Fridl yand J, Li L et al. High -resolution ge nomic and expressio n analyses of copy number alteratio ns in breast tumors. Genes Chro mosomes Can cer 200 8; 47:530-42. [39] Mullighan C, Goor ha S, Radtke I et al. Genome- wide analysis of genetic alteratio ns in acut e lymphoblastic leukae mia. Nature 200 7; 446:758-64. [40] Ba asiri R, Glasser S, Steffen D, Wheeler D. T he breast cancer gene database: a collaborative inf ormation r esource. PREPRINT VERSION November 19, 2011. In review. Oncogene 1 999; 18:7958 -65. URL: http://www.tumor -gene.org/T GDB/tgdb.html (5 Ma y 2010, date last accessed ) [41] Futreal P, Coin L, Marshall M et al. A ce nsus o f hum an cancer genes. Nat Rev Cancer 2004; 4:1 77-83. URL: http://www.sanger.ac.uk/Ge net/CGP /Census (11 February 2010, date last ac cessed). [42] Mullighan C, Miller C, Radt ke I et al. BCR- ABL1 lymphoblastic leukae mia is characterized by the deletion of Ikaros. Nature 200 8; 453:110-4. [43] Bengtsson H, Wirapati P , Sp eed TP. A single- ar ray prepr ocessing method for estimating full -resolution ra w copy numbers from all Af fymetrix genotyping arra ys including Geno meWideSNP 5 & 6. Bioinformatics 2009; 2 5:2149-56. [44] Bengtsson H, Irizarr y R, Carva lho B, Speed TP. Estimation and assess ment of ra w copy numbers at the sin gle locus level. Bioinformatics 2008; 2 4:759-67. [45] Olshen A, Venkatra man E, Lucito R, Wigler M. Circular binar y segmentation for the anal ysis of array -based DNA cop y number data. B iostatistics 2004; 5 :557 -72. [46] Mullighan C, Su X, Z hang J et al. Deletion of IKZF1 and p rognosis in acute ly mphoblastic leuke mia. New Englan d Journal o f Medicine 2009; 3 60:470 -80. [47] Lahti L, Elo LL, Aittokallio T, Kaski S. Probabilistic anal ysis of probe reliab ility in differentia l gene e xpression studies with short oligonucleotide ar rays. IEE E/ACM Tr Comp Biol Bioinf 2011; 8 :217-25. [48] Dai M, Wang P, B oyd A et al. Evolving gene/transcr ipt definitions sig nificantly alter the interp retation of GeneChip dat a. Nucleic Acids Res 2 005; 3 3:e175. [49] Ferrari F, Solar i A, Battaglia C, B icciato S. PREDA: a n R-pac kage to identify regional var iations in genomic data. Bioinformatics 2 011; 27:2446- 7. [50] Aerts S, Lambrechts D, Mait y S. Gene prio ritization through geno mic data fusion. Nat Biot ech 20 06; 24:538 -44. [51] de Bie T, Tr anchevent L-C, va n Oeffelen L, Mo reau Y. Kernel -based data fusio n for gene prio ritization. Bioinformatics 2007; 23:i125 -32. [52] Kao C-F, Fang Y- S, Zhao Z, Kuo P-H. Prior itization and Evaluation of Depres sion Candidate Genes b y Combining Multidimensional Data Re sources. PLoS On e 2011; 6:e18696. [53] Tranchevent L- C, Capdevila F, Nitsch D et al. A guide to web tools to p rioritize candidate genes. Brief Bioinform 20 10; 12:22 -32. [54] van Wieringen W, van de W iel M, Ylstra B . Normalized, seg mented or called aCGH data ? Cancer Informatics 2007; 3:321 -7. [55] Lê Cao K-A, González I , Dèjea n S. integrOmics: an R p ackage to unravel relatio nships bet wee n two omics datasets. Bioinformatics 2 009; 25:2855-6. [56] Vaske C, Benz S, Sanbor n J et al. Inference of patient -specific pathway activities from multidimensional cancer genomics data usin g PARADIGM. Bioinfo rmatics 2010 ; 26:i237-45. [57] Witten D, T ibshirani R, Hastie T . A penalized matrix deco mposition, with applicatio ns to sparse p rincipal components and canonical corr elation analysis. Biostatistics 20 09; 10:515-34 . [58] Andrews J, Kennette W, P ilon J. Multi-platfor m whole-genome microarray anal yses refine the epige netic signature o f breast cancer metastasis with gene expr ession and cop y number. PLoS On e 2010; 5:e86 65. [59] Gaire R, Baile y J, Bearfoot J et al. MIRAG AA - a methodology for finding co ordinated effects of microRNA expression ch anges and geno me aberrations in cancer. Bioinformatics 201 0; 26:161 -7. [60] Qin L-X. An Integrati ve Analysis of microRNA and mRNA Expression - A Case Study. Can cer Informatics 2008; 6:369 -79. [61] Johnson N, Speirs V, Curti n N, Hall A. A co mparative study of geno me -wide SNP, CGH micro rray and protein expression analysis to explo re genotypic and phe notypic mechanis ms of acquired antiestr ogen resistance in b reast cancer. Breast Cancer Res an d Treatmen t 2008 ; 111:55-63. Supplementary Mat erial Ferrari Schaefer Hyman Mullighan Pollack CNAme t 106. 96 52 . 34 77 . 44 28 . 38 44 . 99 DR -Cor/Pearson 168. 50 61 . 11 70 . 26 24 . 39 41 . 41 DR -Cor/Spearman 310.52 120. 40 135. 04 45 . 08 78 .41 DR -Cor/t-test - 67 . 52 68 .0 2 26 . 18 43 . 38 edira 0.41 0.23 0.22 0.11 0.15 intCNGEan 5.74 47 . 64 20 . 05 45 . 64 23 . 95 Ortiz-Estevez 0.53 2.84 0. 65 1.24 1.07 pint 86 . 20 130. 20 29 . 75 6.80 19 . 13 PMA 0.34 0.33 0.18 0.17 0.13 PREDA 79.23 155. 65 59.95 360.60 106.53 SIM/full 87 . 51 155. 96 13 . 63 4.77 5.14 SIM/w indow 19 . 15 171. 96 2.81 1.28 1. 40 Supplementary Table 1 Running times (in m inutes) for the comparison al gorithm s in the five benchmarking data sets . PREPRINT VERSION November 19, 2011. In review. Supplementary Figure 1 Receiver-O perator Character istic (ROC) cur ves characterize the cancer gene prioritization performance of t he comparison al gorithm s in two simulated data sets ( ‘Ferrari’ and ‘Schäfer’ ), two breast cancer data sets (‘Hym an’ and ‘Pollack’), and one leukemia data set (‘Mullighan’) based on golden standard lists of custom cancer genes.
Original Paper
Loading high-quality paper...
Comments & Academic Discussion
Loading comments...
Leave a Comment