Towards Unbiased BFS Sampling
Breadth First Search (BFS) is a widely used approach for sampling large unknown Internet topologies. Its main advantage over random walks and other exploration techniques is that a BFS sample is a plausible graph on its own, and therefore we can stud…
Authors: Maciej Kurant, Athina Markopoulou, Patrick Thiran
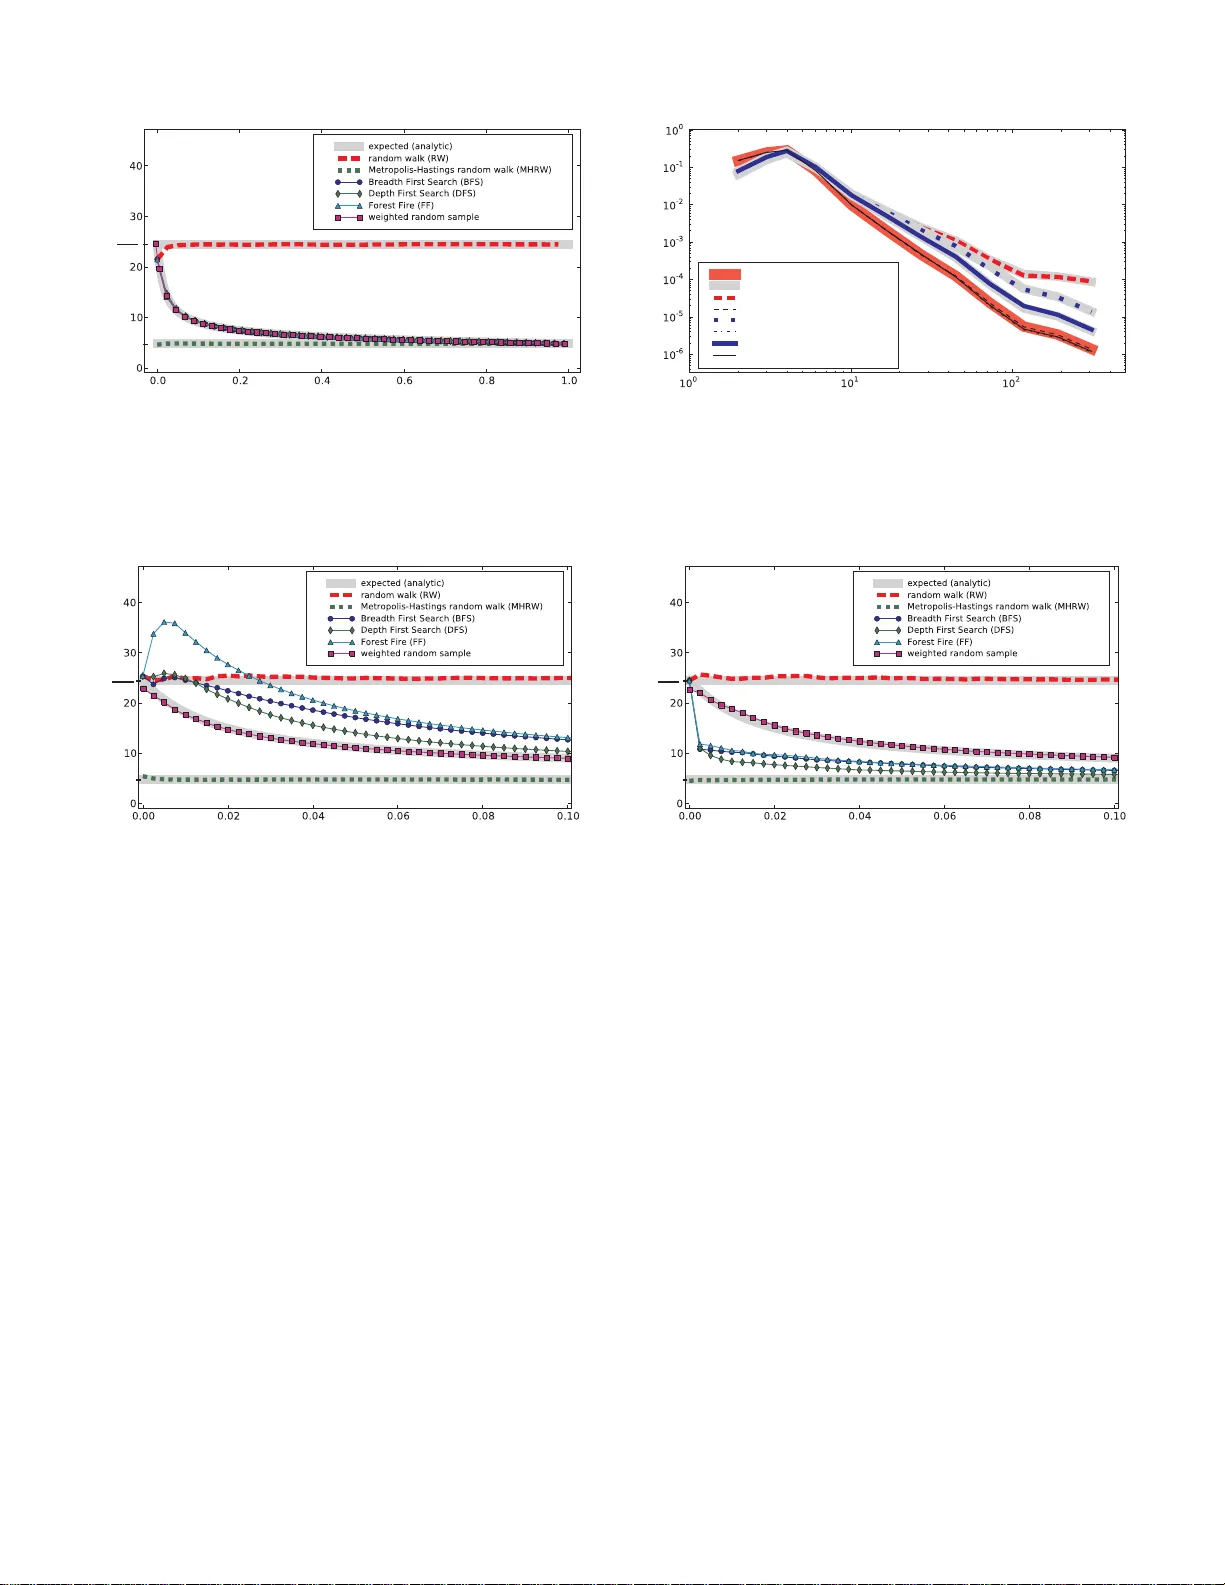
T o wa rds Unbiased BFS Sampling Maciej Kurant EECS Dept University of California, Irvine maciej.kurant@gmail.co m Athina Markopoulou EECS Dept University of California, Irvine athina@uci. edu Patrick Thiran School of C omputer & Comm. S ciences EPFL, Lausanne, Switzerland patrick.thiran@epfl.ch Abstract —Breadth First Search (BFS) is a widely used ap- proach fo r sampling large u nknown Internet topologies. Its main advantage over rand om walk s and other exploration techn iques is that a BFS sample is a plausible graph on its own, and ther efo re we can study its topological characteristics. Howev er , i t has been empirically observed that incomplete BFS is biased toward high- degree nodes, wh ich may strongly affect the measurements. In this paper , we first analytically quanti f y th e degree b i as of BFS sampling. In particular , we calculate the node degree distribution expected to be observed by BF S as a function of the fraction f of cover ed nodes, in a random graph RG ( p k ) with an arbitrary degree distribution p k . W e also show that, f or RG ( p k ) , all commonly used gra ph trav ersal techniq ues (BFS, DFS, For est Fire, Snowball Sampling, RDS) suffer from exactly the same b ias. Next, based on our theoretical analysis, we propose a practical BFS-bias corr ection procedure. It takes as inpu t a collected B F S sample together wi th its fraction f . Even though RG ( p k ) does not capture many graph properties common in real-life graphs (such as assortativity), our RG ( p k ) -based corre ction techniqu e perfo rms well on a broad range of Int ernet topologies and on two large B F S samples of Fa cebook and Orkut networks. Finally , we consider and ev aluate a family of alternativ e correc tion procedures, and demonstrate t h at, although they are unbiased for an arbitrary topology , their large variance makes them far less effective t h an the RG ( p k ) -based technique. Index T erms —BFS, Breadth First Search, graph sampli ng, estimation, bias correction, In ternet topologies, Onlin e Social Networks. I . I N T RO D U C T I O N A large bo dy of work in th e n etworking co mmunity focu ses on Inte rnet topology measure ments at various le vels, including the IP or AS co nnectivity , the W eb (WWW), peer-to-peer (P2P) and o nline so cial networks (OSN). The size of th ese networks and o ther restriction s ma ke measuring the entire graph impossible. For examp le, learning o nly the topolog y of Facebook socia l grap h would r equire downloading mo re th an 250 T B of HTML d ata [2,3] , which is mo st likely impractical. Instead, researchers ty pically collect and study a small but representative sample o f the u nderlyin g graph . In th is paper, we are particularly interested in sam pling networks th at n aturally allo w to e xplore the neig hbors o f a giv en n ode ( which is the case in WWW , P2P and OSN). A n umber of g raph exploratio n techniqu es u se this b asic operation for samp ling. They can be r oughly classified in two categories: ( i) ran dom walks, and (ii) g raph traversals. In the first category , random walks , nod es can be revisited. This categor y include s the classic Random W alk (R W) [4] and This paper is a revised and e xtended version of [1]. h q k i expected observed average node degree h k i h k 2 i h k i f fraction of sampled n odes 1 0 Random W alk (R W) Graph tra versal techn iques: - BFS - DFS - F orest Fire - Sno wball / RDS Metropolis-Hastings Random W alk (MHR W) Fig. 1. Over view of analy tical resul ts. W e calculate the node degre e distrib ution q k expe cted to be observ ed by BFS in a random graph RG ( p k ) with a gi ven de gree distrib ution p k , as a function of the fraction of sampled nodes f . (In this plot, we show only its avera ge h q k i .) W e sho w R W and MHR W as a reference. h k i = h p k i is the real aver age node degree , and h k 2 i is the real avera ge squared node degree . Observatio ns: (1) For a small sample size, BFS has the s ame bias as R W; with increasi ng f , the bias decreases; a compl ete BFS ( f = 1 ) is unbiased, as is MHR W (or uniform sampling). (2) All common graph tra versal technique s (that do not re visit the same node) lead to the same bias. (3) The shape of the BFS curve depends on the rea l node degre e distribut ion p k , but i t is alw ays monotonicall y decrea sing; we calcul ate it precisely in this paper . (4) W e also calcul ate the original distribut ion p k based on the sampled q k and f (not sho wn here). its v ar iations [5,6], as well as the Metropolis-Hastings Random W alk (MHR W). T hey are u sed for samp ling o f nodes on the W eb [7], P2P networks [8]–[10], OSNs [2 ,11] and large graphs in gene ral [12]. Random walks are well stud ied [4] and result in samples th at have either no bias (MHR W) or a known bias (R W) that can be corr ected for [1 3]–[16]. I n co ntrast to BFS, random walks collect a represen tati ve sample of nod es rather than of topo logy , and ar e therefore not the focus of the paper . Howe ver, we use them as baseline fo r comp arison. In the second category , graph traversals , each nod e is visited exactly once (if we let the p rocess run u ntil com - pletion and if the g raph is con nected). These methods vary in the order in wh ich they visit the nod es; examples in clude BFS, Depth-First Search (DFS), Forest Fire (FF), Snowball Sampling (SBS) and Respond ent-Driven Sampling (RDS) 1 . Graph tra versals, especially BFS , are very p opular and widely used for sam pling Intern et to pologies, e.g. , in WWW [17] or OSNs [18]–[ 20 ]. [1 9] alon e has a bout 3 80 citations as of December 201 0, many of which use its Orkut BFS sample. The main reason of this h igh po pularity is that a BFS sam- ple is a plausible g raph o n its own. Consequently , we can study its to pological char acteristics ( e.g. , shortest p ath length s, 1 RDS is essentia lly SBS equippe d with some bias correcti on procedure (omitted in Fig. 1). 2 clustering coefficients, comm unity structur e), which is a big advantage of BF S over random walks. Of course, this approac h is co rrect on ly if th e BFS samp le is r epresentative of the entire graph. At first sight it seems true, e.g. , a BFS sample of a lattice is a (sm aller) lattice. Unfortu nately , this in tuition o ften fails. I t was ob served empirically that BFS introd uces a bias to wards high -degree nodes [1 7,21]–[23]. W e also con firmed this fact in a recent measuremen t of Facebook [2,3], where ou r BFS c rawler found the average no de d egree 324 , while the real value is o nly 9 4 . This m eans tha t th e average nod e degree is overestimated by BFS by about 2 50%! This has a striking effect n ot on ly o n the node pro perty statistics, but also on th e topolo gical m etrics. Despite the popular ity of BFS on the one hand, and its bias on the other h and, we still know relatively little about the statistical prop erties of node sequ ences return ed by BFS. The forma l analysis is challeng ing because BFS, similarly to ev ery sampling without replacemen t, intro duces co mplex depend encies between the sampled n odes difficult to deal with mathematically . Contributions. Our work is a step towards understan ding the statistical ch aracteristics o f BFS samples and correcting for the ir biases, with the following m ain contributions. First, we fo cus o n a rand om gr aph RG ( p k ) with a g i ven (and arb itrary) degree distribution p k . W e calculate precisely the n ode degree distribution q k expected to be o bserved by BFS as a f unction o f the fr action f of sampled nodes. W e illustrate this and r elated r esults in Fig. 1 . T o the best o f o ur knowledge, this is the first an alytical resu lt d escribing the bias of BFS sampling . Second, based on our theo retical analy sis, we pro pose a practical BFS-bias cor rection procedure. It takes as input a collected BFS sample togeth er with the fr action f of covered nodes, and estima tes the mean of a n arbitrar y function x ( v ) defined on grap h nod es. Even thoug h RG ( p k ) misses many graph prop erties commo n in re al-life grap hs (su ch as a ssorta- ti vity), our R G ( p k ) -based correc tion technique p erforms well on a b road ran ge o f In ternet to pologies, an d on two large BFS samples of Facebook and Orku t n etworks. W e make its read y- to-use pyt hon implemen tation pu blicly av ailable at [2 4]. Third, we complem ent the above findin gs by pro posing a family of alternative correctio n procedu res that are unbiased for any ar bitrary to pology . Although seemin gly attractive, they are ch aracterized by large v a riance, which makes them far less effecti ve than the R G ( p k ) -based co rrection techniq ue. Scope. Our theo retical results hold strictly for the rand om graph mod el R G ( p k ) . (Howev er , we show th at they apply relativ ely well to a broad ran ge of re al-life top ologies.) W e also restrict our attention to static graphs with self-declare d un- weighted so cial links; dynam ically varying graph s [ 8,10,25]– [30] and interactio n grap hs [31]– [33] are o ut of the scope of this pa per . Finally , our RG ( p k ) -based b ias-correction proc edure is d e- signed for local grap h pro perties, such as no de statistics. Our analytical r esults can po tentially help the estimation of no n- local grap h pro perties ( such as grap h d iameter), which is o ur main dir ection for th e future. Outline. The outline of the paper is as follows. Section II discusses re lated work . Section III presents BFS and other graph traversal algorithms under stud y . W e also briefly d e- scribe ran dom walks that are used as baseline fo r compar- ison through out th e pa per . Section IV presents th e ra ndom graph R G ( p k ) m odel used in this paper . Section V analyzes the degree bias of BFS. Section VI shows how to correct for this bias. Sectio n VII ev aluates our results in simulations and by sampling real world networks. Section VIII introduces and e valuates altern ati ve BFS-bias correctio n techn iques. Sec- tion IX g i ves som e pr actical sampling recomme ndations, a nd Section X conclud es the paper . I I . R E L A T E D W O R K BFS used in practice. BFS is widely used today for ex- ploring large networks, such as OSNs. In [18], Ahn et al. used BFS to sample Orkut and MySpace. In [19] an d [27], Mislove et al. used BFS to crawl the social grap h in four popular OSNs: Flick r , LiveJ ourna l, Orkut, and Y ouT u be. [19] alone h as abou t 380 citation s as o f Dec ember 201 0, m any of which use its h ighly biased Orkut BFS samp le. In [20], W ilson et al. m easured the social graph and the user interaction graph of Facebook u sing several BFSs, each BFS constrained in one of the largest 22 regional Facebook networks. I n our recen t work [2,3], we have also crawled Facebook using various sampling techn iques, including BFS, R W and MHR W . BFS bias. It h as been empirically ob served that incom - plete BFS an d its variants intr oduce bias towards hig h-degree nodes [1 7] [21]–[23]. W e confirmed this in Facebook [2,3], which, in fact, inspired an d m otiv ated this pap er . Analo gous bias h as been observed in the field of social science, fo r sampling techniqu es closely related to BFS, i.e. , Sn owball Sampling and RDS [15,34,35] (see Sec tion III- B4). Analyzing BFS. T o th e best o f our kn owledge, the sampling bias of BFS has no t be en analyzed so far . [36] and [37] ar e the closest related papers to our methodolo gy . Th e original paper b y Kim [36] analyzes the size of the largest conne cted compon ent in classic Erd ¨ os-R ´ enyi random graph by es sentially applying the config uration model with node degrees ch osen from a Poisson distribution. T o match th e stub s (o r “clon es” in [3 6]) un iformly at random in a tractable way , Kim proposes a “cut-off line” algorithm. He first assigns each stub a random index f rom [0 , np ] , and next p rogressively scans th is interval. Achlioptas et al. used this powerful idea in [37] to stud y th e bias of tracerou te sampling in random graphs with a given degree d istribution. The b asic opera tion in [37] is trac eroute ( i.e. , “d iscover a pa th”) a nd is perfor med fr om a sin gle node to all other nodes in the graph . Th e u nion of the ob served paths f orms a “BFS-tree”, wh ich inclu des all nodes but misses some edges ( e.g. , those between nodes at the same d epth in the tree). In co ntrast, the basic ope ration in the traversal metho ds presented in our pap er is to discover all neighbo rs of a nod e, and it is applied to all no des in increasing distanc e from the orig in. Anoth er im portant d ifference is tha t [ 37] studies a 3 completed BFS-tree, wher eas we stud y the sampling process when it has visited o nly a fraction f < 1 of nodes. Ind eed, a completed BFS ( f = 1 ) is tr i vial in o ur case: it h as no bias, as all no des are covered. In the field of social science, a significan t effort was put to correct for the bias of BFS’ s clo se cousin - Snowball Sampling (SBS) [34]. SBS tog ether with a bias cor rection proce dure is called Respondent- Driv en Sampling (RDS) [35]. The curren tly used corr ection technique [15,16] assumes th at nodes can be revisited, which essentially ap proxima tes SBS b y Rand om W alk (see Section VI-A1). In this paper, we formally show that this appro ximation is valid if th e fraction f of sampled nodes is r elati vely small. Howe ver, as [38] po ints out, the current RDS me thodolog y is systematically b iased for larger f . Consequently , [39] pro posed an SBS bias corr ection m ethod based on the rando m grap h RG ( p k ) . This is essentially th e same basic st arting idea as used in our o riginal paper published indepen dently [1]. However , the two pa pers fun damentally differ in the fin al solution: [ 39] p roposes a simulation -aided approa ch, where as we solve the pro blem analy tically . Another recent and related paper is [40]. The autho rs propo se and ev aluate a heuristic approach to correct the degree b ias in the i th generation of SBS, b ased on the values measured in the gen eration i − 1 . In practice, this generation -based scheme may be challenging to implem ent, because the num ber of nod es per generation m ay grow close to exp onential with i . Conseq uently , we are likely to face a situation whe re co llecting the n ext gen eration is pr ohibitively expensiv e, wh ile th e current ge neration h as m uch f ewer nod es than ou r sampling cap abilities allow for . Pr obab ility Pr o portional to Size W ith out Replacemen t (PPSWOR). At a clo ser look , our R G ( p k ) -based a pproach reduces BFS ( and o ther graph tr a versals) to a classic sam- pling design called Prob ability Prop ortional to Size Without Replacement (PPSWOR) [41]–[48]. Unfortunately , to th e best of our kn owledge, non e of the existing results is directly applicable to our problem. This is because, speaking in the terms used later in this pap er , the av ailab le results either (i) require the kn owledge of q k ( f ) (expected, n ot sampled) as an input, (ii) propo se how to calculate q k ( f ) for the first two nodes only , or (iii) calc ulate q k ( f ) as an a verage of many simulated traversals of the known grap h (in contr ast, we only have one run on u nknown grap h) [48]. In fact, this work can be naturally e xtended to add ress th e problems with PPSWOR. Pr evious version of th is pa per . This work is a revised an d extended version of our recent co nference pap er [1]. The main changes are: (i) a successful application of o ur RG ( p k ) -based correction proc edure to a wide rang e of large-scale real-life Internet topologies (T a ble II, Fig. 5, Fig. 6(d), Section VI I-B), (ii) bias correctio n procedu res for arbitrar y node pr operties (Section VI), (iii) a comp lementary BFS-bias corre ction tech- nique ( Section VI II), and (iv) a publicly av ailab le read y-to-use python imp lementation of ou r appr oach. Finally , we w ould like to stress that our two oth er JSA C submissions [3,49] fo cus o n sampling techniqu es based on random walks, wh ich differ in fun damental aspects ( sampling with rep lacement vs witho ut, sampling of nodes v s of topol- ogy) fro m th e BFS sampling ad dressed her e. I I I . G R A P H E X P L O R A T I O N T E C H N I Q U E S Let G = ( V , E ) be a con nected g raph with the set of vertices V , and a set of undirected ed ges E . Initially , G is unknown, excep t for on e (or som e limited n umber of) seed node(s). When sam pling throu gh graph exploration , we begin at the seed node, and we recu rsi vely visit (o ne, some o r all) its neighbo rs. W e d istinguish two main categories of explo ration technique s: rand om walks and graph traversals. A. Rand om walks (baselin e ) Random walks allow r evisit ing the same no de many tim es. W e con sider 2 the following classic examples: 1) Random W alk (RW): In this classic sampling tech- nique [ 4], we start a t some seed node. At every iteratio n, th e next-hop nod e v is c hosen uniformly at rando m am ong the neighbo rs of the current nod e u . It is easy to see that R W introdu ces a linear b ias towards no des o f high degree [4]. 2) Metr opolis Hastings Ran dom W alk (MHRW): In this technique , as in R W , the next-h op node w is chosen u niformly at random among the neighbo rs of the curr ent node u . How- ev er , with a pr obability that depends o n the d egrees of w and u , MHR W performs a self-lo op instead of moving to w . More specifically , the prob ability P MH u,w of moving from u to w is as follows [5 0]: P MH u,w = 1 k u · min(1 , k u k w ) if w is a neighb or o f u , 1 − P y 6 = u P MH u,y if w = u , 0 otherwise , (1) where k v is th e d egree of node v . Essentially , MHR W reduces the tra nsitions to high-degree nod es and thus eliminates the degree bias of R W . This prop erty of MHR W was recen tly exploited in various network samp ling contexts [2,8,10,11]. B. Graph travers als In contrast, g raph trav ersals never revisits the same n ode. At the end of the pro cess, and assuming that the graph is connected , all no des are v isited. Howe ver, when using graph trav ersals for sampling, we terminate after having co llected a fraction f < 1 (u sually f ≪ 1 ) of graph n odes. 1) Br ead th F irst Sear ch (B F S): BFS is a cla ssic g raph trav ersal algorithm tha t starts fr om the seed a nd progr essi vely explores all neighb ors. A t each new iteration th e e arliest ex- plored b ut not-yet-visited n ode is selected next. Co nsequently , BFS d iscovers first the nodes clo sest to the seed. 2) Depth F irst Sea rc h (DFS ): This techniqu e is similar to BFS, except that at ea ch iteration we select th e latest explor ed but no t-yet-visited node. A s a r esult, DFS explor es first the nodes that are faraw ay (in the number of h ops) from the seed. 2 W e inc lude random wa lks only as a usefu l baseline for comparison with graph tra versal s ( e .g. , BFS). The analysi s of ran dom walks does not count as a contribut ion of this pape r . 4 G = ( V , E ) graph G with nodes V and edges E k v degre e of node v p k = 1 | V | P v ∈ V 1 k v = k degre e dist ribut ion in G h k i = h p k i = P k k p k av erage node degree in G q k expe cted sample d de gree distributi on h q k i = P k k q k expe cted sample d a vera ge node degree b q k sampled degree distributio n b p k estimate d original degree distributio n in G f fracti on of nodes co vered by the sample T ABLE I N O TA T I O N S U M M A RY . 3) F or est F ire (FF): FF is a rando mized version of BFS, where fo r every neighb or v of th e cur rent n ode, we flip a c oin, with pro bability of success p , to decide if we explore v . FF reduces to BFS for p = 1 . It is p ossible that th is process dies out bef ore it covers all n odes. In this case, in order to make FF compara ble with oth er techniques, we revi ve th e process from a rando m node already in the sample. Forest Fire is inspired by the g raph growing m odel of the sam e nam e prop osed in [51] and is used as a graph samp ling techniqu e in [12]. 4) Sno wball S ampling (SBS ) a nd Respo ndent-Driven Sam- pling (RDS): Accord ing to a classic defin ition by Good- man [34], an n -name Sn owball Sam pling is s imilar to BFS, b ut at every nod e v , not all k v , but exactly n neighbor s are ch osen random ly out of all k v neighbo rs of v . These n neigh bors are scheduled to visit, b u t only if they h av e n ot been v isited before. Respondent- Driv en Sampling ( RDS) [ 15,16,35] ad opts SBS to pene trate hidde n popu lations (such as that o f d rug ad dicts) in social surveys. In Section II, we comme nt o n current technique s to correct for SBS/RDS bias towards n odes of higher degree. I V . G R A P H M O D E L R G ( p k ) A basic, y et very im portant prope rty of every graph is its node degree distribution p k , i.e. , the fraction of nod es with degree equal to k , for all k ≥ 0 . 3 Dependin g on the network, the degree d istribution ca n v ar y , ranging from constant-degree (in regular grap hs), a distribution co ncentrated ar ound th e av erage value ( e.g. , in Erd ¨ os-R ´ enyi ran dom graphs or in well- balanced P2P networks), to h eavily r ight-skewed distrib u tions with k covering several decades (as this is the case in WWW , unstructur ed P2P , In ternet at the IP an d Au tonomou s System lev el, OSNs). W e hand le all these cases by assuming th at we are g i ven a ny fixed n ode degree distribution p k . Other than that, the graph G is d rawn unifo rmly at rando m f rom the set of all graph s with degree distribution p k . W e den ote this model by R G ( p k ) . Because RG ( p k ) mimic s an arbitr ary node degree distribu- tion p k , it can be considered a “first-ord er appr oximation” o f real-life gr aphs. Of co urse, there are many gr aph proper ties other than p k that are n ot ca ptured by R G ( p k ) . Howev er , we show later that, with re spect to the BFS sampling bias, RG ( p k ) approx imates the real Inte rnet topo logies su rprisingly well. W e u se a classic techn ique to gener ate R G ( p k ) , called the config u ration mod el [52]: each no de v is given k v “stubs” 3 As we define p k as a ‘fraction’, not the ‘probability’ , p k determin es the degre e seque nce in the graph, and vice v ersa. or “edges-to -be”. Next, all these P v ∈ V k v = 2 | E | stu bs are random ly matched in pair s, until all stubs are exhausted (and | E | edges are created). In Fig . 2 (ig nore the rectangular inter val [0,1] fo r now), we present four no des with their stub s (left) and an example of the ir ran dom m atching (righ t). V . A N A L Y Z I N G T H E N O D E D E G R E E B I A S In this section, we study the no de d egree bias obser ved when the g raph explo ration techn iques of Section III are run on the random gra ph RG ( p k ) of Section IV. In particular, we are interested in the node degree d istribution q k expected to be o bserved in the raw sample. T ypically , the observed distribution is different from the original one, q k 6 = p k , with higher average value h q k i > h p k i ( i.e. , av erage sampled and observed node degree, respectively). Below , we d eriv e q k as a f unction of p k and, in the case of BFS, of the frac tion of sampled n odes f . A. Rand om walks (baselin e ) W e begin by summarizing the relev ant re sults kn own fo r walks, in p articular for R W and MHR W . They will serve as a referenc e p oint for our main analysis of graph traversals b elow . 1) Random W alk (RW): Random walks h a ve b een widely studied; see [4] for an excellent survey . In any gi ven connected and aperiod ic gr aph, th e probab ility of being at a particular node v conv erges at equilibr ium to the stationar y d istribu- tion π RW v = k v 2 | E | . Therefo re, the expected observed degree distribution q RW k is q RW k = X v π RW v · 1 { k v = k } = k 2 | E | p k | V | = k p k h k i , (2 ) where h k i is the a verage node de gree in G . Eq. (2) is essentially similar to calcu lation in [13]–[16]. As this holds for any fixed (and con nected and aperiodic ) gr aph, it is also true f or all conn ected g raphs gener ated by the config uration model. Consequently , the expecte d o bserved average node degree is h q RW k i = X k k q RW k = P k k 2 p k h k i = h k 2 i h k i , (3) where h k 2 i is the average squar ed no de d egree in G . W e sho w this value h k 2 i h k i in Fig . 1. 2) Metr opolis Hastings Random W alk (MHRW): It is easy to show that th e tr ansition matrix P MH u,w shown in Eq .(1) leads to a un iform station ary distribution π MH v = 1 | V | [50], an d consequen tly: q MH k = p k (4) h q MH k i = X k k q MH k = X k k p k = h k i . (5) In Fig. 1, we show that MHR W estimates the true mean. 5 B. Graph traversals (Main R esult) In bo th R W and MHR W the n odes can be revisited. So the state o f th e system at iteratio n i + 1 dep ends only on iteration i , which makes it possible to an alyze with Markov Chain techniq ues. In contrast, graph traversals do not allow for node revisits, which introdu ces crucial d ependenc ies between all the iteration s and sig nificantly co mplicates the analysis. T o han dle these de pendencies, we ado pt an elegant techniqu e recently introduced in [36] (to stud y the size of the largest connected compon ent) and extend ed in [3 7] (to study the bias of tracerou te sampling) . Howe ver, our work differs in many aspects from both [36] an d [3 7], on which we comm ent in detail in the related work Section II. 1) Exploration without r epla c ement at the stub level: W e begin by definin g Algorith m 1 (below) - a general gr aph trav ersal techniqu e that collects a sequ ence of nodes S , without replacemen ts. T o be comp atible with the con figuration model (see Section IV), we are interested in the process at the stub level , whe re we consid er one stub at a tim e, r ather th an on e node at a time. An integral part of the algorithm is a queu e Q that keeps th e discovered, but still no t-yet-followed stub s. First, we e nqueue on Q all the stubs o f som e initial n ode v 1 , and by setting S ← [ v 1 ] . Next, at every itera tion, we dequeu e one stub from Q , call it a , and f ollow it to discover its partn er- stub b , and b ’ s owner v ( b ) . If nod e v ( b ) is no t yet discovered, i.e. , if v ( b ) / ∈ S , then we appen d v ( b ) to S and we enqu eue on Q all other stub s o f v ( b ) . Algorithm 1 Stub-Level Graph Tra versal 1: S ← [ v 1 ] and Q ← [all stubs of v 1 ] 2: while Q is n onempty do 3: Deque ue a from Q 4: Discover a ’ s par tner b 5: if v ( b ) / ∈ S then 6: Append v ( b ) to S 7: Enqueu e on Q all stubs o f v ( b ) except b 8: else 9: Remove b from Q 10: end if 11: end while Dependin g on the sch eduling disciplin e fo r the elements in Q (line 3), Alg orithm 1 implements BFS (for a first-in first out scheduling) , DFS (last-in first-ou t) or Forest Fire (first- in first-o ut with r andomize d stub losses). Lin e 9 g uarantees that th e alg orithm never tracebacks the e dges, i.e. , that stub a dequeu ed from Q in line 3 never belongs to an edge that h as already been traversed in the o pposite direction . 2) Discovery on- the-fly: In line 4 of Algorithm 1, we follow stub a to discover its partner b . In a fixed g raph G , this step is determin istic. In the c onfiguratio n m odel RG ( p k ) , a fixed graph G is o btained by matchin g all the stubs unifo rmly at random . Next, we can sam ple this fixed gra ph an d average th e result over the sp ace o f all th e ran dom g raphs R G ( p k ) that have just been c onstructed. Unfortun ately , this space gr ows exponentially with the nu mber o f nodes | V | , making the problem un tractable. Ther efore, we adopt an altern ati ve c on- struction of G - by iter ati vely selecting b on -the-fly ( i. e. , every time line 4 is executed), unifo rmly at rando m fr om a ll still unmatche d stubs. By the princ iple o f deferr ed decision s [ 53], these two ap proaches are equiv a lent. W ith the help of the on -the-fly approach, we are able to write down the equ ations we n eed. Indee d, let us denote by X i ∈ V the i th selected n ode, and let P ( X 1 = u ) be the probab ility that node u ∈ V is cho sen as a starting nod e. It is easy to show tha t with z = 2 | E | we have P ( X 2 = v ) = X u 6 = v k v z − k u · P ( X 1 = u ) (6) P ( X 3 = w ) = X v 6 = w X u 6 = w,v k w z − k v − k u · k v z − k u · P ( X 1 = u ) , (7) and so on. Theo retically , th ese equation s allow us to calculate the expected node degree at any iteration, and thus the degree bias o f BFS. 3) Br eak in g the depende ncies: Ther e is still on e p roblem with the eq uations above. Due to th e increasing n umber of nested sums, th e results can be calcu lated in pr actice fo r a first few iteration s on ly . Th is is because we select stub b unif ormly and ind ependen tly at random from all the u nmatched stubs. So the stub selected at iteration i depend s on the stubs selected at iter ations 1 . . . i − 1 , which results in the nested sums. W e remedy this p roblem b y imp lementing th e o n-the-fly approach as f ollows. First, we assign each stub a real- valued index t drawn unifo rmly at rando m fro m the interval [0 , 1] . The n, ev ery time we pr ocess line 4, we pick b as th e un matched stub with the smallest index. W e can interpret this as a continuo us- time process, where we dete rmine p rogressively the partner s of stubs dequeu ed from Q , by scann ing the inter val from time t = 0 to t = 1 in a sear ch of un matched stubs. Because the indices chosen by the stub s are indepen dent from each other, the above trick breaks the depend ence between the s tubs, which is crucial fo r makin g th is appr oach tractab le. In Fig. 2, we present an example execution of Alg orithm 1, where line 4 is implemen ted a s describe d ab ove. 4) Expected sampled d egr ee distribution q BFS k : Now we are ready to derive the expected ob served degree d istribution q k . Recall that all the stub indices are cho sen in dependen tly an d unifor mly from [0 , 1 ] . A vertex v with degree k is n ot samp led yet at time t if the indices of all its k stubs ar e larger than t , which happens with probability (1 − t ) k . So the probab ility that v is sampled befor e time t is 1 − (1 − t ) k . The refore, the expected fraction o f vertices of d egree k sampled befor e t is f k ( t ) = p k (1 − (1 − t ) k ) . (8) By n ormalizing Eq.(8), we o btain the expected observed ( i.e. , sampled) degree distribution at time t : q BFS k ( t ) = f k ( t ) P l f l ( t ) = p k (1 − (1 − t ) k ) P l p l (1 − (1 − t ) l ) . (9) 6 3 4 3 1 1 1 1 2 2 2 1 0 1 0 1 0 3 4 3 1 time t (index) time t (index) current time t v 1 v 1 v 1 v 2 v 2 v 2 v 3 v 3 v 3 v 4 v 4 v 4 Fig. 2. An il lustrat ion of th e stub-le vel, on-the-fly graph expl oration without replace ments. In this particula r example, we sho w an e xecution of BFS starting at node v 1 . Left: Initially , each node v has k v stubs, where k v is a gi ven ta rget degree of v . Each of these stubs is assigned a real-v alued number dra wn uniformly at random from the interv al [0 , 1] sho wn belo w the graph. Next, we follow Algorith m 1 with a starting node v 1 . The numbers ne xt to the stubs of ev ery node v indicat e the order in which these stubs are enqueued on Q . C enter: The state of the system at time t . All stubs in [ 0 , t ] have alre ady been matc hed (the indice s of matched stubs are set in plain lin e). All unmatc hed stubs are distri bute d uniformly at random on ( t , 1] . This inter va l can contain also some (here tw o) already matched stub s. Right: The final result is a real izati on of a random graph G with a gi ven node degree sequence ( i.e. , of the configurat ion model). G may contain s elf-lo ops and multiedges. Unfortu nately , it is difficult to interpr et q BFS k ( t ) directly , be- cause t is p roportio nal neither to th e numb er of match ed edges nor to the num ber of discovered no des. Recall that our primary goal is to expr ess q BFS k as a f unction of fr action f of covered nodes. W e ach ie ve this by calculating f ( t ) - the expected fraction of nodes, o f any degree , visited before time t f ( t ) = X k f k ( t ) = 1 − X k p k (1 − t ) k . (10) Because p k ≥ 0 , and p k > 0 for at least one k > 0 , the term P k p k (1 − t ) k is con tinuous an d strictly decreasing from 1 to 0 with t growing f rom 0 to 1. Thus, fo r f ∈ [0 , 1] there exists a well defined t = t ( f ) that satisfies Eq.(1 0), i.e. , th e inverse of f ( t ) . Altho ugh we can not compu te t ( f ) analy tically ( except in so me special cases such as for k ≤ 4 ), it is straigh tforward to fin d it n umerically . Now , we can rewrite Eq. (9) as q BFS k ( f ) = p k (1 − (1 − t ( f )) k ) P l p l (1 − (1 − t ( f )) l ) , (11) which is the expected observed degree distribution after cover- ing fraction f of no des of g raph G . Consequently , th e expected observed average degree is h q BFS k i ( f ) = X k k · q BFS k ( f ) . (12) In other words, E q.(11) an d Eq .(12) de scribe th e bias of BFS sampling under RG ( p k ) , which w as our first goal in this paper . Below , we f urther analyze these eq uations to g et mo re insights in th e nature of BFS bias. 5) Equiva lence o f traver sal techniqu es u nder RW ( p k ) : An interesting obser vation is that, und er the rand om graph m odel RW ( p k ) , all co mmon traversal technique s (BFS, DFS, FF , SBS, etc) are subject to exactly the same bias. T he explanation is that th e samp led nod e seq uence S is fully de termined by the cho ice of stub indices on [0 , 1] , in depend ently of the way we ma nage the elements in Q . 6) Equiva lence of traversals to weig h ted samplin g without r epla cement: Consider a node v with a degree k v . The probab ility that v is discovered befo re time t , gi ven that it has n ot been discovered befo re t 0 ≤ t , is P ( v b efore time t | v not bef ore t 0 ) = 1 − 1 − t 1 − t 0 k v (13) W e now take the der i vati ve o f the above eq uation with respec t to t , w hich results in the conditional p robability density function k v ( 1 − t 1 − t 0 ) k v − 1 . Setting t → t 0 (but keeping t > t 0 ), reduces it to k v , wh ich is the pro bability density that v is sampled at t 0 , given that it has not been samp led before. This means that at every point in time, out of all nodes that have not yet b een selected , the p robability of selecting v is p roportio nal to its d egree k v . Th erefore, this scheme is equiv ale nt to node sampling weigh ted by d egree, with out replacemen ts. 7) Equivalen c e of traversals with f → 0 to RW : Finally , for f → 0 (and thus t → 0 ), we have 1 − (1 − t ) k ≃ k t , and Eq. ( 9) simplifies to Eq. (2). Th is mean s th at in the beginning of th e sampling process, ev ery trav ersal technique is equiv alent to R W , as shown in Fig. 1 for f → 0 . 8) h q BFS k i is decr ea sin g in f : As in Section V -B2, let X i ∈ V be th e i th selected node, and let z = 2 | E | . W e have shown above that our procedu re is e quiv alen t to weighted samp ling without replacemen ts, thus we can write P ( X 1 = u ) = k u z . Now , it f ollows from Eq. (6) that P ( X 2 = w ) = k w z · α w , where α w = P u 6 = w k u z − k u . Becau se for any two nodes a and b , w e h a ve α b − α a = z ( k a − k b ) / (( z − k a )( z − k b )) , α w strictly decreases with growing k w . As a re sult, P ( X 2 ) is mor e co ncentrated aroun d n odes with smaller degrees th an is P ( X 1 ) , implyin g that E [ k X 2 ] < E [ k X 1 ] . W e can use an analogo us argum ent at every iteration i ≤ | V | , which allows us to say that E [ k X i ] < E [ k X i − 1 ] . I n other words, h q BFS k i ( f ) is a de creasing functio n o f f . A pr actical con sequence is that many sho rt traversals are more biased than a long one, with the same total number of samples. 9) Comments o n the graph co nnectivity: Note th at the configur ation m odel R G ( p k ) might result in a graph G th at is not con nected. In this case, every exploration technique covers only the co mponen t C in which it was initiated; co nsequently , the process described in Section V -B3 stops once C is covered. In p ractice, it is a lso po ssible to efficiently g enerate a simple and co nnected rando m graph with a g iv e n degree sequence [54]. 7 V I . C O R R E C T I N G F O R N O D E D E G R E E B I A S In the previous section we de riv ed the expected obser ved degree distribution q k as a functio n o f the or iginal degree distribution p k . The distribution q k is u sually biased tow ar ds high-d egree node s, i. e. , h q k i > h p k i . Moreover , becau se m any node p roperties are correla ted with the n ode degree [2], their estimates are also potentially biased. For exam ple, let x ( v ) be an arbitrary f unction defin ed on gr aph nodes V ( e.g. , node age) an d let its mean value x av = 1 | V | X v ∈ V x ( v ) (14) be the value we are trying to estimate. If x ( v ) is somehow correlated with node degree k v , th en th e straigh tforward esti- mator b x naive av = 1 / | S | · P v ∈ S x ( v ) is subject to the same bias as is h q k i . I n this section, we derive u nbiased estimator s b x av of x av . W e also directly ap ply b x av to obtain th e estimators b p k and h b p k i o f the original no de d egree distribution an d its mean, respectively . Let S ⊂ V b e a sequence of vertices that we samp led. Based on S , w e can estimate q k as b q k = number o f node s in S with degree k | S | . (15) A. Rand om walks (baselin e ) 1) Rand om W alk (RW): Under R W , the sampling pro ba- bility of a nod e v is pro portiona l to its degree k v . Because the sampling is do ne with replaceme nts, we can apply the Hansen-Hur witz estimator [ 55] to o btain th e f ollowing u nbi- ased estima tor [13]–[16] b x RW av = P v ∈ S x ( v ) /k v P v ∈ S 1 /k v . (16) For exam ple, if x ( v ) = 1 { k v = k } then b x RW av estimates the propo rtion of nodes with degree equa l to k , i.e. , exactly p k . In that case, Eq .(16) simplifies to b p RW k = b q k k · X l b q l l ! − 1 (17) where we used the fact th at P v ∈ S 1 { k v = k } = | V | · b q k . From Eq.(17), we can estimate the average nod e degre e as h b p RW k i = X k k b p RW k = 1 · X l b q l l ! − 1 = | S | P v ∈ S 1 k v (18) 2) Metr opo lis Hastings R a ndom W alk (MHRW): Under MHR W , we tr i vially have b x MH av = 1 | S | X v ∈ S x ( v ) , (19) b p MH k = b q k , (20) h b p MH k i = X k k b p MH k = X k k b q k . (21) B. Graph travers als Under BFS and other tr a versals, the inclusion p robabil- ity π BFS v ( i.e. , the probab ility o f nod e v being inc luded in sample S ) o f n ode v ∈ V is pro portion al to π BFS v ∼ q BFS k v p k v ∼ 1 − (1 − t ( f )) k v , where the secon d relation originates f rom Eq.( 11). Con- sequently , an applicatio n of the Horvitz- Thompso n estima- tor [56], designed ty pically f or sampling with out re placement, leads to b x BFS av = X v ∈ S x ( v ) 1 − (1 − t ( f )) k v ! · X v ∈ S 1 1 − (1 − t ( f )) k v ! − 1 . (22) Now , similarly to the analysis of R W (above), we obtain b p BFS k = b q k 1 − (1 − t ( f )) k · X l b q l 1 − (1 − t ( f )) l ! − 1 (23) h b p BFS k i = X k k b p BFS k . (24) Howe ver, in orde r to ev alu ate th ese expre ssions, we need to ev aluate t ( f ) , that, in turn, req uires p k . W e can solve this chicken-and -egg problem iterati vely , if we know th e r eal frac- tion f real of covered no des, or equivalently the g raph size | V | . First, we evaluate Eq .(23) f or some values of t and feed the resulting b p k ’ s into Eq . (1 0) to obtain th e co rrespond ing f ’ s. By repeating this process, we can efficiently drive th e values of f arb itrarily close to f real , an d thus fin d the desired b p k . In summary , f or BFS, we showed h ow to estimate the mean x av of an arbitr ary function x ( v ) defin ed on graph nodes, with the estimator of the original d egree distribution p k as a special c ase. Note that ou r ap proach is feasib le, as it requir es only the sam ple S (with value x ( v ) and degree k v for every node v ∈ S ) and the fractio n f of sampled no des. In [24], we make a python imple mentation of all the above estimators publicly av ailable. C. Alternative ap pr oach In Section VIII, we propo se an d ev alu ate a family of alternative cor rection pro cedures that are u nbiased for any arbitrary topology . Although seemin gly attractive, they are characterized by large variance, which makes the m far less effecti ve than our R G ( p k ) -based co rrection techniq ue. V I I . S I M U L AT I O N R E S U LT S In this section, we evaluate our theore tical findings o n random and real-life gr aphs. A. Rand om g raphs Fig. 3 verifies all the fo rmulae deri ved in this paper, fo r the random gr aph R G ( p k ) with a given degree d istribution. T he analytical expectation s are plotted in thick plain lines in the backgr ound and the averaged simulation resu lts ar e plotted in thinner lines ly ing on top o f them. W e observe almost a 8 f f raction of covered nod es h q k i observed average node degree k node degree Prob( k ) Degree distribution A verage nod e d egree h k i h k 2 i h k i real, p k expected, q k R W , sampled, b q k R W , estimate, b p k BFS, f = 0 . 1 , sampled , b q k ( f ) BFS, f = 0 . 1 , estimate, b p k ( f ) BFS, f = 0 . 3 , sampled , b q k ( f ) BFS, f = 0 . 3 , estimate, b p k ( f ) Fig. 3. Comparison of sampling techniques in theory and in simulation. Left: O bserv ed (sampled) ave rage node degree h q k i as a function of the fraction f of sampled nodes, for v arious sampli ng techniques. The results are avera ged o ver 1000 graph s with 10000 nodes each, generated by the configu ration model with a fixed heavy-t ailed degree distribution p k (sho wn on the right). Right: Real, expect ed, and estimated (correct ed) degre e distribut ions for selected techni ques and va lues of f (other techn iques behav e analogousl y). W e obtain ed analogous results for other degre e distribu tions and graph s izes | V | . The term h k i is the real a verage node degre e, and h k 2 i is the real avera ge squared node de gree. f - fraction of covered nodes f - fraction of covered nodes h p k i - average sampled node degree h p k i - average sampled node degree A verage nod e d egree, assorta ti v ity r > 0 A verage nod e d egree, assorta ti v ity r < 0 h k i h k i h k 2 i h k i h k 2 i h k i Fig. 4. The effect of assortativ ity r on the results . First, we use the configura tion model with the same degree distribut ion p k as in Fig. 3 (an d the s ame number of nod es | V | = 10000 ) to generate a gra ph G . Ne xt, we app ly the pai rwise edge re wiring techn ique [57] to change the assortat i vity r of G without changin g node deg rees. This techniqu e iterat i vely tak es two random edges { v 1 , w 1 } and { v 2 , w 2 } , and re wires them as { v 1 , w 2 } and { v 2 , w 1 } only if it brings us closer to the desired val ue of assortat i vity r . As a result, we obt ain graphs with a positi ve (le ft) and ne gati ve (right) assortati vity r . Note that for a bette r reada bility , we pre sent onl y the va lues of f ∈ [0 , 0 . 1] , i.e. , ten ti mes small er tha n in Fig. 3. perfect m atch be tween the ory and simulation in estimating the sampled degree distribution q k (Fig. 3, right) and its mean h q k i (Fig. 3, left). Indeed , all trav ersal techniq ues follow the same curve ( as p redicted in Section V -B5), which initially coincide s with that of R W ( see Section V -B 7) an d is mon otonically decreasing in f (see Section V -B8). W e also show that degree-weigh ted node sampling witho ut rep lacements exh ibits exactly the same bias (see Section V -B6). Fin ally , applying the e stimators b p k derived in Section VI p erfectly correc ts f or the b ias of q k . Of course, real-life networks are substantially different from RG ( p k ) . For example, depen ding o n the graph typ e, nodes may tend to connect to similar or different nodes. Indeed , in most social networks hig h-degree no des ten d to con- nect to other high- degree nodes [ 58]. Such n etworks are ca lled assortative . In contrast, biological and technological networks are typically disassortative , i.e. , they exhib it significantly mor e high-d egree-to-low-degree con nections. This ob servation can be q uantified by calculating the a ssorta tivity coefficient r [58], which is the correlation coefficient comp uted over all ed ges ( i.e. , degree- degree pairs) in th e graph. V alues r < 0 , r > 0 and r = 0 indicate disassortative, assortative and purely random graphs, respe cti vely . For the same initial param eters as in Fig. 3 ( p k , | V | ), we simulated different le vels of assortativity . Fig. 4 shows the results. Graph assortativity r strongly af fects the first iteration s of tra versal techniques. Indeed, for assortati vity r > 0 (Fig. 4, left), the d egree bias is even stronger than fo r r = 0 (Fig. 3, left). This is b ecause the h igh-degree no des are n ow interconn ected more densely than in a purely r andom g raph, and are thus easier to discover by sampling techniqu es that are in herently b iased towards high-d egree nodes. Inter estingly , Forest Fire is by far the mo st af fected. A possible explanation is th at und er Forest Fire, low-degree n odes are likely to b e completely skip ped by th e first sampling wa ve. Not surpr is- ingly , a negativ e assortativity r < 0 has th e opp osite effect: 9 ev ery high-degree node tends to connect to low-degree n odes, which sign ificantly slows down the discovery of the former . In contrast, random walks R W and MHR W are n ot af f ected by the changes in assortativity . Th is is expected, because their statio nary distributions ho ld fo r an y fixed (co nnected and aperiodic) g raph regardless of its topolo gical p roperties. B. Real-life fu lly kno wn top ologies Recall, tha t our analy sis is based o n the r andom graph model RG ( p k ) (see Section IV), which is only an app roxima- tion of a typical real-life network G . Indeed , RG ( p k ) fo llows the node degree distribution of G , but is likely to miss other importan t prop erties such as assortativity [58], whose effect on the BFS process we have ju st dem onstrated. For this reason, one may expe ct th at the techniqu e based on R G ( p k ) p erforms poorly o n real-life graphs. Surp risingly , this is no t the case. W e ev aluated o ur app roach on a broad ran ge of large, real- life, fully k nown Intern et to pologies. As our main source of data we use SN AP Grap h Library [59]; T able II ov erviews these datasets. W e p resent the results in Fig. 5. Inter est- ingly , in most cases the samp led av erage node degree h b q BFS k i closely m atches the pr ediction h q BFS k i o f the ran dom graph model RG ( p k ) . More impor tantly , applyin g our B FS estimator h b p BFS k i of r eal a verag e node degree co rrects for the bias of h b q BFS k i surprisingly well. So me significant dif f erences are visible on ly for f → 0 an d for some specific to pologies (the last tw o in Fig. 5), which is exactly because the real-life graphs are not fully cap tured by g raph m odel RG ( p k ) . Finally , we also stud y the R W estimato r Eq.(18), as a simpler alternati ve to the BFS one Eq.(24). Although they coincide for f → 0 , the R W estimato r system atically and significantly u nderestimates the av erage nod e degree h k i for larger values of f . C. Samp ling F aceboo k an d Orku t In th is section, we ap ply and test th e previous ideas in sampling real-lif e, large- scale, and n ot fully kn own online social n etworks: Facebook a nd Orku t. 1) F a cebook: W e hav e imp lemented a set of crawlers to collect the sam ples o f F acebook (FB) fo llowing the BFS, R W , MHR W techniques. The data sets are su mmarized in T ab le III. BFS 28 consists of 2 8 small BFS-es initiated at 28 different nodes, w hich allowed us to easily parallelize the pro cess. Moreover , at th e time of data co llection, we (n ai vely) th ought that this w o uld reduce the B FS bias. After gaining more insight (which, n ota b ene, m otiv ated this paper), we collected a single large BFS 1 . UNI rep resents the groun d truth. Th e details of our im plementation are de scribed in [2,3]. Results. W e present the F acebook sam pling results in Fig. 6(a- c) and in T ab le III. First, we observe that under BFS 28 , ou r estimato rs q BFS k and b p BFS k perfor m very well. For example, we obtain h b p BFS k i = 85 . 4 compared with the true value h k i = 9 4 . 1 . I n contrast, BFS 1 yields h b p BFS k i = 7 2 . 7 o nly . Most probab ly , this is because BFS 1 consists of a single BFS ru n that happ ens to begin in a relatively sparse part of Facebook. Face book UNI R W BFS 28 BFS 1 MHR W | S | 982K 2.26M 28 × 81K 1.19M 2.26M f 0.44% 1.03% 28 × 0.04% 0.54% 1.03% h b q k i 94.1 338.0 323.9 285.9 95.2 h q k i - 329.8 329.1 328.7 94.1 h b p k i - 93.9 85.4 72.7 95.2 Orkut | S | - - - 3.07M - f - - - 11.3% - h b p k i 30 2 33.1 T ABLE III F AC E B O O K A N D O R K U T D AT A S E T S A N D M E A S U R E M E N T S . Indeed , note that this run starts at b q BFS k = 50 for f = 0 , and systematically gr ows with f instead of falling. Finally , note that b oth BFS 28 and BFS 1 are very short compare d to the Faceboo k size, with f < 1% in bo th cases. For this reason, we observe almost n o d rop in the sampled av erage nod e degre h q BFS k i in Fig. 6(a, b). For the same reason, both the BFS a nd R W estimators y ield almost iden tical results. All the ab ove ob servations hold also f or the entir e degree distribution, wh ich is sh own in Fig. 6( c). 2) Orkut: Finally , we apply o ur methodo logy to a single BFS sample of Orkut collected in 2006 and described in [19]. It contains | S | = 3072 K nodes, which accou nts fo r f = 11 . 3% of entir e Orkut size. W e show the results in Fig. 6( d). Similarly to Facebook BFS 1 , the sampled average node degree h b q BFS k i does not decrease monoto nically in f . Again, the under lying reason might b e the arbitrary cho ice of th e starting nod e (in spar sely connected India in this case). Ne verth eless, the estimator h b p BFS k i approx imates the av erage nod e degre e 4 relativ ely well. V I I I . A R B I T R A RY - T O P O L O G Y B F S E S T I M ATO R S The RG ( p k ) -based BFS-bias corr ection pr ocedure is, by construction , u nbiased fo r ra ndom g raphs RG ( p k ) . Howe ver , when ap plied to arb itrary g raphs, in particu lar to real-lif e In- ternet top ologies, ou r RG ( p k ) -based estimator s are po tentially subject to some b ias ( i.e. , may be not perfect). Fortunate ly , we have seen in Section VI I-B th at this bias is usually very limited. Th is is because RG ( p k ) mimics an arbitr ary no de degree distribution p k , which is, by far , th e most c rucial parameter affecting the BFS degree bias. Interestingly , it is possible to derive estimato rs that are unb i- ased in an y arbitrary topology . Unfo rtunately , these arb itrary- topology estimators are ch aracterized by a very large variance, which makes them, in practice, less ef fective than the RG ( p k ) - based estimator s. 4 Unfortunat ely , according to our personal communicat ion with Orkut administra tors, there is no ground truth va lue of the Orkut’ s aver age node degre e h k i for October 2006, i.e. , the period when the BFS sample of [19] was collected . Ho wev er , many hints point to a number close to h k i = 30 , e . g. , [18] reports h k i = 30 . 2 in June-September 2006, and [64] repo rts h k i = 19 in late 2004 (which is in agreement with the densification law [51,60]). But, as these studi es m ay potential ly be subje ct to v arious biases, we cannot ta ke these numbers for granted. 10 Dataset # nodes # edges h k i = h p k i h k 2 i h k i Descripti on ca-CondMa t 21 363 91 341 8.6 22.5 C ollabora tion network of Arxi v Condensed Matter [60] email-EuAll 224 832 340 794 3.0 567.9 Emai l network of a la rge European Research Institut ion [60] Face book-Ne w-Orleans 63 392 816 885 25.8 88.1 F acebook Ne w Orleans network [33] wiki-T alk 2 388 953 4 656 681 3.9 2705.4 W ikipedia tal k (communic ation) netw ork [61] p2p-Gnutel la31 62 561 147 877 4.7 11.6 Gnutella pee r to peer network from August 31 2002 [60] soc-Epinions1 75 877 405 738 10.7 183.9 Who-trusts-whom net work of Epini ons.com [62] soc-Slashdot 0811 77 360 546 486 14.1 129.9 Slashdot social net work from Nov ember 2008 [63] as-caid a20071105 26 475 53 380 4.0 280.2 CAID A AS Relationshi ps Datasets, from Nove mber 2007 web-Google 855 802 4 291 351 10.0 170.4 W eb graph from Google [63 ] T ABLE II R E A L - L I F E I N T E R N E T T O P O L O G I E S U S E D I N S I M U L ATI O N S . A L L G R A P H S A R E CO N N E C T E D A N D U N D I R E C T E D ( W H I C H R E Q U I R E D P R E P RO C E S S I N G I N S O M E C A S E S ) . A vera ge node degree: h p k i - real h q BFS k i - expected by BFS h b q BFS k i - sampled by BFS h b p BFS k i - corrected b y BFS h b p RW k i - corrected b y R W fraction f fraction f fraction f fraction f A vera ge degree A vera ge degree h k i h k i h k i h k i h k i h k i h k i h k i h k i Fig. 5. BFS in real-l ife (fully known) I nter net topologies described in T able II. The blue circl es represent the av erage node degree h b q BFS k i sampled by BFS, as the function of the frac tion of cov ered nodes f . The thi n lines are the correct ed values h b p BFS k i result ing from the BFS estimator Eq.(24) (plai n line) and the R W estimator Eq.(18) (dashed). Results are av eraged ov er 1000 randomly seeded BFS samples. The thi ck lines are the anal ytica l expe ctati ons assuming the ran dom graph model RG ( p k ) . Thick red line (top) is the expectat ion of h q BFS k i , calculat ed with Eq.(12) gi ven the kno wledge of the true node degre e dist ribut ion p k . Thick gray line (bottom) is the e xpecta tion of corrected h b p BFS k i , Eq.(24), i.e . , precisely h k i . In this section we show examples of arbitrary -topolog y estimators and comp are the m with RG ( p k ) -based estimators in simu lations. A. Goal Let G = ( V , E ) be a connec ted undirected gr aph. A typical (incomp lete) gra ph traversal, such as BFS, is d etermined by the first n ode. So we can den ote by S ( v ) ⊂ V the set o f sampled nodes, gi ven that we started at node v ∈ V . O ur goal is to use S ( v ) to estimate th e total x tot = X v ∈ V x ( v ) , where x is a finite measurab le func tion defin ed on graph nodes. B. General arbitrary-topo logy estimator Let U ∈ V be a rand om variable representing the first node in o ur sample, fo llowing the proba bility distribution Pr[ U = w ] = p ( w ) > 0 . Let Q ( w ) ⊆ V be a set of no des uniquely defined by G and w . Define b x tot = X v ∈ Q ( U ) x ( v ) π ( v ) , (25) where π ( v ) = X w ∈ V : v ∈ Q ( w ) p ( w ) . (26) Lemma 1: b x tot is an unb iased estimato r of x tot . 11 k node degree Prob( k ) (a) (b) (c) (d) p k - real node degree distribution q BFS k - expected degree distribution b q BFS k - sampled degree distribution b p BFS k - cor rected degree distribution h p k i h q BFS k i h b q BFS k i h b p BFS k i Facebook, BFS 28 Facebook, BFS 1 Node degree distributions in Facebook, BFS 1 Orkut, BFS 1 fraction f fraction f fraction f A vera ge degree A vera ge degree h k i h k i h k i Fig. 6. BFS in on-line (not fully known) topologies. As in Fig. 5, e xcept that the plots are based on BFS samples taken in Facebook with 28 (random) seeds (a) and one seed (b), as well as in Orkut with one seed (d). Addi tionall y , we sho w in (c) the full node degree distribu tions for Facebook. Bec ause we do not ha ve the true deg ree di stribu tion p k of Orkut, we cannot calculate its analyti cal curve h q BFS k i . Ne verthe less, we show in (d) our best gue ss of Orkut’ s av erage node degree h k i lea rned by other m eans, as e xplained in Footnote 2. Pr oof: In or der to p rove Lemma 1, we have to show that E [ b x tot ] = P v ∈ V x ( v ) . Indeed : E [ b x tot ] = X w ∈ V p ( w ) X v ∈ Q ( w ) x ( v ) π ( v ) = = X v ∈ V X w ∈ V : v ∈ Q ( w ) x ( v ) π ( v ) p ( w ) = = X v ∈ V x ( v ) π ( v ) X w ∈ V : v ∈ Q ( w ) p ( w ) = = X v ∈ V x ( v ) π ( v ) π ( v ) = = X v ∈ V x ( v ) . (Note that the sums were swapped and appro priately upd ated after the first step.) C. Practical r eq uir emen ts W e have just shown that b x tot in Eq.(25) is an unb iased estimator o f x tot . T his is tru e for any choice o f Q ( w ) ⊆ V , regardless of our samp ling method. By defining Q ( w ) , we define the estimator . Howe ver, there are two requir ements th at we sho uld take into account. First, our estimator must be feasible , i.e. , we must be able to calcu late b x tot ( v ) f rom ou r samp le S ( U ) . This means that all nodes whose v alu es are needed t o calculate b x tot must be known (sampled). One obviou s necessary co ndition is that Q ( U ) ⊂ S ( U ) , beca use Q ( U ) is the set of no des whose values x ( v ) are used in the estimator b x tot in Eq.( 25). Howe ver, usually we have to know many n odes from beyon d Q ( U ) in order to ev aluate Eq.(26). W e giv e some examp les below . Second, the estimator b x tot should be character ized by a small variance . D. Arbitrary-topology estima to rs fo r BFS Let B i ( u ) be a ball of size k around vertex u ∈ V , i.e. , the set of all vertices within i hops fr om u . For simplicity , we d efine ou r sampling technique as a i -stage BFS, i.e. , S ( u ) = B i ( u ) . Depend ing on our ch oice of Q ( u ) , we may obtain various feasible arbitrary- topology estimators: 1) T rivial: The simplest choice of Q ( v ) is Q ( v ) = { v } . This estimator makes use of the first sampled nod e only , which naturally results in a huge variance. 2) Extr eme: W e can extend tri vial for one specific node v ∗ to obtain Q ( v ) = B i ( v ) if v = v ∗ { v } otherwise. 3) Half-radius: A m ore balan ced appro ach is Q ( v ) = B ⌊ i/ 2 ⌋ ( v ) . In other words, out of the c ollected i -stage BFS sample S ( v ) , we use fo r estimation on ly the n odes collected in th e first i / 2 stages o f our BFS. It is easy to verify that th e half-r adius estimator is feasible. 4) Half-radius extended: Finally , we c an extend the half- radius e stimator to potentially cover some more nod es, as follows. Q ( u ) = B ⌊ k/ 2 ⌋ ( u ) ∪ { v ∈ V : B i ( v ) ⊆ B i ( u ) } . E. Evalua tion W e hav e tried the above app roaches in simulation s to estimate the average node degree h k i = x tot / | V | . 5 As our err or metric, we used Root Mean Square Erro r (RMSE), whic h is approp riate in our case, as it cap tures both the estimator bias and its variance. RMSE is defined as: RM S E = p E [( b x tot / | V | − h k i ) 2 ] . In our simulation s, we calculated th e mea n E over 1 000 BFS samples initiated at nod es ch osen unif ormly at ran dom, i. e. , with p robability p ( v ) = 1 / | V | . In T able IV, we show the results for the half-r adius estimator with i = 2 . Other values of i and other estimators do not improve the results com pared to the RG ( p k ) -based estimato r . 5 For simplicity , we consi dered the total number of nodes | V | as kno wn. 12 Dataset h p k i correction metho d h b p k i RMSE ca-CondMa t 8.6 arbitra ry-topolo gy 8.5 10.3 RG ( p k ) -based 7.6 3.3 email-EuAll 3. 0 arbitra ry-topolo gy 3.1 17.3 RG ( p k ) -based 1.7 1.5 Face book-Ne w-Orleans 25.8 arbitra ry-topolo gy 25.6 33.5 RG ( p k ) -based 2 1.5 11.8 wiki-T alk 3.9 arbitra ry-topolo gy 3.8 27.9 RG ( p k ) -based 2.4 1.9 p2p-Gnutel la31 4.7 arbitra ry-topolo gy 4.8 4.6 RG ( p k ) -based 3.7 1.6 soc-Epinions1 10.7 arbitra ry-topolo gy 10.3 29.3 RG ( p k ) -based 9.7 6.6 soc-Slashdot 0811 14.1 arbitra ry-topolo gy 14.5 40.5 RG ( p k ) -based 1 7.3 6.8 as-caid a20071105 4.0 arbitra ry-topolo gy 3.9 4.7 RG ( p k ) -based 2.9 1.5 web-Google 10.0 arbitra ry-topolo gy 10.6 55.2 RG ( p k ) -based 6.1 5.1 T ABLE IV C O M PA R I S O N O F T H E A R B I T R A R Y - T O P O L O G Y E S T I M A T O R D E R I V E D I N T H I S S E C T I O N W I T H T H E RG ( p k ) - BA S E D E S T I M ATO R P R O P O S E D I N T H E PA P E R . W E US E D T H E R E A L - L I F E I N T E R N E T T O P O L O G I E S D E S C R I B E D I N T AB L E I I . H E R E , W E U S E T H E H A L F - R A D I U S A R B I T R A R Y - T O P O L O G Y E S T I M ATO R W I T H D E P T H i = 2 . T H E R E S U LT S A R E AVE R A G E D OV E R 1 0 0 0 S E E D N O D E S C H O S E N U N I F O R M LY AT R A N D O M F R O M T H E G R A P H . Although un biased, all the p roposed arbitr ary-topo logy esti- mators ha ve very large RMSE co mpared to the R G ( p k ) -based estimators. There are two m ain reasons for that. First, in order to g uarantee feasibility , we usua lly have | Q ( v ) | ≪ | S ( v ) | , which r esults in a “waste” of values x ( v ) of most of the sampled nodes. Secon d, the sizes | Q ( v ) | m ay significan tly differ for different nodes v , wh ich translates to differences in p articular estimates b x tot ( v ) . T o summa rize, the ar bitrary-to pology estimator is unbiased but has a hu ge variance, which makes it mu ch worse than the pote ntially slightly b iased ( for real-life top ologies) but much mor e co ncentrated RG ( p k ) -based estimator . I t is an instance of the well-known “accuracy v s p recision” trade-o ff. Indeed , in the statistics terminolog y , we could say that the arbitrary -topolog y estimator is “accu rate but very impr ecise”, whereas the R G ( p k ) -based estimator is “slightly inaccur ate but pr ecise”. I X . P R AC T I C A L R E C O M M E N DAT I O N S In order to sample no d e pr o p erties , we r ecommend using R W . R W is simple, u nbiased fo r arbitrar y topo logies ( assum- ing that we use cor rection p rocedur es summarized in Sec- tion VI -A1), and practica lly unaffected b y the starting point. R W is also typ ically more efficient than MHR W [2,3,10]. In contrast, R W and MHR W are no t useful when samp ling non-lo cal graph pr operties , su ch as the gra ph diameter or the av erage shortest path leng th. In this case, BFS seems very attractive, beca use it produces a full view of a particular region in the graph, which is usually a plau sible graph for which the non-lo cal pro perties ca n be easily calculated. Ho wever , all such results shou ld be inter preted very carefu lly , as they may be also stro ngly affected by the bias of BFS. For example, the graph diam eter drops sig nificantly with growing av erage node degree of a network. Whe nev er p ossible, it is a good practice to restrict BFS to so me well d efined commu nity in the samp led g raph. If the comm unity is small enough, we may be able to exhaust it ( at least its largest co nnected comp onent), which automa tically ma kes ou r BFS sample representative of this commu nity . For example, [20,33] collected full samples of se veral Faceboo k regiona l networks, and [63,65] co mpletely covered the WWW g raph restricted to on e or fe w domains. When such commun ities a re no t a vailable ( e.g. , region al networks are not accessible anym ore in Faceboo k), we are left with a regular un constrained BFS sample. In tha t case, we recommen d app lying the RG ( p k ) -based co rrection pro cedure presented in this paper to q uantify the no de degree bias, which may help us e valuate the bias introd uced in th e top ological metrics. X . C O N C L U S I O N T o the b est of our knowledge, this is the first work to quan- tify the node-d egree b ias of BFS. In par ticular , we calcu lated the n ode degree d istribution q k expected to be o bserved by BFS as a fu nction of the fraction f of c overed no des, in a random graph RG ( p k ) with a gi ven degree distrib ution p k . W e fou nd that for a small sample size, f → 0 , BFS h as the same bias as the classic Rand om W alk, and with in creasing f , the bias mono tonically de creases. Based on o ur theor etical analysis, we p roposed a p ractical RG ( p k ) -based proc edure to corr ect for this bias whe n cal- culating any node statistics. Our techniq ue p erforme d very well on a broad r ange of Interne t topolog ies. Its ready- to-use implementatio n can b e download ed from [ 24]. In this paper, we used our R G ( p k ) -based co rrection pro ce- dure to estimate local graph pr operties, such as n ode statistics. An interesting direction for f uture is to exploit the nod e degree-biases calculated here to develop estimator s of non - local grap h p roperties, such as graph diam eter . A C K N OW L E D G M E N T S W e would like to thank Bruno Ribeiro for useful discussions and the initial idea of the u nbiased estimator in Sectio n VIII; Alan Mislove for custom-p repared Orkut BFS sample; and Minas Gjoka for co llecting the Facebo ok BFS sam ple. R E F E R E N C E S [1] M. Kura nt, A. Mark opoulou, and P . Thiran , “On the bia s of BFS (Breadt h First Search), ” in ITC, also in , 2010. [2] M. Gjoka, M. Kurant, C. T . Butts, and A. Markopoulou, “W alking in Face book: A Case Study of Unbiased Sampling of OSNs, ” in INFOCOM , 2010. [3] ——, “Practica l Recommendat ions on Sampling OSN Users by Crawl- ing the Soci al Graph, ” Submitted to JSA C on Measureme nt of Internet T opologi es , 2011. [4] L. Lov ´ asz, “Random wal ks on graphs: A surv ey, ” Combin atorics, P aul Erdos is Eighty , vol. 2, no. 1, pp. 1–46, 1993. [5] B. Ribe iro and D. T owsle y , “Estimat ing and sampling gra phs with multidime nsional random walks, ” in IMC , vol. 011, 2010. [6] K. A vrachenk ov , B. Ribeiro, and D. T owsle y , “Improvi ng Random W alk Estimation Accurac y with Uniform Restarts, ” in I7th W orkshop on A lgorith ms and Models for the W eb Graph , 2010. [7] M. R. Henzinger , A. Heydon, M. Mitzenmacher , and M. Najork, “On near -uniform U RL sampling, ” in WWW , 2000. 13 [8] D. Stutzbach, R. Rejaie, N. Duf field, S. Sen, and W . W illinger , “On unbiased sampling for unstructured pee r-to-peer netw orks, ” in IMC , 2006. [9] C. Gkantsidis, M. Mihail, and A. Sab eri, “Random walks in peer-to-pe er netw orks, ” in INFOCOM , 2004. [10] A. Rasti, M. T orkjazi, R. Rejaie , N. Duffield, W . Willi nger , and D. Stutzba ch, “Respondent-d ri ven sampling for chara cteriz ing unstruc- tured overla ys, ” in Infocom Mini-confer ence , 2009, pp. 2701–2705 . [11] B. Krishnamurthy , P . Gill, and M. Arlitt, “A fe w chirps about T witter, ” in WOSN , 2008. [12] J. Lesko vec and C. Fa loutsos, “Samplin g from large gra phs, ” in KDD , 2006, pp. 631–636 . [13] S. L. Feld, “Why Y our Friends Have More Friends Than Y ou Do, ” American Journal of Socio logy , vol. 96, no. 6, p. 1464, May 1991. [14] M. Ne wman, “Ego-cent ered networks and the ripple effe ct, ” Social Network s , vol. 25, pp. 83–95, 2003. [15] M. Salganik and D. D. Hecka thorn, “Sa mpling and estimation in hidden populat ions using respondent -dri ven sampling, ” Sociolo gical Met hodol- ogy , vol. 34, no. 1, pp. 193–240, 2004. [16] E. V olz and D. D. Hec kathorn, “Probabili ty based estimation theory for respondent driv en sampling, ” Journal of Offici al Statisti cs , vol. 24, no. 1, pp. 79–97, 2008. [17] M. Najork and J. L. Wie ner , “B readth-first search cra wling yie lds high- qualit y pages, ” in WWW , 2001. [18] Y . Ahn, S. Han, H. Kwak, S. Moon, and H. Jeong, “ Analysis of topologi cal charact eristic s of huge online social netwo rking service s, ” in WWW , 2007, pp. 835– 844. [19] A. Mislov e, M. Marcon, K. P . Gummadi, P . Drusche l, and B. Bhattac har- jee, “Measurement and analysis of online social networks, ” in IMC , 2007, pp. 29–42. [20] C. Wil son, B. Boe, A . Sala, K. P . N . Puttaswamy , and B. Y . Zhao, “User intera ctions in socia l networks and their implicati ons, ” in Eur oSys , 2009. [21] S. H. Lee, P .-J. Kim, and H. Jeong, “Stati stical propertie s of Sampled Networ ks, ” Phys. Rev . E , vol. 73, p. 16102, 2006. [22] L. Becchetti , C. Castillo, D. Donato, and A. Fazzone, “A comparison of sampling technique s for web graph characteri zatio n, ” in LinkKDD , 2006. [23] S. Y e, J. Lang, and F . Wu, “Crawli ng online social graphs, ” in Asia- P acific W eb Confer ence (APWEB) , 2010, pp. 236–242. [24] M. Kurant , “Python scripts for BFS sampling and bias correc tion: http:/ /mkurant.com/ maciej/publications/papers/tra versals.zip . ” [25] D. Stutzbac h, R. Rejaie, N. Duffie ld, S. Sen, and W . W illinger , “Sam- pling techniques for large , dynamic graphs, ” in INFOCOM , 2006, pp. 1–6. [26] A. H. Rasti, M. T orkjazi, R. Rejaie , and D. Stutzbach, “Eval uating Sampling T echniques for Large Dynamic Graphs, ” in T echnica l Report , vol. 1, no. Septembe r , 2008. [27] A. Mislove, H. S. Koppula , K. P . Gumm adi, P . Drusche l, and B. Bhat - tacha rjee, “Gro wth of the Flickr social network, ” in WOSN , 2008. [28] M. Latapy , C. Magnien, and F . Ou ´ edraogo, “A Radar for the Internet, ” in Internati onal W orkshop on Analysis of Dynamic Networks , Dec. 2008, pp. 901–908. [29] W . W illing er , R. Rejaie , M. T orkjazi , M. V alaf ar, and M. Maggioni, “OSN Research : Ti me to Face the Real Challenges, ” in HotMetrics , 2009. [30] C. Magnien, F . Ou ´ edraogo, G. V ala don, and M. Lat apy , “Fa st Dynamic s in Interne t T opology: Observ ations and First Explana tions, ” in ICIMP , 2009, pp. 137–142 . [31] M. V alaf ar, R. Rej aie, and W . W illinger , “Beyon d friendship graphs: a study of user interact ions in Fli ckr, ” in W OSN , 2009, pp. 25–30. [32] F . Schne ider , A. Feldmann, B. Krishnamurthy , and W . W illing er , “Un- derstandi ng online social network usage from a netwo rk perspec ti ve, ” in IMC , 2009, pp. 35–48 . [33] B. V iswanath, A. Mislove , M. Cha, and K. Gumm adi, “On the e voluti on of user intera ction in faceboo k, ” in WOSN , vol. 09, 2009, pp. 37–4 2. [34] L. A. Goodman, “Sno wball sampling, ” A nnals of Mathematical Statis- tics , vol. 32, pp. 148–170, 1961. [35] D. D. Heckathorn, “R espondent -Dri ven Sampling: A Ne w Approa ch to the Study of Hidden Populations, ” Social Proble ms , vol. 44, pp. 174– 199, 1997. [36] J. H. Kim, “Poisson cloning model for random graphs, ” in International Congr ess of Mathematicia ns (ICM) , 2006. [37] D. Achl ioptas, A. Clauset, D. Kempe, an d C, “On the bi as of tracerout e sampling: or, powe r-la w degree distr ibut ions in regular graphs, ” J ournal of the A CM , 2009. [38] K. Gile and M. Handcock, “Responde nt-driv en sampling: An assessment of current methodolog y, ” T o appear in Soci ologi cal Methodolo gy , 2011. [39] K. Gile, “Improved Inference for Respondent -Dri ven Sampling Data with Applicati on to HIV Prev alence Es timati on, ” , 2010. [40] J. Illenbe rger , G. Fl ¨ otter ¨ od, and N. Kai, “An approach to correct bias induced by s no wball sampling , ” in Sunbelt Soc ial Networks Conf er ence , 2009. [41] F . Y ates and P . Grundy , “Selectio n without replaceme nt from within strata with probabil ity proportional to size, ” Journal of the Royal Statist ical Societ y . Series B (Methodolo gical) , vol. 15, no. 2, pp. 253– 261, 1953. [42] D. Raj, “Some est imators in sampling with varyi ng proba biliti es without replac ement, ” J ournal of the American Statistical Ass ociation , pp. 269– 284, 1956. [43] M. Murthy , “Ordered and unordered estimator s in sampling without replac ement, ” Sankhy ` a: The Indian J ournal of Stati stics , v ol. 18, no. 3, pp. 379–390, 1957. [44] H. Hartley and J. Rao, “Sampling with unequal probabilit ies an d without replac ement, ” The Annals of Mathe matical Stati stics , 1962. [45] G. Andreatta and G. Kaufman, “Estimati on of finite populat ion proper - ties when sampli ng is without replac ement and proportional to magni- tude, ” Journal of th e American Statist ical Associat ion , vol. 81, no. 395, pp. 657–666, 1986. [46] T . J. Rao, S. Seng upta, and B. K. Sinha, “Some Order Rel ations Between Select ion and Inclusion Probabili ties for PP SWOR Sampling Sche me, ” Metrika , vol. 38, no. 1, pp. 335–343, Dec. 1991. [47] S. Kocha r and R. Korwar , “On random s ampling without replacemen t from a finite populat ion, ” A nnals of the Institute of Statistica l Mathe- matics , vol. 53, no. 3, pp. 631–646 , 2001. [48] L. Fat torini, “ Applying the Horvitz-Thompson criterion in complex designs: A computer -intensi ve perspect i ve for estimatin g incl usion prob- abili ties, ” Biometrika , vol. 93, no. 2, pp. 269–278, Jun. 2006. [49] M. Gjoka, C. T . Butts, M. Kurant, and A. Markopoulo u, “Multigra ph Sampling of Online Social Netw orks, ” Submitt ed to JSAC on Measur e- ment of Inte rnet T opolog ies , 2011. [50] W . R. Gil ks, S. Ric hardson, and D. J. Spiege lhalte r, Markov Chain Monte Carlo in Prac tice . Chapman and Hall /CRC, 1996. [51] J. Lesko vec, J. Kle inber g, and C. Fa loutsos, “Graphs ov er ti me: densi- fication la ws , shrinkin g diameters and possible explan ations, ” in KDD , 2005. [52] M. Molloy and B. Reed, “A critic al point for random graphs with a gi ven de gree sequenc e, ” Random struc tur es and algorithms , v ol. 6, no. 2-3, pp. 161–180, 1995. [53] R. Motwani and P . Ragha van, Randomized Algorithms . Cambridge Uni versity Press, 1990. [54] F . V iger and M. Latapy , “Efficie nt and simple generati on of random simple connecte d graphs with prescrib ed deg ree sequence, ” LNCS Com- puting and Combina torics , vol . 3595, pp. 440–449, 2005. [55] M. Hansen and W . Hurwitz, “On the Theory of Sampling from Finite Populati ons, ” A nnals of Mat hematic al Statistics , v ol. 14, no. 3, 194 3. [56] D. Horvitz and D. Thompson, “A generaliz ation of s ampling without replac ement from a finite univ erse, ” J ournal of the American Statistical Association , vol. 47, no. 260, pp. 663–685 , 1952. [57] S. Maslov and K. Sneppen, “Specificity and stabilit y in topology of protein networks, ” Science , vol. 296, no. 5569, p. 910, 2002. [58] M. Newman, “Assortati ve m ixing in network s, ” Physical Revie w Letters , vol. 89, no. 20, p. 208701, 2002. [59] “SN AP Graph Library . ” [Onlin e]. A vail able: http:/ /snap.stanfor d.edu/data/ [60] J. L esko vec, J. Kleinberg, and C. Falou tsos, “Graph e volu tion: Den- sificati on and shrinking diamete rs, ” ACM T ransact ions on Knowled ge Discov ery fr om Data (TKDD) , vol. 1, no. 1, p. 2, Mar . 2007. [61] J. Leskove c, D. Huttenloche r , and J. Klei nberg , “Predicti ng positiv e and nega ti ve links in online social networ ks, ” in WWW , New Y ork, Ne w Y ork, USA, 2010, p. 641. [62] M. Ric hardson, R. Agra wal, and P . Domingos, “Tru st manage ment for the semantic web, ” The SemanticW eb -ISWC 2003 , pp. 351–368, 2003. [63] J. Leskov ec, K. Lang, A. Dasgupta, and M. Mahoney , “Community structure in large networks: Natural cluster sizes and the absence of 14 larg e wel l-defined clust ers, ” Internet Mathe matics , vo l. 6, no. 1, pp. 29– 123, 2009. [64] Z. Anwar , W . Y urcik, V . Pan dey , A. Shankar , I. Gupta, and R. Camp- bell, “Lev eraging Social- Network Infrastructu re to Improve Peer-to- Peer Overl ay Performance : Results from Orkut, ” Arxiv pre print cs/ 0509095 , 2005. [65] R. Albert, H. Jeong , and A. Bara b ´ asi, “Diameter of the w orld-wide web, ” Natur e , vol. 401, no. 6749, pp. 130–131, 1999.
Original Paper
Loading high-quality paper...
Comments & Academic Discussion
Loading comments...
Leave a Comment