Feature selection in omics prediction problems using cat scores and false nondiscovery rate control
We revisit the problem of feature selection in linear discriminant analysis (LDA), that is, when features are correlated. First, we introduce a pooled centroids formulation of the multiclass LDA predictor function, in which the relative weights of Ma…
Authors: ** *V. Zuber*, *K. Strimmer* **
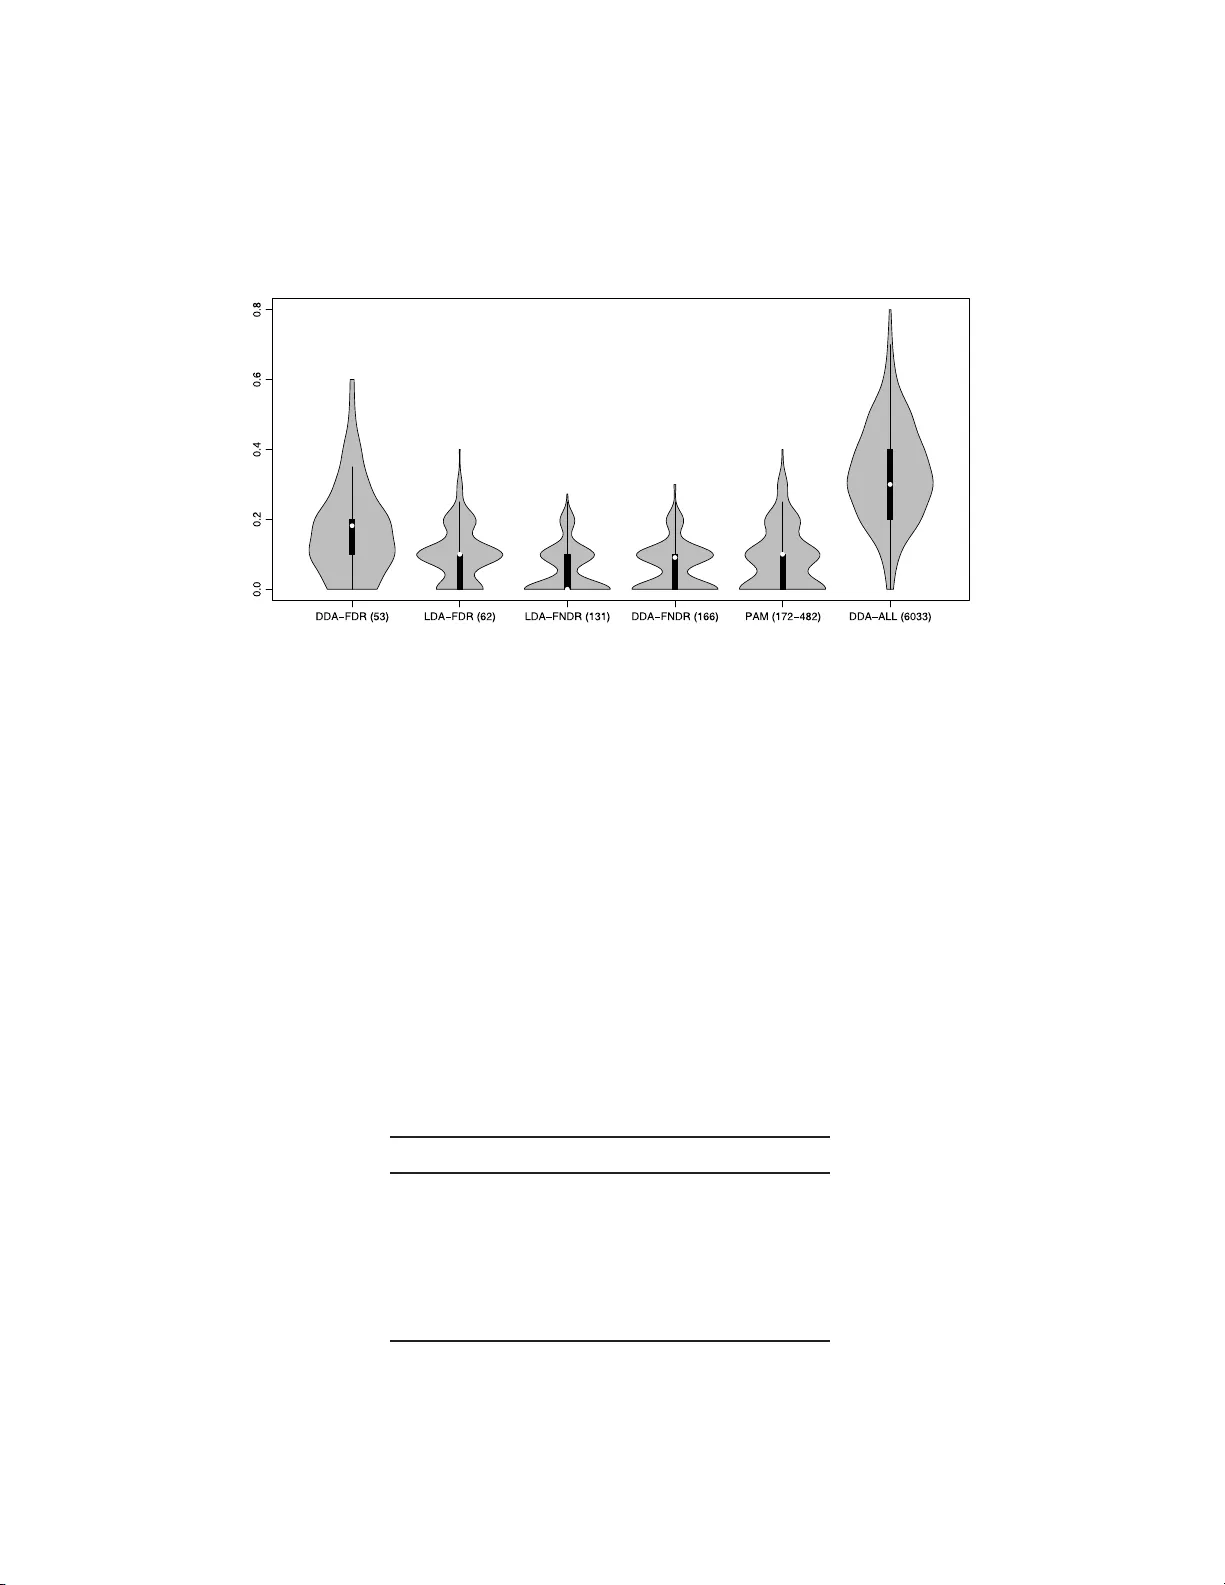
The Annals of Applie d Statistics 2010, V ol. 4, No. 1, 503–519 DOI: 10.1214 /09-A OAS277 c Institute of Mathematical Statistics , 2 010 FEA TURE SELEC TION I N OMICS PREDICTION PROBLEMS USING CA T SCORES AND F ALSE NONDISCO V ER Y RA TE CONTR OL By Miika Ahdesm ¨ aki and K orbinian S trimmer University of L eipzig, T amp er e Univ ersity of T e chnolo gy and U niversity of L eipzig W e rev isit the problem of feature selection in linear discriminan t analysis (LDA), that is, when features are correlated. First, we in tro- duce a p o oled centroids formulation of the multiclass LDA predictor function, in whic h the relative w eights of Mahalanobis-transformed predictors are giv en by correlation-adjusted t -scores (cat scores). S ec- ond, for feature selection we prop ose th resholding cat scores by con- trolling false nondiscov ery rates (FNDR). Third, t raining of the clas- sifier is based on James–Stein shrinka ge estimates of correlations and v ariances, where regularization parameters are chosen analytically without resampling. Ov erall, this results in an effective and com- putationally inexp ensive framew ork for h igh-dimensional prediction with natural feature selection. The proposed shrink age discriminant proced ures are implemented in the R pack age “sda” av ailable from the R repository CRAN . 1. In tro d uction. Class p rediction of biologic al samples based on their genetic or proteomic profile is no w a routine task in genomic studies. Ac- cordingly , many classification metho ds ha ve b een d ev elop ed to ad d ress the sp ecific statistica l c hallenges p resen ted by t hese data—see, for exa mple, Sc hw ender, Ic kstadt and Rahnenf ¨ uhrer ( 200 8 ) and Sla wski, Daumer and Boulesteix ( 2008 ) for recen t reviews. In particular, th e small sample size n renders difficult the training of the classifier, and the large n umb er of v ariables p mak es it h ard to select s u itable features for pr ediction. P erh aps su r prisingly , despite the many recen t in no v ations in the field of classification metho dology , includ ing the in tro duction of sophisticated algo- rithms for supp ort v ector mac hin es and the prop osal of ensemble metho ds Received March 2009; revised July 2009. Key wor ds and phr ases. F eature selection, linear discriminant analysis, correlation, James–Stein estimator, “small n , large p ” setting, correlatio n-adjusted t -score, false dis- co very rates, higher criticism. This is a n e le c tronic reprint of the orig inal a rticle published by the Institute of Ma thematical Statistics in The A nnals of Applie d Statistics , 2010, V ol. 4, No . 1, 503 –519 . This reprint differs fr om the or iginal in pagina tio n and typogra phic detail. 1 2 M. A HDESM ¨ AKI A ND K. STRIMMER suc h as r andom forests, the conceptually simp le ap p roac h of linear discrimi- nan t analysis (LD A) and its s ib ling, diagonal discriminant analysis (DD A), remain among the most effectiv e pr o cedures also in the domain of high- dimensional pr ediction [Efron ( 2008a ); Hand ( 2006 ); Efron ( 1975 )]. In order to b e applicable for h igh-dimensional analysis, it has b een rec- ognized early that regularization is essentia l [F riedman ( 1989 )]. S p ecifically , when training the classifier, that is, when estimating th e parameters of th e discriminant f unction fr om training data, particular care n eeds to b e tak en to accurately infer the (in verse) co v ariance matrix. A rather radical, y et highly effectiv e w a y to r egularize co v ariance estimation in h igh dimen s ions is to set all correlations equal to zero [Bic k el and L evina ( 2004 )]. Employi ng a diagonal co v ariance matrix redu ces L DA to the sp ecial case of diagonal dis- criminan t analysis (DD A), also kno w n in the m achine learning communit y as “naiv e Ba y es” classification. In add ition to facilitating high-dimensional estimation of the prediction function, DD A has one fur ther key adv anta ge: it is straightfo rw ard to con- duct feature selection. In th e DDA setting with tw o classes ( K = 2), it can b e sh o wn that the optimal criterion for ordering features relev ant for pre- diction are the t -scores b et we en the t wo group means [e.g. , F an and F an ( 2008 )], or in the multicl ass setting, the t -scores b etw een group means and the o v erall centroid. The nearest s h runken cen troids (NSC) algorithm [ Tibshirani et al. ( 2002 , 2003 )], commonly kno wn by the name of “P AM” after its s oft wa re imple- men tation, is a regularized v ersion of DD A with multiclass feature selection. The fact that P AM h as established itself as one of the most p opu lar m eth- o ds for classification of gene exp ression data is ample pro of that DD A-type pro cedur es are indeed ve r y effectiv e for large-scale pr ediction problems—s ee also Bic kel and Levina ( 2004 ) and E f ron ( 2008 a ). Ho we v er, there are now man y omics data sets w here correlatio n among predictors is an essen tial feature of th e data and hence cannot easily b e ignored. F or example, this includes pr oteomics, imaging, and metab olomics data wher e correlation among b iomark ers is commonplace and indu ced by spatial d ep enden cies and by chemica l similarities, resp ectiv ely . F urthermore, in many transcriptome measurements there are correlations among genes within a fu nctional group or p ath wa y [Ack ermann and Strimmer ( 2009 )]. Consequent ly , there ha v e b een seve ral suggestions to generalize P AM to accoun t for correlation. This includes th e SCRD A [Guo, Hastie and Tib- shirani ( 2007 )], Clanc [Dabney and S torey ( 2007 )] and MLD A [Xu, Bro ck and P arrish ( 2009 )] app roac hes. All these metho ds are regularized ve rsions of LD A, and h ence offer automatic provisio ns for gene-wise correlations. Ho we v er, in con trast to P AM and DDA, th ey lac k an efficient and elegan t feature selection sc h eme, due to p r oblems with multiple optima in the c h oice LDA FEA TURE SELECTION 3 of regularization p arameters (SC RD A) and the large searc h sp ace for opti- mal feature su bsets (Clanc). In this pap er w e p resen t a framewo r k for efficient high-dimensional LD A analysis. Th is is based on th ree cornerstones. First, we emplo y James–Stein shrink age rules for training the classifier. All regularization p arameters are estimated from th e data in an analytic fashion without resorting to computa- tionally exp ensiv e resampling. S econd, we u se correlation-adjusted t -scores (cat scores) for f eature selection. These scores emerge fr om a r estructured v ersion of the L D A equations and enable simple and effectiv e ranking of genes even in the p resence of correlation. Third , we emplo y false nond iscov- ery rate thresholding for selecting features for inclusion in the pr ed iction rule. As we w ill sho w b elo w, this is a h ighly effectiv e metho d with similar p erformance to th e recen tly prop osed “higher criticism” appr oac h. The remainder of th e p ap er is organized as follo ws. In Sections 2 – 5 we detail our framew ork for shrink age discrimin an t analysis and v ariable s e- lection. S ubsequently , we demonstrate th e effectiv eness of our approac h by application to a n u m b er of high-dimensional genomic d ata sets. W e conclude with a discu s sion and comparison to closely related approac hes. 2. Linear discriminant analysis revisited. 2.1. Standar d formulation. LD A starts b y assum in g a mixtu re m o del f or the p -dimensional data x , f ( x ) = K X j =1 π j f ( x | j ) , where eac h of the K classes is represented by a multiv ariate normal d ensit y f ( x | k ) = (2 π ) − p/ 2 | Σ | − 1 / 2 exp {− 1 2 ( x − µ k ) T Σ − 1 ( x − µ k ) } with group-sp ecific centroids µ k and a common co v ariance matrix Σ . The probabilit y of group k give n x is computed from the a priori mixin g weigh ts π j b y application of Ba y es’ th eorem, Pr( k | x ) = π k f ( x | k ) f ( x ) . W e d efine here the LDA discriminant score as the log p osterior d k ( x ) = log { Pr ( k | x ) } , wh ic h after dropp ing terms constan t across group s b ecomes d LDA k ( x ) = µ T k Σ − 1 x − 1 2 µ T k Σ − 1 µ k + log ( π k ) . (2.1) Due to th e common co v ariance, d LDA k ( x ) is linear in x . Prediction in LD A w orks by ev aluating the discrimin an t fu nction at the giv en test sample x for all p ossible k , c ho osing the class maximizing the p osterior pr obabilit y (and hence d LDA k ). 4 M. A HDESM ¨ AKI A ND K. STRIMMER 2.2. Po ole d c entr oid formulation. W e no w rewrite the stand ard form of the LD A p redictor function ( 2.1 ) with the aim to elucidate the influ ence of eac h individual v ariable in p rediction. Sp ecifically , w e simp ly add a class- indep end en t constan t to the discriminan t fu nction—note that this do es not c hange in any w ay the prediction. W e compu te the p o oled m ean µ po ol = K X j =1 n j n µ j , represent ing the o veral l cen troid ( n j is the sample size in group j and n = P K j =1 n j the total num b er of observ ations) and the corresp onding dis- criminan t score d LDA po ol ( x ) = µ T po ol Σ − 1 x − 1 2 µ T po ol Σ − 1 µ po ol . The cen tered score ∆ LDA k ( x ) = d LDA k ( x ) − d LDA po ol ( x ) can b e in terpreted as a log p osterior r atio and is, in terms of prediction, completely equiv alen t to the original d LDA k ( x ). After some careful algebra, it simplifies to ∆ LDA k ( x ) = ω T k δ k ( x ) + log( π k ) (2.2) with feature weigh t vecto r ω k = P − 1 / 2 V − 1 / 2 ( µ k − µ po ol ) (2.3) and Mahalanobis-transformed predictors δ k ( x ) = P − 1 / 2 V − 1 / 2 x − µ k + µ po ol 2 . (2.4) Here, we ha v e made use of the v ariance-correlation decomp osition of the co v ariance matrix Σ = V 1 / 2 PV 1 / 2 , where V = diag { σ 2 1 , . . . , σ 2 p } is a diagonal matrix con taining the v ariances and P = ( ρ ij ) is the correlation m atrix. A r emark able prop ert y of the ab o ve restructurin g ( 2.2 )–( 2.4 ) of the LD A discriminant fun ction ( 2.1 ) is that b oth ω k and δ k ( x ) are ve ctors and n ot matrices. F u r thermore, n ote that ω k is n ot a function of the test data x and that its comp onents con trol ho w muc h eac h individual v ariable contributes to the score ∆ LDA k of group k . 2.3. James–Stein shrinkage rules for le arning the LDA pr e dictor. In or- der to train the LD A discriminan t function [( 2.1 ) or ( 2.2 )], we estimate group cen troids µ k b y their empir ical means, and otherwise rely on three d ifferen t James–Stein-t yp e shr ink age r ules. Sp ecifically , we emplo y the follo wing: LDA FEA TURE SELECTION 5 1. for the correlations P the ridge-t yp e estimator from S ch¨ afer and Str im m er ( 2005 ), 2. for the v ariances V the sh r ink age estimator from Opgen-Rhein and S trim- mer ( 2007 ), and 3. for the prop ortions π k the frequ en cy estimator from Hausser and Strim- mer ( 2009 ). All three J ames–Stein-t yp e estimators are constructed by shrin k in g tow ard suitable targets and analytically minimizing the mean squared error. The precise form u las are giv en in App end ix A . F or the statistical bac kground w e refer to the ab o ve menti oned references. W e remark that the adv antag es of u sing James–Stein rules for data anal- ysis ha ve r ecen tly b ecome (again) more appreciated in the literature, esp e- cially in the “small n , large p ” setting, where James–Stein-t yp e estimators are v ery efficien t b oth in a statistical as w ell as in a computational sense. In training of the LDA p redictor function by James–Stein sh rink age, w e fol- lo w Dabney and Storey ( 2007 ) and Xu, Bro c k and P arrish ( 2009 ), w ho giv e a comprehen siv e comparison with comp eting approac hes such as supp ort v ector mac hines. Sla wsk i, Daumer and Boulesteix ( 2008 ) also implement a shrink age ve rsion of LDA. 3. F eature selection. 3.1. A natur al variable sele ction sc or e for LD A . F ollo wing Zu b er and Strimmer ( 2009 ), we define the vec tor τ adj k of correlation-adjusted t -scores (cat scores) to b e a scaled v ersion of th e f eature we igh t ve ctor ω k : τ adj k ≡ 1 n k − 1 n − 1 / 2 ω k = P − 1 / 2 × 1 n k − 1 n V − 1 / 2 ( µ k − µ po ol ) (3.1) = P − 1 / 2 τ k . The vecto r τ k con tains the gene-wise gene-sp ecific t -scores b et wee n the m ean of group k and th e p o oled mean. Thus, the correlation-adjusted t -scores ( τ adj k ) are decorrelated t -scores ( τ k ). If th ere is no correlation, τ adj k reduces to τ k . Th e factor ( 1 n k − 1 n ) − 1 / 2 in equation ( 3.1 ) standardizes the error of ˆ µ k − ˆ µ po ol , and is the same as in P AM [Tibshir ani et al. ( 2003 )]. Note the min us sign, w h ic h is due to correlation p n k /n b et we en ˆ µ k and ˆ µ po ol . 1 1 The plus sign in the original P AM p ap er [Tibshirani et al. ( 2002 ), page 6567] is a typographic error. 6 M. A HDESM ¨ AKI A ND K. STRIMMER In DD A appr oac hes, such as P AM, regularized estimates of the t -scores τ k are emplo y ed for feature selection. F r om equ ations ( 2.2 )–( 2.4 ) it follo w s directly th at the cat scores τ adj k pro v id e th e most natural generalization in the LD A setting (see also Remark A ). As a su mmary score to measure th e total im p act of feature i ∈ { 1 , . . . , p } , w e use S i = K X j =1 ( τ adj i,j ) 2 , (3.2) that is, the squared i th comp onen t of the cat score v ector τ adj k = ( τ adj 1 ,k , . . . , τ adj p,k ) T summed across the K groups. F or comparison, P AM u s es the criterion S ′ i = max j =1 ,...,K ( | τ i,j | ) . (3.3) Using the squ ared sum of the group-sp ecific cat scores in S i rather than taking the maxim u m o ver th e absolute v alues as in S ′ i has t wo d istinct ad- v an tages. First, the sample distribu tion of the estimated S i is more tractable, b eing appro ximately χ 2 . S econd, if a feature is discriminativ e with regard to more than one group, this ad d itional information is n ot disregarded. 3.2. F e atur e sele ction by c ontr ol ling the false nondisc overy r ate. When constructing an efficient classifier, it is d esirable to eliminate features that pro v id e no useful information for d iscriminating among classes. The con- v entio nal but computationally tedious approac h is to c ho ose the optimal threshold by estimating the pr ediction error via cross-v alidation along a grid of p ossible thr esh old v alues. F aster alternativ e thresh oldin g pro cedures include “higher criticism” [Donoho and Jin ( 2008 )], “F AIR” [F an and F an ( 2008 )] and “Ebay” [Ef r on ( 2008b )]. The latter t wo metho d s are pr im arily dev elop ed with the correlation-free setting and t -scores in mind (ho wev er, “Eba y” also offers correlation corrections for prediction errors). Here, w e advocate using the false disco ve ry rate (FDR) framew ork to select features for classification. W e emphasize, ho wev er, that in the problem of constru cting classifiers the FDR approac h can not b e applied in the same fashion as in differentia l expression. In the latter case, the aim is to compile a set of genes one has confid ence in to b e differen tially expressed. This is con trolled by th e FDR criterion. In con trast, when fu rnishin g classifiers, one aims at identifying with confidence the set of null features that are not informativ e with regard to group separation, in order to eliminate th em from the classifier. This is con trolled b y the false non disco very rate, FNDR. F or a discussion of the relation b et ween FDR and FNDR see, for example, Strimmer ( 2008 ). This sub tle b ut imp ortan t d istinction is b est illustrated b y referring to Figure 1 , whic h p lots the lo cal FDR fdr( S i ) = Prob(“n ull” | S i ) computed for LDA FEA TURE SELECTION 7 Fig. 1. L o c al false disc overy r ates as a function of the summary sc or e S i . Ther e ar e thr e e distinct ar e as: an ac c eptanc e and a r eje ction zone, which ar e sep ar ate d by a “buffer zone” in the m idd l e. Note that the fe atur es to b e include d i n the classifier by FNDR c ontr ol of the nul l genes form a sup erset of the di ffer ential ly expr esse d genes c ontr ol le d by FDR. (and from) the statistic S i of feature i . In a list of differen tially expr essed genes we decide to include, sa y , genes i with fdr( S i ) < 0 . 2. A similar con- strain t on the lo cal false nondisco very rate, fnd r( S i ) < 0 . 2, give s a confidence set of the null genes. Th e lo cal false disco ve ry and lo cal false nond isco ve ry rates add up to one, f n dr( S i ) = 1 − fdr( S i ). Hence, the s et of features to b e retained in the classifier ha v e lo cal f alse disco very r ates smaller than 0.8— instead of 0.2. Thus, the features in clud ed in the pr ed ictor form a su p erset of th e d ifferen tially expr essed v ariables. A similar argumen t applies when using distribu tion-based Fdr ( q -v alues) and Fndr v alues. In sh ort, our pr op osal is to id en tify the null features b y con trolling (lo- cal) FNDR, and subsequentl y using all features except the iden tified n ull set in prediction. F or estimating FDR quantiti es, w e use the semiparametric approac h outlined in Strimmer ( 2008 ). Note that this and other FDR pro- cedures assum e that there are enough n ull features so th at the null mo del can b e prop erly estimated [Efr on ( 2004 )]. 4. Sp ecial cases. T able 1 The gener al fe atur e sele ction sc or e S i and sp e cial c ases ther e of S i = K arbitrary K = 2 Correlation p resen t: P K j =1 ( τ adj i,j ) 2 2( τ adj i ) 2 No correlation ( P = I ): P K j =1 τ 2 i,j 2 τ 2 i 8 M. A HDESM ¨ AKI A ND K. STRIMMER 4.1. Two gr oups. F or K = 2 the cat score τ adj k b et w een the group cen- troid and the p o oled mean reduces to the cat score b et ween the tw o means: τ adj 1 = P − 1 / 2 × 1 n 1 − 1 n 1 + n 2 V − 1 / 2 µ 1 − n 1 n µ 1 + n 2 n µ 2 = P − 1 / 2 × 1 n 1 + 1 n 2 V − 1 / 2 ( µ 1 − µ 2 ) . Note that τ adj 1 = − τ adj 2 . Th e feature selectio n score S i reduces to the squ ared cat score b et we en the t w o means; cf. T able 1 . Lik ewise, for K = 2 the differ- ence ∆ LDA 1 ( x ) − ∆ LDA 2 ( x ) r educes to ω T δ ( x ) + log( π 1 π 2 ) with ω = P − 1 / 2 V − 1 / 2 ( µ 1 − µ 2 ) and δ ( x ) = P − 1 / 2 V − 1 / 2 ( x − µ 1 + µ 2 2 ). F or extensiv e discussion of the tw o group case, including comparison of gene rankings with man y other test statistics, we refer to Zu b er and Strim - mer ( 2009 ). 4.2. V anishing c orr elation. In case of n o correlation ( P = I ), the cat scores reduce (by construction) to standard t -scores b et w een the t wo cen- troids of interest, either b et we en the group and the p o oled mean (general K ) or b et ween the t wo groups ( K = 2). Th e gene summary S i reduces to the sum of the resp ectiv e squared t -scores (T able 1 ). Th e discriminant func- tion reduces to the standard form of diagonal d iscriminan t analysis. The p o oled cen troids formula tion of LD A red u ces to that of P AM (except for the shr ink age of the means p resen t in P AM but not in our approac h ). 5. Remarks. Remark A (Definition of feature w eights). The definition of feature w eights acco rding to equation ( 2.3 ) is most natural. O th er w a ys of splitting up the pr o duct ω T k δ k ( x ) lead to v arious inconsistencies. F or example, instead of using ω k = Σ − 1 / 2 ( µ k − µ po ol ), it has b een suggested to consider Σ − 1 ( µ k − µ po ol ), for example, in Witten and T ibshirani ( 2009 ), page 627. How ev er, this c hoice implies that f or the case of no correlation v ariable selection would b e based on V − 1 ( µ k − µ po ol ) r ather than on t -scores. F ur thermore, dividing the inv erse correlation P − 1 equally b etw een equa- tions ( 2.3 ) and ( 2.4 ) greatly simplifies inte rpretation: feature selection tak es place on th e leve l of cen tered, scaled as w ell as decorrelated pred ictors δ k ( x ). Note that this in terpr etation is n ot hamp ered by the fact that the decorrela- tion in v olve s all features, b ecause t ypically there is n o substan tial correlation b et w een nonn ull and null features, so that the ov erall correlation matrix d e- comp oses into correlati on within null and within n onn u ll v ariables. LDA FEA TURE SELECTION 9 Remark B (Group ing of features). Using cat scores for feature selec- tion also greatly facilitates the group ing of features. S p ecifically , adding the squared cat scores of eac h feature con tained in a give n set (e.g., gene sets sp ecified by bio chemical pathw a ys) leads to Hotelling’s T 2 ; see Zub er and Strimmer ( 2009 ). Note that if another d ecomp osition than that of equation ( 2.3 ) and ( 2.4 ) w as u sed, the connection of cat scores with Hotelling’s T 2 w ould b e lost. Remark C (FDR m etho ds for feature selection). T h e usefuln ess of false disco very rates for feature selection in p rediction is disp uted, for example, in Donoho and Jin ( 2008 ). What we sho w here is that the un fa vorable p er- formance is due to naiv e application of FDR, leading to the elimination of to o many p redictors. If instead FNDR is con trolled to determine the n u ll- features to b e excluded fr om the discriminan t function, then muc h more efficien t prediction rules are obtained. Remark D (F ast computation of m atrix square ro ot). The inv erse square ro ot of the correlation matrix, requir ed in equations ( 2.1 ) and ( 3.1 ), can b e computed very efficien tly for the James–Stein shrin k age estimator; see Zub er and Strimmer ( 2009 ) for details. Remark E (Normalizi ng the null mo del). Estimating false disco v ery rates using su mmary scores S i ( 3.2 ) assumes as null mo del a χ 2 -distribution with u nknown parameters. T o emplo y standard FDR soft w are, w e apply the cub e-ro ot tr ansformation, w hic h pro vid es a n ormalizing transform for the χ 2 -distribution [Wilson and Hilferty ( 1931 )]. 6. Results. W e now illustrate our s h rink age DD A and LD A approac hes with v ariable s electio n usin g cat s cores and FNDR con trol by analyzing a num b er of reference data examples, and compare our results with that of comp eting approac h es. W e also in vestig ate the p erform an ce of FNDR feature selection in comparison with that of “higher criticism” [Donoho and Jin ( 2008 )]. 6.1. Singh et al. ( 2002 ) gene expr ession data. First, w e inv estigated the prostate cancer d ata set of Singh et al. ( 2002 ). This consists of gene ex- pression m easuremen ts of p = 6033 genes for n = 102 patien ts, of wh ic h 52 are cancer patien ts and 50 are health y (thus, K = 2). T o facilitate cross- comparison, we analyzed the data exactly in form as used in E f ron ( 2008a ). Our results are summarized in T able 2 , and corresp onding violin plots [Hin tze and Nelson ( 1998 )] are sh o wn in Figure 2 . Initially , we assumed zero correlation and ap p lied the shrink age DD A metho d. By con trolling the lo cal FNDR to b e sm aller or equal than 0.2, we 10 M. A HDESM ¨ AKI A ND K. STRIMMER Fig. 2. Vi olin plots of pr e diction err or r ates of various classific ation metho ds for the Singh et al. ( 2002 ) data. T he viol in plot is a gener alization of the b ox plot, showing the me dian and upp er and lower quartiles, as w el l as the density. Underlying e ach plot ar e 200 estimates of pr e diction err or c ompute d fr om the 200 splits arising fr om b alanc e d 10-fold cr oss-validation with 20 r ep etitions. The numb er in r ound br ackets i ndic ates the numb er of sele cte d fe atur es. Se e also T able 2 . determined that 5867 genes w ere null genes, hence, th at 166 genes needed to b e includ ed in the prediction rule. F or comparison, a lo cal FDR cutoff on the same leve l yielded only 53 genes, lac king the 103 genes in the “buffer zone” b et wee n the t wo cutoffs (cf. Figure 1 ). Note th at we r ecommend u sing the larger FNDR-based feature set, n ot ju st the 53 genes considered to b e differen tially expressed. T able 2 Pr e diction err ors and numb er of sele cte d f e atur es for Singh et al. ( 2002 ) gene expr ession data. The numb er in the r ound br ackets is the estimate d standar d err or Metho d Prediction Error F eatures Eba y 0.092 51 DDA-FDR 0.1682 (0.0093) 53 LDA-FDR 0.0989 (0.0056) 62 LDA-FNDR 0.0550 (0.0048) 131 DDA-FNDR 0.0640 (0.0049) 166 P AM 0.0 859 (0.0063) 172–482 DDA-ALL 0.3327 (0.0099) 6033 The prediction error of Ebay is taken from Efron ( 2008a ). LDA FEA TURE SELECTION 11 T able 3 Estimate d pr e di ction err ors f or sever al m ulticlass r efer enc e data sets Data Metho d Prediction error F eatures DE Lymphoma DDA-FNDR 0.0517 (0.0062) 162 0 ( K = 3, n = 62, LDA-FNDR 0.0036 (0.0018) 392 55 p = 4026) P AM 0.0254 (0.0045) 279 6–3201 SRBCT DDA-FNDR 0.0007 (0.0007) 90 62 ( K = 4, n = 63, LDA-FNDR 0.0000 (0.0000) 89 76 p = 2308) P AM 0.0145 (0.0034) 39–87 Brain DDA-FNDR 0.1892 ( 0.0146) 33 8 ( K = 5, n = 42, LDA-FNDR 0.1525 (0.0120) 102 23 p = 5597) P AM 0.1939 (0.0112) 197–559 7 The last column (DE) show s t he num b er of differentia lly expressed genes, whic h equals the number of significant features if FD R rather th an FND R is u sed as criterion. W e estimated the p rediction error of the resulting classification rule using balanced 10-fold cross-v alidation w ith 20 rep etitions. F or eac h of the in total 200 splits we trained a n ew prediction ru le and estimated new feature rank- ings and FDR statistics, th er eby including the selection pro cess in the error estimate to av oid o veroptimistic results [Am b roise and McLac hlan ( 2002 )]. The num b er of selected features shown in T able 2 is based on th e complete data. Ho wev er, for estimation of prediction error for eac h of the splits a new set of features was determined. F or the FNDR-based cutoff with 166 in cluded features, w e obtained an estimate of the pr ediction error of 0.0640 , whereas for the naive FDR cutoff resulting in 53 predictors, the error is m u c h higher (0.1682 ). F or comparison, w e also computed the error using all 6033 features, yieldin g a massiv e 0.3327. The P AM pr ogram selected b et w een 172 and 482 genes for inclusion in its predictor with er r or rate 0.0859 (note that the num b er of selected features b y the P AM algorithm is h ighly v ariable and differs fr om run to run ev en for th e same data set). According to E f ron ( 2008 a ), the Eba y approac h used 51 genes for prediction with error rate 0.092. If correlation w as tak en into accoun t, that is, if the ord er of ran k in g w as determined by cat rather than t -scores, interestingly b oth the n u m b er of differen tially expressed genes and of the n u ll genes increases, implying that the “bu ffer zone” shown in Figure 1 b ecomes s m aller. Thus, the LDA classifier with FNDR cutoff con tained f or this data few er predictors (131) but at the same time n ev ertheless ac h iev ed the s mallest ov erall prediction error (Figure 2 ). 6.2. Performanc e for multiclass r efer enc e data sets. F or extended com- parison we applied our approac h to a num b er of f u rther reference d ata sets. 12 M. A HDESM ¨ AKI A ND K. STRIMMER T able 4 Estimate d pr e di ction err ors employi ng higher criticism as f e atur e sele ction criterion Data Metho d Prediction error F eatures local FDR Prostate DDA-HC 0.0 707 (0.0055) 12 9 0.69 LDA-HC 0. 0497 (0.0045 ) 116 0.73 Lymphoma DD A -HC 0.0185 (0.0038) 179 1.00 LDA-HC 0. 0000 (0.0000 ) 345 0.78 SRBCT DDA-HC 0.0 035 (0.0016) 13 8 1.00 LDA-HC 0. 0007 (0.0007 ) 174 1.00 Brain DDA-HC 0.1572 (0.0118) 33 0.77 LDA-HC 0. 1417 (0.0108 ) 131 1.00 The last column (lo cal FDR) shows the local FDR of the least significant feature. In particular, w e analyzed gene expression data for lymphoma [Aliza d eh et al. ( 2000 )], small round blu e cell tumors (SRBCT) [Khan et al. ( 2001 )] and br ain cancer [Po mero y et al. ( 2002 )]. T he data sets ha v e in common that all con tain more than tw o classes, th u s allo win g to study the m ulti-class summary statistic ( 3.2 ). A sum mary of the results obtained by sh rink age LD A/DD A and FNDR feature selection and by P AM is giv en in T able 3 . The Kh an et al. ( 2001 ) d ata are v ery easy to classify . All metho ds p er- formed equally w ell on this data, with n o substant ial difference b et ween the LD A and DD A app roac hes. F or the lymph oma data set the P AM approac h failed to identify a compact set of p r edictiv e features. In cont rast, the FNDR appr oac h selects a compar- ativ ely small num b er of genes b oth in the LD A and DD A case. Intriguingly , for this d ata there were no differen tially expressed genes, if correlat ion is ignored, ye t th e FNDR criterion yielded 162 nonnull features. The brain data set is the largest and most difficult data set. Again, the P AM approac h failed to d etermine a stable set of features, whereas FNDR con trol yielded a compact set of inf orm ativ e pr ed ictors. Here, as w ell as for the lymphoma d ata, th e LDA appr oac h clearly outp erformed th e DDA approac hes in terms of prediction error. 6.3. Comp arison with “ higher critic ism ” fe atur e sele ction. Using th e data examples ab o ve, we demonstrated that feature selection based on simple FDR cutoffs is not sufficien t f or p rediction. In particular, if features are w eak and sparse, it ma y easily happ en that no pr edictor has sufficien tly small false discov ery rate to b e calle d signifi can t (cf. the lymp homa data). In such a setting Donoho and Jin ( 2008 ) suggest as alternativ e to FDR- based thr esholding the “higher criticism” (HC) approac h . The HC criterion LDA FEA TURE SELECTION 13 is based on p -v alues. F or eac h feature, the p -v alue is cen tered and stan- dardized using the estimated mean and v ariance of the corresp onding order statistic. T he optimal th reshold is determined as the maxim um of th e ab- solute HC scores within a f raction (sa y , 10%) of the top ranking features [Donoho and Jin ( 2008 )]. Our feature selection approac h based on FNDR control shares with HC that we aim to o ve rcome the limitations r esu lting from naiv e app lication of FDR-based feature selection. F or this reason, it is in s tructiv e to inv estigate our sh rink age prediction rule in combinatio n with the HC thr esh olding pro- cedure. The p -v alues underlying the HC ob j ectiv e function were obtained b y fitting a t w o-comp onent mixtu re mo d el, so that the same emp irical null mo del was u sed as in the FDR analysis. The results are giv en in T able 4 . Again, in all cases the LD A appr oac h using cat scores for feature selection leads to smaller prediction error than emplo ying DD A and t -scores. Remark ably , the p erformance of th e FNDR and HC approac h are on an equal leve l, implying that efficien t feature s e- lection is in d eed p ossible within the FDR framework. Th e set of features selected b y HC is, on a v er age, a bit smaller than that chosen by FNDR, and larger than th e FDR-based set, which indicates that the HC thr eshold is t ypically situated in the “b u ffer zone” of Figure 1 . 7. Discussion. 7.1. Shrinkage discriminant analysis and fe atur e sele ction. In this pap er w e ha ve revisited high-dimensional shr ink age discrimin an t analysis and p r e- sen ted a v ery efficien t pro cedu r e for p r ediction. Our approac h con tains three distinct elemen ts: • the use of J ames–Stein shrin k age for tr aining the pred ictor, • feature rankin g b ased on cat scores, and • feature selection b ased on FNDR th resholding. Emplo yin g James–Stein shrink age estimators is efficient b oth from a statis- tical as w ell as from a computational p ersp ectiv e. Note that shrink age is used here only as a means to impr o ve the estimate d p arameters, but n ot f or mo del selection as in the approac hes by Tibs h irani et al. ( 2002 ) and Gu o, Hastie and T ib shirani ( 2007 ). The correlatio n -adjusted t -score (cat score) emerges as a natural gene ranking criterion in the presence of correlation among pr edictors [Zub er and Strimmer ( 2009 )]. Here w e hav e s ho wn how to emplo y cat scores in the m u lti- class LD A setting and demonstrated on high-dimensional data th at using cat scores rather th an t -scores leads to a more effectiv e c hoice of p redictors. W e note that the order of r anking induced b y the cat and t -scores, r esp ectiv ely , ma y differ su bstan tially . Hence, u niv ariate thresholding pro cedures to select 14 M. A HDESM ¨ AKI A ND K. STRIMMER in teresting f eatures will differ, ev en if the testing pro cedur es accoun t for dep end encies. Finally , w e prop ose feature selectio n b y cont rolling FNDR rather than FDR and show that this is as efficien t in terms of pred ictive accuracy as when “higher criticism” is emplo yed. Moreo v er, w e explain why v ariable selection b ased on FDR leads to inferior pred iction r ules. 7.2. R e c ommendations. F or extremely high-dimensional data, estimat- ing correlation is v ery difficult, h ence, in this instance we recommend to conduct diagonal discrimin an t analysis [see also Bic ke l and Levina ( 2004 )]. F rom our analysis it is clear the shrink age DD A as p rop osed h ere, com bined with v ariable selectio n by control of FNDR or HC, is most effectiv e. In con- trast to the P AM approac h, no randomization p ro cedures are inv olv ed and , hence, the prediction rule and th e num b er of selected features are s table. In all other cases we recommend a full shrink age LD A analysis, with fea- ture selection based on cat scores. While this approac h is computationally more exp ensiv e than th e shr ink age DD A approac h , it has a significant impact on predictiv e accuracy . Typicall y , in comparison with DDA, taking accoun t of correlation either leads to more compact feature sets or improv ed predic- tion error, or b oth. F urthermore, relativ e to comp eting f ull LDA approac hes, suc h as Guo, Hastie and Tib s hirani ( 2007 ), our pro cedu re is computation- ally fast, due to the av oidance of compu ter-in tensive pro cedures suc h as resampling. APPENDIX A: JAMES–ST EIN SHRINKA GE ESTIMA TORS F OR TRAINING THE LDA PREDICTOR F or “small n , large p ” inference of th e LDA predictor function ( 2.1 ) and ( 2.2 ) and th e cat score ( 3.1 ) we r ely on thr ee differen t James–Stein-t yp e estimators. The correlation matrix is estimate d b y shrinking empirical correlations r ij to wa rd zero, r shrink ij = (1 − ˆ λ 1 ) r ij , with estimated intensit y ˆ λ 1 = min 1 , P i 6 = j d V ar( r ij ) P i 6 = j r 2 ij [Sc h¨ afer and S trimmer ( 2005 )]. The v ariances are estimated by shrinkin g the empirical estimates v i to- w ard their m ed ian, v shrink i = ˆ λ 2 v median + (1 − ˆ λ 2 ) v i , LDA FEA TURE SELECTION 15 using ˆ λ 2 = min 1 , P p i =1 d V ar( v i ) P p i =1 ( v i − v median ) 2 [Opgen-Rhein and S trimmer ( 2007 )]. The class f requencies are estimated follo wing Hausser and Strimmer ( 2009 ) b y ˆ π shrink j = ˆ λ 3 1 K + (1 − ˆ λ 3 ) n j n , using ˆ λ 3 = 1 − P K j =1 ( n j /n ) 2 ( n − 1) P K j =1 (1 /K − n j /n ) 2 . APPENDIX B: RELA T IONSHIP TO OTHER DD A AND LDA APPR OA CHES Our p rop osed shr ink age discriminant ap p roac h is closely linked to a n u m- b er of recently prop osed metho d s. NSC. The NSC/P AM classification rule was first presented in Tibsh irani et al. ( 2002 ) and later d iscussed in more statistical detail in Tibs hirani et al. ( 2003 ). P AM is a DD A app roac h, so no gene-wise correlations are tak en in to accoun t. Genes are ranked according to equation ( 3.3 ), an d feature s electio n is determined b y soft-thresholding, u sing pr ediction error estimated by cross- v alidation as optimalit y cr iterion. Eba y . The “Eba y” app roac h of Efron ( 2008a ) is also a DD A approac h . F eature s electio n is based on an empirical Ba ye s mo d el that links pr ed iction error with f alse discov ery r ates. Thus, it is v ery similar to P AM bu t compu- tationally and statistically more efficien t. In addition, the “Eb ay” algorithm pro v id es corr elation corrections of pr ediction errors; see Section 5 in Efron ( 2008b ). Clanc and MLDA. The “Clanc” algorithm is describ ed in Dabney and Storey ( 2007 ) and the “mo d ified LD A” (MLD A) in Xu, Brock and Pa r- rish ( 2009 ). Both metho ds are b ased on the LD A fr amework, and b oth use James–Stein shrin k age to estimate the p o oled co v ariance matrix. MLD A uses standard t -scores for feature selection, whereas Clanc emplo ys a greedy algorithm searc h to fin d optimal subsets of features based on a multiv ariate criterion. 16 M. A HDESM ¨ AKI A ND K. STRIMMER SCRDA. The “shrunken cent roids regularized discriminant analysis” (SCRD A) pro cedu r e is d escrib ed in Guo, Hastie and Tibsh ir ani ( 2007 ) and uses a sim ilar soft-thresholding pr o cedure for v ariable selection as P AM. The co v ariance matrix is estimated by a ridge estimator. Regularization and f ea- ture selection p arameters are simultaneously determined by cross-v alidation. The main issues with SCR DA are the computational exp ense and problems in find ing u nique parameters [Guo, Hastie and Tib s hirani ( 2007 )]. APPENDIX C: COMPUTER IMPLEMENT A TION W e h a ve imp lemen ted the prop osed shrink age d iscriminant pro cedu res (b oth DDA and LD A) and the asso ciated FNDR and h igher criticism v ari- able selection in the R pac k age “sda,” whic h is freely a v ailable u nder the terms of the GNU General Pu blic License (version 3 or later) f rom CRAN ( http://c ran.r- projec t.org/web/packages/sda/ ). Ac kn o wledgment s. W e thank V erena Zub er for critical comment s and helpful discussion. M. A. is grateful to the Alexander vo n Humboldt F oun - dation for a p ostdo ctoral research fello wship. REFERENCES Ack ermann, M. and Strimmer, K. (2009). A general mo dular framew ork for gene set enric hment. BMC Bioinformatics 10 47. Alizadeh, A. A., Eisen , M. B., D a vis, R. E., Ma, C., Lossos, I. S., Rosenw ald, A., Boldrick, J. C., Sabet, H., Tran, T., Yu, X ., Po well, J. I., Y ang, L., Mar ti, G . E., Moore, T., Hudson, J., Lu, L., Lewis, D. B ., T ibshirani, R ., Sherlock, G., Ch an, W. C., Greiner, T. C. , W eisenburger, D. D., Ar mit age, J. O., W arnke, R. , Levy, R., Wilson, W., Grever, M. R., Byrd, J. C., B otstein, D., Bro wn, P. O. and S t audt, L. M. (2000). Distinct types of diffuse large B-cell lymphoma id entified by gene exp ression p rofiling. Natur e 403 503–511. Ambro ise, C. and McLachlan, G . J. (2002). Selection bias in gene extraction on the basis of microarra y gene-ex pression data. Pr o c. Natl. A c ad. Sci. USA 99 6562–6566. Bickel, P. J. and Levin a, E. (2004). Some th eory for Fisher’s linear discriminant func- tion, ‘naive Bay es,’ and some alternatives when there are many more va riables than observ ations. Bernoul li 10 989–1010. MR2108040 Dab ney, A. R. and Storey, J. D. (2007). Op timalit y driven nearest centroid classifica- tion from genomic d ata. PL oS ONE 2 e1002. Donoho, D. and Jin, J. (2008). Higher criticism thresholding: Op timal feature selection when u seful features are rare and wea k. Pr o c. Natl. A c ad. Sci. USA 105 14790–15795. Efr on, B . (1975). The efficiency of logistic regression compared to normal d iscriminan t analysis. J. Amer . Statist. Asso c. 70 892–896. MR0391403 Efr on, B . (2004). Large-scale simultaneous hyp othesis testing: The choice of a null hy- p othesis. J. A m er. Statist. Asso c. 99 96–104. MR2054289 Efr on, B. (2008a). Empirical Ba yes estimates for large-scale prediction problems. T ech- nical rep ort, Dept. St atistics, Stanford Univ. Efr on, B. (2008b). Microarra ys, empirical Bay es, and the tw o-groups model. Statist. Sci. 23 1–22. MR2431866 LDA FEA TURE SELECTION 17 F an, J. and F an, Y. (2008). H igh-dimensional classification using features annealed in- dep endence ru les. Ann . Statist. 36 2605–2637. MR2485009 Friedman, J. H . (1989). R egularized discriminan t analysis. J. Amer. Statist. Asso c. 84 165–175 . MR0999675 Guo, Y., Hastie, T. and Tibshirani, T . (2007). Regularized discriminan t analysis and its application in microarra ys. Biostatistics 8 86–100. Hand, D. J. (2006). Classifier technology and the illusion of p rogress. Statist. Sci. 21 1–14. MR2275965 Hausser, J. and Strimme r, K. (2009). Entrop y inference and the James–Stein estimator, with application to nonlinear gene association n etw orks. J. Mach. L e arn. R es. 10 1469– 1484. Hintze, J. L. and Nelson, R. D. (1998). Violi n plots: A b ox plot-densit y trace synergism. Amer . Statist. 52 181–184. Khan, J., Wei, J. S., R ingner, M., Saal, L. H., Ladanyi, M., Westermann, F., Ber thold, F., S chw ab, M., Antonescu, C. R., Pete rson, C. and Mel tzer, P. S . (2001). Classification and diagnostic pred iction of cancers using gene expression profil- ing and artificial neural netw orks. Natur e M e d. 7 673–6 79. Opgen-Rhein , R. and Strim mer, K. (2007). Accurate ranking of differenti ally expressed genes by a distribution-free sh rin kag e approach. Statist. Appl. Genet. Mol. Biol. 6 9. MR2306944 Pomer o y , S. L. , T ama yo, P., Gaase nbeek, M., Sturla, L. M., Angelo, M., McLaughlin, M. E., Kim, J. Y. H., Goumnero v a, L. C., Black, P. M., La u, C., Allen, J. C., Zagzag, D., Olson, J. M., Cu rran, T., W etmore, C., Bie gel, J. A ., Poggio, T., Mukherjee , S., Rifkin , R., C alif ano, A., Stolo vitz ky, G., Louis, D. N., Mesi ro v, J. P., Lander, E. S . and Golub, T. R. (2002). Prediction of central n ervous system embryo nal tumour outcome based on gene expression. Natur e 415 436–442. Sch ¨ afer, J. an d Stri mmer, K. (2005). A sh rin kag e approac h to large-scal e cov ariance matrix estimation and implications for functional genomics. Statist. Appl. Genet. Mol. Biol. 4 32. MR2183942 Schwender, H., Ickst adt, K. and Rahnenf ¨ uhrer, J. (2008). Classification with h igh- dimensional genetic d ata: Assigning patients and genetic features to known classes. Biometr. J. 50 911–926. Singh, D., Febbo, P. G., Ros s, K., Jackson, D. G., Manola, J., Ladd, C. , T ama yo, P., R ensha w, A. A., D’Ami co, A. V., Richi e, J. P ., Lander, E. S., Loda, M., Kantoff, P. W ., Golub, T. R. and Sellers, W. R. (2002). Gene expression corre- lates of clinical prostate cancer b eha vior. Canc er Cel l 1 203–209. Sla wski, M., Da ume r, M. and Boulesteix, A. -L. (2008). CMA—a comprehensive Bio- conductor pac kag e for sup ervised classificati on with high dimensional data. BMC Bion- formatics 9 439. Strimmer, K. (2008). A unified approach to false discov ery rate estimation. BMC Bi oin- formatics 9 303. Tibshirani, R. , Hastie, T., Narasimhan, B. and Chu , G. (2002). Diagnosis of multiple cancer type by shrunken centroids of gene ex pression. Pr o c. Natl. A c ad. Sci. USA 99 6567–65 72. Tibshirani, R., Hasti e, T., Narsimhan, B . and Chu, G. (2003). Class prediction by nearest shrunken cen troids, with applications to DNA microarra ys. Statist. Sci. 18 104– 117. MR1997067 Wilson, E. and Hilfer ty, M. (1931). The distribution of chi-square. Pr o c. Natl. A c ad. Sci. 17 684–688. 18 M. A HDESM ¨ AKI A ND K. STRIMMER Witten, D. M. and Tibshiran i, R. (2009). Cov ariance-regularized regression and clas- sification for high-dimensional problems. J. R oy. Statist. So c. Ser. B 71 615–636. Xu, P., Brock, G . N. and P arrish, R . S . (2009). Modified linear discriminant analysis approac hes for classification of high-d imensional micoarra y data. Comput. Stat. Data Ana l. 53 1674–1687 . Zuber, V. and Strimmer, K. (2009). Gene ranking and b iomark er discov ery under cor- relation. Bioi nformatics 25 2700–270 7. Institute for Medical Informat ics, St a tistics and Epidemiology (IMISE) University of Leipzig H ¨ ar telstr. 16– 18 D-04107 Leipzig Germany and Dep ar tment of S ignal Processing T ampere University of Technology P.O. Box 553 FI-33101 T a mpere Finland E-mail: miik a.ahdesmaki@gmail.com Institute for Medical Informat ics, St a tistics and Epidemiology (IMISE) University of Leipzig H ¨ ar telstr. 16– 18 D-04107 Leipzig Germany E-mail: strimmer@uni-l eipzig.de
Original Paper
Loading high-quality paper...
Comments & Academic Discussion
Loading comments...
Leave a Comment