Accelerator design languages (ADLs), high-level languages that compile to hardware units, help domain experts quickly design efficient application-specific hardware. ADL compilers optimize datapaths and convert software-like control flow constructs into control paths. Such compilers are necessarily complex and often unpredictable: they must bridge the wide semantic gap between high-level semantics and cycle-level schedules, and they typically rely on advanced heuristics to optimize circuits. The resulting performance can be difficult to control, requiring guesswork to find and resolve performance problems in the generated hardware. We conjecture that ADL compilers will never be perfect: some performance unpredictability is endemic to the problem they solve.
In lieu of compiler perfection, we argue for compiler understanding tools that give ADL programmers insight into how the compiler's decisions affect performance. We introduce Petal, a cycle-level Petal for the Calyx intermediate language (IL). Petal instruments the Calyx code with probes and then analyzes the trace from a register-transfer-level simulation. It maps the events in the trace back to high-level control constructs in the Calyx code to track the clock cycles when each construct was active. Using case studies, we demonstrate that Petal's cycle-level profiles can identify performance problems in existing accelerator designs. We show that these insights can also guide developers toward optimizations that the compiler was unable to perform automatically, including a reduction by 46.9\% of total cycles for one application.
Accelerator design languages (ADLs) are high-level languages for developing application-specific hardware accelerators. ADL compilers must bridge a large semantic gap: they typically start with an untimed, resource-unaware source program and introduce cycle-level schedules, physical resource management, and explicit control structures such as finitestate machine (FSM) logic.
This control-logic synthesis is fundamentally complex. ADL compilers therefore typically rely on heuristics that lead to unpredictable performance [19]. Even if the heuristics work well in most cases, in the rare cases where they produce poor results, they leave accelerator designers with little recourse. The high-level ADL source code abstracts over the implementation details for the control logic, so the only option is to inspect or simulate the generated hardware. A waveform viewer [4,23] can help exhaustively visualize the generated control paths’ behavior on every cycle, but these low-level signals may have little connection to the original ADL program. These signal traces make it difficult to understand when a high-level action in the source program occurred or how long it took to run. They can also obscure any control overheads that the compiler itself introduces, which can manifest in wasted time when the high-level program makes no progress.
This paper argues that, because of the fundamental complexity of hardware control logic generation, ADL compilers will never achieve perfect results for every program. Instead, we must furnish developers with tools that help them understand how the compiler behaves. In particular, trace-based profiling for compiled ADL programs could help illuminate how high-level constructs map onto cycle-level execution time. By revealing how the compiler chose to orchestrate the events from the source program, a profiler could help developers find and fix compiler-induced sources of inefficiency.
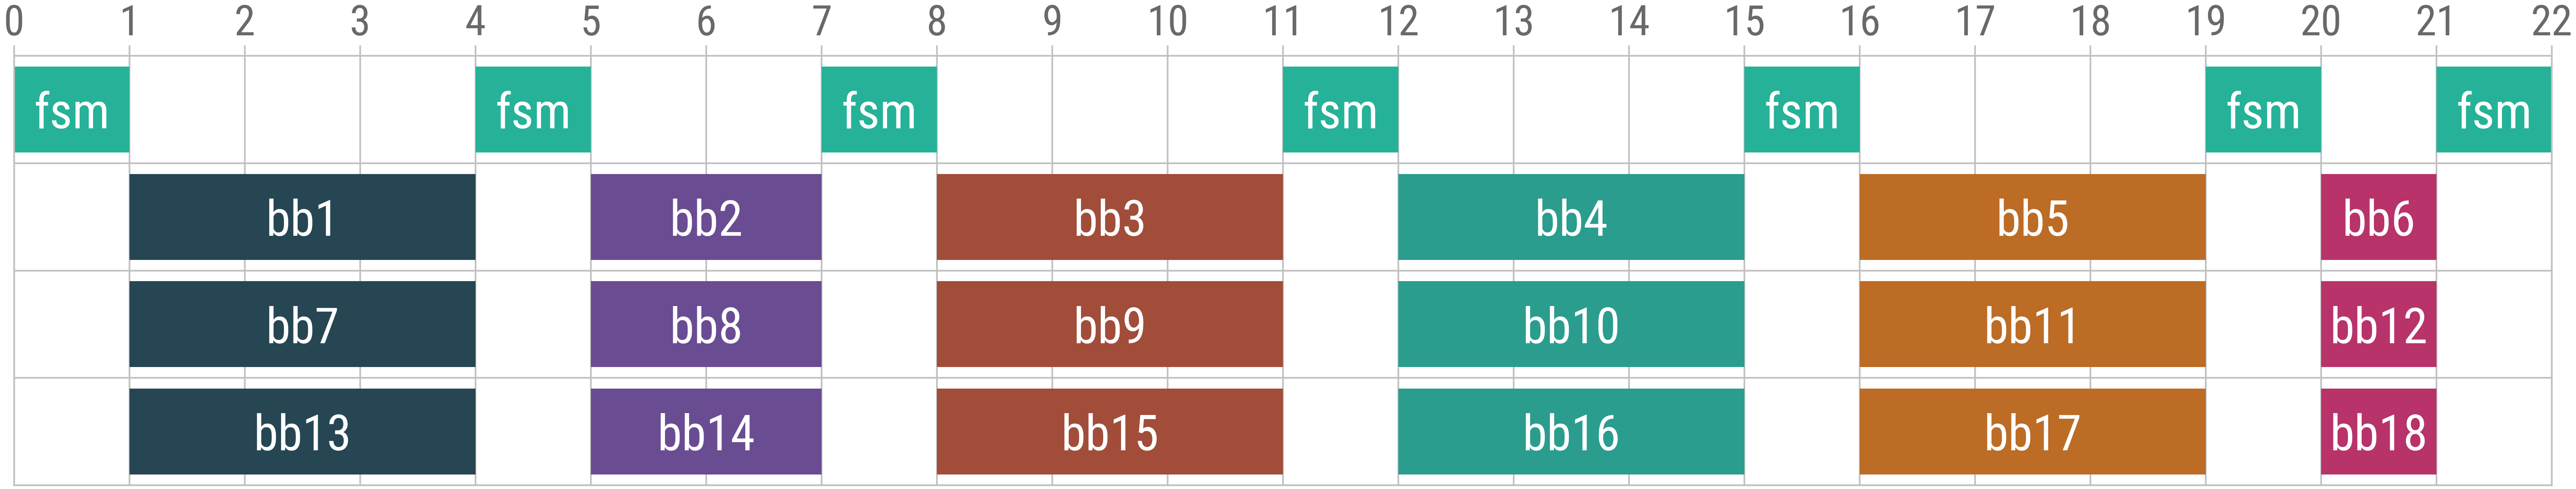
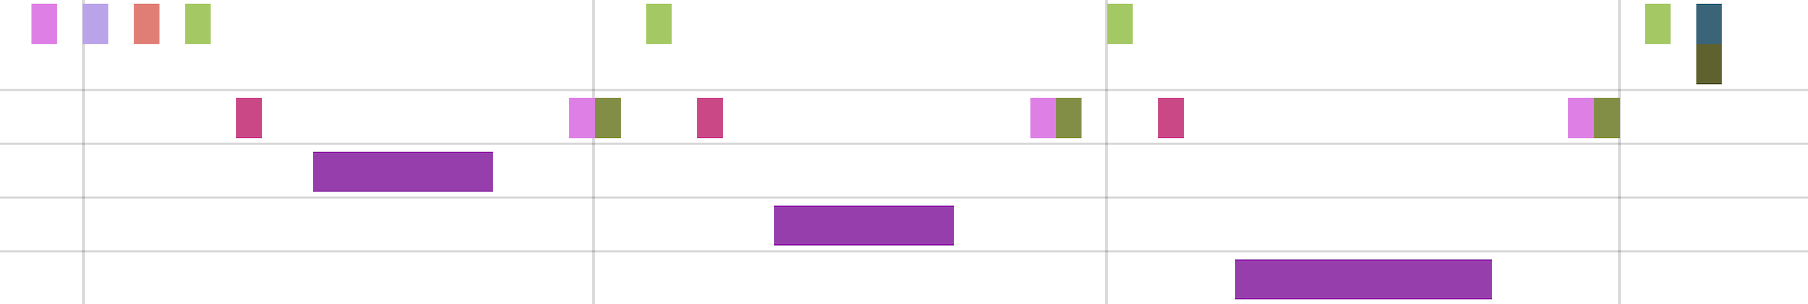
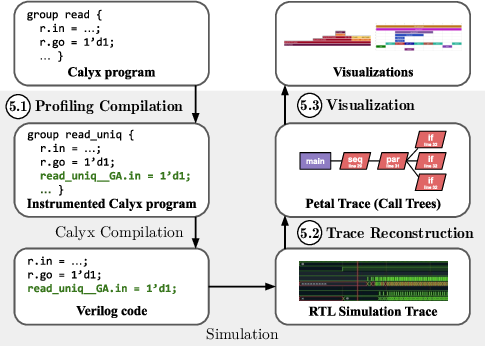
We present Petal, a cycle-level profiler that differentiates control overhead from user-defined computation. Petal recreates a cycle-by-cycle trace of program execution during register-transfer-level (RTL) simulation in terms of userdefined program blocks, and also captures timings and durations of control events. To do so, Petal uses instrumentation to add probes to the original program that do not affect the cycle count of the overall program. After obtaining a trace from RTL simulation, Petal uses probe signal values to reconstruct when events were active. Events include user-defined blocks of computation and compiler-generated control constructs. The recreated trace containing these events is used to produce visualizations such as flame graphs and timeline views. Our implementation of Petal uses the Calyx intermediate language [20] for ADL compilers. We demonstrate the usefulness of Petal’s cycle-level profiles towards understanding the effects of existing optimization passes in the Calyx compiler (Section 7). By using Petal visualizations to compare optimized and unoptimized versions of a program, users can learn about scheduling changes and other transformations performed by a particular pass. We also find that Petal can help users identify performance problems in existing designs and direct their hand-optimization efforts to make the resulting accelerator more performant (Section 8). Oftentimes we found that reducing control overhead results in large performance gains, up to 46.9% in one application. This paper’s key contributions are:
• We design Petal, a profiler for the Calyx intermediate language (IL). It leverages Calyx’s structure and instruments the program with probes that are used to reconstruct the execution trace from RTL simulation. • Two case studies that use Petal to understand the effects of two Calyx compiler optimization passes: static promotion and resource sharing. • Two case studies that use Petal to find optimization opportunities by reducing control overhead, including a cycle-count reduction of 46.9% in one application.
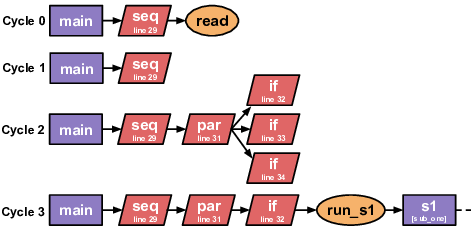
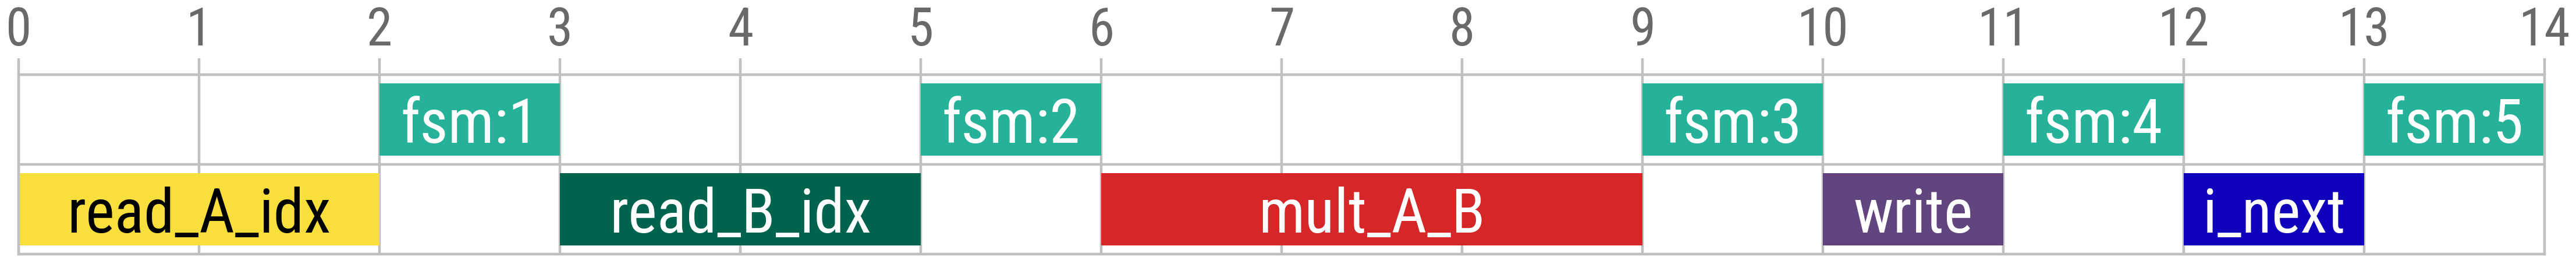
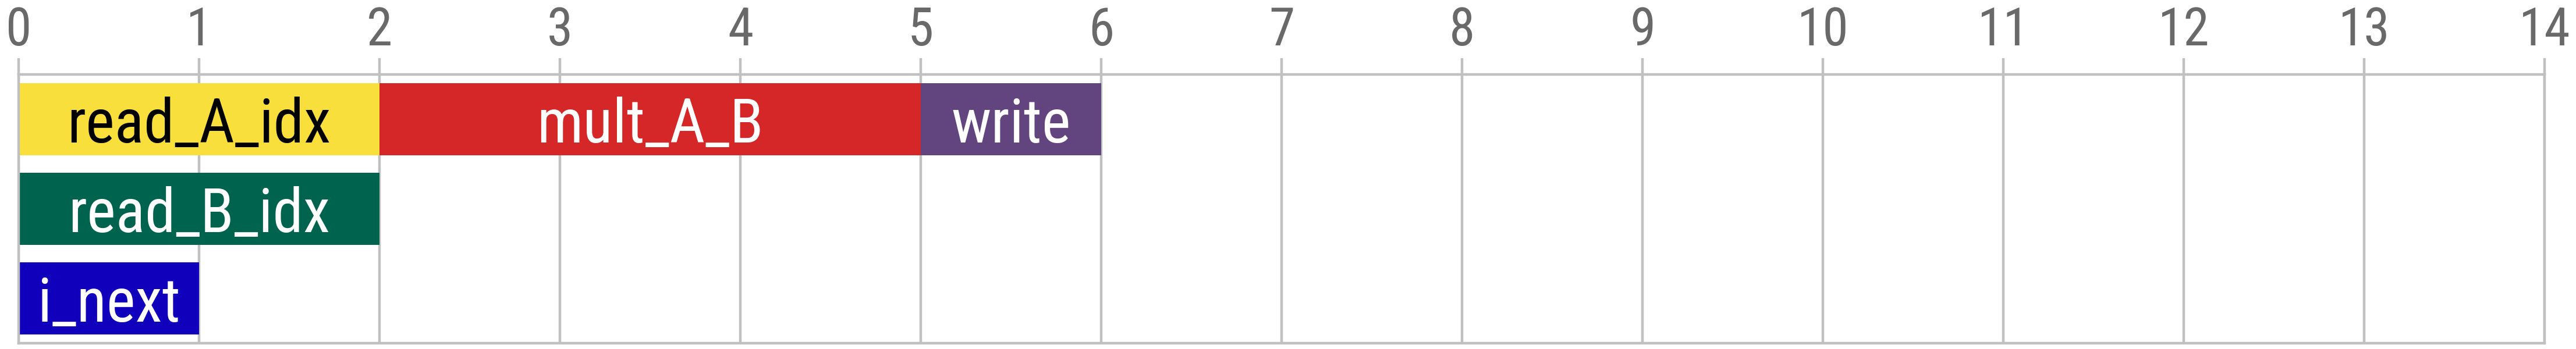
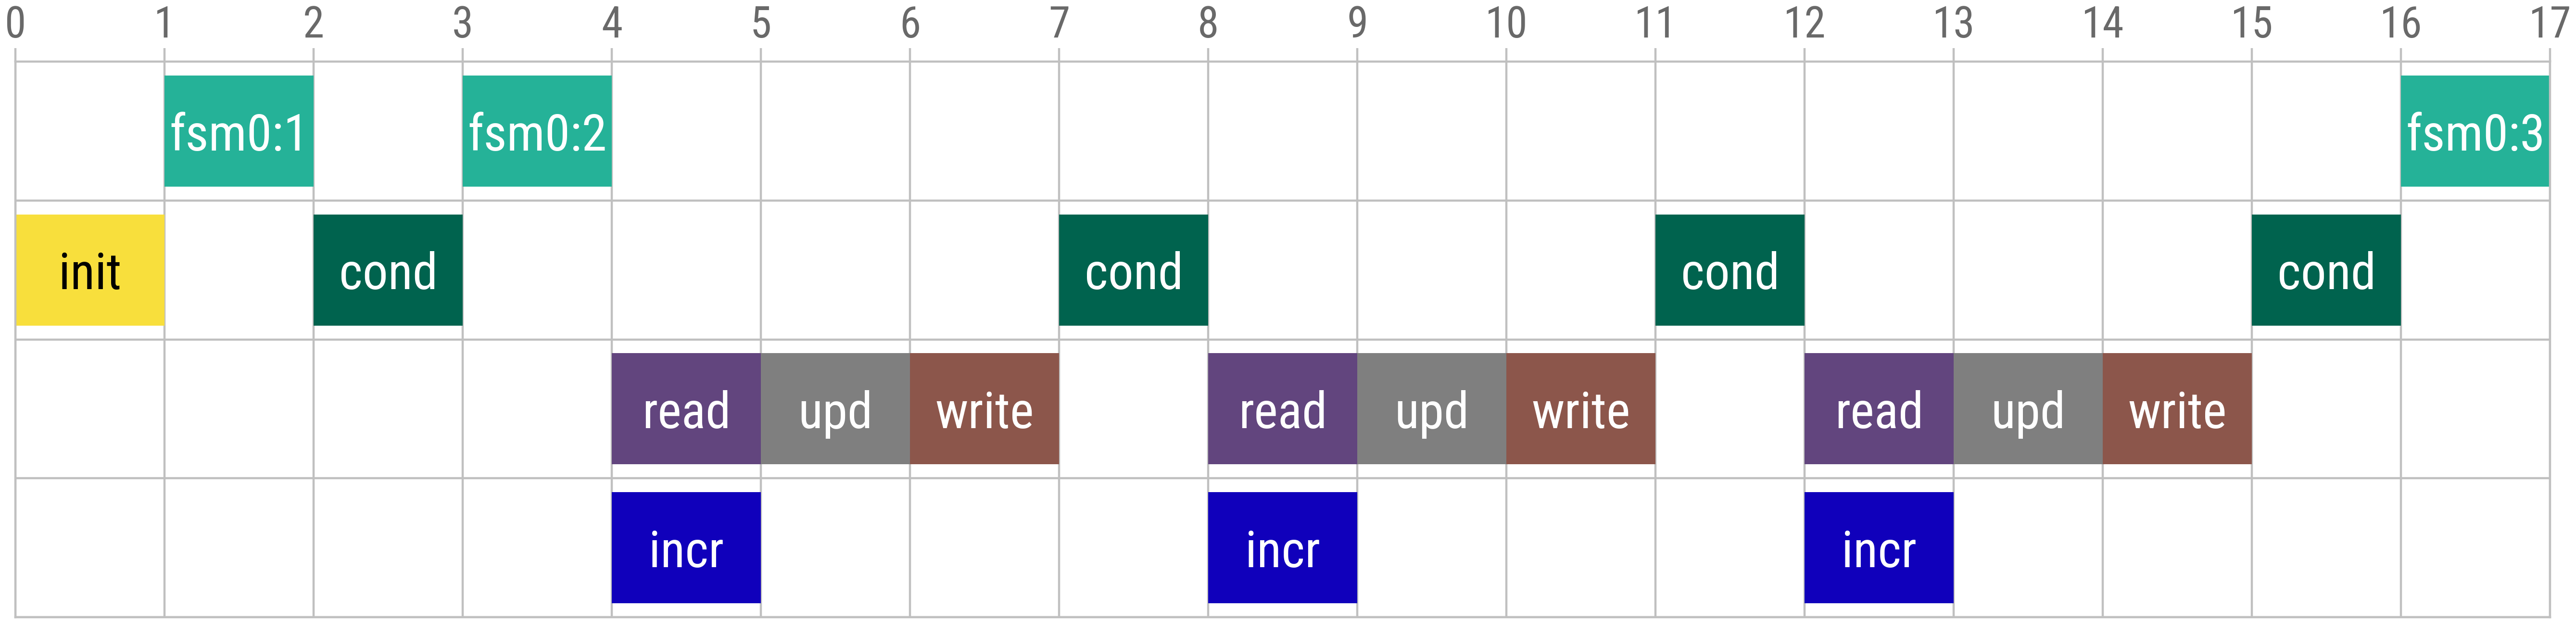
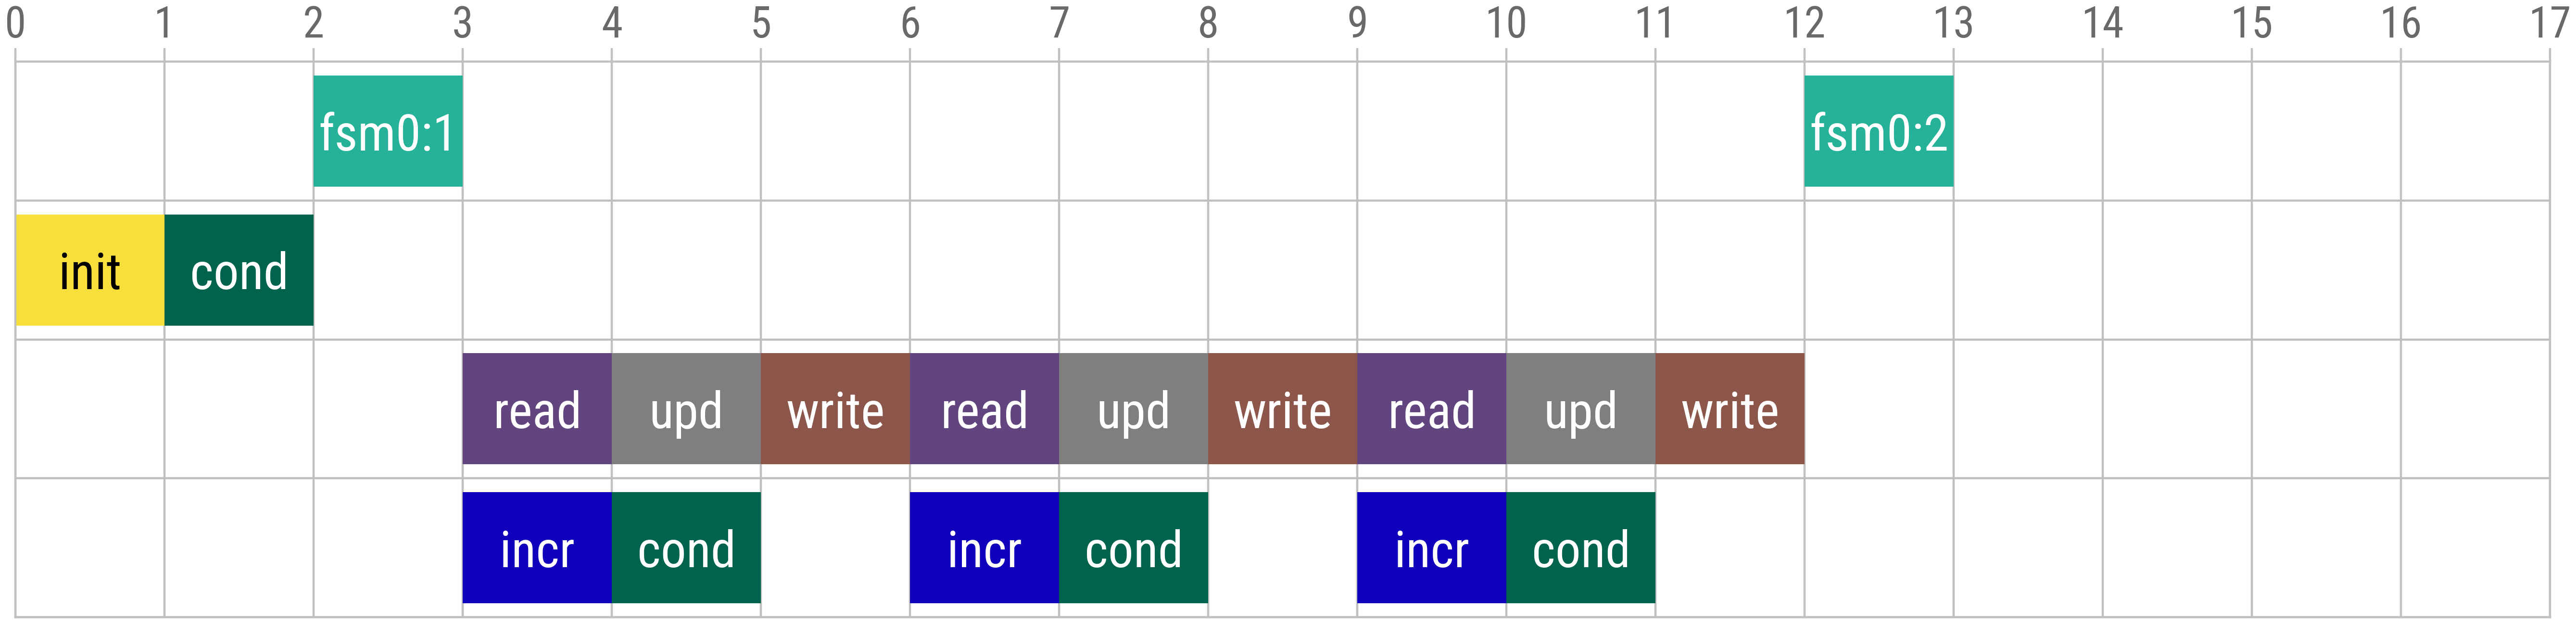
In Figure 1, ADL code uses a switch-case to determine which subroutine to call. Figure 2 shows the same program after compilation to Calyx. The control block on line 28 shows that the switch-case was implemented using parallel composition (lines 31-35). Each thread runs the comparison for a specific case and the corresponding subroutine on success. Suppose that in this execution, case 1 passes. In total, the computation in the main component during our execution will consist of the blocks read, run_s1, and write.
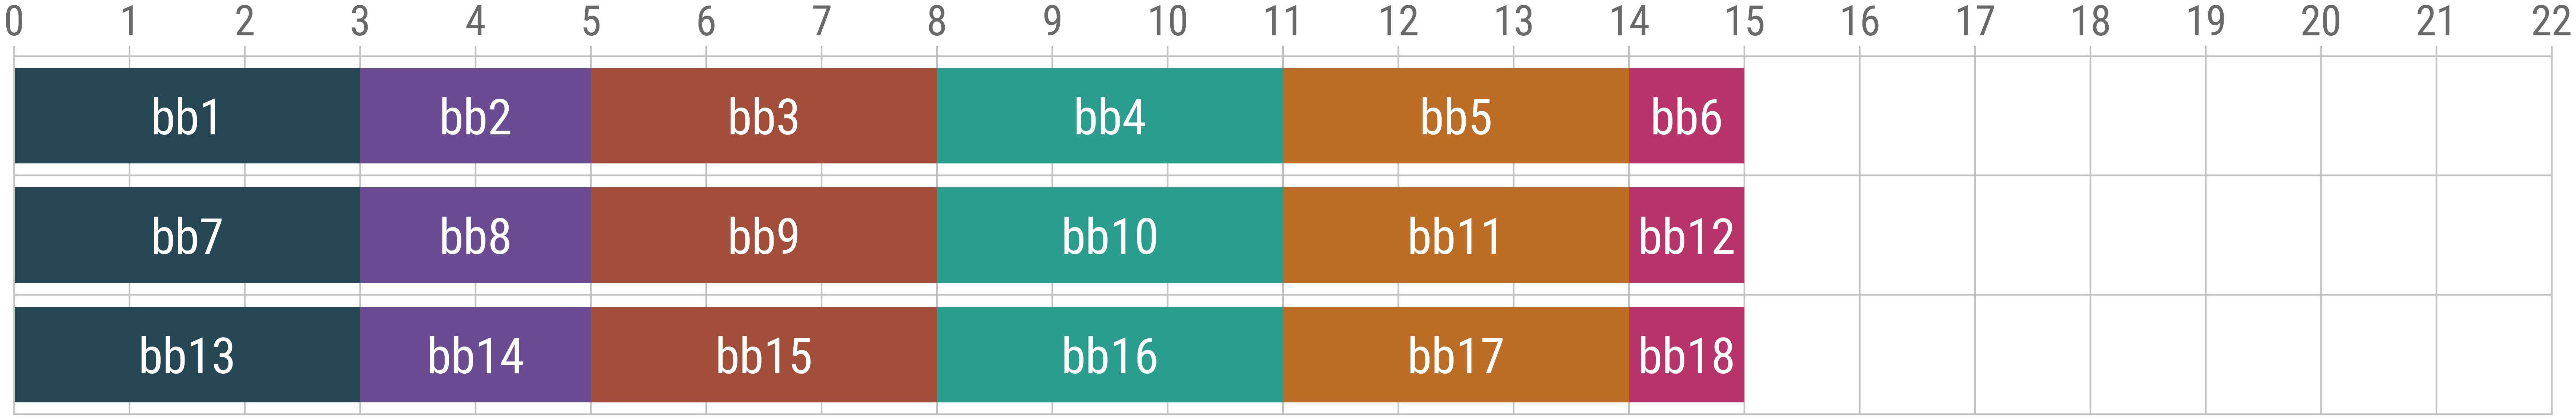
How many cycles should this execution take? Supposing each of the computation blocks (Calyx groups) take one cycle, we may expect a total of three cycles. However, by running this program we find that the execution actually takes nine.
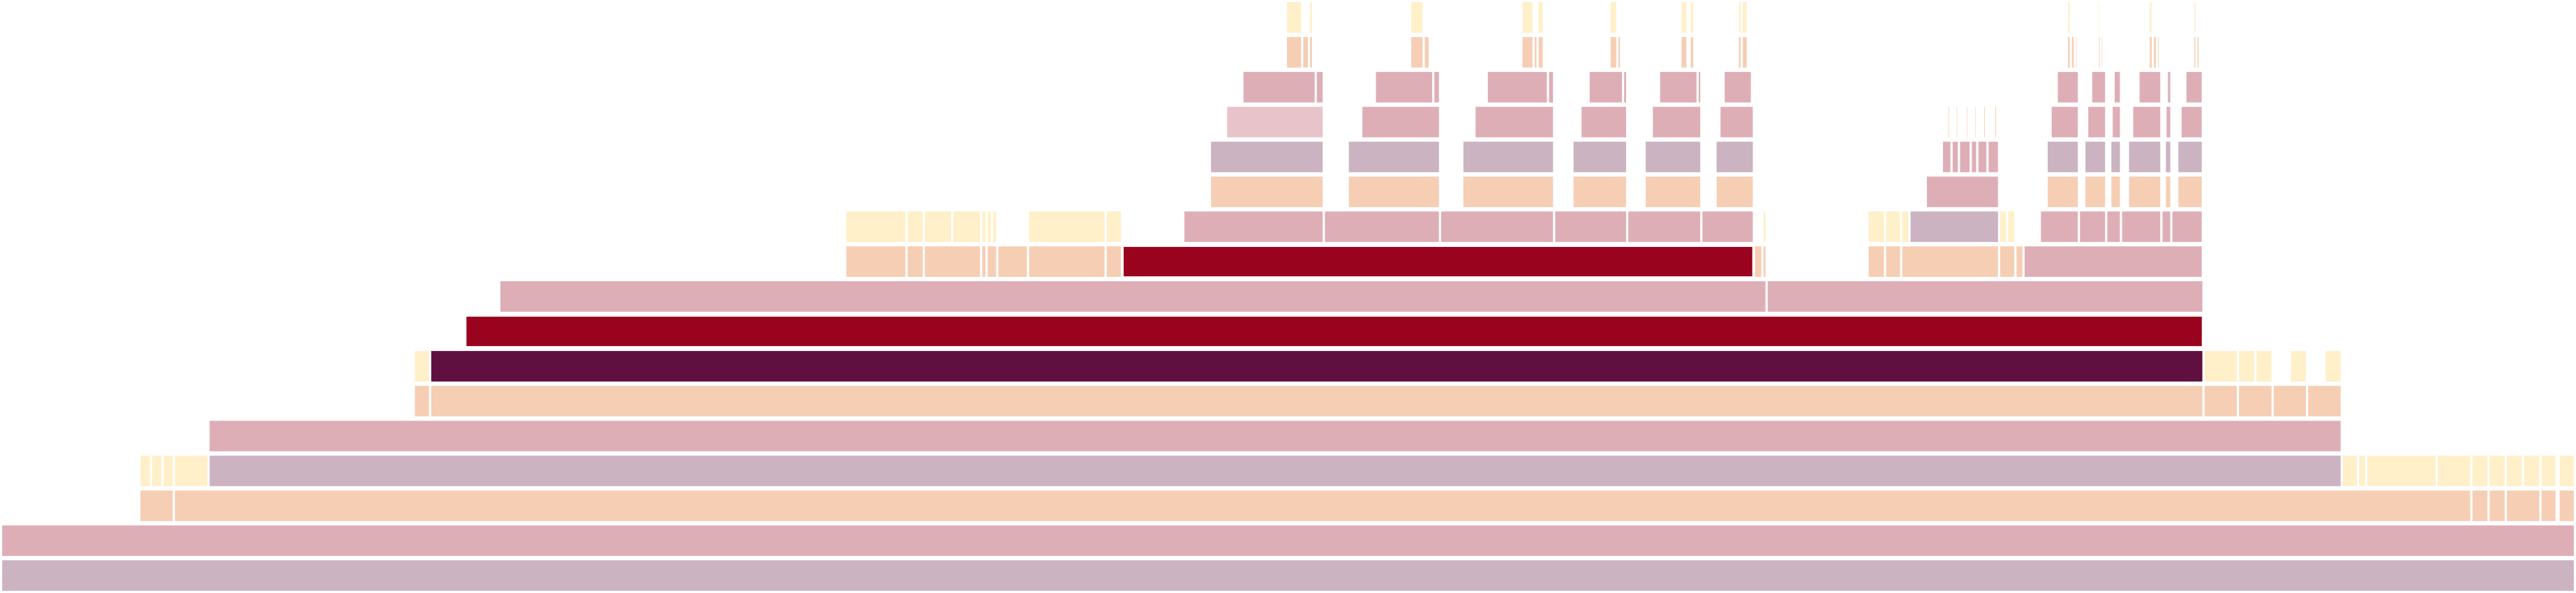
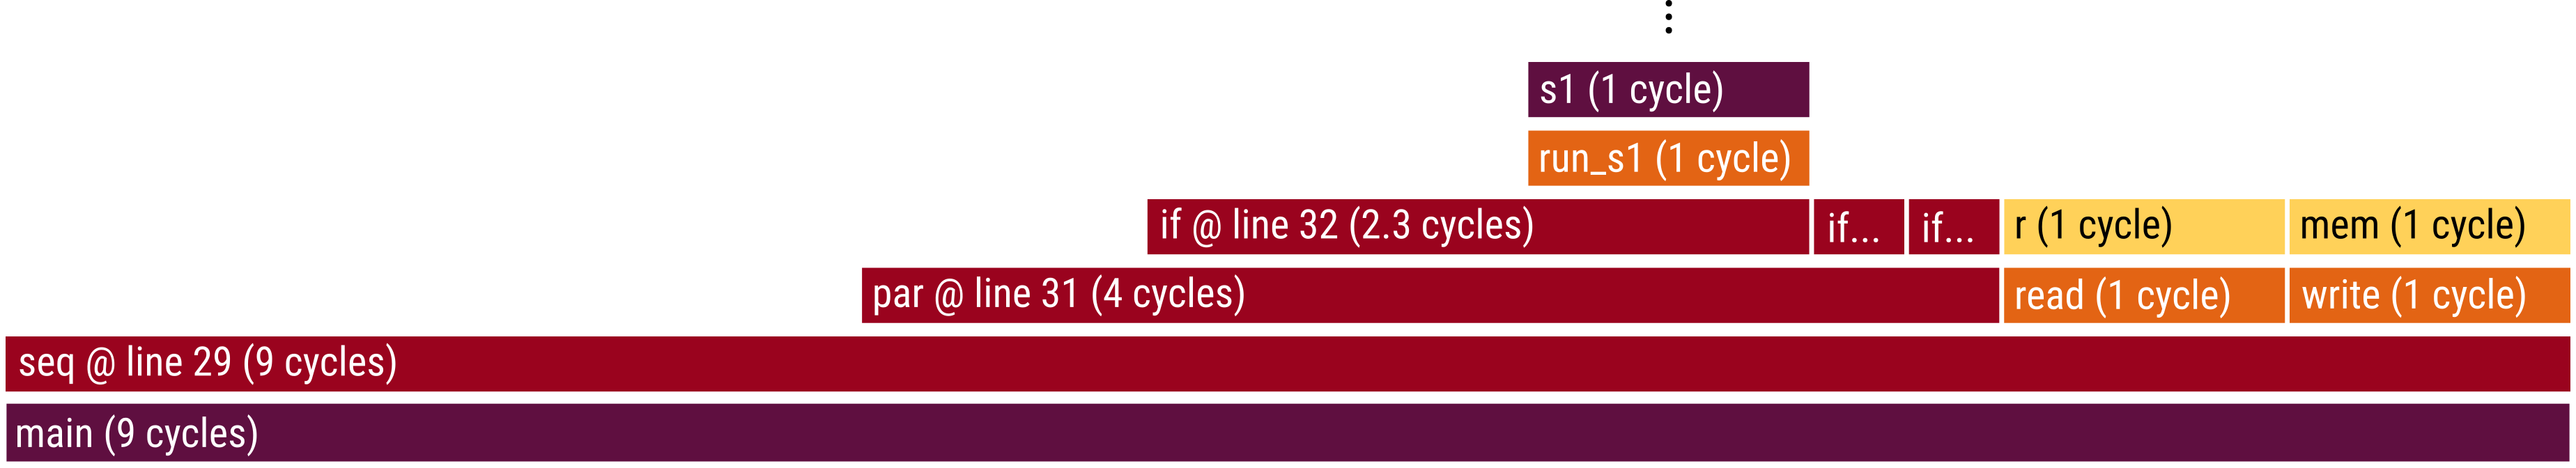
We diagnose this discrepancy using Petal. Petal produces a flame graph (Figure 3) that summarizes the execution cycles spent on program blocks and control statements. As expected, read, run_s1, and write each take one c
This content is AI-processed based on open access ArXiv data.