Title: A Non-Equilibrium Ionization Model of the Local and Loop I Bubbles - Tracing the Ovi Distribution
ArXiv ID: 1108.6226
Date: 2011-09-01
Authors: Miguel A. de Avillez (U. Evora, Portugal), Dieter Breitschwerdt (Tech. Univ. Berlin, Germany), Emanuele Spitoni (U. Evora), and Nuno Carvalho (U. Evora)
📝 Abstract
We present the first to date three-dimensional high-resolution hydrodynamical simulation tracing the non-equilibrium ionization evolution (using the Eborae Atomic and Molecular Plasma Emission Code - E(A+M)PEC) of the Local Bubble and Loop I superbubbles embedded in a turbulent supernova-driven interstellar medium.
💡 Deep Analysis
📄 Full Content
**Volume Title**
ASP Conference Series, Vol. **Volume Number**
**Author**
c⃝**Copyright Year** Astronomical Society of the Pacific
A Non-Equilibrium Ionization Model of the Local and Loop I
Bubbles - Tracing the Ovi Distribution
Miguel A. de Avillez1, Dieter Breitschwerdt2, Emanuele Spitoni1 & Nuno
Carvalho1
1Dept. of Mathematics, U. ´Evora, R. Rom˜ao Ramalho 59, ´Evora, Portugal
2ZAA, Technische Universit¨at Berlin, Hardenbergstr. 36, Berlin, Germany
Abstract.
We present the first to date three-dimensional high-resolution hydrody-
namical simulation tracing the non-equilibrium ionization evolution (using the Eborae
Atomic and Molecular Plasma Emission Code - E(A+M)PEC) of the Local Bubble and
Loop I bubbles embedded in a turbulent supernova-driven interstellar medium.
1.
Introduction
The Local Bubble (LB), hosting the Local Cloud surrounding the solar system, is an
X-ray emitting region extending 100 pc in radius, and it is embedded in a somewhat
larger Hi deficient cavity. Its origin and spectral properties in UV, EUV and X-rays
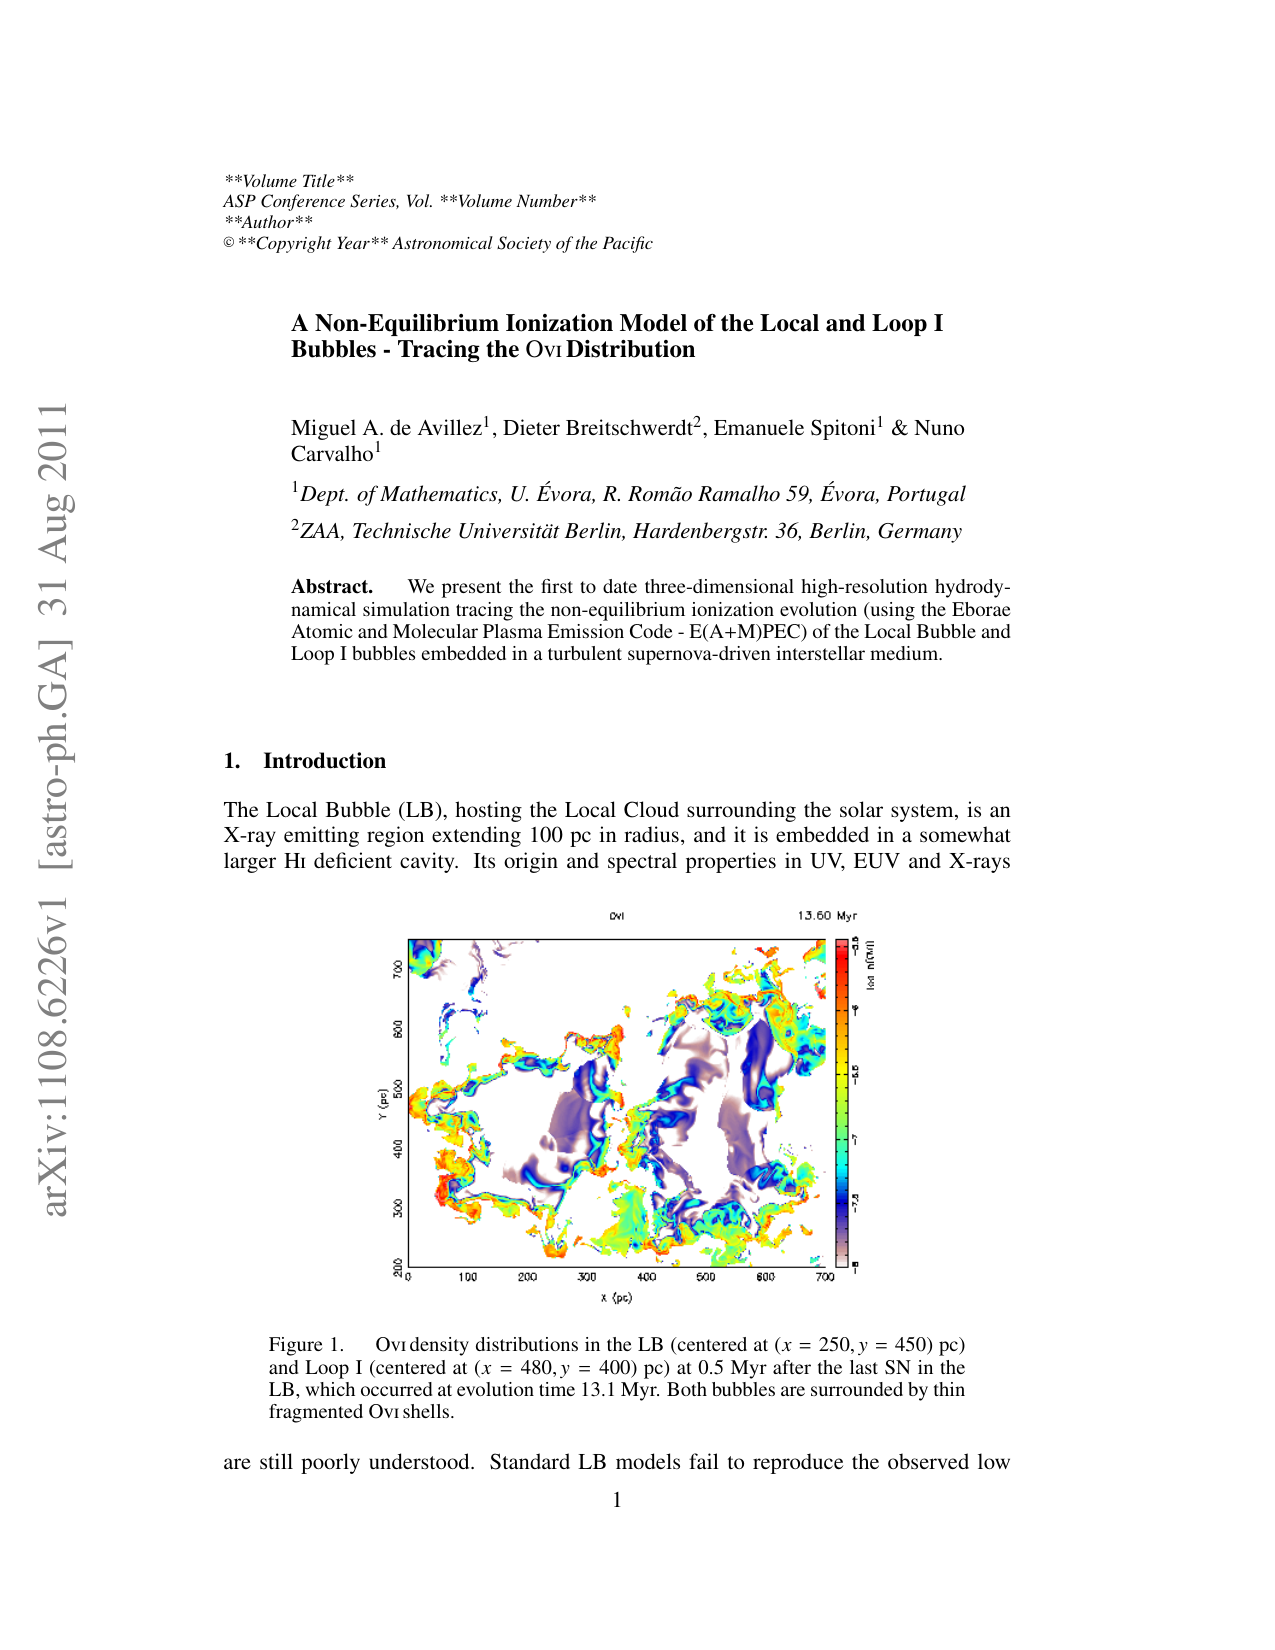
Figure 1.
Ovi density distributions in the LB (centered at (x = 250, y = 450) pc)
and Loop I (centered at (x = 480, y = 400) pc) at 0.5 Myr after the last SN in the
LB, which occurred at evolution time 13.1 Myr. Both bubbles are surrounded by thin
fragmented Ovi shells.
are still poorly understood. Standard LB models fail to reproduce the observed low
1
arXiv:1108.6226v1 [astro-ph.GA] 31 Aug 2011
2
M. Avillez et al.
OVI absorption column density. Heliospheric in situ measurements are sensitive to the
boundary conditions imposed by the LB and the OVI column density in absorption is
a crucial test for modelling of the local ISM. We investigate if in the multisupernova
scenario (Fuchs et al. 2006) the observed Ovi column density in absorption (along lines
o sight (LOS) crossing the LB) can be reproduced.
2.
Model and Simulations
We use the 3D supernova-driven ISM model of Avillez & Breitschwerdt (2009) with
new features: (i) Simultaneous evolution of the Local and Loop I superbubbles as a
result of the successive explosions of massive stars from a moving subgroup - 17 stars
with masses ∈[21.5, 8.2] M⊙and Sco Cen - 39 stars with masses ∈[14, 31] M⊙clusters
(Fuchs et al. 2006; Egger 1998), and (ii) Time-dependent evolution of the ionization
structure of H, He, C, N, O, Ne, Mg, Si, S and Fe ions with latest solar abundances
(Asplund et al. 2009) using E(A+M)PEC (see Avillez & Spitoni in this book).
3.
Results and Final Remarks
The locally enhanced SN rates produce coherent structures within a highly disturbed
background medium. The Local and Loop I bubbles fill volumes roughly correspond-
ing to the present day observations (Figure 1). The Ovi distribution inside the LB
has been traced by column density measurements through LOS taken from the Sun’s
vantage point, located at (x = 250, y = 450) pc and 90 pc from the interaction re-
gion between the Local and Loop I bubbles (Figure 1). The main results of these
LOS observations are: (1) N(Ovi) in the simulated bubble grows with time as a re-
sult of Ovii recombination (with delayed recombination playing a role) reaching the
N(Ovi) values observed with FUSE; (2) Only for 0.6 < ∆tS N ≤0.9 Myr (since the last
SN occurrence in the cavity) the simulated average and maximum N(Ovi) are within
the minimum and maximum observed column densities by FUSE (Oegerle et al. 2005;
Savage & Lehner 2006; Dowen et al. 2008); (3) The number of lines of sight with
1012 < N(Ovi) < 1013 cm−2 increase with time towards 88% at ∆tS N = 0.9 Myr since
the last SN occurrence; (4) a fragmenting LB shell is consistent with spectral variations
in the ROSAT R1 and R2 bands (Breitschwerdt et al. 2000).
This work strengthens the importance of taking into account all the relevant atomic
processes within a self-consistent evolutionary picture of the Local Bubble in particular,
and of the interstellar medium in general.
Acknowledgments.
Research funded by FCT project PTDC/CTE-AST/70877/2006.
References
Asplund, M., Grevesse, N., Sauval, A. J., & Scott, P. 2009, ARA&A, 47, 481
Avillez, M., & Breitschwerdt, D. 2009, ApJL, 697, 158
Breitschwerdt, D., Freyberg, M. J., & Egger, R. 2000, A&A, 361, 303
Dowen, D. V., Jenkins, E. B., Tripp, T. M., Sembach, K. R., & et al. 2008, ApJS, 176, 59
Egger, R. 1998, IAU Colloq. 166, 506, 287
Fuchs, B., Breitschwerdt, D., Avillez, M., Dettbarn, C., & Flynn, C. 2006, MNRAS, 373, 993
Oegerle, W. R., Jenkins, E. B., Shelton, R. L., Bowen, D. V., & Chayer, P. 2005, ApJ, 622, 377
Savage, B. D., & Lehner, N. 2006, ApJS, 162, 134