See it to Place it: Evolving Macro Placements with Vision-Language Models
We propose using Vision-Language Models (VLMs) for macro placement in chip floorplanning, a complex optimization task that has recently shown promising advancements through machine learning methods. Because human designers rely heavily on spatial rea…
Authors: Ikechukwu Uchendu, Swati Goel, Karly Hou
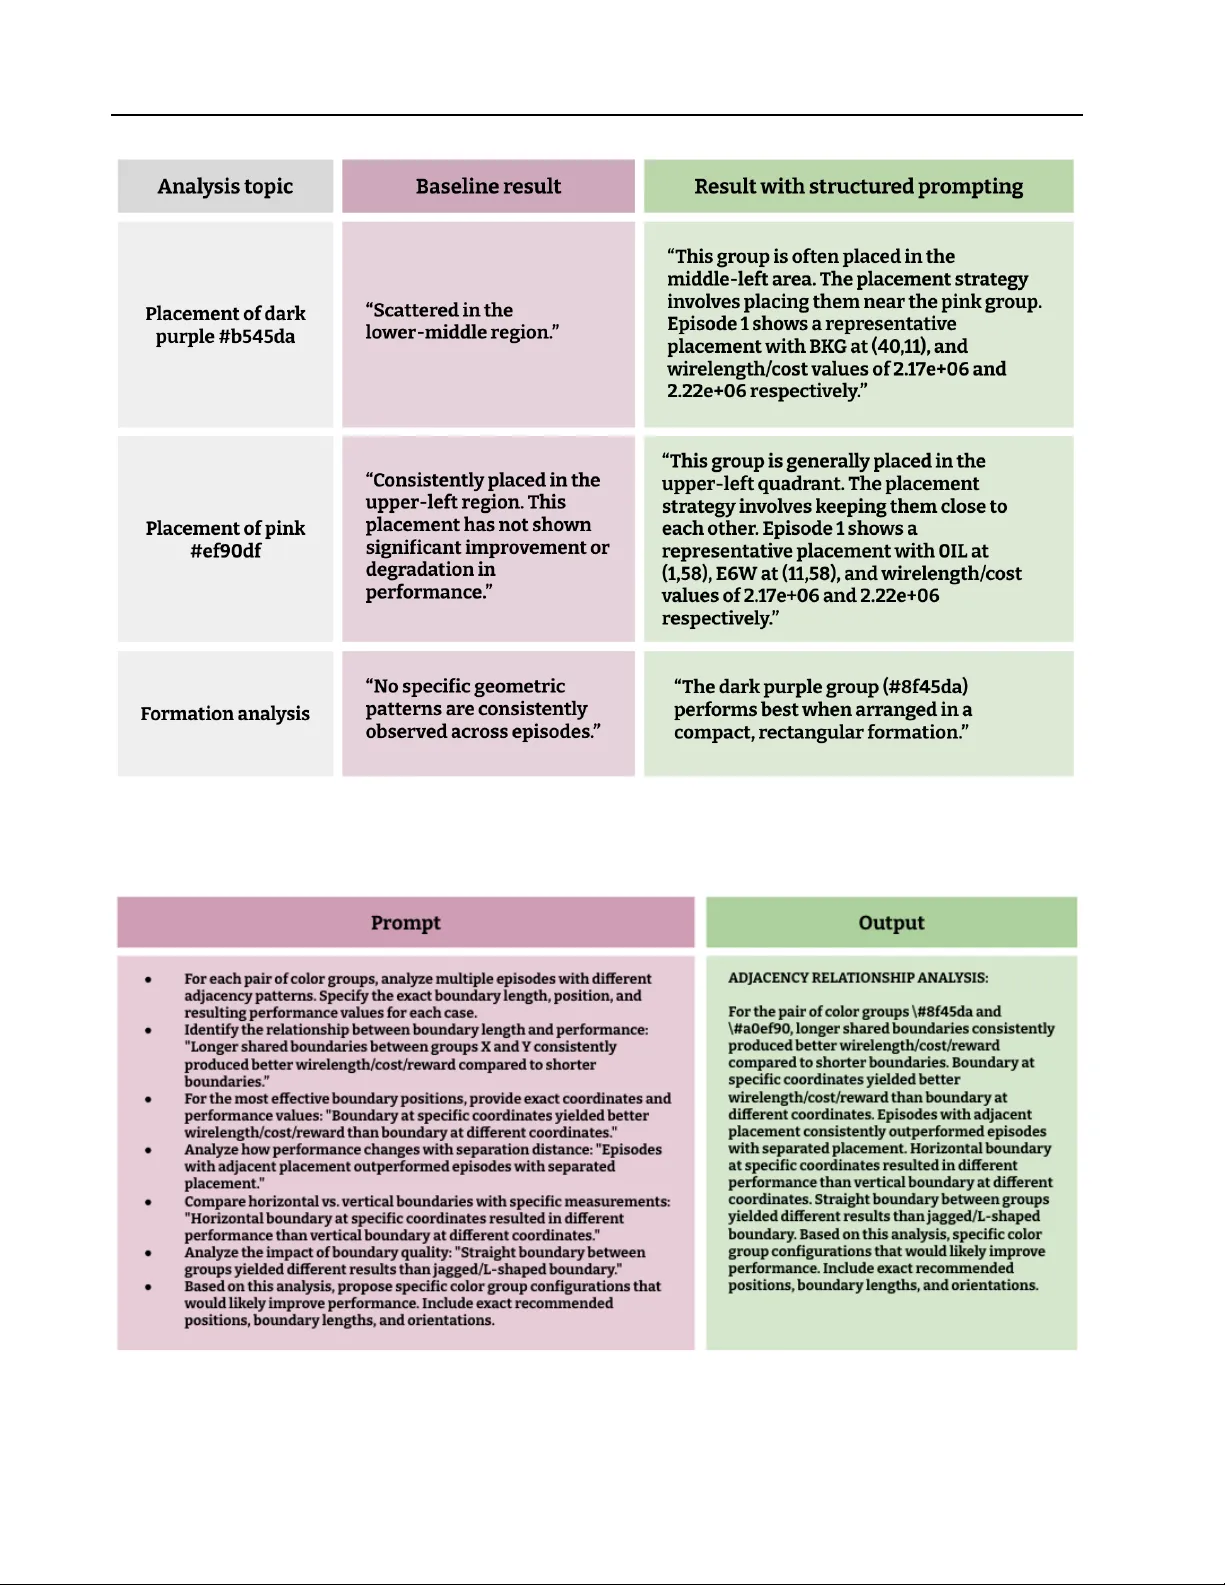
See it to Place it: Evolving Macr o Placements with V ision-Language Models Ikechukwu Uchendu * 1 2 Swati Goel 1 Karly Hou 1 Ebrahim Songhori † 3 Kuang-Huei Lee 3 Joe W enjie Jiang 3 V ijay Janapa Reddi 1 V incent Zhuang † 3 Abstract W e propose using V ision-Language Models (VLMs) for macro placement in chip floorplan- ning, a complex optimization task that has re- cently shown promising advancements through machine learning methods. Because human de- signers rely heavily on spatial reasoning to ar- range components on the chip canv as, we hypoth- esize that VLMs with strong visual reasoning abil- ities can ef fectiv ely complement existing learning- based approaches. W e introduce V eoPlace (V isual Evolutionary Optimization Placement), a novel framew ork that uses a VLM—without an y fine- tuning—to guide the actions of a base placer by constraining them to subregions of the chip can- v as. The VLM proposals are iterativ ely optimized through an e volutionary search strategy with re- spect to resulting placement quality . On open- source benchmarks, V eoPlace outperforms the best prior learning-based approach on 9 of 10 benchmarks with peak wirelength reductions e x- ceeding 32%. W e further demonstrate that V eo- Place generalizes to analytical placers, improv- ing DREAMPlace performance on all 8 e valuated benchmarks with gains up to 4.3%. Our approach opens new possibilities for electronic design au- tomation tools that leverage foundation models to solve comple x physical design problems. 1. Introduction Computer chip floorplanning is a critical step in the in- tegrated circuit design process, in v olving the strategic ar - rangement of macros on the chip can vas. Determining the optimal placement is a comple x multi-objectiv e problem, in which performance, power , and area (PP A) must be opti- * W ork done partly as a Student Researcher at Google. † W ork done while at Google DeepMind. 1 Harvard Uni versity , Cambridge, MA, USA 2 Kempner Institute for the Study of Natural and Ar - tificial Intelligence, Harvard University , Cambridge, MA, USA 3 Google DeepMind. Correspondence to: Ikechukwu Uchendu < iuchendu1@gmail.com > . Pr eprint. Mar ch 31, 2026. mized while minimizing routing congestion. The vast com- binatorial design space makes manual chip floorplanning a time-consuming and expertise-driv en task while posing a significant challenge for automated methods. A variety of approaches ha ve been proposed for automated chip floorplanning, including black-box optimization ( Shi et al. , 2023 ), analytical methods ( Lin et al. , 2019 ; Cheng et al. , 2018 ; Lu et al. , 2015 ), and learning-based meth- ods ( Mirhoseini et al. , 2021 ; Lai et al. , 2022 ; 2023 ; Lee et al. , 2024 ). Among these, learning-based approaches have achiev ed state-of-the-art performance, but ha ve a se vere limitation: policies trained from scratch struggle to gen- eralize to unseen chips without additional interaction, an issue exacerbated by the limited training data av ailable in chip design. In contrast, human designers lev erage high- lev el prior kno wledge and spatial reasoning to efficiently tackle new design spaces. Our work aims to bridge this gap by harnessing V ision-Language Models (VLMs) to pro- vide human-like spatial reasoning and guide the exploration of existing placement algorithms. While human design- ers dev elop placement intuition ov er years of experience, VLMs can rapidly extract spatial patterns from dozens of prior placements and their e valuations simultaneously—a form of in-context learning that exceeds what an y indi vidual designer can process at once. Existing learning-based approaches first pre-train models on a set of training chips, then fine-tune on sampled placements from unseen chips ( Mirhoseini et al. , 2021 ; Lai et al. , 2022 ; 2023 ). W e consider a general formulation of this setup: for an unseen block and a fixed budget of B placement attempts, what is the best possible placement that can be generat ed? W e posit that ef ficiently using this b udget of online attempts requires spatial reasoning as well as learning from prior attempts, both of which hav e been exhibited by modern VLMs. W e introduce V eoPlace (V isual Ev olutionary Optimization Placement), a nov el framework that uses a high-le vel VLM planner to guide a low-le vel placer by constraining it to promising regions. Crucially , these VLM proposals are iterativ ely refined through an ev olutionary process, as vi- sualized in Figure 1 . V eoPlace requires no fine-tuning of the VLM (we use the public Gemini models ( T eam et al. , 1 See it to Place it: Evolving Macro Placements with VLMs F igur e 1. V eoPlace framework ov erview . The VLM suggests placement regions (1-2) to constrain a low-le vel placer (3) for macro placement (4). A history buffer that stores the existing population of placements (5) facilitates evolutionary in-context improv ement, creating a feedback loop to improv e placement quality . 2023 )) and uses an independent low-le vel placer (e.g. ChiP- Former ( Lai et al. , 2023 )). On open-source benchmarks (ISPD 2005 ( Nam et al. , 2005 ), ICCAD 2004 ( Adya & Markov , 2002 ; Adya et al. , 2004 ), and Ariane ( OpenHW Group , 2024 )), V eoPlace outperforms ChiPFormer on 9 of 10 benchmarks with peak wirelength reductions e xceeding 32%. Furthermore, we show V eoPlace generalizes to analyt- ical placers, improving DREAMPlace performance on all eight ICCAD 2015 Superblue benchmarks with gains up to 4.3%. Our main contributions are: • Unified VLM-guided placement framework : W e intro- duce V eoPlace, the first framework to sho w that foun- dation models can guide specialized placement algo- rithms via spatial reasoning, without requiring fine-tuning. W e demonstrate two instantiations: action masking for learning-based policies and soft anchor constraints for analytical placers. • State-of-the-art results across placement paradigms : V eoPlace beats DREAMPlace 4.3.0 on all eight ICCAD 2015 Superblue benchmarks (up to 4.3%) and outper- forms ChiPFormer on 9 of 10 benchmarks (up to 32%), demonstrating that VLM guidance generalizes across fun- damentally different placement approaches. Practically , V eoPlace serves as a plug-in enhancement for existing placement workflo ws: engineers can wrap their current placer with VLM guidance to improve placement quality without retraining models or modifying their design flow . T able 1. Comparison of e xisting macro placement approaches. Our VLM-based approach represents a novel direction in the field. RL: Reinforcement Learning, MCTS: Monte Carlo Tree Search, IL: Imitation Learning, BBO: Blackbox Optimization, VLM: V ision- Language Model, LLM: Large Language Model. Method Category SP-SA ( Murata et al. , 2002 ) Packing NTUPlace3 ( Chen et al. , 2008 ) Analytical RePlace ( Cheng et al. , 2018 ) Analytical DREAMPlace ( Lin et al. , 2019 ) Analytical GraphPlace ( Mirhoseini et al. , 2021 ) RL DeepPR ( Cheng & Y an , 2021 ) RL MaskPlace ( Lai et al. , 2022 ) RL EfficientPlace ( Geng et al. , 2024 ) RL + MCTS ChiPFormer ( Lai et al. , 2023 ) IL W ireMaskBBO ( Shi et al. , 2023 ) BBO EvoPlace ( Y ao et al. , 2025 ) LLM + Analytical V eoPlace (Ours) VLM + IL VLM + Analytical 2. Related W ork V ision-Language Models for Decision-Making . V ision- Language Models (VLMs) are trained on vast datasets of text and images, and therefore contain rich priors v aluable for tasks requiring both vision and language ( Driess et al. , 2023 ). The use of VLMs to perform decision-making has been e xplored in sev eral fields, including robotics, where VLMs interpret natural language commands within a vi- sual scene to guide robot actions or planning ( Ahn et al. , 2022 ; Jiang et al. , 2022 ; Shridhar et al. , 2022 ; Huang et al. , 2022 ; Brohan et al. , 2023 ; Kim et al. , 2024 ; T eam et al. , 2 See it to Place it: Evolving Macro Placements with VLMs 2025 ; Liang et al. , 2024 ). Systems such as SayCan ( Ahn et al. , 2022 ) and R T -2 ( Brohan et al. , 2023 ) demonstrate ho w VLMs can translate high-le vel instructions into actionable plans that low-le vel controllers can e xecute. Our work le verages these VLM capabilities in a similar hi- erarchical approach. The VLM perceiv es chip placement images along with their performance metrics, analyzes spa- tial arrangements, and provides high-level guidance to a low-le vel placer in the form of suggested bounding regions for each macro. These bounding regions constrain the lo w- lev el placer , effecti vely creating a division of labor where the VLM handles high-le vel spatial reasoning while a spe- cialized placer executes precise placement decisions within these constraints. A utomated Chip Floorplanning . Automating computer chip floorplanning has been studied through various ap- proaches (T able 1 ), including analytical methods ( Lin et al. , 2019 ), black-box optimization techniques such as simu- lated annealing ( W ong & Liu , 1986 ) and genetic algorithms ( Singha et al. , 2012 ), more recent guided black-box meth- ods ( Shi et al. , 2023 ), and various learning-based methods ( Mirhoseini et al. , 2021 ; Lai et al. , 2023 ; Geng et al. , 2024 ). W ithin the learning-based category , a prominent line of w ork formulates chip floorplanning as a reinforcement learning (RL) problem where macros are sequentially placed onto a chip can vas ( Mirhoseini et al. , 2021 ; Lai et al. , 2022 ; 2023 ). Alternati vely , recent works have proposed learning to refine existing chip floorplans, employing techniques such as diffu- sion models ( Lee et al. , 2024 ) or RL algorithms ( Xue et al. , 2024 ) for post-processing. Our approach can be vie wed as a generalization of learning-based approaches (and can explic- itly lev erage them in the inner loop) by using a high-le vel VLM to guide them at test-time. Pairing LLMs with Evolution. Pairing LLMs with e vo- lutionary search has achie ved success in fields such as pro- gram generation ( Romera-Paredes et al. , 2024 ; Hemberg et al. , 2024 ; Li ventse v et al. , 2023 ), planning and reason- ing ( Lee et al. , 2025 ), scientific disco very ( Y amada et al. , 2025 ; Gottweis et al. , 2025 ), robotics ( Nasiriany et al. , 2024 ), and chip design ( Noviko v et al. , 2025 ; Y ao et al. , 2025 ; Xue et al. , 2024 ; Shi et al. , 2023 ). Most relev ant to our work, Ev oPlace ( Y ao et al. , 2025 ) uses LLMs to ev olve the optimization algorithm code within an analytical placer . In contrast, V eoPlace uses a VLM to e volve the placement solutions directly , suggesting where macros should go based on visual reasoning over prior placements. These sugges- tions are e valuated, and high-performing ones are selected to inform the VLM’ s next generation of proposals, gi ven feedback from an objectiv e function. Our selection strat- egy samples a population of high-performing, geometrically similar placements. That is, V eoPlace e xplicitly focuses on ev olution in a local region, a principle that has been shown to be effecti ve in sparse Gaussian processes ( W ei et al. , 2024 ) and island models in genetic algorithms ( Romera-P aredes et al. , 2024 ; Lee et al. , 2025 ; T anese , 1989 ; Cant ´ u-Paz et al. , 1998 ). 3. Preliminaries Macro Placement. W e consider macro placement in chip floorplanning, where a set of macr os M = { m 1 , . . . , m N } , defined by their dimensions and connectivity , are placed on a 2D chip canvas . Connecti vity is given by a netlist G = ( M , E ) , a hypergraph where each hyperedge ( net ) connects a subset of macros. The objectiv e is to find a placement P = { p 1 , . . . , p N } , where p i is the bottom-left corner of macro m i , that minimizes estimated wirelength. This is the total length of wiring needed to connect the components (macros and standard cells) within each net, and is a crucial metric for a chip’ s performance, power , and area (PP A) ( Lin et al. , 2019 ; Mirhoseini et al. , 2021 ). Macro placement is formulated as a sequential decision-making problem, a Markov Deci sion Pro- cess (MDP) ( Mirhoseini et al. , 2021 ; Lai et al. , 2023 ; 2022 ). In this setup, macros are sequentially placed onto the canv as, typically following a predefined order such as descending macro area. The state s t encompasses information about the current partial placement (locations of macros m 1 , . . . , m t − 1 ), features of the current macro m t , and potentially structural information deriv ed from the netlist G . T o manage the continuous placement space, the can vas is discretized into a grid of cells, where an action a t selects a specific grid cell for the reference point (e.g., the bottom-left corner) of the current macro, m t . After all N macros are placed, a terminal rew ard R is computed based on the final Half-Perimeter W irelength (HPWL). The total HPWL is the sum of the half-perimeters of the smallest axis-aligned bounding box for each net in the netlist G . The agent’ s goal is to learn a policy π ( a t | s t ) that maximizes the expected terminal rew ard E [ R ] (or , equiv alently , minimizes HPWL). Inference-time Optimization. Online RL requires many en vironment interactions and model updates to produce op- timal placements for new netlists. Recent work suggests that offline RL pre-training provides strong zero-shot per- formance but benefits from fine-tuning on a small amount of online interaction ( Lai et al. , 2023 ). W e consider an inference-time optimization setting that uses a hierarchi- cal approach : we are allo wed a fixed b udget of placement ev aluations, b ut do not fine-tune either the VLM (our high- lev el strategic guide) or the lo w-lev el placer . As Section 5 shows, V eoPlace can achie ve results superior to fine-tuning, suggesting greater efficienc y on new tasks. 3 See it to Place it: Evolving Macro Placements with VLMs Analytical Placer . Analytical placers formulate place- ment as a nonlinear optimization problem, minimizing wire- length subject to density constraints. W e use DREAM- Place ( Lin et al. , 2019 ), a state-of-the-art GPU-accelerated analytical placer . In our framew ork, we guide DREAM- Place by incorporating VLM suggestions as soft anchor constraints in the optimization objective, pulling macros tow ard suggested tar get locations while still allo wing the solver to find globally optimal arrangements. Learning-Based Placer . ChiPF ormer ( Lai et al. , 2023 ) is an autore gressiv e Transformer that formulates macro placement as of fline reinforcement learning via a Decision T ransformer objectiv e ( Chen et al. , 2021 ; Lee et al. , 2022 ), achieving state-of-the-art performance across multiple chip designs. W e adopt it as our learning-based low-le vel placer due to its multi-task generality . Crucially , ChiPFormer out- puts a probability distribution ov er grid cells for each macro. In our frame work, the VLM constrains this distrib ution by masking out regions outside its suggested placement areas, steering the policy toward better design choices without requiring any fine-tuning. 4. Method In this section, we describe V eoPlace, our nov el e volution- ary frame work that harnesses the spatial reasoning of VLMs for chip floorplanning. The framework iterati vely e volv es a population of placements, using a VLM as a variation oper- ator . The VLM generates region proposals based on prior attempts, providing spatial guidance to a lo w-lev el placer— either as soft anchor constraints for analytical placers or action masks for learning-based policies. As illustrated in Figure 1 and Algorithm 1 , we b uild a context from the his- tory b uffer and query the VLM for re gion suggestions (lines 3–5), then use these suggestions to constrain the lo w-lev el placer as it generates a complete floorplan (line 9). High- performing placements are stored in the history buf fer (line 12), creating an ev olutionary feedback loop that continu- ously improv es placement quality . 4.1. VLM and Low-Lev el Placer Interface The manner in which VLM suggestions are incorporated depends on the low-le vel placer: for analytical placers, sug- gestions become soft anchor constraints in the optimization objectiv e; for learning-based policies, suggestions mask the action space to constrain sampling. W e demonstrate V eo- Place with both approaches. Algorithm 1 summarizes the ov erall procedure, while P L AC E M AC RO S is instantiated for analytical and learning-based placers in Algorithms 2 and 3 , respectively . In both paradigms, we alternate between unguided and VLM-guided rollouts: 8 episodes sample the base placer directly , then 8 episodes use VLM guid- Algorithm 1 V eoPlace Require: V : VLM; P : Low-lev el placer; G: Netlist C : Context length; E : Episodes; K : VLM query interval 1: Initialize population H ← ∅ 2: for e = 1 to E do 3: if e mo d K = 0 then 4: context ← B U I L D C O N T E X T ( H, C ) 5: S ← V ( context , G ) { VLM suggestions } 6: else 7: S ← ∅ 8: end if 9: P e ← P L A C E M AC R O S ( G, S ) 10: P e ← L E G A L I Z E ( P e ) 11: H ← H ∪ { ( P e , HPWL ( P e )) } 12: end for 13: return H Algorithm 2 P L AC E M AC RO S (Analytical) Require: G: Netlist; S : VLM suggestions (possibly empty) 1: if S = ∅ then 2: Solve standard DREAMPlace objecti ve to obtain P 3: else 4: Con vert each s i ∈ S to anchor ˆ x i 5: Solve anchored objecti ve with A to obtain P 6: end if 7: return P Algorithm 3 P L AC E M AC RO S (Learned) Require: π : Policy; G: Netlist; S : VLM suggestions 1: Order macros by connectivity , size 2: Initialize P ← ∅ 3: for macro m t do 4: if S provides valid suggestion s t then 5: p t ∼ π ( ·| m t , P, s t ) 6: else 7: p t ∼ π ( ·| m t , P ) 8: end if 9: P ← P ∪ { ( m t , p t ) } 10: end for 11: return P ance. Since the VLM API returns 8 candidate suggestions per query , we require one API call for e very 8 guided roll- outs. W ith 2,000 total rollouts and half of them guided, this amounts to just 125 API calls. After each full placement, we legalize placement P using DREAMPlace’ s built-in le- galizer to ensure a valid macro and standard-cell placement. 4 . 1 . 1 . G U I D I N G A N A L Y T I C A L P L AC E R S For analytical placers, we interpret VLM suggestions as target macro locations. Let x denote macro locations, y denote standard-cell locations, E denote the set of nets, and M denote the set of macros. The standard DREAMPlace objectiv e is min x,y X e ∈ E WL( e ; x, y ) + λ D ( x, y ) , (1) where D is the density penalty . W e incorporate VLM sug- gestions by adding an anchor term with weight λ A : min x,y X e ∈ E WL( e ; x, y ) + λ D ( x, y ) + λ A A ( x ; { ˆ x i } ) , (2) 4 See it to Place it: Evolving Macro Placements with VLMs where A penalizes distance from each macro i to its sug- gested location ˆ x i . W e con vert the VLM’ s bounding box suggestion to an anchor point by taking the bottom-left corner of the region as ˆ x i . W e use a quadratic anchor: A ( x ; { ˆ x i } ) = X i ∈ M ∥ x i − ˆ x i ∥ 2 2 , (3) which pulls macros to ward the suggested targets. The weight λ A controls the strength of VLM guidance, where λ A = 0 recov ers unconstrained DREAMPlace. DREAM- Place solves this anchored optimization where macros are softly pulled tow ard VLM targets (visualized in Figure 2 ). 4 . 1 . 2 . G U I D I N G L E A R N I N G - B A S E D P L A C E R S For learning-based policies, we use a stochastic lo w-lev el placement policy , π , that parameterizes a probability dis- tribution over grid locations to place the next macro. For learning-based policies (Algorithm 3 ), macros are placed sequentially , ordered by connectivity then size, ensuring that the largest and most highly connected macros are placed first. The VLM suggests bounding box regions { s 1 , ..., s N } on the chip can v as for the respecti ve macros (visualized in Figure 5 ). V eoPlace then rolls out the low-le vel polic y , but constrains its actions at each timestep t to the suggested region s t , de- noted by π ( ·| m t , P e , s t ) (Algorithm 3 ). This is practically achiev ed by masking the policy’ s output logits outside of s t before sampling. This constrains π to place m t within the area identified as promising by the VLM, while still retain- ing control over the e xact placement coordinates within the region. Because the low-le vel policy autoregressi vely places macros, a VLM suggestion s t may be inv alid for any t > 1 due to already-placed macros ov erlapping the region. In this case, the macro m t is placed by sampling from the orig- inal, unconstrained policy distribution, p t ∼ π ( ·| m t , P e ) . Empirically , this fallback is triggered for ∼ 20% of sugges- tions once ev olution stabilizes (Figure 4d ). Finally , after each placement P e is completed, its quality (e.g., H P W L e ) is calculated and the pair ( P e , H P W L e ) is added to the population H . 4.2. Structured Pr ompt V eoPlace prompts a VLM to generate bounding box sug- gestions for each macro { s 1 , ..., s N } conditioned on pre vi- ous placements and their ev aluations { P i } . W e generate suggestions for all macros simultaneously to reduce VLM inference. The prompt’ s key characteristics are (1) its struc- ture, which elicits spatial reasoning, and (2) the selection of in-context e xamples (detailed in Section 4.3 , with a full example in Appendix E.1 ). W e find that VLMs struggle with macro placement due to information ov erload and a lack of domain-specific kno wl- edge, often producing inconsistent or imprecise spatial sug- gestions without proper guidance (see Appendix E.3 ). Our structured prompt guides the VLM with clear objectiv es, constraints, and a standardized format (T able 2 ), transform- ing its general visual reasoning into useful spatial guidance. T o ensure generalizability and a void o verfitting, we de vel- oped the structure and syntax of our prompt exclusi vely on the adaptec1 benchmark to ensure valid spatial rea- soning, applying the final version to all other benchmarks without modification. T able 2. Components of the structured prompt for V eoPlace. Component Description Grid Repr . • 84 × 84 grid for ChiPFormer experiments (matching ( Lai et al. , 2023 )); 512 × 512 grid for DREAMPlace experiments. • Macros positioned by bottom-left corner coor - dinates. • Origin (0,0) at the bottom-left. V isual Repr . • Image of can v as sho wing placed macros and colors. • V isual conte xt for spatial relationships and pat- terns. Context • Grid specs and macro properties (dimensions, color). • History of prior placements with performance metrics. • Current state (locations) of placed macros. 4.3. Context Selection Strategies for Ev olution The core component of our e volutionary algorithm is prompting the VLM to generate a superior placement sug- gestion gi ven a set of prior placements and their e valuations. Because each placement uses hundreds of tokens, only a small number can be provided to the model while maintain- ing reasonable inference cost. Giv en this limited budget, the examples should be (1) high-quality , so the model improv es upon good placements, and (2) informati ve enough for the model to ef fecti vely deduce better placements via reasoning. W e compare multiple context selection strategies (FIFO, Random, Best, Di verse, T op Stratified) in Section 5.3 . W e use T op Stratified as our default because it balances explo- ration (sampling across clusters) with e xploitation (fav oring high-performing placements within a promising cluster). 5. Experiments W e design experiments to address tw o key questions: (Q1) Can VLM guidance improv e the placement quality of both 5 See it to Place it: Evolving Macro Placements with VLMs F igur e 2. VLM guidance visualization on superblue1 . Left: Final macro placement produced by V eoPlace + DREAMPlace 4.3.0. Right: The same placement with VLM-suggested regions overlaid. The VLM proposes tar get positions for each macro, and DREAMPlace’ s loss function is modified with anchor weights to keep macros close to VLM suggestions while allowing standard cells to optimize freely (standard cells remov ed for visual clarity). learning-based policies and analytical placers using only inference-time computation? (Q2) Which V eoPlace design choices (anchor weight, context selection strategy , context length, prompt strategy , and input modality) most af fect performance? 5.1. Experimental Setup For both e xperimental tracks, V eoPlace generates an equal number of guided and unguided rollouts in each batch: 8 episodes from directly sampling the base placer, and 8 episodes guided by VLM suggestions (see Appendix T able 7 for Gemini sampling parameters). For all benchmarks, the VLM provides suggestions for at most 256 macros, match- ing the maximum number of macros placed by ChiPFormer . When a circuit contains more than 256 macros, we select the top 256 ordered by descending area, using connecti vity (number of pin connections) to break ties, so that the largest and most interconnected macros recei ve VLM guidance first (see T able 5 for benchmark statistics). 5 . 1 . 1 . A N A L Y T I C A L P L AC E R W e ev aluate on the ICCAD 2015 Superblue bench- marks ( Kim et al. , 2015 ) using DREAMPlace 4.3.0 ( Lin et al. , 2019 ) as the base placer . As described in Section 4.1.1 , VLM suggestions are incorporated as soft anchor constraints in the DREAMPlace optimization objecti ve. For DREAM- Place, each rollout corresponds to a run with a dif ferent random seed/initialization. W e discretize the can vas to a 512 × 512 grid for VLM suggestions and use Gemini 2.5 Flash with C =25 context examples. All e xperiments run 2,000 rollouts across three seeds and report global HPWL (see Section C.3.1 for full hyperparameters). 5 . 1 . 2 . L E A R N I N G - B A S E D P L A C E R W e ev aluate on open-source chip benchmarks from the ISPD 2005 challenge ( Nam et al. , 2005 ) and ICCAD 2004 ( Adya & Markov , 2002 ; Adya et al. , 2004 ), following ( Lai et al. , 2023 ), and the Ariane RISC-V CPU ( OpenHW Group , 2024 ). These benchmarks vary in complexity , with hun- dreds to thousands of macros and up to hundreds of thou- sands of standard cells. W e train ChiPFormer from scratch using the public repository 1 and use an 84 × 84 grid to match its original setup. W e use Gemini 2.5 Flash with C =1 , as ev en a single in-context example is enough t o guide ChiP- Former to better solutions. W e run 2,000 rollouts across three seeds (further details in Section C.2.2 ; see Figure 5 for a visualization of VLM-guided placement). Our setup dif fers from ( Lai et al. , 2023 ) in two aspects. (1) During the ev olutionary search, we cluster standard cells for faster reward computation, follo wing prior work ( Mirhoseini et al. , 2021 ; Lee et al. , 2024 ), but report unclustered results for final ev aluation. (2) During final evaluation, macro locations are fixed and DREAMPlace is used only to place standard cells around them, matching ( Mirhoseini et al. , 2021 ). Empirically , allo wing mov able macros results in significant changes to their final placements, confounding the actual efficac y of the base placer (see Figure 7 ). 5.2. Q1: Does VLM Guidance Improv e Placement Quality? Analytical Placers. As sho wn in T able 3 , V eoPlace out- performs DREAMPlace 4.3.0 on all eight Superblue bench- marks, with improv ements ranging from 1.3% to 4.3% (su- perblue7). Figure 3 visualizes example placements compar- ing V eoPlace to DREAMPlace. W e also report a congestion proxy (R UD Y) in T able 12 ; dif ferences are minor , suggest- ing that V eoPlace improv es wirelength without negati vely affecting routability . W e analyze the sensitivity to anchor weight, context selection strategy , and context length in Section 5.3 . Learning-Based Placers. Our e valuation against ChiP- Former baselines demonstrates that V eoPlace consistently improv es placement quality . W e compare against two strong baselines under the same 2,000-rollout b udget: a version 1 https://github.com/laiyao1/chipformer 6 See it to Place it: Evolving Macro Placements with VLMs superblue1 superblue4 superblue16 F igur e 3. V isual comparison of placements on selected Superblue benchmarks. T op ro w: DREAMPlace 4.3.0. Bottom row: V eoPlace- guided DREAMPlace. Blue clouds are individual standard cells; colored rectangles are macros. V eoPlace guidance improves global HPWL on all eight superblue benchmarks. T able 3. V eoPlace-guided DREAMPlace vs. DREAMPlace 4.3.0 on Superblue. VP+DP = V eoPlace with DREAMPlace; DP = DREAMPlace; 2.5 Flash = Gemini 2.5 Flash. W e report mean and standard error of best global HPWL ( × 10 7 , lower is better) across three random seeds with 2,000 rollouts each. Benchmark VP+DP 2.5 Flash ( C =25 ) DP 4.3.0 superblue1 37.47 ± 0.11 ( − 1.3%) 37.95 ± 0.16 superblue3 42.20 ± 0.05 ( − 2.2%) 43.13 ± 0.17 superblue4 28.85 ± 0.33 ( − 1.3%) 29.24 ± 0.02 superblue5 39.53 ± 0.20 ( − 1.4%) 40.10 ± 0.11 superblue7 54.64 ± 0.31 ( − 4.3%) 57.12 ± 0.20 superblue10 67.84 ± 0.04 ( − 1.3%) 68.72 ± 0.08 superblue16 36.51 ± 0.03 ( − 1.3%) 36.99 ± 0.12 superblue18 21.54 ± 0.14 ( − 2.8%) 22.17 ± 0.05 without fine-tuning (No-FT) that repeatedly samples the fixed ChiPFormer policy , and a version with ChiPF ormer fine-tuning (FT) that adapts the polic y via online Decision T ransformer . As detailed in T able 4 , V eoPlace outperforms ChiPFormer on 9 of 10 benchmarks, with pronounced gains on ibm02 (32%) and ariane136 (26%). 5.3. Q2: Which design choices matter? Beyond the VLM itself, V eoPlace is parameterized by se v- eral design choices. W e study three ke y factors on the superblue1 benchmark (Figure 4 ): anchor weight λ A , context selection strategy , and conte xt length C . W e also ab- late prompt strategy and input modality on superblue1 . Prompt Strategy . W e compare our default prompt ag ainst a Gr eedy v ariant that encourages minor refinements to prior high-performing layouts and an Exploratory variant that pushes for more nov el placements. On superblue1 , the default prompt performs best, achie ving 37 . 47 ± 0 . 11 versus 37 . 51 ± 0 . 09 for Greedy and 37 . 64 ± 0 . 11 for Exploratory (T able 13 ). This suggests that, for DREAMPlace guidance, the best prompt balances exploitation and e xploration rather T able 4. Comparison of V eoPlace (VP) and ChiPFormer (CF). VP+CF = V eoPlace with ChiPF ormer; 2.5 Flash = Gemini 2.5 Flash; No-FT/FT = without/with ChiPFormer fine-tuning. W e report mean and standard error of best global HPWL ( × 10 7 , lo wer is better) across three random seeds with 2,000 rollouts each. Per - centages in the VP+CF column indicate relati ve change versus the better of the tw o ChiPFormer baselines for that benchmark. The best result for each benchmark is bolded. VP+CF 2.5 Flash ChiPFormer Benchmark ( C =1) No-FT FT adaptec1 15.97 ± 0.80 (+12.2%) 14.23 ± 0.77 14.99 ± 0.55 adaptec2 11.82 ± 0.89 ( − 13.8%) 15.03 ± 0.59 13.71 ± 0.33 adaptec3 24.10 ± 0.21 ( − 6.0%) 25.64 ± 0.43 26.31 ± 0.97 adaptec4 19.63 ± 0.20 ( − 8.7%) 22.65 ± 1.69 21.50 ± 0.50 ibm01 0.31 ± 0.01 ( − 22.5%) 0.44 ± 0.04 0.40 ± 0.01 ibm02 0.59 ± 0.01 ( − 32.2%) 0.91 ± 0.02 0.87 ± 0.06 ibm03 0.80 ± 0.02 ( − 16.7%) 1.16 ± 0.10 0.96 ± 0.02 ibm04 0.84 ± 0.00 ( − 12.5%) 1.15 ± 0.06 0.96 ± 0.02 ariane133 0.34 ± 0.02 ( − 24.4%) 0.46 ± 0.00 0.45 ± 0.02 ariane136 0.34 ± 0.02 ( − 26.1%) 0.46 ± 0.01 0.48 ± 0.01 than pushing strongly tow ard either extreme. Input Modality . W e further ablate the prompt by remov- ing either the chip can v as image or the textual context (i.e., exact macro coordinates in te xt) from each in-context ex- ample while keeping the top-stratified strategy and C =25 fixed. The full multimodal prompt performs best, with per- formance degrading slightly without the image and more substantially without the text (T able 14 ). This suggests that textual conte xt is more important for improving upon ex- isting placements. The image conte xt still provides useful information because, without it, the locations of standard cells in each example are unkno wn: there are too many standard cells to enumerate in the textual portion of the prompt. 7 See it to Place it: Evolving Macro Placements with VLMs (a) Anchor weight λ A (b) Context length C (c) Context selection strate gy (d) In valid suggestion rate F igur e 4. Design choice ablations on superblue1 with V eoPlace guiding DREAMPlace 4.3.0. Unless v aried, ablation defaults are: top stratified (TS) strategy , C =10 , λ A =0 . 01 (note: the main Superblue results in T able 3 use C =25 ). (a) Lo wer anchor weights perform best, giving the analytical placer freedom to optimize standard cells around macros. (b) Longer context ( C =25 ) achiev es lower HPWL. (c) All strategies impro ve with further rollouts. (d) For all strategies, in valid suggestion rate con verges to ∼ 20% . Anchor W eight. The anchor weight λ A controls how strongly DREAMPlace is guided toward VLM-suggested positions. As sho wn in Figure 4a , lower weights perform better , with λ A = 0 . 001 achie ving the lo west global HPWL, while λ A ∈ { 0 . 1 , 1 . 0 } degrades performance. Lower an- chor weights allow standard cells to flo w freely around the VLM-suggested macro positions, whereas higher weights ov erly constrain the optimization (see Section A.2.2 for a qualitativ e comparison). W e use λ A = 0 . 01 for the main results in T able 3 ; the ablation sho ws that λ A = 0 . 001 can yield further gains. Context Selection Strategy . W e compare five strate gies for selecting the C in-context examples from the history buf fer: Most Recent (FIFO) : Select the C most recently generated placements from the population. This strategy implements pure e volutionary search, where the VLM observ es a tem- porally ordered sequence of recent attempts. Random : Randomly sample C placements from the pop- ulation b uffer . This provides a baseline that makes no as- sumptions about which examples are most valuable for e vo- lutionary search. Best Perf orming : Select the C placements with the lowest global HPWL from the population to encourage the VLM to replicate successful patterns. Diverse : Represent each placement as a v ector in R 2 T by concatenating the ( x i , y i ) coordinates of its T macros. W e then perform K-means clustering with C clusters on the pop- ulation and select the placement with the best HPWL from each cluster . This promotes geometric di versity across the selected examples while still fa voring high-quality designs. T op Stratified : Represent placements as coordinate v ectors and cluster them by geometric similarity , as in the di verse strategy . W e then focus on a single promising cluster by ranking all clusters by their best global HPWL and sampling one using a rank-based softmax distrib ution (with temper- ature τ = 0 . 43 ). From the selected cluster , we choose the top C performing layouts, supplementing from the nearest clusters by centroid distance if the selected cluster contains fewer than C members. This strategy pro vides a set of ge- ometrically similar examples that represent v ariations of a particular design pattern. As sho wn in Figure 4c , each strategy continues to impro ve ov er rollouts, suggesting V eoPlace is robust to the choice of strategy . Notably , “Best” performs worst, indicating that greedily selecting high-performing placements causes the ev olutionary loop to get stuck in local minima. In valid Suggestion Rate. The VLM does not kno w which low-le vel placer is being used. When it suggests a region that conflicts with already-placed macros, the suggestion is discarded: for learning-based placers, the policy is left unconstrained; for analytical placers, the corresponding an- chor term is remo ved from the loss function. As sho wn in Figure 4d , all strate gies con verge to ∼ 20% in valid sugges- tions, indicating that the VLM learns to propose feasible regions as e volution progresses. Context Length. W e test C ∈ { 1 , 10 , 25 } examples. As shown in Figure 4b , C =25 achiev es lower global HPWL, suggesting that more in-context examples help the VLM bet- ter understand patterns associated with high-quality macro placements. 6. Limitations & Future W ork Our ev aluation focuses on wirelength (global HPWL) as the primary optimization objective. While wirelength is a well-established proxy for circuit quality , high-quality chips require optimizing other important PP A metrics like timing and power . Howe ver , because V eoPlace relies on natural lan- guage prompting rather than a fix ed loss function, additional PP A metrics can be included directly in the VLM’ s prompt, allowing it to reason about trade-offs that are difficult to encode mathematically . Additionally , V eoPlace relies on 8 See it to Place it: Evolving Macro Placements with VLMs VLM API calls, introducing both latency ov erhead and a modest per-run API char ge (see T able 6 and Section B.5.2 ). This ov erhead could be addressed by distilling the VLM’ s placement strategies into a smaller , open-source model. W e view e xtending V eoPlace to multi-objectiv e PP A optimiza- tion and reducing inference cost as promising directions for future work. 7. Conclusion W e proposed V eoPlace, an e volutionary framew ork that lev erages vision-language models to enhance chip floorplan- ning. Through a structured prompting approach that requires no fine-tuning of the VLM, V eoPlace outperforms state- of-the-art learning-based methods and analytical placers, providing a blueprint for integrating VLMs into complex en- gineering workflo ws as high-level strategic guides that pa ve the way for more accessible and po werful computer-aided design. References Adya, S. N. and Markov , I. L. Consistent placement of macro-blocks using floorplanning and standard-cell place- ment. In Pr oceedings of the 2002 international sympo- sium on Physical design , pp. 12–17, 2002. Adya, S. N., Chaturvedi, S., Roy , J. A., Papa, D. A., and Markov , I. L. Unification of partitioning, placement and floorplanning. In IEEE/ACM International Conference on Computer Aided Design, 2004. ICCAD-2004. , pp. 550– 557. IEEE, 2004. Ahn, M., Brohan, A., Bro wn, N., Chebotar , Y ., Cortes, O., David, B., Finn, C., Fu, C., Gopalakrishnan, K., Hausman, K., et al. Do as i can, not as i say: Grounding language in robotic affordances. arXiv preprint , 2022. Brohan, A., Brown, N., Carbajal, J., Chebotar , Y ., Chen, X., Choromanski, K., Ding, T ., Driess, D., Dubey , A., Finn, C., et al. Rt-2: V ision-language-action models transfer web knowledge to robotic control. arXiv pr eprint arXiv:2307.15818 , 2023. Cant ´ u-Paz, E. et al. A surve y of parallel genetic algorithms. Calculateurs par alleles, r eseaux et systems r epartis , 10 (2):141–171, 1998. Chen, L., Lu, K., Rajeswaran, A., Lee, K., Grover , A., Laskin, M., Abbeel, P ., Srini vas, A., and Mordatch, I. De- cision transformer: Reinforcement learning via sequence modeling. Advances in neural information pr ocessing systems , 34:15084–15097, 2021. Chen, T .-C., Jiang, Z.-W ., Hsu, T .-C., Chen, H.-C., and Chang, Y .-W . Ntuplace3: An analytical placer for large- scale mixed-size designs with preplaced blocks and den- sity constraints. IEEE T ransactions on Computer-Aided Design of Inte gr ated Cir cuits and Systems , 27(7):1228– 1240, 2008. Cheng, C.-K., Kahng, A. B., Kang, I., and W ang, L. Replace: Advancing solution quality and routability v alidation in global placement. IEEE T ransactions on Computer -Aided Design of Inte gr ated Cir cuits and Systems , 38(9):1717– 1730, 2018. Cheng, R. and Y an, J. On joint learning for solving place- ment and routing in chip design. Advances in Neural Information Pr ocessing Systems , 34:16508–16519, 2021. Driess, D., Xia, F ., Sajjadi, M. S. M., L ynch, C., Cho wdhery , A., Ichter , B., W ahid, A., T ompson, J., V uong, Q., Y u, T ., Huang, W ., Chebotar , Y ., Sermanet, P ., Duckworth, D., Levine, S., V anhoucke, V ., Hausman, K., T oussaint, M., Gref f, K., Zeng, A., Mordatch, I., and Florence, P . Palm-e: an embodied multimodal language model. In Pr oceed- ings of the 40th International Conference on Machine Learning , ICML ’23. JMLR.or g, 2023. Geng, Z., W ang, J., Liu, Z., Xu, S., T ang, Z., Y uan, M., Hao, J., Zhang, Y ., and W u, F . Reinforcement learning within tree search for fast macro placement. In F orty-first International Confer ence on Machine Learning , 2024. Gottweis, J., W eng, W .-H., Daryin, A., T u, T ., Palepu, A., Sirkovic, P ., Myasko vsky , A., W eissenber ger , F ., Rong, K., T anno, R., et al. T owards an ai co-scientist. arXiv pr eprint arXiv:2502.18864 , 2025. Hagberg, A., Swart, P . J., and Schult, D. A. Exploring network structure, dynamics, and function using net- workx. T echnical report, Los Alamos National Labo- ratory (LANL), Los Alamos, NM (United States), 2008. Hemberg, E., Moskal, S., and O’Reilly , U.-M. Evolving code with a large language model. Genetic Pr ogr amming and Evolvable Machines , 25(2):21, 2024. Huang, W ., Xia, F ., Xiao, T ., Chan, H., Liang, J., Florence, P ., Zeng, A., T ompson, J., Mordatch, I., Chebotar , Y ., et al. Inner monologue: Embodied reasoning through planning with language models. arXiv pr eprint arXiv:2207.05608 , 2022. Jiang, Y ., Gupta, A., Zhang, Z., W ang, G., Dou, Y ., Chen, Y ., Fei-Fei, L., Anandkumar , A., Zhu, Y ., and Fan, L. V ima: General robot manipulation with multimodal prompts. arXiv pr eprint arXiv:2210.03094 , 2(3):6, 2022. Kim, M.-C., Hu, J., Li, J., and V iswanathan, N. Iccad-2015 cad contest in incremental timing-dri ven placement and benchmark suite. In 2015 IEEE/A CM International Con- fer ence on Computer-Aided Design (ICCAD) , pp. 921– 926. IEEE, 2015. 9 See it to Place it: Evolving Macro Placements with VLMs Kim, M. J., Pertsch, K., Karamcheti, S., Xiao, T ., Balakr - ishna, A., Nair , S., Rafailov , R., Foster , E., Lam, G., San- keti, P ., et al. Open vla: An open-source vision-language- action model. arXiv pr eprint arXiv:2406.09246 , 2024. Lai, Y ., Mu, Y ., and Luo, P . Maskplace: Fast chip placement via reinforced visual representation learning. Advances in Neural Information Pr ocessing Systems , 35:24019– 24030, 2022. Lai, Y ., Liu, J., T ang, Z., W ang, B., Hao, J., and Luo, P . Chipformer: T ransferable chip placement via of fline deci- sion transformer . In International Confer ence on Machine Learning , pp. 18346–18364. PMLR, 2023. Lee, K.-H., Nachum, O., Y ang, M. S., Lee, L., Free- man, D., Guadarrama, S., Fischer , I., Xu, W ., Jang, E., Michale wski, H., et al. Multi-game decision transformers. Advances in Neural Information Pr ocessing Systems , 35: 27921–27936, 2022. Lee, K.-H., Fischer , I., W u, Y .-H., Marwood, D., Baluja, S., Schuurmans, D., and Chen, X. Evolving deeper llm thinking. arXiv pr eprint arXiv:2501.09891 , 2025. Lee, V ., Deng, C., Elzeiny , L., Abbeel, P ., and W awrzynek, J. Chip placement with dif fusion. arXiv pr eprint arXiv:2407.12282 , 2024. Liang, J., Xia, F ., Y u, W ., Zeng, A., Arenas, M. G., Attarian, M., Bauza, M., Bennice, M., Bewle y , A., Dostmohamed, A., et al. Learning to learn faster from human feedback with language model predictive control. arXiv pr eprint arXiv:2402.11450 , 2024. Lin, Y ., Dhar, S., Li, W ., Ren, H., Khailany , B., and Pan, D. Z. DREAMPlace: Deep Learning T oolkit- Enabled GPU Acceleration for Modern VLSI Place- ment. In Pr oceedings of the 56th Annual Design A u- tomation Confer ence 2019 , pp. 1–6, Las V egas NV USA, June 2019. A CM. ISBN 978-1-4503-6725-7. doi: 10.1145/3316781.3317803. URL https://dl.acm. org/doi/10.1145/3316781.3317803 . Liv entsev , V ., Grishina, A., H ¨ arm ¨ a, A., and Moonen, L. Fully autonomous programming with large language mod- els. In Pr oceedings of the Genetic and Evolutionary Computation Confer ence , pp. 1146–1155, 2023. Lu, J., Chen, P ., Chang, C.-C., Sha, L., Huang, D. J.-H., T eng, C.-C., and Cheng, C.-K. eplace: Electrostatics- based placement using fast fourier transform and nes- terov’ s method. ACM T ransactions on Design A utomation of Electr onic Systems (TOD AES) , 20(2):1–34, 2015. Mirhoseini, A., Goldie, A., Y azgan, M., Jiang, J. W ., Songhori, E., W ang, S., Lee, Y .-J., Johnson, E., Pathak, O., and Nova, A. A graph placement methodology for fast chip design. Nature , 594(7862):207–212, 2021. Murata, H., Fujiyoshi, K., Nakatake, S., and Kajitani, Y . Vlsi module placement based on rectangle-packing by the sequence-pair . IEEE T r ansactions on Computer -Aided Design of Inte grated Cir cuits and Systems , 15(12):1518– 1524, 2002. Nam, G.-J., Alpert, C. J., V illarrubia, P ., Winter , B., and Y ildiz, M. The ispd2005 placement contest and bench- mark suite. In Pr oceedings of the 2005 international symposium on Physical design , pp. 216–220, 2005. Nasiriany , S., Xia, F ., Y u, W ., Xiao, T ., Liang, J., Dasgupta, I., Xie, A., Driess, D., W ahid, A., Xu, Z., et al. Pi vot: It- erativ e visual prompting elicits actionable knowledge for vlms. In International Confer ence on Machine Learning , pp. 37321–37341. PMLR, 2024. Noviko v , A., V u, N., Eisenberger , M., Dupont, E., Huang, P .-S., W agner , A. Z., Shirobok ov , S., K ozlovskii, B., Ruiz, F . J. R., Mehrabian, A., Kumar , M. P ., See, A., Chaud- huri, S., Holland, G., Davies, A., Now ozin, S., K ohli, P ., and Balog, M. AlphaEv olve: A coding agent for scien- tific and algorithmic discovery . T echnical report, Google Deepmind, 2025. OpenHW Group. CV A6 RISC-V CPU. https:// github.com/openhwgroup/cva6 , 2024. Romera-Paredes, B., Barekatain, M., Novik ov , A., Balog, M., Kumar , M. P ., Dupont, E., Ruiz, F . J., Ellenberg, J. S., W ang, P ., Fa wzi, O., et al. Mathematical disco veries from program search with large language models. Natur e , 625 (7995):468–475, 2024. Rousseeuw , P . J. Silhouettes: a graphical aid to the inter - pretation and validation of cluster analysis. Journal of computational and applied mathematics , 20:53–65, 1987. Shi, Y ., Xue, K., Lei, S., and Qian, C. Macro placement by wire-mask-guided black-box optimization. Advances in Neural Information Pr ocessing Systems , 36:6825–6843, 2023. Shridhar , M., Manuelli, L., and Fox, D. Cliport: What and where pathways for robotic manipulation. In Confer ence on r obot learning , pp. 894–906. PMLR, 2022. Singha, T ., Dutta, H., and De, M. Optimization of floor- planning using genetic algorithm. Pr ocedia T echnolo gy , 4:825–829, 2012. T anese, R. Distributed g enetic algorithms for function opti- mization . Uni versity of Michigan, 1989. T eam, G., Anil, R., Bor geaud, S., Alayrac, J.-B., Y u, J., Sori- cut, R., Schalkwyk, J., Dai, A. M., Hauth, A., Millican, K., et al. Gemini: a family of highly capable multimodal models. arXiv pr eprint arXiv:2312.11805 , 2023. 10 See it to Place it: Evolving Macro Placements with VLMs T eam, G. R., Abeyruwan, S., Ainslie, J., Alayrac, J.-B., Arenas, M. G., Armstrong, T ., Balakrishna, A., Baruch, R., Bauza, M., Blokzijl, M., et al. Gemini robotics: Bringing ai into the ph ysical world. arXiv pr eprint arXiv:2503.20020 , 2025. W ei, Y ., Zhuang, V ., Soedarmadji, S., and Sui, Y . Scal- able bayesian optimization via focalized sparse gaussian processes. arXiv pr eprint arXiv:2412.20375 , 2024. W ong, D. and Liu, C. A ne w algorithm for floorplan design. In 23r d A CM/IEEE Design Automation Confer ence , pp. 101–107. IEEE, 1986. Xue, K., Chen, R.-T ., Lin, X., Shi, Y ., Kai, S., Xu, S., and Qian, C. Reinforcement learning policy as macro regulator rather than macro placer . arXiv preprint arXiv:2412.07167 , 2024. Y amada, Y ., Lange, R. T ., Lu, C., Hu, S., Lu, C., Foerster , J., Clune, J., and Ha, D. The ai scientist-v2: W orkshop-le vel automated scientific discov ery via agentic tree search. arXiv pr eprint arXiv:2504.08066 , 2025. Y ao, X., Jiang, J., Zhao, Y ., Liao, P ., Lin, Y ., and Y u, B. Evo- lution of optimization algorithms for global placement via large language models. arXiv preprint , 2025. 11 See it to Place it: Evolving Macro Placements with VLMs A ppendix A. Additional Details A.1. Benchmark Statistics T able 5. Benchmark statistics for all evaluated circuits. IBM benchmarks do not distinguish macros from standard cells. Benchmark # Objects # Macros # Nets # Pins ISPD 2005 adaptec1 211K 63 221K 944K adaptec2 255K 127 266K 1.1M adaptec3 452K 58 467K 1.9M adaptec4 496K 69 516K 1.9M ICCAD 2004 ibm01 13K — 14K 51K ibm02 20K — 20K 81K ibm03 23K — 27K 94K ibm04 28K — 32K 106K Ariane (Nangate45) ariane133 — 133 — — ariane136 — 136 — — ICCAD 2015 Superblue superblue1 1,215K 424 1,216K 3.8M superblue3 1,219K 565 1,225K 3.9M superblue4 802K 300 803K 2.5M superblue5 1,090K 770 1,101K 3.2M superblue7 1,938K 441 1,934K 6.4M superblue10 984K 1,629 1,898K 5.6M superblue16 986K 99 1,000K 3.0M superblue18 772K 201 772K 2.6M A.2. V isual Examples A . 2 . 1 . V L M - G U I D E D P L AC E M E N T T o provide a qualitati ve illustration of our method, Figure 5 visualizes a complete VLM-guided rollout on the adaptec4 benchmark. This example highlights the hierarchical di vision of labor central to V eoPlace: the VLM provides a high-le vel spatial strategy , and the low-le vel policy e xecutes the precise placement decisions within that strategy . The figure shows the initial VLM proposals ( t = 0 ), the state mid-placement ( t = T / 2 ), and the final floorplan ( t = T ) that results from this guided process. A . 2 . 2 . A N C H O R W E I G H T C O M PA R I S O N T o illustrate the effect of anchor weight on placement quality , Figure 6 sho ws the final placements for superblue1 at different anchor weights. W ith lo w anchor weights ( λ A = 0 . 001 ), DREAMPlace has sufficient fle xibility to route standard cells around the VLM-suggested macro positions. Higher anchor weights ( λ A = 1 . 0 ) overly constrain the optimization, resulting in suboptimal standard cell placement. A.3. Macro Coloring W e employ a color -coding strategy to implicitly con ve y functional relationships between macros to the VLM. This process in volv es sev eral steps: First, we construct a macro-connecti vity graph from the original netlist G . In this graph, nodes (excluding standard cells) represent the macros to be placed. An undirected, weighted edge is created between an y two macros if the y share one or more nets in G . The weight of such an edge is proportional to the number of nets these two macros commonly share. This construction effecti vely flattens the hypergraph structure of the netlist into a standard graph, where indirect connections through nets are represented as weighted between macros. 12 See it to Place it: Evolving Macro Placements with VLMs (a) t = 0 (b) t = T 2 (c) t = T F igur e 5. V eoPlace’ s VLM-guided placement on adaptec4. (a) VLM proposes initial regions ( t = 0 ); policy is unconstrained for macros without valid suggestions. (b) Mid-placement ( t = T / 2 ). (c) Final placement ( t = T ), with the policy operating within VLM constraints. (a) λ A = 0 . 001 (best) (b) λ A = 1 . 0 (too restrictiv e) F igur e 6. V isual comparison of placements at diff erent anchor weights on superblue1 . Lo wer anchor weights allow the analytical placer more flexibility to optimize standard cell positions around the macro placements. 13 See it to Place it: Evolving Macro Placements with VLMs This macro-connectivity graph is embedded into a low-dimensional space (specifically , an 8-dimensional space in our implementation for k-means) using a spring-based graph layout algorithm. Such algorithms, lik e the one implemented in the NetworkX ( Hagber g et al. , 2008 ) Python library , position macros in the embedding space such that those with stronger connections in the graph are located closer to one another in space. W ith macros represented as points in this embedding space, we apply k-means clustering to group them. T o determine a suitable number of clusters, k , we iterate through a predefined range of potential k values (e.g., from 2 to 30). For each k , we perform k-means clustering and e valuate the resulting cluster separation using the Silhouette score ( Rousseeuw , 1987 ). The value of k (and its corresponding clustering) that yields the highest Silhouette score is selected as optimal. Finally , macros are assigned colors based on their cluster membership: all macros within the same cluster receive the same unique color . Any macros that are not part of the main connecti vity graph (e.g., isolated macros not sharing nets with other considered macros, if any) are assigned a default gray color . While specific netlist connectivity details are not directly fed to the VLM, this color -coding, deriv ed from the underlying circuit structure, pro vides a strong visual heuristic for potential functional groupings and spatial affinities. B. Experimental Setup B.1. Justification f or Fixed Macros During Standard Cell Placement This section applies to the learning-based e valuation only (Section 5.1.2 ). For the VLM-guided analytical placer (Sec- tion 5.1.1 ), DREAMPlace directly optimizes macro and standard cell positions jointly via soft anchor constraints, so this concern does not arise. In the learning-based ev aluation, we report results with fixed macro placements, where the analytical placer only positions the standard cells around the macros (a two-stage flow). This differs from some prior work that allo ws the analytical placer to mov e all cells, including macros (a three-stage flow). W e find that allo wing macros to be mov able during the analytical placement stage results in substantial displacements from their original V eoPlace-generated locations. This confounds the ev aluation, as the final placement is no longer representative of V eoPlace’ s learned spatial reasoning but rather the output of the analytical placer . Figure 7 provides a clear visual demonstration of this effect on the adaptec1 benchmark. The significant displacement of macros is evident, justifying our decision to use a fix ed-macro ev aluation to ensure we are measuring the direct efficac y of V eoPlace. 14 See it to Place it: Evolving Macro Placements with VLMs (a) Our two-stage flo w (V eoPlace with fixed macros). (b) Alternativ e three-stage flow (mo vable macros). F igur e 7. V isual comparison demonstrating why a fix ed-macro flow is essential for a fair e valuation of V eoPlace. (a) The final layout from our two-stage flow , where macro placements generated by V eoPlace are fixed . (b) The result of an alternati ve three-stage flow , which takes the exact same initial placement from (a) as input but allows DREAMPlace to move all cells. The analytical placer’ s drastic rearrangement of macros in (b) shows that it ef fectiv ely ignores the initial solution, making its final metrics an inv alid measure of V eoPlace’s contrib ution. Our fixed-macro approach ensures a direct and unconfounded ev aluation. B.2. Model Size The ChiPFormer decision transformer model contains approximately 3 million trainable parameters. B.3. Pre-training The pre-training phase was conducted on servers equipped with 4× NVIDIA A100 40GB GPUs. B.4. Rollout and Inference For generating rollouts, the computational requirements were significantly lower as these in volv ed only forward passes through the trained 3M parameter model. These were conducted on a single A100 GPU or equi valent, with each benchmark circuit rollout typically completing within seconds. B.5. VLM Integration For VLM inte gration, we used Google’ s Gemini API with the Gemini 2.5 Flash model. Our experiments are organized into iterations, where each iteration consists of 8 rollouts. These iterations alternate: one iteration is generated using only the low-le vel placer , and the next is generated with VLM guidance. A VLM query is performed once at the beginning of each guided iteration. Over a 2,000-rollout experiment, this results in 250 total iterations (125 unguided and 125 guided), leading to exactly 125 calls to the VLM. Each call to Gemini returns 8 candidate generations, with each generation being a complete set of suggested regions for all macros in the netlist. B . 5 . 1 . W A L L - C L O C K T I M E For the analytical-track Superblue experiments, the VLM overhead is dominated by Gemini 2.5 Flash response latency . W ith an a verage response time of approximately 230 seconds per query and 125 queries per 2,000-rollout run, the total added VLM latency is about 8 hours. T able 6 reports the per -rollout DREAMPlace latency and total wall-clock time on a 15 See it to Place it: Evolving Macro Placements with VLMs single A100 GPU. T able 6. W all-clock o verhead for V eoPlace-guided DREAMPlace on the Superblue benchmarks. DP = DREAMPlace 4.3.0; VP+DP = V eoPlace with DREAMPlace. T otal time includes 2,000 rollouts on a single A100 GPU plus 125 Gemini queries. Benchmark Per -Rollout (s) DP 2,000 Rollouts (h) VP+DP 2,000 Rollouts (h) Overhead superblue1 83 46 54 +17% superblue3 168 93 101 +9% superblue4 127 70 78 +11% superblue5 95 53 61 +15% superblue7 122 68 76 +12% superblue10 190 106 114 +8% superblue16 98 55 63 +15% superblue18 52 29 37 +28% Because the VLM latency is a fixed cost per run, its relativ e ov erhead decreases on larger designs, dropping from 28% on superblue18 to 8% on superblue10 . B . 5 . 2 . A P I C O S T Using Gemini 2.5 Flash standard paid-tier pricing and conservati ve ov erestimates of 100K input tokens and 10K output tokens per query , the estimated cost per query is 0 . 30 × 100 , 000 1 , 000 , 000 + 2 . 50 × 10 , 000 1 , 000 , 000 = 0 . 055 USD. Across 125 queries, this yields an estimated API cost of 125 × 0 . 055 = 6 . 875 USD, i.e., about $7 per 2,000-rollout experiment. Because the token counts abo ve are intentionally ov erestimated, the true API cost should be lower . C. Hyperparameters C.1. Gemini W e use the public Gemini API endpoint for our experiments. T able 7 sho ws these hyperparameters. T able 7. Gemini API hyperparameters. Parameter V alue T emperature 0.7 T op- k 64 T op- p 0.95 Candidates 8 C.2. Standard Cell Grouping P arameters As discussed in Section 5 , for the learning-based benchmarks (adaptec/ibm/ariane), we group the hundreds of thousands of standard cells into a smaller set of clusters to make training and inference tractable. This grouping is only used to compute the proxy wirelength re ward during rollouts; all reported results are global HPWL computed by DREAMPlace with fixed macros. W e use the open-source codebase from Google’ s Circuit Training project for this task, which implements the grouping methodology first introduced by Mirhoseini et al. ( 2021 ). T o ensure a consistent basis for comparison, we applied the same set of grouping hyperparameters across all learning-based benchmarks. The specific values for these parameters are detailed in T able 8 . 16 See it to Place it: Evolving Macro Placements with VLMs T able 8. Hyperparameters for the Standard Cell Grouping Algorithm. Parameter V alue Description Number of Groups 2000 The fixed number of clusters to group all standard cells into. Cell Area Utilization 1.25 A tar get for the density of cells within a cluster . Enable Group Breakup T rue A boolean flag that allows the algorithm to split lar ger groups. C . 2 . 1 . P R E T R A I N I N G Circuit T okens For pretraining the circuit token representation component using the V ariational Graph Auto-Encoder (VGAE), we used the follo wing hyperparameters: • Hidden layer dimensions: [32, 32] • Learning rate: 0.01 • Training epochs: 800 T ransformer Follo wing ChiPFormer ( Lai et al. , 2023 ), we use a re ward-conditioned transformer with the follo wing hyperparameters: • Number of transformer layers: 6 • Number of attention heads: 8 • Embedding dimension: 128 C . 2 . 2 . R O L L O U T S E T T I N G S Returns-to-go W e configured specific target returns-to-go for each benchmark netlist to guide the generated placements. Since our objecti ve is to minimize wirelength, we define the re ward as its negativ e v alue. Following the methodology of Decision T ransformers, we set these values to ambitious targets, encouraging the model to generate high-quality placements with very lo w wirelengths. T able 9 shows the target returns-to-go v alues used for each benchmark circuit in our experiments. T able 9. T ar get Returns-to-Go for Different Benchmark Netlists Netlist Return-to-go adaptec1 -2.86E+06 adaptec2 -2.91E+06 adaptec3 -5.90E+06 adaptec4 -6.37E+06 ibm01 -7.00E+04 ibm02 -1.67E+05 ibm03 -2.52E+05 ibm04 -2.86E+05 ariane133 -2.00E+05 ariane136 -2.00E+05 C.3. DREAMPlace All experiments utilize DREAMPlace v ersion 4.3.0 . 17 See it to Place it: Evolving Macro Placements with VLMs C . 3 . 1 . V L M - G U I D E D P L AC E M E N T ( S U P E R B L U E ) For the VLM-guided DREAMPlace experiments on the Superblue benchmarks, we use anchor constraints to incorporate VLM suggestions. T able 10 details the anchor weight λ A for each benchmark. T able 10. Anchor W eight λ A for VLM-Guided DREAMPlace on Superblue Benchmark Anchor W eight ( λ A ) superblue1 0.01 superblue3 0.01 superblue4 0.01 superblue5 0.01 superblue7 0.01 superblue10 0.001 superblue16 0.01 superblue18 0.01 T able 11 details the DREAMPlace hyperparameters for all benchmarks. All benchmarks use the Nesterov optimizer with a learning rate of 0.01. T able 11. DREAMPlace 4.3.0 Hyperparameters for All Benchmarks Benchmark T arget Density Stop Overflow Density W eight Num Bins (X) Num Bins (Y) Iterations ICCAD 2015 Superblue superblue1 1.00 0.10 8 × 10 − 5 1024 1024 1000 superblue3 1.00 0.10 8 × 10 − 5 2048 2048 1000 superblue4 1.00 0.10 8 × 10 − 5 512 512 1000 superblue5 1.00 0.10 8 × 10 − 5 1024 1024 1000 superblue7 1.00 0.10 8 × 10 − 5 512 512 1000 superblue10 1.00 0.10 8 × 10 − 5 1024 1024 1000 superblue16 1.00 0.10 8 × 10 − 5 1024 1024 1000 superblue18 1.00 0.10 8 × 10 − 5 512 512 1000 ISPD 2005 adaptec1 1.00 0.07 8 × 10 − 5 512 512 1000 adaptec2 1.00 0.07 8 × 10 − 5 1024 1024 1000 adaptec3 1.00 0.07 8 × 10 − 5 1024 1024 1000 adaptec4 1.00 0.07 8 × 10 − 5 1024 1024 1000 ICCAD 2004 ibm01 1.00 0.07 8 × 10 − 5 512 512 1000 ibm02 1.00 0.07 8 × 10 − 5 512 512 1000 ibm03 1.00 0.07 8 × 10 − 5 512 512 1000 ibm04 1.00 0.07 8 × 10 − 5 512 512 1000 Ariane (Nangate45) ariane133 1.00 0.07 8 × 10 − 5 512 512 1000 ariane136 1.00 0.07 8 × 10 − 5 512 512 1000 18 See it to Place it: Evolving Macro Placements with VLMs D. Additional Experiments D.1. Congestion W e report a congestion proxy (R UD Y) for the Superblue benchmarks to verify that V eoPlace’ s wirelength gains do not come at the expense of routability . The differences are small and mix ed across benchmarks. T able 12. Congestion proxy (R UD Y , lo wer is better) for V eoPlace-guided DREAMPlace vs. DREAMPlace 4.3.0 on Superblue. Differences are small and mixed (4–4 split), indicating that V eoPlace’ s HPWL improvements do not materially change routability . Benchmark VP+DP 2.5 Flash DP 4.3.0 superblue1 0.93 ± 0.01 0.92 ± 0.00 superblue3 1.06 ± 0.02 1.04 ± 0.00 superblue4 0.91 ± 0.02 0.93 ± 0.00 superblue5 0.85 ± 0.02 0.80 ± 0.00 superblue7 1.03 ± 0.00 1.06 ± 0.00 superblue10 1.08 ± 0.02 1.09 ± 0.01 superblue16 1.13 ± 0.02 1.09 ± 0.02 superblue18 1.02 ± 0.01 1.10 ± 0.01 D.2. Pr ompt Ablation T o isolate the impact of the prompt’ s high-lev el strategic guidance, we conducted an ablation study to test the sensitivity of the VLM’ s performance to its core instructions. A key question is whether the VLM performs best when asked to explore nov el design configurations, to greedily refine known high-quality solutions, or to follo w a more balanced def ault instruction. T o in vestigate this, we created two strate gic v ariants of our main prompt: a Gr eedy prompt that e xplicitly instructs the VLM to make only minor modifications to the best-performing examples pro vided in-context, and an Exploratory prompt that encourages the VLM to disre gard prior examples and generate creati ve, nov el placements. Figure 8 sho ws the exact strategy-specific prompt te xt used by these three variants. The results of this ablation, presented in T able 13 for the superblue1 benchmark, sho w that prompt intent matters, but the strongest performance comes from the default prompt rather than from either extreme. The Greedy prompt is slightly worse, and the Exploratory prompt degrades further . This suggests that, for guiding DREAMPlace, the VLM works best when given balanced instructions that preserve useful inductive bias from prior examples without over -constraining the search. F igur e 8. Strategy-specific prompt te xt e xtracted from the implemented prompt templates. The Gr eedy prompt adds stay-close instructions, the Default prompt keeps the neutral scaf fold, and the Exploratory prompt adds explicit nov elty-seeking guidance. Greedy Pr ompt Default Pr ompt Exploratory Prompt Pr eamble addition: “Use the pre vious examples as a strong prior . Stay very close to the best known historical arrangements and prefer small, low-risk refinements ov er novel departures. ” Strate gy section: “Refinement on Best Archetype: Propose exactly one small, low-risk impro vement to the best kno wn pattern. Stay very close to the successful historical arrangement and explain why this minimal change should help. ” Pr eamble addition: none. Strate gy section: “Improvement on Best Archetype: Propose exactly one concrete change to the best pattern (e.g., shift position, adjust spacing, try different can vas re gion); if evidence is weak, label it ‘exploratory’ b ut still commit. ” Pr eamble addition: “Use the pre vious examples as conte xt only , not as a constraint. Fav or novel, di verse, and deliberately exploratory re gion proposals when they could plausibly lead to a better floorplan. ” Strate gy section: “Deliberate Departure from Best Archetype: Propose exactly one concrete way your plan intentionally differs from the best kno wn pattern. Explain why this nov el configuration could outperform it; if evidence is weak, label it an ‘exploratory hypothesis’ b ut still commit. ” 19 See it to Place it: Evolving Macro Placements with VLMs T able 13. Ablation study on the VLM prompt’ s strategic guidance (TS, C =25 ) on the superblue1 benchmark. W e report V eoPlace with DREAMPlace (VP+DP). The Default prompt yields the best objectiv e ( × 10 7 , lower is better). The best result is bolded . Benchmark Method Greedy Default Exploratory superblue1 VP+DP 2.5 Flash 37.51 ± 0.09 37.47 ± 0.11 37.64 ± 0.11 DP 4.3.0 (Baseline) 37.95 ± 0.16 D.3. Input Modality Ablation W e also test how much each input channel contrib utes by ablating the prompt and removing either the chip canv as image or the textual conte xt (i.e., exact macro coordinates in te xt) from each in-context example while k eeping the prompt strategy fixed to the default setting. The full multimodal prompt performs best on superblue1 ; removing the image causes only a small degradation, while removing the te xt produces a larger drop. This suggests that textual context is more important for improving upon e xisting placements. The image context still provides useful information because, without it, the locations of standard cells in each example are unkno wn: there are too many standard cells to enumerate in the textual portion of the prompt. T able 14. Ablation study on prompt input modality (TS, C =25 ) on the superblue1 benchmark. W e report V eoPlace with DREAMPlace (VP+DP). ‘Full’ denotes the default multimodal prompt with both image and text. Lower is better , and the best result is bolded . Benchmark Method Full NoImg NoTxt superblue1 VP+DP 2.5 Flash 37.47 ± 0.11 37.56 ± 0.12 37.84 ± 0.25 DP 4.3.0 (Baseline) 37.95 ± 0.16 E. Prompt Details E.1. Example Prompt Prompt example: Default Y ou are guiding a low-le vel placement policy for computer chip floorplanning. Y our primary goal is to create the most optimal chip floorplan possible that minimizes wirelength. Y our task is to suggest rectangular regions for placing macros on the chip can v as, which has been divided into a grid. The lo w-lev el policy will choose the e xact placement location within your suggested regions. Y our suggestions should be highly precise and optimal. If there is a macro in the netlist that you are not providing a suggestion for , the low-le vel policy will place that macro by itself. The macros are grouped by colors based on their connectivity in the netlist graph, where macros with higher interconnectivity (more pin connections between them) are assigned similar colors. Y our goal is to provide optimal region suggestions that will result in the best possible chip floorplan with minimal wirelength. This is a global optimization task where you need to consider: • The impact of your suggested regions on macros that will be placed in the future • The overall arrangement of the selected macros that minimizes wirelength MA CRO NAMES AND PR OPERTIES FOR THIS NETLIST : 20 See it to Place it: Evolving Macro Placements with VLMs Macro Color WxH FD4 #9b69e6 2 x 18 CXC #8f45da 11 x 24 HKU #8f45da 11 x 24 FZ6 #8f45da 11 x 24 CWI #8f45da 11 x 24 EIO #8f45da 6 x 24 JXA #8f45da 5 x 18 V8F #8f45da 5 x 18 G1F #8f45da 5 x 18 IJS #8f45da 5 x 18 JPT #8f45da 5 x 18 DU2 #8f45da 5 x 18 J6X #8f45da 5 x 18 HJ5 #8f45da 5 x 18 0IL #ef90df 5 x 18 FIF #ef90df 5 x 18 E6W #ef90df 5 x 18 ELG #ef90df 5 x 18 HDJ #a0ef90 5 x 18 DSU #9b69e6 5 x 18 G25 #a0ef90 5 x 18 IOQ #9b69e6 5 x 18 KV6 #efef90 5 x 15 IYX #8f45da 9 x 7 IIC #8f45da 9 x 7 F87 #8f45da 7 x 9 GVY #8f45da 7 x 9 ISA #8f45da 7 x 9 GJ6 #8f45da 7 x 9 FIY #a0ef90 3 x 19 PEJ #9b69e6 3 x 19 Macro Color WxH JQ5 #8f45da 3 x 18 EE4 #8f45da 3 x 18 CH6 #8f45da 5 x 9 F3D #9b69e6 2 x 18 BKG #b545da 2 x 19 I64 #b545da 2 x 19 ELR #8f45da 2 x 18 BCZ #8f45da 2 x 18 DSH #8f45da 2 x 18 DEH #8f45da 2 x 18 BLU #b545da 2 x 19 MK3 #b545da 2 x 19 CYR #9b69e6 2 x 18 CPS #9b69e6 2 x 18 GLZ #b469e6 2 x 18 BF1 #b469e6 2 x 18 EPJ #8f45da 3 x 9 IHG #8f45da 3 x 9 C55 #8f45da 1 x 18 I6P #8f45da 1 x 18 G5X #8f45da 1 x 18 HF5 #8f45da 1 x 18 JF5 #9b69e6 1 x 17 GU A #a0ef90 1 x 17 GF8 #8f45da 1 x 18 I6E #8f45da 1 x 18 FZI #8f45da 3 x 2 78E #9b69e6 1 x 9 J5L #efef90 1 x 9 JN6 #9b69e6 1 x 9 CWF #8f45da 1 x 9 GV3 #90bfef 20 x 1 IMPOR T ANT PLA CEMENT RULES: 1. The chip canv as is 84 × 84. 2. Coordinate system: • Origin (0,0) is at the bottom-left corner . • T op-left corner is (0,84) . • Bottom-right corner is (84,0) . • T op-right corner is (84,84) . 3. Suggested regions must be defined by bottom-left and top-right corners of the rectangle. 4. Suggested regions must not overlap with each other . 5. Suggestions are needed for these selected macros: • CXC – Size: 11 × 24 – Color: #8f45da • 0IL – Size: 5 × 18 – Color: #ef90df • G1F – Size: 5 × 18 – Color: #8f45da 21 See it to Place it: Evolving Macro Placements with VLMs • HDJ – Size: 5 × 18 – Color: #a0ef90 • KV6 – Size: 5 × 15 – Color: #efef90 • GJ6 – Size: 7 × 9 – Color: #8f45da • BKG – Size: 2 × 19 – Color: #b545da • FD4 – Size: 2 × 18 – Color: #9b69e6 • GLZ – Size: 2 × 18 – Color: #b469e6 • GV3 – Size: 20 × 1 – Color: #90bfef PLA CEMENT QU ALITY METRICS: • Lower wirelength is better • Macro overlap must be zero (ov erlapping placements are in valid) PREVIOUS PLA CEMENT EPISODES: Below are pre vious episodes with their final results. For each episode, you’ ll see: • Macro Positions : Shows where the selected macros you need to place were put on the can v as in previous episodes • Canv as Image : Shows the final state of the can v as with: – The names of each macro you need to place drawn directly on the macro – These selected macros outlined in red for easy identification • Final Metrics : The overall quality metrics of the completed chip design Episode #1 Position of Selected Macr os: • FD4: (82,8) to (84,26) • CXC: (54,56) to (65,80) • G1F: (51,35) to (56,53) • 0IL: (1,58) to (6,76) • HDJ: (58,13) to (63,31) 22 See it to Place it: Evolving Macro Placements with VLMs • KV6: (53,17) to (58,32) • GJ6: (32,20) to (39,29) • BKG: (30,16) to (32,35) • GLZ: (70,10) to (72,28) • GV3: (56,33) to (76,34) Can vas Description and Metrics The image abov e shows the final placement with the selected macros you need to place outlined in red and labeled with their names. Results for Episode #1: W irelength: 2.18e+06; Macro Overlap: 0. [Additional episodes are listed here] IMPOR T ANT OUTPUT FORMA T : 1. All coordinates must be integers between 0 and 84. 2. All regions must hav e non-zero width and height ( x 2 > x 1 and y 2 > y 1 ). 3. The orientation of macros cannot be changed. Do not try to rotate macros. 4. All regions must be large enough to fit the macro while still within the bounds of the canv as. For example, if a macro size is 3.1 × 4.2, the region must be at least 4 × 5. In the example below , replace text in square brackets with your own reasoning. Do not copy the te xt inside the brackets. Follo w this example format e xactly (without the dashed lines): DET AILED PLA CEMENT HISTOR Y ANAL YSIS: HISTORICAL PLA CEMENT P A TTERNS: COLOR GR OUP POSITION AN AL YTICS: • [For each color group, identify a few distinct placement strategies that appeared across episodes. Group similar episodes together . ] • [For each strategy , select one representativ e episode with exact coordinates and resulting wirelength v alues. ] • [Identify which placement locations produced the best results. Format: ”Color group X performed best when placed in region (coordinates) as seen in Episode Y , with wirelength values of Z and W respecti vely . ” ] MA CR O-LEVEL SP A TIAL RELA TIONSHIPS: 23 See it to Place it: Evolving Macro Placements with VLMs • [For the largest macros, compare their placement in the best vs. worst performing episodes, with e xact coordinates and performance values. ] • [Specify the exact performance impact of different macro orderings: ”When macro X was placed left of macro Y in specific episodes, wirelength was lo wer than when Y was placed left of X in other episodes. ” ] • [For the lar gest color group’ s core macros, describe exact left-to-right, top-to-bottom arrangement in the best-performing episodes, with precise coordinates. ] • [Identify which specific macros were leftmost/rightmost/topmost/bottommost in the best-performing episodes, with exact coordinates. ] • [For critical macro pairs, quantify the benefit of edge alignment: ”Macros A and B sharing a v ertical edge at specific coordinates resulted in better wirelength than when separated by specific units. ” ] • [Provide numerical e vidence for whether zero-gap or specific separation distances performed better: ”Zero-gap placement between specific macros yielded better performance than specific-unit separation. ” ] ADJ ACENCY RELA TIONSHIP AN AL YSIS: • [For each pair of color groups, analyze multiple episodes with dif ferent adjacency patterns. Specify the exact boundary length, position, and resulting performance values for each case. ] • [Identify the relationship between boundary length and performance: ”Longer shared boundaries between groups X and Y consistently produced better wirelength compared to shorter boundaries. ” ] • [For the most ef fecti ve boundary positions, pro vide exact coordinates and performance v alues: ”Boundary at specific coordinates yielded better wirelength than boundary at different coordinates. ” ] • [Analyze ho w performance changes with separation distance: ”Episodes with adjacent placement outperformed episodes with separated placement. ” ] • [Compare horizontal vs. v ertical boundaries with specific measurements: ”Horizontal boundary at specific coordinates resulted in different performance than v ertical boundary at different coordinates. ” ] • [Analyze the impact of boundary quality: ”Straight boundary between groups yielded dif ferent results than jagged/L-shaped boundary . ” ] • [Based on this analysis, propose specific color group configurations that would lik ely improve performance. Include exact recommended positions, boundary lengths, and orientations. ] CRITICAL EDGE ALIGNMENTS: • [Identify specific edge alignments between named macros that consistently corresponded with better perfor - mance across multiple episodes. Distinguish between coincidental and meaningful alignments. ] • [Provide precise coordinates and quantify the performance differences: for e xample, ”When specific macros had aligned edges at specific coordinates, wirelength w as consistently lo wer than when these edges were offset. ” ] FORMA TION ANAL YSIS: • [Analyze how the o verall arrangement and shape formed by each color group related to performance metrics. Identify which geometric patterns (rectangular, L-shaped, scattered, etc.) consistently corresponded with better performance. ] • [Provide e xact coordinates and performance data: for e xample, ”When color group X was arranged in a specific geometric pattern at coordinates (a,b)–(c,d), it achieved better wirelength than when arranged in a different pattern at coordinates (e,f)–(g,h). ” ] 24 See it to Place it: Evolving Macro Placements with VLMs CANV AS UTILIZA TION INSIGHTS: • [Examine the relationship between o verall can v as utilization and performance metrics. Consider both global utilization and local density variations. ] • [Provide exact utilization measurements and corresponding v alues: for example, ”Episodes with specific utilization lev els consistently achiev ed better performance than episodes with different utilization le vels. ” ] MUL TI-F A CTOR PERFORMANCE DRIVERS: PR O XIMITY RELA TIONSHIP ASSESSMENT : • [Analyze how the relati ve positioning of different color groups affected performance metrics, while accounting for other placement factors that changed simultaneously . ] • [Identify distance relationships with numerical evidence: for example, ”Maintaining specific distance between particular groups resulted in better performance than increasing this distance. ” ] MA CR O PLA CEMENT SENSITIVITY : • [For each major macro, assess ho w sensitiv e performance metrics were to its specific placement. Quantify this sensitivity . ] • [Provide e xact coordinates and performance impacts: for example, ”Moving specific macros from one position to another significantly affected wirelength, indicating high placement sensiti vity . ” ] CONTEXTU AL POSITIONING AN AL YSIS: • [Examine how the optimal positioning of color groups and macros varied depending on the placement context of other elements. ] • [Provide specific e xamples with measurements: for example, ”Particular groups performed best at specific positions when other groups were at certain positions, but performed best at different positions when those other groups were positioned elsewhere. ” ] OPTIMAL PLA CEMENT SYNTHESIS: DEFINITIVE COLOR GR OUP CONFIGURA TION: • [Synthesize all historical performance data to specify the exact optimal placement coordinates for each color group. Provide precise x,y coordinates for each group’ s boundaries. ] • [Justify each group’ s positioning with specific performance data: ”Each color group should be placed at precise coordinates, which consistently improved wirelength in similar configurations compared to alternativ e positions. ” ] MA CR O-LEVEL OPTIMAL ARRANGEMENT : • [Detail the precise optimal arrangement of specific macros within each color group, specifying e xact coordinates and edge relationships. ] • [For the lar gest color group’ s core macros, provide an exact left-to-right, top-to-bottom ordering with specific coordinates. ] • [Specify optimal edge alignments and exact distances between related macros: ”Specific macros should share edges at precise coordinates, which consistently produced better performance. ”] COMPREHENSIVE PERFORMANCE OPTIMIZA TION PRINCIPLES: • [Formulate 10 specific principles that together define the optimal chip configuration. Each principle should address a key aspect of the placement problem. ] 25 See it to Place it: Evolving Macro Placements with VLMs • [Include specific macros by name, provide exact coordinate guidance, and explain how each principle contributes to optimal performance.] • [Rank these principles by their relativ e importance to overall performance, based on consistent e vidence from multiple episodes.] STRA TEGY AND REGIONS Placement Strategy: • [Based on the detailed analysis above, pro vide the absolute optimal placement strategy . This should represent the most performance-optimized configuration possible giv en all historical evidence.] • [Provide a detailed, holistic description of your overall chip floorplan. Be extremely specific about where each of the selected macros will need to go.] • [Explain ho w different color groups are organized across the can v as, and why this org anization makes sense. Be extremely specific.] • [For selected macros that are the same color , explain exactly where the y will be positioned relative to each other using precise spatial relationships. Be extremely specific.] • [Explain in detail how this strategy will minimize wirelength.] • [Suggest regions for the selected macros by decreasing order of size (largest first). This is critical to av oid ov erlapping region suggestions.] • [For each macro, describe its region using precise relati ve spatial relationships that align with your o verall strat- egy , and immediately follow with the bottom-left and top-right corners of the region in format: MACRO NAME (W x H): (x1,y1) and (x2,y2) .] Example of precise relativ e spatial relationships (showing the le vel of detail e xpected): • RST (8x12): (34,37) to (42,49) – RST’ s right edge (x=42) precisely aligns with JKL ’ s left edge (x=42), creating a perfect shared boundary . – This creates a seamless transition between these regions with no gap. – The vertical alignment is partial, with RST spanning y=37 to y=49 while JKL spans y=38 to y=50. • JKL (16x12): (42,38) to (58,50) – JKL ’ s left edge perfectly aligns with RST’ s right edge at x=42. – JKL ’ s horizontal span (42 to 58) fits entirely within ABC’ s horizontal span (30 to 60). – JKL is positioned 5 units abov e ABC, with JKL ’ s bottom edge at y=50 and ABC’ s top edge at y=33. • ABC (30x20): (30,13) to (60,33) – ABC serves as a central anchor with multiple relationships: – ABC’ s left edge (x=30) is exactly 1 unit after MNO’ s right edge (x=29). – ABC’ s right edge (x=60) is exactly 3 units before GHI’ s left edge (x=63). • MNO (14x10): (15,37) to (29,47) – MNO’ s right edge (x=29) ends exactly 5 units before RST’ s left edge (x=34). – MNO’ s vertical position (y=37 to y=47) almost perfectly aligns with RST (y=37 to y=49). – This creates a clear 5-unit channel between MNO and RST . • DEF (20x16): (24,55) to (44,71) 26 See it to Place it: Evolving Macro Placements with VLMs – DEF’ s right edge (x=44) is exactly 1 unit before HIJ’ s left edge (x=45). – DEF’ s top edge (y=71) is 5 units below NOP’ s bottom edge (y=76). BE EXTREMEL Y SPECIFIC ABOUT : • Shared boundaries, specifying exactly which edges are shared (top, bottom, left, right). Mention the exact coordinate value that lines up if edges are used. • Exact positioning using specific edge and corner references. • How each region’ s placement supports your overall strate gy . MAKE Y OUR DESCRIPTIONS AS DET AILED AS POSSIBLE SO THA T THE FLOORPLAN CAN BE CON- STR UCTED WITHOUT AMBIGUITY . Current Can vas State Macros Currently Placed: No macros hav e been placed yet. Current Can vas Image Please provide your suggestions belo w . E.2. Example Gemini Response GEMINI CANDID A TES Candidate #0 DET AILED PLA CEMENT HIST OR Y ANAL YSIS MA CR O PLA CEMENT SENSITIVITY : • CXC: The placement of CXC has been consistently in the upper -middle region of the can v as (around x=54, y=56). The wirelength has not sho wn significant sensiti vity to minor variations in its placement within this region. Howe ver , moving it drastically away from other macros of the same color would likely increase wirelength. • 0IL: 0IL has been consistently placed in the upper-left corner (around x=1, y=58). Similar to CXC, minor variations in its placement within this re gion hav en’t significantly impacted performance. • HDJ: HDJ has been placed in the middle-right re gion (around x=58, y=13). Its placement seems to hav e a moderate impact on wirelength, suggesting it has connections to macros in other regions. 27 See it to Place it: Evolving Macro Placements with VLMs • KV6: KV6 has been placed close to HDJ (around x=53, y=17). Its placement also seems to hav e a moderate impact on wirelength, suggesting it has connections to macros in other regions. • IIC: IIC has been consistently placed in the bottom-right corner (around x=75, y=1). Similar to CXC and 0IL, minor variations in its placement within this re gion hav en’t significantly impacted performance. • MK3: MK3 has been consistently placed in the bottom-left corner (around x=4, y=1). Similar to CXC, 0IL, and IIC, minor variations in its placement within this re gion hav en’t significantly impacted performance. • BKG: BKG has been placed in the middle-left re gion (around x=30, y=11). Its placement seems to hav e a moderate impact on wirelength, suggesting it has connections to macros in other regions. • FD4: FD4 has been consistently placed in the bottom-right corner (around x=82, y=8). Similar to CXC, 0IL, IIC, and MK3, minor variations in its placement within this region hav en’t significantly impacted performance. • GLZ: GLZ has been consistently placed in the middle-right region (around x=70, y=10). Its placement seems to hav e a moderate impact on wirelength, suggesting it has connections to macros in other regions. • GV3: GV3 has been placed horizontally in the middle of the can v as (around x=53, y=33). Its placement seems to hav e a moderate impact on wirelength, suggesting it has connections to macros in other regions. CONTEXTU AL POSITIONING AN AL YSIS: • Macros with color #8f45da (e.g., CXC, IIC) seem to benefit from being clustered together . The wirelength tends to increase when these macros are spread far apart. • Macros with color #b545da (e.g., BKG, MK3) seem to benefit from being clustered together . The wirelength tends to increase when these macros are spread far apart. • Macros with color #9b69e6 (e.g., FD4) seem to benefit from being clustered together . The wirelength tends to increase when these macros are spread far apart. • Macros with color #a0ef90 (e.g., HDJ) seem to benefit from being clustered together . The wirelength tends to increase when these macros are spread far apart. • Macros with color #ef90df (e.g., 0IL) seem to benefit from being clustered together . The wirelength tends to increase when these macros are spread far apart. • Macros with color #efef90 (e.g., KV6) seem to benefit from being clustered together . The wirelength tends to increase when these macros are spread far apart. STRA TEGY AND REGIONS Placement Strategy: • Based on the detailed analysis abov e, the optimal placement strategy in volves clustering macros of the same color together to minimize wirelength. The canv as should be divided into re gions based on color groups, with adjustments made to optimize the placement of macros that hav e connections to other regions. • The overall chip floorplan will consist of distinct regions for each color group. The #8f45da group will be placed in the upper -middle region, the #b545da group in the middle-left re gion, the #9b69e6 group in the bottom-right region, the #a0ef90 group in the middle-right region, the #ef90df group in the upper -left region, and the #efef90 group in the middle of the can vas. • Different color groups are or ganized across the canv as to minimize the distance between highly interconnected macros. The #8f45da group is placed near the #9b69e6 group because the y hav e high interconnectivity . The #b545da group is placed near the #a0ef90 group because they ha ve high interconnecti vity . • For selected macros that are the same color , they will be positioned relativ e to each other to minimize distance 28 See it to Place it: Evolving Macro Placements with VLMs between them. F or example, CXC and IIC (both #8f45da) will be placed close to each other in the upper-middle region. BKG and MK3 (both #b545da) will be placed close to each other in the middle-left region. FD4 and GLZ (both #9b69e6) will be placed close to each other in the bottom-right region. • This strategy will minimize wirelength by clustering highly interconnected macros together and reducing the ov erall routing distance. Regions for the selected macros are suggested belo w , decreasing order of size (largest first). • CXC (11 x 24): (54,56) to (65,80) – CXC will be placed in the upper-middle region of the can v as, aligning with previous placements. – CXC’ s LEFT edge (x=54) is 1 unit after the right edge of the #ef90df group. – CXC’ s BO TTOM edge (y=56) is 22 units abov e the top edge of GV3. • 0IL (5 x 18): (1,58) to (6,76) – 0IL will be placed in the upper-left corner of the can vas, aligning with pre vious placements. – 0IL ’ s LEFT edge (x=1) aligns with the left edge of the can v as. – 0IL ’ s TOP edge (y=76) is 8 units belo w the top edge of the can v as. • HDJ (5 x 18): (58,13) to (63,31) – HDJ will be placed in the middle-right region of the can vas, aligning with pre vious placements. – HDJ’ s LEFT edge (x=58) is 5 units after the right edge of KV6. – HDJ’ s BO TTOM edge (y=13) is 4 units abov e the top edge of IIC. • KV6 (5 x 15): (53,17) to (58,32) – KV6 will be placed in the middle of the canv as, aligning with pre vious placements. – KV6’ s LEFT edge (x=53) is 1 unit after the right edge of BKG. – KV6’ s BO TTOM edge (y=17) is 1 unit abov e the top edge of MK3. • IIC (9 x 7): (75,1) to (84,8) – IIC will be placed in the bottom-right corner of the canv as, aligning with pre vious placements. – IIC’ s RIGHT edge (x=84) aligns with the right edge of the can vas. – IIC’ s BO TTOM edge (y=1) aligns with the bottom edge of the can v as. • MK3 (2 x 19): (4,1) to (6,20) – MK3 will be placed in the bottom-left corner of the canv as, aligning with pre vious placements. – MK3’ s LEFT edge (x=4) is 3 units after the left edge of the can vas. – MK3’ s BO TTOM edge (y=1) aligns with the bottom edge of the can v as. • BKG (2 x 19): (39,11) to (41,30) – BKG will be placed in the middle-left region of the can vas, aligning with pre vious placements. – BKG’ s LEFT edge (x=39) is 33 units after the left edge of the can vas. – BKG’ s BO TTOM edge (y=11) is 10 units abov e the top edge of MK3. • FD4 (2 x 18): (82,8) to (84,26) – FD4 will be placed in the bottom-right corner of the canv as, aligning with pre vious placements. – FD4’ s RIGHT edge (x=84) aligns with the right edge of the can vas. – FD4’ s BO TTOM edge (y=8) is 0 units abov e the top edge of IIC. 29 See it to Place it: Evolving Macro Placements with VLMs • GLZ (2 x 18): (70,10) to (72,28) – GLZ will be placed in the middle-right region of the can vas, aligning with pre vious placements. – GLZ’ s LEFT edge (x=70) is 8 units after the right edge of HDJ. – GLZ’ s BO TTOM edge (y=10) is 3 units abov e the top edge of IIC. • GV3 (20 x 1): (53,33) to (73,34) – GV3 will be placed horizontally in the middle of the canv as, aligning with pre vious placements. – GV3’ s LEFT edge (x=53) is 1 unit after the right edge of BKG. – GV3’ s BO TTOM edge (y=33) is 2 units abov e the top edge of HDJ. Candidate #1 [...] E.3. Structured Pr ompt vs Lazy Reasoning Our prompt is designed to elicit precise spatial reasoning and enable the VLM to generate rob ust, high-quality placement suggestions. W ithout this guidance, the model exhibits lazy reasoning—failing to identify meaningful patterns or of fering only v ague, superficial descriptions. In contrast, the fine-tuned prompt leads the VLM to extract richer structural insights and articulate specific placement strategies with concrete e xamples. E.4. VLM Failur e Cases In some instances, the VLM failed to follo w prompt instructions and instead returned the exact instruction te xt verbatim in its output. This typically occurred when the prompt was long and the temperature was set too low , reducing response variability and encouraging literal completions. F or example: 30 See it to Place it: Evolving Macro Placements with VLMs F igur e 9. Example comparisons of VLM output on three analysis topics when instructed by a baseline prompt vs instructed by a detailed, structured prompt. F igur e 10. In this e xample, ev ery sentence after the first was copied verbatim from an e xample in the prompt, rather than independently analyzed by the VLM. 31
Original Paper
Loading high-quality paper...
Comments & Academic Discussion
Loading comments...
Leave a Comment