SVH-BD : Synthetic Vegetation Hyperspectral Benchmark Dataset for Emulation of Remote Sensing Images
This dataset provides a large collection of 10,915 synthetic hyperspectral image cubes paired with pixel-level vegetation trait maps, designed to support research in radiative transfer emulation, vegetation trait retrieval, and uncertainty quantifica…
Authors: Chedly Ben Azizi, Claire Guilloteau, Gilles Roussel
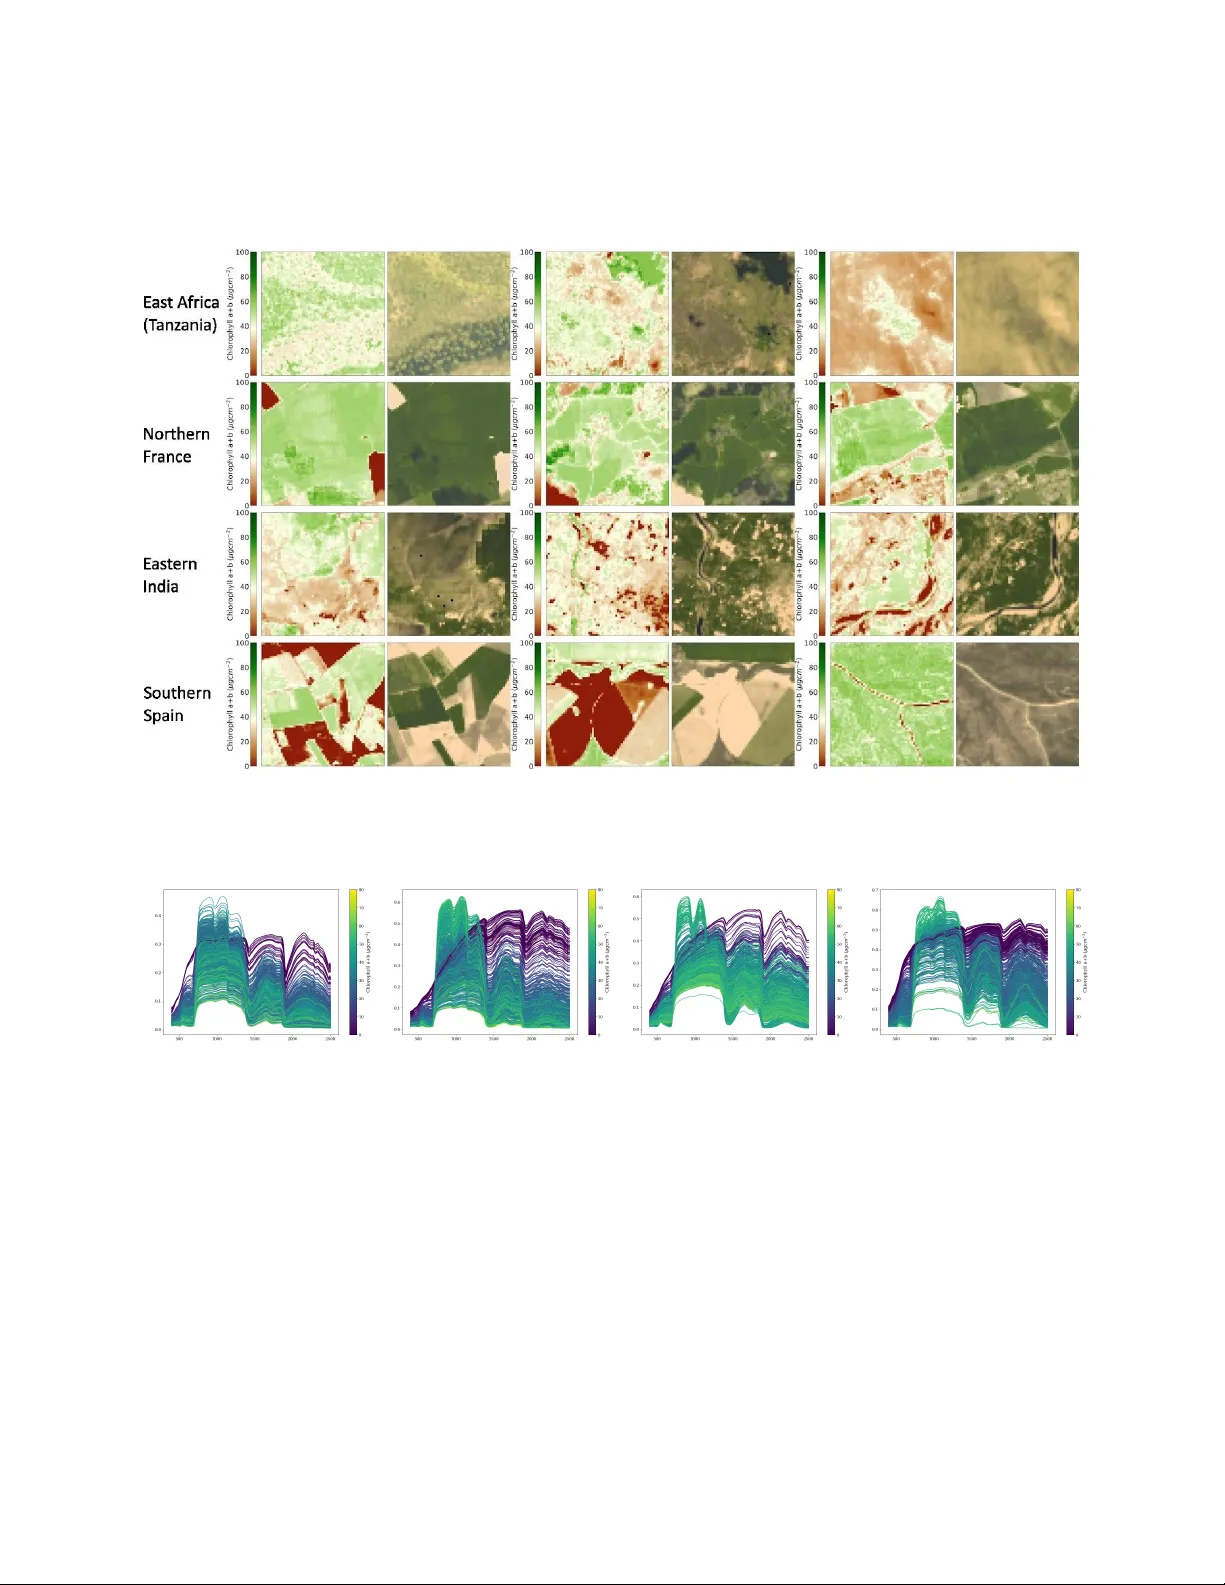
SVH-BD : Syn thetic V egetation Hyp ersp ectral Benc hmark Dataset for Em ulation of Remote Sensing Images Chedly Ben Azizi, Claire Guilloteau, Gilles Roussel, and Matthieu Puigt ∗ Abstract This dataset pro vides a large collection of 10 915 synthetic h yp erspectral image cub es paired with pixel - lev el v egetation trait maps, designed to supp ort research in radiative transfer emulation, vegetation trait retriev al, and uncertaint y quantification. Eac h h yp erspectral cub e contains 211 bands spanning 400–2500 nm at 10 nm resolution and a fixed spatial lay out of 64 × 64 pixels, offering contin uous sim ulated surface reflectance sp ectra suitable for em ulator developmen t and machine - learning tasks requiring high sp ectral detail. V egetation traits were derived by inv erting Sentinel - 2 Lev el - 2A [1] surface reflectance using a PROSAIL - based lo okup - table approach [2 – 4], follo wed by forward PROSAIL sim ulations to generate h yp ersp ectral reflectance under physically consistent canopy and illumination conditions. The dataset cov ers four ecologically diverse regions—East Africa, Northern F rance, Eastern India, and Southern Spain—and includes 5th and 95th percentile uncertain ty maps as well as Sentinel - 2 scene classification lay ers. This resource enables b enc hmarking of in version metho ds, developmen t of fast radiative transfer emulators, and studies of sp ectral–bioph ysical relationships under controlled yet realistic environmen tal v ariabilit y . Keyw ords— radiative transfer mo delling, biophysical parameter retriev al, canop y reflectance simulation, uncertaint y quan tification, PROSAIL inv ersion 1 Sp ecifications table Sub ject Earth & Environmen tal Sciences Sp ecific sub ject area Hyp erspectral Remote Sensing, V egetation T rait Retriev al, Radiative T rans- fer Mo del Em ulation T yp e of data Reflectance hypersp ectral images, V egetation bio-optical parameter maps Data collection The dataset w as generated through a m ulti-step pipeline com bining satellite data prepro cessing, radiativ e transfer mo del in version, and forw ard hyper- sp ectral sim ulation. Sen tinel-2 Level-2A [1] products were first selected across four geographic regions (East Africa, F rance, Spain, India). The Sen tinel-2 tiles were acquired from Level-2A surface reflectance pro ducts via the Harmonised Data Access service, with acquisition dates b etw een 1 and 6 May 2023. The relev ant sp ectral bands were extracted from each Lev el-2A tile, sp ecifically [’B1’, ’B2’, ’B3’, ’B4’, ’B5’, ’B6’, ’B7’, ’B8’, ’B8A’, ’B9’, ’B11’, ’B12’], and were subsequently cropped and harmonized to obtain spatially consistent multispectral inputs of 64 by 64 pixels, and 20m ground sampling distance. These inputs w ere then inv erted using a PROSAIL-based lo ok-up table in version [2 – 4] to estimate pixel-level v egetation biophysical parameters. Finally , the retrieved parameters were used to driv e a forw ard PR OSAIL simulation to pro duce hypersp ectral reflectance cub es in the range of 400-2500nm. Data source lo cation Institution: Lab oratoire d’Informatique, d’Image et du Signal de la Cˆ ote d’Opale Cit y/T own/Region: Longuenesse Coun try: F rance Data accessibility Rep ository name: SVH-BD : Synthetic V egetation Hypersp ectral Benchmark Dataset for Emulation of Remote Sensing Images Data identification n umber: https://doi.org/10.5281/zenodo.18660571 Direct URL to data: https://zenodo.org/records/18660571 Related research article None 2 V alue of the data • The dataset provides 10 915 synthetic hypersp ec- tral image cubes with pixel - lev el vegetation trait maps, offering a combination of dense spectral information and explicit vegetation trait anno- tations that are typically una v ailable in obser- v ational remote sensing archiv es. Eac h hyper- sp ectral cube includes 211 spectral bands from 400–2500 nm at 10 nm resolution, supplying con- tin uous reflectance sp ectra suitable for em ulator dev elopment and machine - learning tasks requir- ing high sp ectral detail. • The hypersp ectral cub es ha ve a fixed spatial res- olution of 64 x 64 pixels and a uniform 20 m ground sampling distance, whic h ensures spa- tial consistency across all scenes, enabling b oth pixel - wise and spatial-wise learning under con- trolled and comparable conditions. • The forw ard and inv erse mo deling steps are guided b y plant bioph ysical constraints, region - sp ecific parameter distributions and soil t yp es, ensuring that sim ulated reflectance and retriev ed traits reflect realistic environmen tal v ariabilit y and remain consistent with the eco- logical characteristics of eac h region. • The dataset includes uncertaint y maps for veg- etation trait retriev als, pro viding 5th and 95th p ercen tile estimates that supp ort the ev aluation of mo del robustness, the study of uncertain ty propagation, and the developmen t of metho ds that explicitly account for retriev al v ariability . Additional Sentinel - 2 classification maps are pro- vided for each scene, offering contextual infor- mation that supp orts land - co ver - a ware analysis, and enables studies that in tegrate sp ectral, bio- ph ysical, and categorical landscap e information. Bac kground The increasing av ailability of multispectral and hy- p erspectral satellite missions has transformed remote sensing in to a data-rich field capable of monitoring v egetation structure, function, and bio chemical status at regional to global scales. Despite this progress, the dev elopment of data-driv en retriev al and emulation mo dels remains constrained by the limited av ailabilit y of pixel-level vegetation trait annotations. Large re- mote sensing arc hives pro vide extensive observ ational co verage but rarely include ph ysically consistent bio- ph ysical v ariables such as c hlorophyll conten t, leaf w ater con tent, or leaf area index. This lac k of ref- erence data limits the training, b enc hmarking, and v alidation of emerging mac hine learning approaches aimed at linking canop y reflectance to underlying veg- etation properties. This dataset has therefore b een dev elop ed to fill this gap, enabling benchmarking of em ulation mo dels and supp orting researc h in trait retriev al, uncertain ty propagation, and physically in- formed machine learning. Ph ysically based sim ulation has b ecome an essential strategy to address this gap. Radiativ e transfer models suc h as PROSPECT [2] and SAIL [3] allow con trolled generation of leaf and canop y reflectance b y explicitly mo deling the influ- ence of bio c hemical comp osition, structural parame- ters, soil background, and viewing geometry . These sim ulations can pro duce synthetic datasets that are consisten t with ph ysical laws and tailored to the pa- rameter ranges encoun tered in real data. Such a sim- ulated dataset would serv e multiple purposes, such as enabling mo del b enc hmarking, supp ort the dev el- opmen t of fast emulators that appro ximate radiative transfer mo dels at significan tly reduced computational cost, and facilitate large-scale inv ersion workflo ws for v egetation trait retriev al. Data description The dataset contains 10 915 h yp ersp ectral image cub es, eac h with spatial dimensions of 64 × 64 pixels and 211 sp ectral bands. The sp ectral range spans 400–2500 nm with a fixed 10 nm sampling in terv al, and all images share a 20 m ground sampling dis- tance (GSD). Eac h hypersp ectral cub e is paired with a trait file ( traits.tif ) containing 16 leaf - , canopy - , and observ ation - lev el parameters. Additional files pro vide uncertaint y estimates for trait retriev als ( p5.tif , p95.tif ) and Sen tinel - 2 scene classification maps ( quality scene classification.img with 3 T able 1: Summary of files provided for eac h tile Filename Description surf-refl.tif Hyp erspectral surface reflectance cube (64 × 64 × 211) traits.tif Retriev ed bio-optical parameters (16 traits) p5.tif 5th p ercen tile uncertaint y map for trait retriev als. p95.tif 95th p ercen tile uncertaint y map for trait retriev als. quality scene classifcation.img Sen tinel-2 scene classification map. quality scene classifcation.hdr Metadata asso ciated with the classification map. metadata in quality scene classification.hdr ). T able 1 provides a summary of the conten t of eac h tile folder. Details ab out the traits can be found in T able 2. d a t a s e t / | - - < R E G I O N _ I D > / | | - - < T I L E _ I D > / | | | - - s u r f _ r e f l . t i f | | | - - t r a i t s . t i f | | | - - p 5 . t i f | | | - - p 9 5 . t i f | | | - - q u a l i t y _ s c e n e _ c l a s s i f i c a t i o n . i m g | | ‘ - - q u a l i t y _ s c e n e _ c l a s s i f i c a t i o n . h d r | ‘ - - . . . ‘ - - . . . Figure 1: F older hierarc hy of the dataset. The dataset is organized b y geographical region (africa, france, india, spain). Within eac h region, subfolders corresp ond to tile identifiers as sho wn in Figure 2. Exp erimen tal design, materials and metho ds The dataset w as generated through a multi-step pip eline combining satellite data prepro cessing, ra- diativ e transfer model inv ersion, and forward hyper- sp ectral sim ulation. Sen tinel-2 Level-2A ( [1]) pro d- ucts w ere first selected and harmonized to obtain spatially consistent m ultisp ectral inputs across four geographic regions. These inputs w ere then in v erted using a PR OSAIL-based look-up table to estimate pixel-lev el v egetation bioph ysical parameters. Finally , the retrieved parameters w ere used to drive a for- w ard PR OSAIL simulation to pro duce hypersp ectral reflectance cub es. The following subsections describ e eac h component of this pip eline in detail. Sen tinel-2: Data Prepro cessing and Im- age Selection Sen tinel-2 is a multispectral Earth observ ation mis- sion op erated b y the European Space Agency (ESA) within the Cop ernicus Programme. It consists of twin satellites (S2A and S2B) equipp ed with the MultiSpec- tral Instrumen t (MSI), whic h pro vides imagery across 13 sp ectral bands spanning the visible to short wa v e infrared regions. These data are widely used for v ege- tation monitoring, land co ver mapping, and retriev al of biophysical and bio c hemical parameters. The MSI acquires data at three spatial resolutions—10 m, 20 m, and 60 m—depending on the spectral band con- figuration. The Sentinel-2 tiles used for this dataset w ere acquired from Level-2A surface reflectance prod- ucts (S2MSI2A) via the Harmonised Data Access service. F our regions—East Africa (T anzania), North- ern F rance, Spain, and Eastern India—were selected to provide diverse v egetation types and en vironmen- tal conditions. Scene selection w as p erformed using spatio-temp oral queries sp ecifying geographic b ound- ing b oxes (Figure 2 and acquisition dates betw een 4 T able 2: Parameter ranges for the com bined leaf (PR OSPECT-D) and canopy (4SAIL) R TM (PR OSAIL). Sym b ol Description Unit Range Leaf Bio c hemical Parameters (PR OSPECT–D) N Leaf structure parameter – [1 , 2 . 5] C ab Leaf chloroph yll a+b µg cm − 2 [0 , 160] C ar Leaf carotenoids µg cm − 2 [0 , 60] C ant Leaf anthocyanins con tent µg cm − 2 [0 , 5] C brow n Bro wn pigmen ts – [0 , 1] C w Equiv alen t water thic kness g cm − 2 [0 , 0 . 07] C m Dry matter conten t g cm − 2 [0 , 0 . 1] Canop y Structural P arameters (SAIL) LAI Leaf area index – [0 , 10] LIDF a Av erage leaf angle degrees [30 , 70] LIDFb Bimo dalit y – 0 T yp eLIDF Leaf inclination distribution function – 1 h spot Hotsp ot parameter – [0 . 01 , 0 . 5] Soil Parameters ρ soil Soil sp ectrum – Library( [5]) Observ ation Geometry θ s Solar zenith degrees [15 , 80] θ v View zenith degrees [0 , 35] ϕ Relativ e azim uth degrees [100 , 150] 1 and 6 May 2023. All scenes corresp onded to plat- form S2A, instrumen t MSI, and ONLINE data status. After retriev al, a harmonizing preprocessing pipeline w as applied to ensure sp ectral and spatial consistency across all products. The relev ant spectral bands were extracted from each Level-2A tile, sp ecifically [’B1’, ’B2’, ’B3’, ’B4’, ’B5’, ’B6’, ’B7’, ’B8’, ’B8A’, ’B9’, ’B11’, ’B12’]. The 20 m tiles - bands 1-8, bands 11 and 12 - w ere cropp ed into patc hes of 64 × 64 pixels, while the 60 m tiles - band 9- were initially cropp ed at 32 × 32 pixels and subsequently upsampled to 64 × 64 using nearest neigh b our in terp olation to main tain uni- form spatial resolution across all bands. The resulting 10,883 multispectral cub es are in verted in the next step in order to obtain leaf and canopy bioph ysical parameters using PROSAIL. Radiativ e T ransfer Mo delling and Lo ok- Up T able In v ersion The dataset was generated using a tw o-stage radiative transfer mo deling (R TM) pip eline designed to sim- ulate hypersp ectral canop y reflectance sp ectra from v egetation bioph ysical parameters. This framew ork in- tegrates tw o physically based mo dels —PROSPECT- D ( [2, 4]) and SAIL ( [3])— whic h model light inter- actions at the leaf and canopy scales, respectively . 5 Figure 2: Geographic distribution of the four study regions used for syn thetic h yp ersp ectral dataset generation. The regions span diverse climate zones and v egetation types across Europ e (F rance, Spain), Africa (T anzania), and Asia (India). Leaf-Lev el Sim ulation: PROSPECT-D The PR OSPECT-D mo del simulates leaf reflectance and transmittance as a function of biochemical and struc- tural leaf prop erties. The mo del requires six input parameters: the leaf structure parameter N (n um- b er of effectiv e lay ers), chloroph yll a+b conten t C ab ( µg /cm 2 ), carotenoid conten t C ar ( µg /cm 2 ), antho- cy anin conten t C ant ( µg /cm 2 ), bro wn pigmen t con ten t C brow n (dimensionless), equiv alent w ater thic kness C w ( g /cm 2 ), and dry matter con tent C m ( g /cm 2 ). These parameters collectively describe the optical b eha v- ior of leav es across the visible to shortw av e infrared sp ectrum. Canop y-Level Sim ulation: SAIL A t the canopy lev el, the SAIL mo del integrates the outputs of PR OSPECT-D with structural and environmen tal v ariables to simulate canopy reflectance. The re- quired canopy parameters include the leaf area index (LAI, m 2 /m 2 ), a verage leaf inclination angle (ALA, 6 degrees), a hotspot parameter con trolling directional reflectance, and the fraction of diffuse incoming radi- ation. Observ ation geometry (solar zenith, viewing zenith, and relative azimuth angles) is included to capture bidirectional reflectance effects. Finaly , soil sp ectra are supplied for eac h selected region under the assumption of within-region homogeneit y , dra wn from the ICRAF-ISRIC soil sp ectral database [5] using the nearest av ailable measuremen t site to the target area. The mo del also computes auxiliary v ariables such as the fraction of absorbed photosyn thetically active ra- diation ( f AP AR ) and albedo, whic h are k ey indicators of canopy-lev el energy exchange. R TM in version T o generate the synthetic h yp er- sp ectral dataset, Sen tinel-2 surface reflectance images w ere inv erted using a lookup-table (LUT) deriv ed from the PROSAIL mo del to estimate spatially coherent maps of vegetation biophysical parameters. The LUT con tained M = 50 000 simulated sp ectra generated b y sampling the parameter space defined in T able 2. P arameter v alues w ere dra wn using Latin Hyp ercube Sampling (LHS) to ensure a homogeneous and statis- tically efficient exploration of the multidimensional space. F or a parameter θ j defined o ver [ θ min j , θ max j ], the i -th LHS sample w as computed as θ ( i ) j = θ min j + π j ( i ) − U ( i ) j M θ max j − θ min j , (1) where π j is a random p erm utation of { 1 , 2 , ..., M } and U ( i ) j ∼ U (0 , 1) is a uniform random v ariable. Ph ysiological constrain ts were applied during LUT construction following [6], notably the empirical cou- pling b et ween c hlorophyll con tent ( C ab ) and leaf area index (LAI), ensuring that sampled parameters cor- resp onded to realistic v egetation states. Additional plausibilit y chec ks w ere p erformed at the sp ectral lev el: sim ulated sp ectra exhibiting green p eaks at w av elengths low er than 547 nm were remov ed, follow- ing the criterion of [7]. Eac h retained LUT entry consisted of a parameter vector θ ( i ) and its corre- sp onding PR OSAIL-simulated reflectance spectrum ρ ( i ) ( λ ). The inv ersion step consisted of matching ob- serv ed Sen tinel-2 reflectance ρ obs to the simulated LUT en tries. F or each pixel, sp ectral discrepancy was quan tified using the ro ot mean square error (RMSE) as a cost function, RMSE = v u u t 1 211 211 X b =1 ρ obs b − ρ sim b 2 . (2) F or each pixel, n = 10 LUT entries with the lo w- est cost v alues were retained, forming an ensemble of plausible bioph ysical solutions. Final parameter estimates were derived using the median. P arame- ter uncertaint y was assessed non-parametrically from the 5th and 95th p ercen tiles of the n -b est ensem ble, pro viding pixel-lev el confidence in terv als. The result- ing spatially explicit maps of PR OSAIL biophysical parameters w ere then used as inputs to a forw ard PR OSAIL simulation c hain to generate pixel-level h yp ersp ectral reflectance sp ectra. Each sim ulated sp ectrum represen ts canopy-scale reflectance under the geometric, ph ysiological, and structural conditions estimated during the in version. Visualisation Represen tative examples of HSI cub es from each re- gion are shown in Figure 3. These samples illustrate the visual div ersit y of the dataset in terms of canopy co ver, landscap e structure, and sp ectral signatures. F or each region, the figure displays the chloroph yll a+b (Cab) map alongside its corresponding R GB com- p osite HSI scene, allowing simultaneous insp ection of bio c hemical v ariability and spatial reflectance pat- terns. The examples highlight transitions betw een cropland parcels, forested clusters, semi-arid shrub- lands, and heterogeneous mosaics characteristic of the selected environmen ts. In addition, the spe ctral b e- ha vior associated with these land-co ver configurations is illustrated in Figure 4, which sho ws represen tativ e reflectance spectra for eac h region, color-co ded b y Cab concen tration to emphasize the relationship betw een v egetation biochemistry and sp ectral shape. Limitations While the dataset cov ers four ecological regions, it do es not capture the full div ersity of global vegetation 7 Figure 3: Represen tative examples of emulated hypersp ectral image cub es and their corresp onding chloroph yll a+b (Cab) maps from the four study regions. F or eac h ro w, the left column shows the Cab map and the righ t column sho ws the associated HSI scene. All scenes are displa yed using an RGB composite. T anzania (East Africa) Northern F rance Southern Spain Eastern India Figure 4: Simulated hypersp ectral reflectance sp ectra from the four study regions, color-co ded by c hlorophyll a+b conten t ( C ab ). or en vironmental conditions. Additionally , eac h region is represented using a single soil t yp e, which does not reflect soil v ariabilit y and therefore the full range of soil - driv en effects on bio - optical parameters. Finally , the synthetic generation pro cess also relies on strong assumptions in both the forward and in v erse mo deling steps, which should b e considered when applying the dataset b ey ond controlled exp erimen tal settings. 8 Ethics statemen t The authors ha ve read and follow the ethical require- men ts for publication in Data in Brief. The curren t w ork does not inv olv e h uman sub jects, animal ex- p erimen ts, or an y data collected from so cial media platforms. CRediT author statemen t Chedly Ben Azizi : Conceptualization, Metho dol- ogy , Softw are, V alidation, Data Curation, W riting – Original Draft. Claire Guilloteau : Conceptu- alization, V alidation, W riting – Reviews & Editing, Sup ervision, F unding acquisition. Gilles Roussel : Conceptualization, V alidation, W riting – Reviews & Editing, Sup ervision, F unding acquisition. Matthieu Puigt : W riting – Reviews & Editing. Declaration of comp eting in ter- ests The authors declare that they hav e no known comp et- ing financial interests or p ersonal relationships that could hav e appeared to influence the w ork rep orted in this pap er. Ac kno wledgmen ts This work is partially funded by the ULCO research p ole ”Mutations T ec hnologiques et Environnemen- tales”, EUR MAIA (ANR-22-EXES-0009) and Hauts- de-F rance region. Exp erimen ts presen ted in this paper w ere carried out using the CALCULCO computing platform, supp orted b y DSI/ULCO (Direction des Syst ` emes d’Information de l’Universit ´ e du Littoral Cˆ ote d’Opale). References [1] Europ ean Space Agency. (2023) Mo di- fied copernicus sen tinel data 2023. Ac- cessed via Sen tinel Hub. [Online]. Av ailable: h ttps://www.sentinel- h ub.com/ [2] S. Jacquemoud and F. Baret, “Prospect: A mo del of leaf optical prop erties sp ectra,” R emote sensing of envir onment , v ol. 34, no. 2, pp. 75–91, 1990. [3] W. V erhoef, “Light scattering b y leaf lay ers with application to canopy reflectance modeling: The sail mo del,” R emote sensing of envir onment , v ol. 16, no. 2, pp. 125–141, 1984. [4] S. Jacquemoud, W. V erho ef, F. Baret, C. Bacour, P . J. Zarco-T ejada, G. P . Asner, C. F ran¸ cois, and S. L. Ustin, “Prosp ect+sail mo dels: A review of use for vegetation characterization,” R emote Sensing of Envir onment , v ol. 113, pp. S56–S66, 2009, imaging Sp ectroscop y Special Issue. [5] W. A. (ICRAF), I. S. Reference, and I. C. (ISRIC), “ICRAF-ISRIC Soil VNIR Sp ectral Library,” 2021, dataset. [Online]. Av ailable: h ttps://doi.org/10.34725/DVN/MFHA9C [6] M. Danner, K. Berger, M. W o c her, W. Mauser, and T. Hank, “Efficien t rtm-based training of ma- c hine learning regression algorithms to quantify bioph ysical & bio c hemical traits of agricultural crops,” ISPRS Journal of Photo gr ammetry and R emote sensing , v ol. 173, pp. 278–296, 2021. [7] M. W o c her, K. Berger, M. Danner, W. Mauser, and T. Hank, “Rtm-based dynamic absorption in- tegrals for the retriev al of bio c hemical vegetation traits,” International Journal of A pplie d Earth Ob- servation and Ge oinformation , v ol. 93, p. 102219, 2020. 9
Original Paper
Loading high-quality paper...
Comments & Academic Discussion
Loading comments...
Leave a Comment