NeiGAD: Augmenting Graph Anomaly Detection via Spectral Neighbor Information
Graph anomaly detection (GAD) aims to identify irregular nodes or structures in attributed graphs. Neighbor information, which reflects both structural connectivity and attribute consistency with surrounding nodes, is essential for distinguishing ano…
Authors: Qing Qing, Huafei Huang, Mingliang Hou
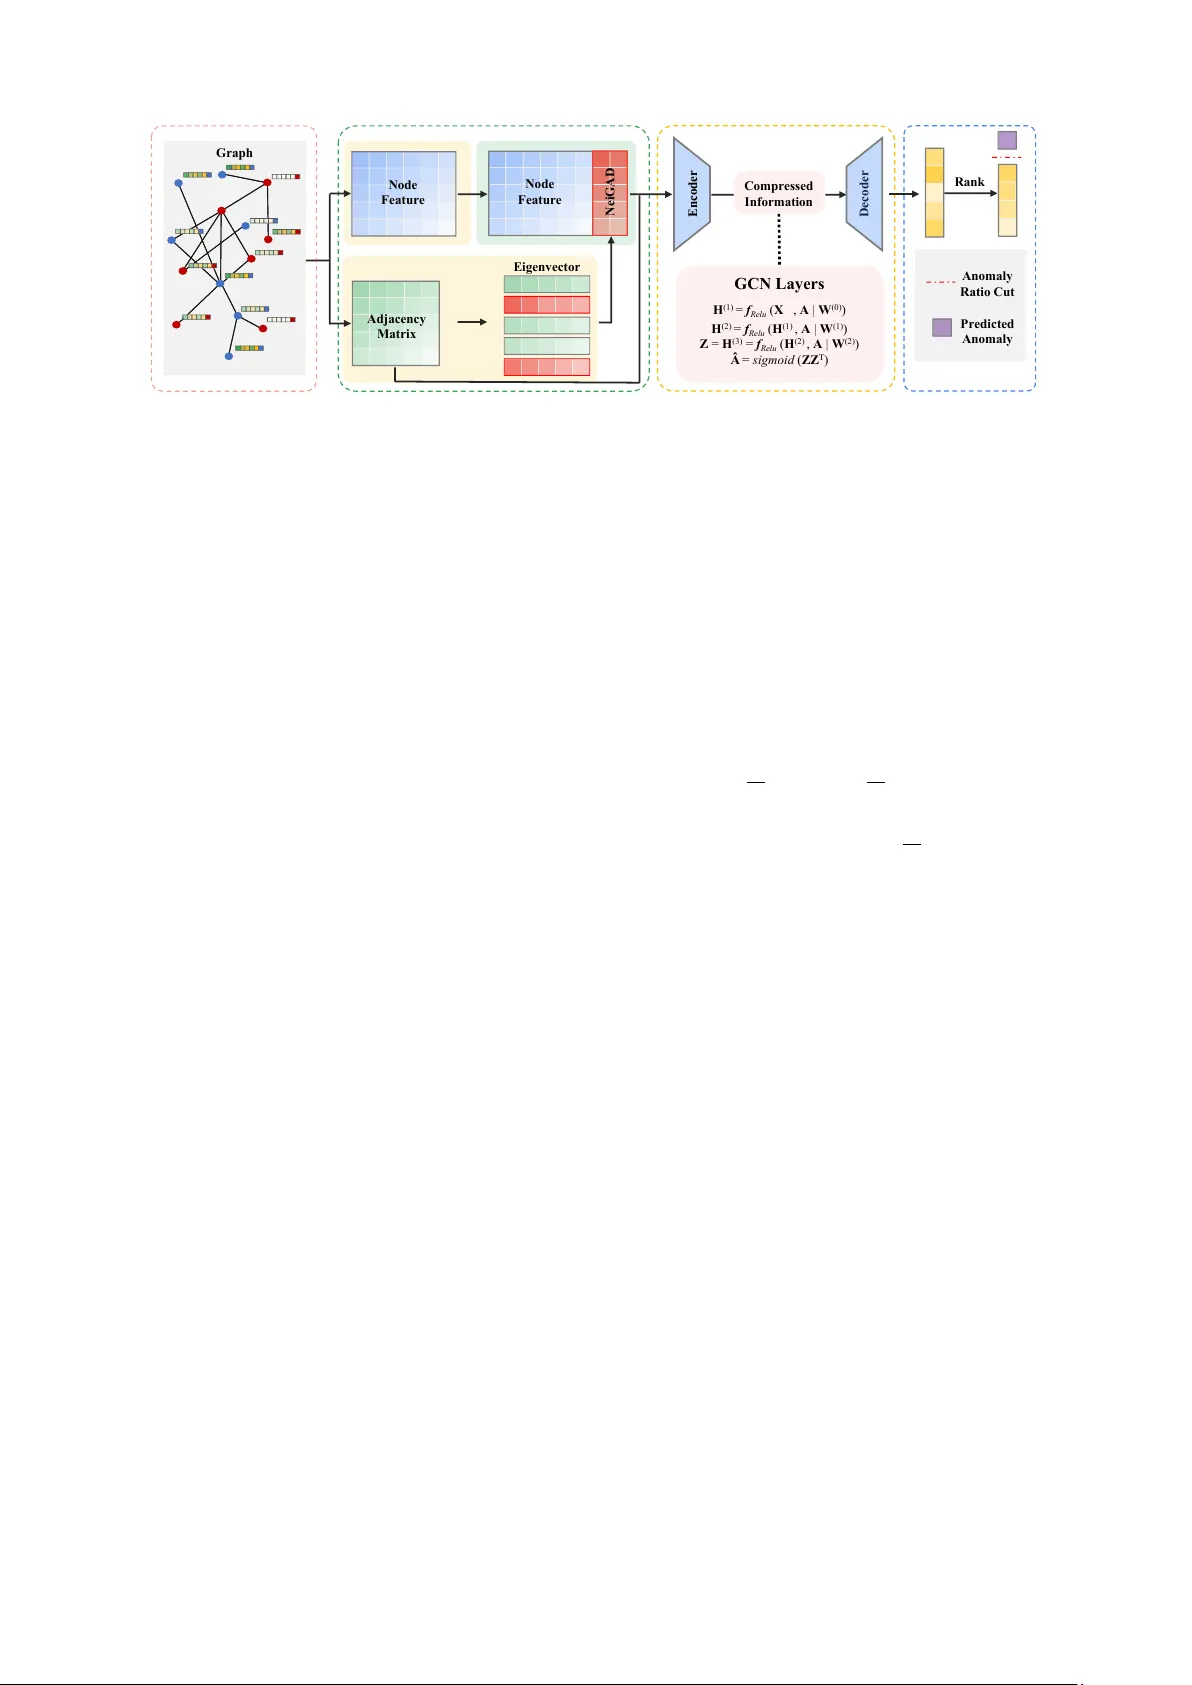
NeiGAD: Augmenting Graph Anomaly Detection via Spectral Neighbor Information Qing Qing, Huafei Huang, Mingliang Hou, Renqiang Luo, Mohsen Guizani Abstract —Graph anomaly detection (GAD) aims to identify irregular nodes or structures in attributed graphs. Neighbor information, which reflects both structural connectivity and attribute consistency with surr ounding nodes, is essential for distinguishing anomalies from normal patterns. Although re- cent graph neural network (GNN)-based methods incorporate such information thr ough message passing, they often fail to explicitly model its effect or interaction with attributes, limiting detection performance. This work introduces NeiGAD, a novel plug-and-play module that captures neighbor infor - mation through spectral graph analysis. Theoretical insights demonstrate that eigen vectors of the adjacency matrix en- code local neighbor interactions and progr essively amplify anomaly signals. Based on this, NeiGAD selects a compact set of eigenvectors to construct efficient and discriminative repr esentations. Experiments on eight real-world datasets show that NeiGAD consistently improves detection accuracy and outperf orms state-of-the-art GAD methods. These r esults demonstrate the importance of explicit neighbor modeling and the effectiv eness of spectral analysis in anomaly detection. Code is available at: https://github .com/huafeihuang/NeiGAD . Index T erms —Graph anomaly detection, Spectral analysis, Graph learning I . I N T RO D U C T I O N G Raph anomaly detection (GAD) aims to identify atypi- cal graph components (e.g., nodes, edges, or substruc- tures) that significantly deviate from the majority within a graph [1]. The increasing interconnectedness of real- world entities and advancements in graph mining techniques hav e fueled a surge of interest in GAD over the past decade, which has been proven effecti v e in v arious real- world applications, including financial fraud detection, c yber intrusion detection, device f ailure prediction, and spam com- ment identification [2]. The field has notably shifted from traditional expert-dri ven methods to machine learning-based approaches, and more recently , to deep learning techniques, which ha ve significantly improved detection accuracy [3]. Qing Qing and Renqiang Luo are with the College of Computer Science and T echnology , Jilin Uni versity , Changchun 130012, China (qingqing25@mails.jlu.edu.cn, lrenqiang@jlu.edu.cn). Huafei Huang is with the School of Computer Science and Information T echnology , Adelaide University , SA 5095, Australia (huafei.huang@adelaide.edu.au). Mingliang Hou is with the Guangdong Institute of Smart Education, Jinan Univ ersity , Guangzhou 510632, China (hml1989@jnu.edu.cn) Mohsen Guizani is with the Machine Learning Department, Mohamed Bin Zayed Uni versity of Artificial Intelligence, Abu Dhabi, United Arab Emirates (mguizani@ieee.org). The first two authors contributed equally to this work. Corresponding author: Mingliang Hou, Renqiang Luo. Fig. 1. Neighbor information increases the anomaly score gap between normal nodes and anomalous nodes. Anomalous nodes are typically those that substantially deviate from the majority , due to irregular connections (i.e., topology) or inconsistent attrib utes. T o detect such de vi- ations, reconstruction error-based autoencoders are widely used in GAD, identifying nodes that are poorly reconstructed based on the local context. For example, DOMINANT [4] compresses attributed networks into low-dimensional em- beddings and reconstructs both topology and attributes, treating high reconstruction errors as indicators of anoma- lies. Although these methods show some effecti veness, they often treat structural and attrib ute information separately or combine them in a simplistic way . As a result, they fail to fully utilize neighbor information, which captures the consistency between a node and the structure and attributes of its surrounding nodes, thereby limiting performance. Neighbor information, which includes both structural con- nections and node attrib utes within a graph, plays a critical role in effecti v e anomaly detection, as anomalies often appear as inconsistencies with the local neighborhood. In- corporating such information has been shown to significantly improv e GAD performance [5]. T o illustrate this, anomaly scores from a baseline method (DOMIN ANT [4]) are com- pared with those from a v ariant that integrates neighbor information, as sho wn in Figure 1. Experimental details and comparisons with other GAD methods are provided in Sec- tion 5. The observed performance gap highlights neighbor information as a strong additional signal for distinguishing anomalies from normal nodes. Although most GNN-based methods propagate neighbor information through message passing, few explicitly model or e v aluate its contribution to anomaly detection. Despite its importance, directly modeling neighbor infor- mation remains challenging and often incurs high compu- tational cost. Recent studies in graph-based tasks suggest that spectral analysis provides an efficient and theoretically grounded alternative. For example, FairGT [6] demonstrates that spectral truncation can compactly encode neighbor information while reducing computational ov erhead. Sim- ilarly , SpecFormer [7] shows that eigen v ectors associated with the largest and smallest eigenv alues ef fecti vely encode graph structure. This moti vates a fundamental question: How does spectral neighbor information contribute to GAD? T o answer this, a theoretical analysis is conducted to uncov er the underlying mechanisms. Theoretical analysis yields two key insights regarding spectral information in anomaly detection: (1) Adjacency matrix eigen vectors encode the linear av erage of neigh- bor components, aligning with message passing to cap- ture local structural information. This facilitates the joint modeling of topology and attrib utes to better distinguish anomalies. (2) Utilizing additional eigenv ectors linearly amplifies anomaly signals deriv ed from neighbor patterns. Consequently , spectral components encode neighborhood interactions and enhance anomaly separability as their di- mensionality increases. Based on these insights, we propose a plug-and-play module named NeiGAD ( Nei ghbor Information-enhanced G raph A nomaly D etection), designed to improve anomaly detection performance on attributed graphs. NeiGAD uses the eigen v ectors of the adjacenc y matrix, which capture both connecti vity and local structure, to represent neighbor information. By selecting a subset of these eigen vectors corresponding to specific eigen values, NeiGAD captures the most informativ e patterns while maintaining efficienc y . This approach integrates neighbor-a ware signals into existing GAD models with minimal overhead. In summary , the contributions are: • NeiGAD is proposed as a module designed to enhance existing anomaly detection methods by lev eraging neigh- bor information encoded in spectral components. • Eigen v ectors inherently encode neighbor information and linearly amplify anomaly signals, offering a prin- cipled basis for their use in GAD. • NeiGAD is ev aluated on eight real-world datasets, show- casing its effecti veness and superior performance ov er state-of-the-art GAD methods. I I . R E L A T E D W O R K A. Graph Anomaly Detection Graph Auto-Encoders are widely used for GAD by trans- forming graph data into node embeddings and identifying anomalies via reconstruction quality . GAAN [8] employs a generativ e adversarial framework, detecting anomalies through reconstruction errors and discriminator confidence. CoLA [9] utilizes contrastiv e self-supervised learning with instance pair sampling to enhance scalability . Unlike tradi- tional GNNs that struggle with heterophily , AHF AN [10] introduces a hybrid framework combining spectral filtering and spatial attention to rectify semantic drifts in anomalous nodes. Finally , GAD-NR [11] focuses on neighborhood reconstruction of local structures and attrib utes to detect div erse anomalies. Despite these adv ances, most e xisting methods overlook critical neighbor information, leading to suboptimal performance on real-world datasets. B. Spectral Graph Learning Designing spectral GAD methods necessitates specialized filters, as analyzing anomalies through the lens of the graph spectrum is paramount. Specformer [7] moves beyond traditional scalar-to-scalar filters by introducing a learnable set-to-set spectral filter that employs self-attention to capture global spectrum patterns and non-local dependencies. T o address inherent biases, FairGT [6] integrates a structural feature selection strate gy based on adjacenc y matrix eigen- vectors and multi-hop node feature integration, ensuring the independence of sensitiv e attributes within the T rans- former framework. Similarly , FairGE [12] bypasses the risks of sensiti ve attribute reconstruction by encoding fairness directly through spectral graph theory , utilizing principal eigen v ectors to represent structural information. Despite these advancements, these spectral filters primarily prioritize global distribution or fairness-a ware inv ariance; they often marginalize intricate local neighbor interrelations and fail to adequately resolve the class and semantic inconsistencies critical for distinguishing anomalies from benign nodes. I I I . P R E L I M I NA R I E S A. Notations W e denote a set by calligraphic uppercase letters (e.g., A ), matrices by bold uppercase letters (e.g., A ), and v ectors by bold lowercase letters (e.g., a ). A graph is represented as G = ( V , A , X ) , where V denotes the set of n nodes. A ∈ { 0 , 1 } n × n is the adjacency matrix. X ∈ R n × d represents the node feature matrix, where d is the dimension of the node feature. F or a node v i , N i denotes its set of neighbor nodes. For matrix and vector inde xing, con ventions similar to NumPy in Python are followed. Specifically , A [ i, j ] refers to the element in the i -th row and j -th column of matrix A , while A [ i, :] and A [: , j ] denote the i -th ro w and the j -th column of the matrix, respectiv ely . The adjacency matrix A spectrum provides a funda- mental characterization of the graph’ s structural topology and connectivity patterns. Since A is a symmetric matrix, its eigendecomposition is giv en by A = U ⊤ Λ U , where U = ( u 1 , u 2 , . . . , u n ) with u i ∈ R n ∗ 1 . Here, Λ = diag ( λ 1 , λ 2 , ......, λ n ) , where λ i is the eigenv alue of A , and A d j a cen cy Ma t ri x E nc o de r D eco d er C o m p ressed I n f or m at i on G CN L a y e r s H (1 ) = f Re l u ( X , A | W (0 ) ) H (2 ) = f Re l u ( H (1 ) , A | W (1 ) ) Z = H (3 ) = f Re l u ( H (2 ) , A | W (2 ) ) Â = s i gm oi d ( ZZ T ) Ra n k A n om al y Ra t i o Cu t P red i ct ed A n om al y E i ge n ve c t or No d e F ea t u re No d e F ea t u re Ne i G AD Gr a p h Fig. 2. The illustration of NeiGAD. u i is its corresponding eigen vector . This paper explores how the eigenv ector components relate to the anomaly detection. B. Graph Anomaly Detection This section introduces the fundamental equations used in GAD, focusing on graph reconstruction methods [4]. The o verall loss function typically combines reconstruction errors from both graph structure and node attributes. For a GAD based on graph reconstruction, an encoder transforms the node feature matrix X into a low-dimensional embed- ding Z through a series of transformations: Z = GNN enc ( X , A ; Θ enc ) . (1) Here GNN enc represents a GNN-based encoder, and Θ enc denotes its learnable parameters. The reconstruction decoders then aim to recov er the netw ork structure and attributes from this embedding. The structure reconstruction decoder predicts the adjacency matrix A ′ using: A ′ = ZZ ⊤ , (2) while the attribute reconstruction decoder approximates the attribute matrix X ′ as: X ′ = GNN dec ( Z , A ; Θ dec ) . (3) The loss function, where α is a balancing parameter , is defined as: L = (1 − α ) ∥ A − A ′ ∥ 2 F + α ∥ X − X ′ ∥ 2 F . (4) Anomaly scores for nodes are subsequently calculated based on their reconstruction errors, enabling the identifi- cation of anomalous nodes as those with higher scores. I V . T H E D E S I G N O F N E I G A D T o demonstrate NeiGAD’ s basic frame work, DOMI- N ANT is utilized as a plug-in baseline, as illustrated in Figure 2. Integrating NeiGAD into DOMIN ANT sho wcases how this method effecti vely enhances anomaly detection via spectral neighbor information. A. Theor etical Findings Underpinning NeiGAD The neighbor information anomaly score L NI i is first defined. Normal node attributes resemble those of their neighbors, while abnormal nodes behavior de viates. This de- viation is termed the neighbor information anomaly degree. Theorem 1 F or any eigen vector u i of adjacency matrix A , its j -th vector component, u i,j , equals the linear average of the components corresponding to node v j neighbors. Pr oof . Assume u i = ( u i, 1 , u i, 2 , . . . , u i,n ) ⊤ . Because A u i = λ i u i ,thus u i,j = 1 λ i A [ j, :] u i = 1 λ i (1 · ( X v k ∈N j u i,k ) + 0 · ( X v k / ∈N j u i,k )) = 1 λ i ( X v k ∈N j u i,k ) . □ This theorem re veals an approximate relationship between anomaly detection and the adjacency matrix spectrum. Ac- cording to Theorem 1 , eigen vector components can be approximated by linearly av eraging neighboring nodes’ s eigen v ector components. This property implies that eigen- vectors inherently capture spectral neighbor information, referring to the structural and relational characteristics of a node’ s local neighborhood encoded within the graph’ s spectral domain. Definition 1 Neighbor information anomaly scor e L NI i for node v i is defined as the r econstruction err or of its eigen vector component, wher e a higher scor e indicates a higher pr obability of v i being anomaly . L NI i = ∥ u i − u ′ i ∥ 2 F . (5) For the eigenv ector u i , the encoder is implicitly defined through iterati ve multiplication by the adjacenc y matrix: u (1) i = Au i , u (2) i = Au (1) i , u (3) i = Au (2) i . (6) The decoder is then defined as: u ′ i = Au (3) i . (7) This formulation reveals an approximate relationship be- tween L NI i and the adjacency matrix’ s eigen vector compo- nents. Based on this, the objectiv e is to compute the neighbor information anomaly de gree using these components. Theorem 2 The insertion of eigen vectors linearly in- cr eases the neighbor information anomaly degr ee. F or each positive integ er k , and for j ∈ { 1 , 2 , . . . k } with i j ∈ { 1 , 2 , . . . n } , where U i = ( u i 1 , u i 2 . . . , u i k ) denotes selected eigen vectors: L X || U i = L X + L NI i 1 + L NI i 2 + · · · + L NI i k . (8) Pr oof . The theorem is proven by mathematical induction. For each positi ve integer k , the statement to be proven is: L X || U i = L X + L NI i 1 + L NI i 2 + · · · + L NI i k . Base case ( k = 1 ): For any j ∈ { 1 , 2 , . . . n } , let i j ∈ { 1 , 2 , . . . n } . Consider the combined loss when a single eigen v ector u i 1 is incorporated with the feature matrix X : L X || u i 1 = X || u i 1 − X ′ || u ′ i 1 2 F = X − X ′ 2 F + u i 1 − u ′ i 1 2 F = L X + L NI i 1 . The result holds for k = 1 , v alidating the base step. Inductive Hypothesis ( k = r ): Assume the statement holds true for k = r . That is, for a set of r eigen vectors U r = ( u i 1 , u i 2 , . . . , u i r ) : L X || U r = L X + L NI i 1 + L NI i 2 + · · · + L NI i r . Inductive Step ( k = r + 1 ): Consider the case where an additional eigen v ector u i r +1 is include, forming U r +1 = ( u i 1 , u i 2 , . . . , u i r , u i r +1 ) . The loss function is expressed as: L X || U r +1 = X || U r || u i r +1 − X ′ || U ′ r || u ′ i r +1 2 F = X || U r − X ′ || U ′ r 2 F + u i r +1 − u ′ i r +1 2 F = L X + L NI i 1 + L NI i 2 + · · · + L NI i r + L NI i r +1 . It holds for k = r + 1 , confirming the inductive step. By combining the base step, inductive hypothesis, and inductiv e step, the mathematical statement is proven to hold for all positiv e integer k . Therefore, the insertion of eigen v ectors has a linearly increasing ef fect on neighbor information anomaly de gree. □ Theorem 2 implies that combining multiple eigenv ector- deriv ed anomaly scores linearly amplifies anomaly signals. B. Empirical Observations of NeiGAD The empirical evidence demonstrates that incorporating neighbor information significantly amplifies the discrimi- nativ e gap between normal and anomalous nodes, mak- ing them more distinguishable. As illustrated in Figure 3, our analysis examines how these neighbor-based scores, which capture essential node-neighbor relationships, con- tribute to the total anomaly assessment of indi vidual nodes. By e v aluating a v ariety of detection methods across di- verse datasets, we provide a comprehensiv e understand- ing of how spectral neighbor information improv es GAD performance. This extensi ve inv estigation highlights the general utility of neighbor signals in resolving seman- tic inconsistencies that traditional methods often overlook. For further details and extended results, please refer to https://github .com/huafeihuang/NeiGAD. Fig. 3. Empirical observation of NeiGAD. C. T echnical Details of NeiGAD NeiGAD extracts spectral information by performing eigendecomposition on the adjacency matrix A . As estab- lished by Theorem 1 , the eigen vectors of the adjacency matrix intrinsically encode neighbor information, with each vector component reflecting the linear average of its neigh- bors. T o lev erage this property , a subset of eigen vectors is selected to represent neighbor information, denoted as: u i = ( u i, 1 , u i, 2 , . . . , u i,n ) ⊤ . (9) When graph con v olution or similar operations are applied, this spectral representation amplifies the mismatch between anomalous nodes and their neighbors, thereby enhancing anomaly detection performance. According to Theor em 2 , selecting eigen vector increases the anomaly degree by accentuating the mismatch between nodes and their neighbor information. T o strike a balance between computational efficienc y and detection accuracy , NeiGAD selects 2 - 10 eigenv ectors corresponding to the largest eigenv alues. This selection is ef ficiently achieved using the Arnoldi Package algorithm. This algorithm directly computes the top t eigenv alues and their corresponding eigen v ectors in descending order , circumventing the need for a full eigendecomposition of the adjacency matrix. By av oiding the computation of all eigen vectors, NeiGAD significantly reduces computational complexity while main- taining accuracy . T ABLE I C O MPA R IS O N O F R OC - AU C I N P E RC E N T AG E ( % ) . Method V ersion Books Enron Cora Citeseer Pubmed A CM Blog DBLP A vg MLP AE vanilla 68 . 65 76 . 37 76 . 19 73 . 70 74 . 60 74 . 93 77 . 49 74 . 39 +5 . 74 +NeiGAD +8 . 25 +19 . 44 +0 . 74 +0 . 19 +12 . 54 +3 . 73 +0 . 11 +0 . 89 GCN AE vanilla 70 . 03 74 . 20 76 . 36 71 . 88 74 . 62 74 . 81 74 . 66 74 . 01 +4 . 08 +NeiGAD +6 . 10 +6 . 29 +1 . 39 +0 . 96 +12 . 94 +3 . 50 +0 . 28 +1 . 21 DOMIN ANT vanilla 68 . 54 71 . 03 89 . 79 93 . 81 83 . 21 81 . 44 69 . 62 96 . 13 +1 . 26 +NeiGAD +5 . 49 +3 . 52 +0 . 12 +0 . 45 +0 . 22 +0 . 13 +0 . 08 +0 . 10 AnomalyD AE vanilla 72 . 52 80 . 13 77 . 24 72 . 12 74 . 83 74 . 87 74 . 80 74 . 21 +3 . 57 +NeiGAD +3 . 30 +6 . 41 +0 . 67 +0 . 72 +12 . 52 +3 . 53 +0 . 38 +1 . 05 CoLA vanilla 70 . 17 77 . 26 68 . 87 71 . 01 56 . 29 55 . 96 63 . 69 55 . 09 +3 . 26 +NeiGAD +2 . 05 +12 . 99 +1 . 81 +1 . 64 +2 . 57 +1 . 07 +3 . 18 +0 . 76 GAAN vanilla 67 . 53 95 . 11 76 . 81 73 . 66 91 . 89 89 . 78 80 . 40 75 . 17 +1 . 91 +NeiGAD +9 . 01 +0 . 49 +0 . 95 +0 . 64 +2 . 37 +1 . 23 +0 . 40 +0 . 19 GADNR vanilla 57 . 93 86 . 57 77 . 65 76 . 72 80 . 08 73 . 06 56 . 52 76 . 02 +2 . 64 +NeiGAD +5 . 85 +1 . 50 +1 . 50 +3 . 91 +3 . 81 +0 . 99 +3 . 10 +0 . 42 FIAD vanilla 63 . 38 61 . 34 89 . 22 93 . 20 89 . 69 89 . 52 74 . 25 96 . 30 +3 . 30 +NeiGAD +13 . 75 +5 . 97 +1 . 62 +1 . 45 +2 . 11 +0 . 80 +0 . 42 +0 . 26 AHF AN vanilla 70 . 94 72 . 63 87 . 37 90 . 25 87 . 09 87 . 01 87 . 47 90 . 39 +4 . 09 +NeiGAD +2 . 64 +7 . 00 +3 . 18 +2 . 21 +4 . 51 +2 . 89 +6 . 29 +3 . 97 A vg +6 . 27 +7 . 07 +1 . 33 +1 . 35 +5 . 95 +1 . 99 +1 . 62 +0 . 98 D. Complexity of NeiGAD Eigendecomposition typically incurs O ( n 3 ) computa- tional complexity for capturing global neighbor information. Howe v er , NeiGAD optimizes this by a voiding full eigende- composition or eigen vector ranking. Instead, it selectiv ely focuses on a small subset of eigenv ectors, reducing un- necessary computations. Utilizing the ARP A CK, NeiGAD achiev es a lo wer time complexity of O ( nt 2 ) , where t is the number of selected eigen vectors, and a space comple xity of O ( n ) . This approach ensures computational efficiency and scalability . V . E X P E R I M E N T S A. Datasets W e selected eight commonly used real-world graph datasets for the experiments. • Books [13]: Sourced from the Amazon netw ork, utilizing user-pro vided tags. The outlier ground truth is defined by products tagged as ‘amazonfail’ by 28 users, reflecting user disagreement with sales ranks. • Enron [13]: A communication network where email transmissions form edges between email addresses. Each node possesses 18 attributes, including aggregated statis- tics on av erage email content length and recipient count. • Cora [14], Citeseer [14], Pubmed [14], A CM [15]: Citation networks of scientific publications. Nodes rep- resent articles, and edges denote citation relationships. The attribute vector for each node is a bag-of-words representation determined by the dictionary size. • BlogCatalog (shortened to Blog): A social network from the BlogCatalog platform. Nodes represent users, and edges indicate follo wer relationships. • DBLP [16]: A citation network comprising 5 , 484 sci- entific publications and 8 , 117 citation edges. B. Baselines The experiments utilize nine commonly used GAD meth- ods as baselines, to which the proposed module applies: • MLP AE [17] and GCN AE [18] are auto-encoders that serve MLP and GCN as their encoders and decoders. • DOMIN ANT [4] uses a GCN encoder but reconstructs graph structure and attrib utes differently for anomaly detection. • AnomalyD AE [19] jointly learns node attributes and topological patterns for comprehensi ve anomaly detec- tion. • GAAN [8] applies generati v e adversarial networks to identify anomalies in graph data. • CoLA [9] lev erages contrastiv e learning to capture anomaly information from multiple node pairs. • GADNR [11] focuses on neighborhood and local struc- ture analysis to impro ve the detection of various anomaly types. • AHF AN [10] utilizes semantic fusion and attention mechanisms to address class and semantic inconsistency in GAD. • FLAD [20] is a dimension-based method that injects anomalies into feature information, aiming to de velop a more generalized anomaly detector . C. Comparison Results T able I compares vanilla methods with their NeiGAD- enhanced versions, showing consistent ROC-A UC score improv ements across all datasets and methods. A verage performance gains for each method and dataset are provided in the last column and row , respectively . NeiGAD enhances all baseline methods, demonstrating its effecti veness and adaptability as a pluggable component. Notably , simpler models like MLP AE, GCN AE and AHF AN show larger av erage improv ements ( 5 . 74% , 4 . 08% , and 4 . 09% respec- tiv ely), while more complex methods achiev e smaller yet steady gains. NeiGAD’ s impact also varies across datasets. Improv ements are more pronounced on datasets such as Books, Enron, and Pubmed (often exceeding 10% ), whereas Cora and Citeseer show smaller gains (around 1% ). This variation may stem from dataset-specific characteristics, such as graph density or feature diversity . NeiGAD’ s con- sistent performance across div erse architectures and datasets underscores its role as a general and effecti v e enhancement for GAD tasks. T ABLE II T R AI N I N G T I M E F O R E AC H M E T HO D ( S ) . Method Books Enron Cora Citeseer Pubmed A CM Blog DBLP MLP AE 0 . 41 0 . 83 0 . 54 0 . 75 1 . 26 4 . 00 1 . 57 1 . 43 0 +0 . 01 +0 . 02 +0 . 03 +0 . 03 +0 . 38 +0 . 11 +0 . 19 GCN AE 0 . 62 1 . 53 0 . 98 1 . 48 2 . 09 18 . 94 29 . 26 3 . 53 0 +0 . 08 +0 . 02 +0 . 02 +0 . 06 +0 . 27 +0 . 29 +0 . 13 DOM 0 . 82 5 . 88 1 . 30 1 . 90 10 . 80 25 . 39 30 . 24 4 . 37 0 +0 . 03 +0 . 06 +0 . 20 +0 . 04 +0 . 27 +0 . 06 +0 . 05 D AE 0 . 90 6 . 69 1 . 13 1 . 40 11 . 98 12 . 60 3 . 91 2 . 83 +0 . 02 +0 . 05 +0 . 04 +0 . 01 +0 . 03 +0 . 34 +0 . 05 +0 . 11 CoLA 0 . 76 1 . 74 0 . 96 1 . 06 1 . 75 4 . 33 3 . 01 1 . 60 +0 . 05 +0 . 01 +0 . 05 +0 . 02 +0 . 03 +0 . 26 +0 . 15 +0 . 03 GAAN 1 . 33 70 . 04 3 . 33 4 . 18 50 . 47 119 . 64 132 . 40 9 . 84 +0 . 10 +0 . 03 +0 . 05 +0 . 22 +1 . 24 +1 . 87 +1 . 75 +0 . 11 GADNR 6 . 91 54 . 01 10 . 21 11 . 90 59 . 44 53 . 56 26 . 01 17 . 35 +0 . 03 +0 . 01 +0 . 10 +0 . 21 +0 . 14 +0 . 15 +0 . 01 +0 . 08 FIAD 3 . 55 45 . 25 6 . 94 15 . 19 94 . 96 102 . 65 23 . 98 23 . 57 +0 . 26 +1 . 07 +0 . 06 +0 . 07 +1 . 33 +0 . 57 +0 . 81 +0 . 04 AHF AN 3 . 35 7 . 12 3 . 23 3 . 18 5 . 56 7 . 50 9 . 04 3 . 45 +0 . 50 +0 . 12 +0 . 02 +0 . 02 +0 . 08 +0 . 02 +0 . 18 +0 . 18 D. Cost Comparison T o ev aluate scalability , we compare the training effi- ciency of nine baseline methods before and after inte grating NeiGAD (see T able II). The results indicate that NeiGAD is highly efficient, with the additional training time being almost negligible across all datasets. For most models like MLP AE and CoLA, the overhead is under 0 . 05 seconds in smaller graphs. Notably , even for larger -scale graphs such as A CM and Blog, the relati ve growth in computational cost remains exceptionally low , typically within a 1 % to 3 % margin. These findings confirm that incorporating spectral neighbor information does not burden the model’ s training phase, making NeiGAD well-suited for real-world GAD tasks where both accuracy and speed are paramount. V I . C O N C L U S I O N NeiGAD is proposed as a nov el plug-and-play module designed to enhance GAD by lev eraging spectral neighbor information. Based on theoretical insights, eigen v ectors cor- responding to the largest eigen v alues of the adjacency matrix are utilized to effecti vely encode neighbor relationships. T o ensure both efficienc y and accuracy , 2 to 10 eigenv ectors are selected using the ARP A CK, which significantly reduces the computational complexity . NeiGAD offers flexibility , seamlessly integrating into v arious existing anomaly detec- tion methods. Experimental results consistently demonstrate its ability to improve detection performance across div erse models and datasets. Future work will explore further op- timizations and extend NeiGAD to handle even larger and more complex graph datasets. R E F E R E N C E S [1] F . Xia, C. Peng, J. Ren, F . G. Febrinanto, R. Luo, V . Saikrishna, S. Y u, and X. K ong, “Graph learning, ” F oundations and T r ends® in Signal Pr ocessing , pp. 362–519, 2026. [2] H. Qiao, H. T ong, B. An, I. King, C. Aggarwal, and G. Pang, “Deep graph anomaly detection: A survey and new perspectives, ” IEEE T r ansactions on Knowledge and Data Engineering , vol. 37, no. 9, 2025. [3] Y . Gao, X. W ang, X. He et al. , “ Alleviating structural distribution shift in graph anomaly detection, ” in WSDM , 2023. [4] K. Ding, J. Li, R. Bhanushali et al. , “Deep anomaly detection on attributed networks, ” in ICDM , 2019. [5] R. W ang, L. Xi, F . Zhang et al. , “Context correlation discrepancy analysis for graph anomaly detection, ” TKDE , 2025. [6] R. Luo, H. Huang, S. Y u et al. , “FairGT: A fairness-aw are graph transformer , ” in IJCAI , 2024. [7] D. Bo, C. Shi, L. W ang et al. , “Specformer: Spectral graph neural networks meet transformer , ” in ICML , 2023. [8] Z. Chen, B. Liu, M. W ang et al. , “Generativ e adversarial attributed network anomaly detection, ” in CIKM , 2020. [9] Y . Liu, Z. Li, S. Pan et al. , “ Anomaly detection on attributed networks via contrastiv e self-supervised learning, ” TNNLS , 2022. [10] X. W ang, H. Dou, D. Dong et al. , “Graph anomaly detection based on hybrid node representation learning, ” NN , 2025. [11] A. Roy , J. Shu, J. Li et al. , “GAD-NR: Graph anomaly detection via neighborhood reconstruction, ” in WSDM , 2024. [12] R. Luo, H. Huang, T . T ang, J. Ren, Z. Xu, M. Hou, E. Dai, and F . Xia, “FairGE: Fairness-aware graph encoding in incomplete social networks, ” in WWW , 2026. [13] P . I. S ´ anchez, E. M ¨ uller , F . Laforet et al. , “Statistical selection of congruent subspaces for mining attributed graphs, ” in ICDM , 2013. [14] P . Sen, G. Namata, M. Bilgic et al. , “Collective classification in network data, ” AI MA GAZINE , 2008. [15] J. T ang, J. Zhang, L. Y ao et al. , “ ArnetMiner: Extraction and mining of academic social networks, ” in KDD , 2008. [16] X. Y uan, N. Zhou, S. Y u et al. , “Higher-order structure based anomaly detection on attributed networks, ” in Big Data , 2021. [17] M. Sakurada and T . Y airi, “ Anomaly detection using autoencoders with nonlinear dimensionality reduction, ” in MLSDA , 2014. [18] T . N. Kipf and M. W elling, “Semi-supervised classification with graph con volutional networks, ” in ICLR , 2017. [19] H. Fan, F . Zhang, and Z. Li, “ Anomalydae: Dual autoencoder for anomaly detection on attributed networks, ” in ICASSP , 2020. [20] A. Chen, J. W u, and H. Zhang, “FIAD: Graph anomaly detection framew ork based feature injection, ” Expert Systems with Applications , 2025.
Original Paper
Loading high-quality paper...
Comments & Academic Discussion
Loading comments...
Leave a Comment