Physics-informed line-of-sight learning for scalable deterministic channel modeling
Deterministic channel modeling maps a physical environment to its site-specific electromagnetic response. Ray tracing produces complete multi-dimensional channel information but remains prohibitively expensive for area-wide deployment. We identify li…
Authors: Xiucheng Wang, Junxi Huang, Conghao Zhou
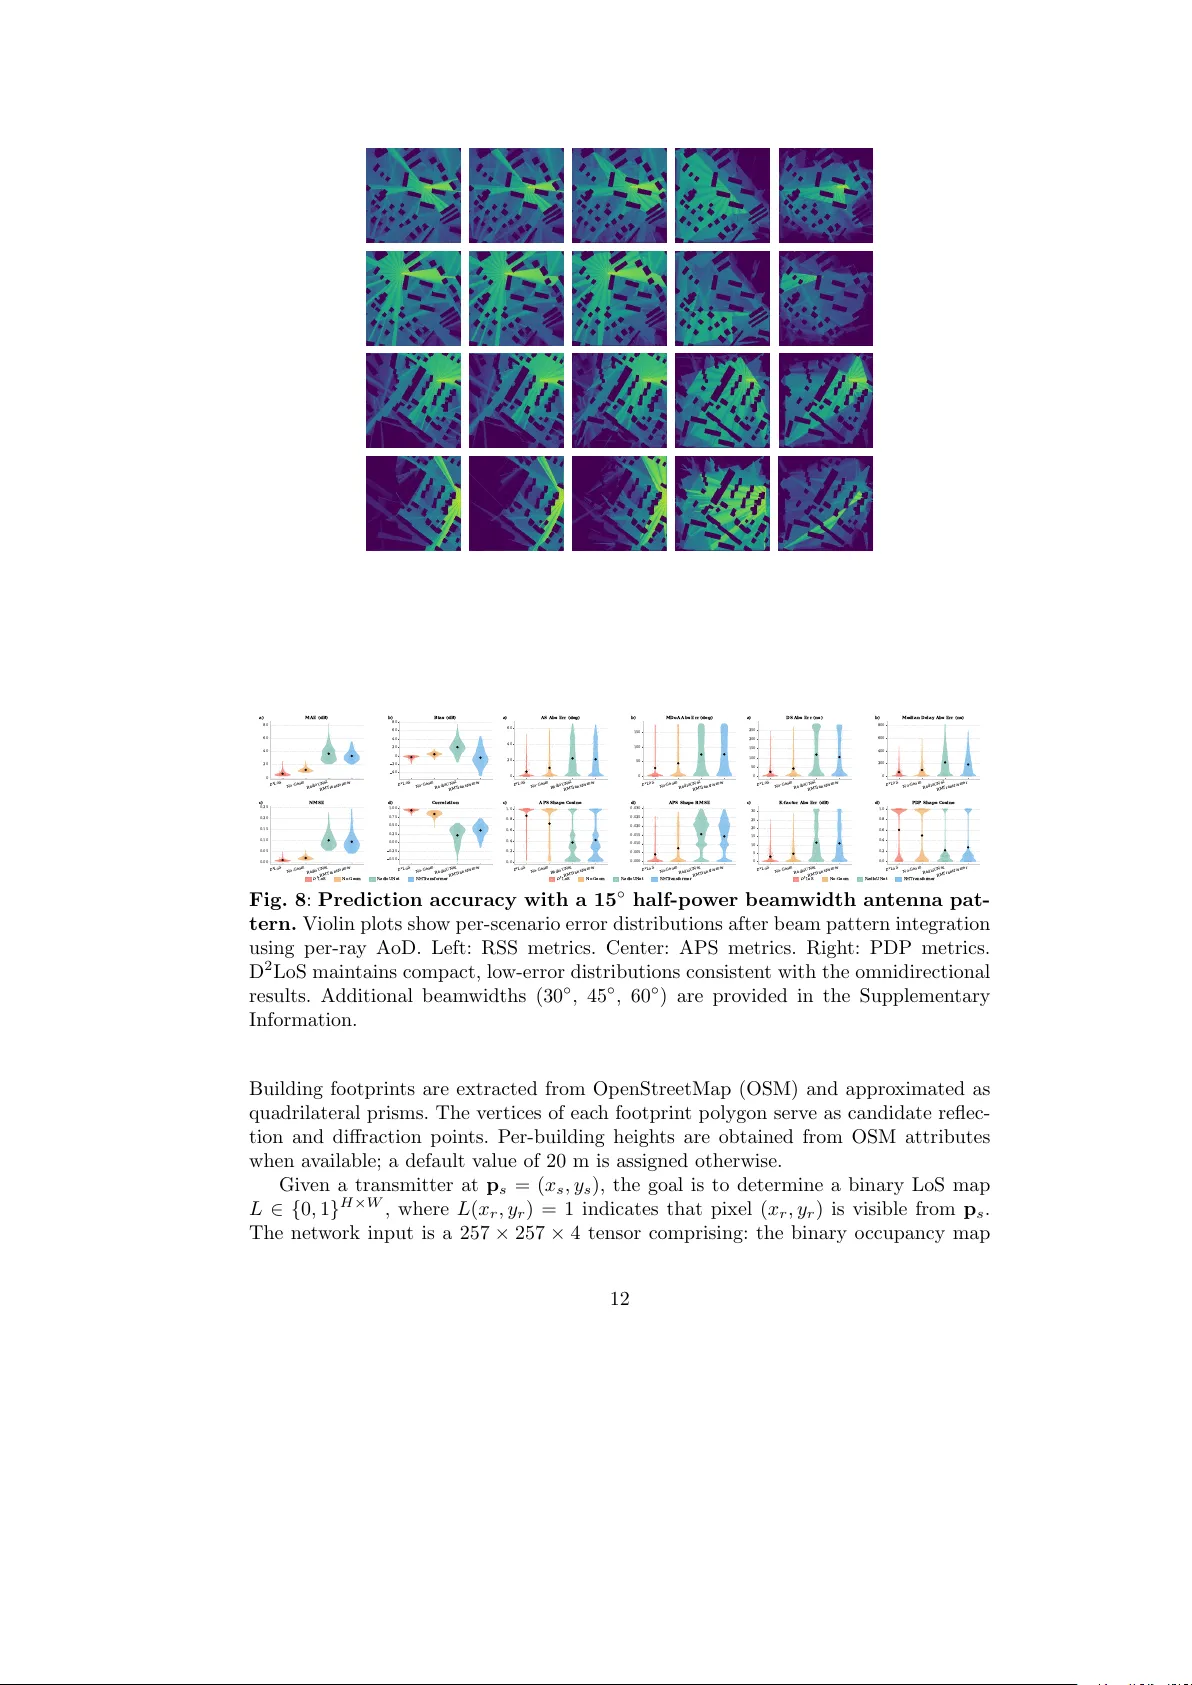
Ph ysics-informed line-of-sigh t learning for scalable deterministic c hannel mo deling Xiuc heng W ang 1 , Junxi Huang 1 , Conghao Zhou 1* , Xuemin Shen 2 , Nan Cheng 1* 1* Sc ho ol of T elecommunications Engineering, Xidian Univ ersit y , No. 2 South T aibai Road, Xi’an, 710071, Shaanxi, China. 2 Departmen t of Electrical and Computer Engineering, Universit y of W aterlo o, 200 Univ ersity Av en ue W est, W aterlo o, N2L 3G1, Ontario, Canada. *Corresp onding author(s). E-mail(s): conghao.zhou@ieee.org ; dr.nan.c heng@ieee.org ; Con tributing authors: xcwang 1@stu.xidian.edu.cn ; 24012100067@stu.xidian.edu.cn ; sshen@u waterloo.ca ; Abstract Deterministic c hannel mo deling maps a ph ysical environmen t to its site-sp ecific electromagnetic resp onse. Ra y tracing pro duces complete m ulti-dimensional c hannel information but remains prohibitively exp ensiv e for area-wide deplo y- men t. W e iden tify line-of-sigh t (LoS) region determination as the dominan t b ottlenec k. T o address this, we prop ose D 2 LoS, a physics-informed neural net- w ork that reform ulates dense pixel-level LoS prediction into sparse v ertex-level visibilit y classification and pro jection p oin t regression, av oiding the sp ectral bias at sharp b oundaries. A geometric p ost-processing step enforces hard physical constrain ts, yielding exact piecewise-linear b oundaries. Because LoS compu- tation dep ends only on building geometry , cross-band channel information is obtained by updating material parameters without retraining. W e also construct Ra yV erse-100, a ra y-level dataset spanning 100 urban scenarios with p er-ra y complex gain, angle, dela y , and geometric tra jectory . Ev aluated against rigor- ous ray tracing ground truth, D 2 LoS achiev es 3.28 dB mean absolute error in receiv ed p o w er, 4.65 ◦ angular spread error, and 20.64 ns dela y spread error, while accelerating visibilit y computation b y o ver 25 × . Keyw ords: Deterministic channel modeling, radio map, line-of-sight, 6G nativ e-AI. 1 1 In tro duction Deterministic channel mo deling maps a physical en vironment to its exact electro- magnetic resp onse. It pro vides site-sp ecific c hannel state information (CSI) for 6G net work optimization [ 1 ], digital t win construction [ 2 , 3 ], and physical-la yer AI appli- cations [ 4 – 6 ]. Unlik e stochastic mo dels that discard spatial structure by design [ 7 – 9 ], deterministic approac hes preserve the gain, angle, delay , and geometric tra jectory of ev ery propagation path [ 10 ]. This level of detail is essential for coherent b eamform- ing [ 11 , 12 ], MIMO c hannel matrix construction [ 13 ], and b eam management in dense urban deploymen ts [ 14 , 15 ]. How ev er, generating suc h complete channel information at area-wide scale remains an op en c hallenge. Ra y tracing (R T) is the only metho d that produces multi-dimensional channel parameters in a single computation [ 10 , 16 ], y et its cost is prohibitiv e for large-scale deploymen t [ 17 ]. This tension b et ween infor- mation completeness and computational scalability motiv ates the search for efficien t alternativ es. Existing learning-based approaches address only fragmen ts of this problem [ 18 – 21 ]. Link-lev el metho ds predict p oint-to-point channel parameters from lo cal features but cannot pro duce spatial cov erage maps [ 22 ]. Area-lev el radio map (RM) construction metho ds pro vide cov erage predictions, y et most focus on receiv ed p ow er alone [ 23 ]. Recen t efforts hav e explored angular and dela y profile estimation, but each dimen- sion requires a separately trained mo del at considerable cost. Mean while, a v ailable datasets offer either aggregate path-loss maps or dominant-path summaries [ 21 , 24 ]. A few datasets provide per-path angle and delay parameters, but explicit geomet- ric ray tra jectories remain absen t [ 24 , 25 ]. This gap betw een what AI-driv en net work optimization demands and what current methods deliv er remains unresolv ed. W e mak e tw o k e y observ ations that guide our approac h. First, the computational b ottlenec k of R T lies not in the m ulti-b ounce path search but in the preceding line- of-sigh t (LoS) prepro cessing step [ 26 , 27 ]. F or a scenario with m building vertices, the classical rotational sw eep algorithm requires O ( m log m ) op erations p er transmitter [ 28 ]. The subsequen t path searc h op erates on precomputed visibility adjacency via b ounded-depth graph tra versal, whose p er-query cost is substan tially low er [ 29 , 30 ]. Second, in a 2D environmen t of p olygonal obstacles, the LoS b oundary seen from any p oin t source is piecewise-linear. Eac h b oundary segmen t is defined b y a visible building v ertex and its pro jection onto a farther building edge. These t wo observ ations suggest a natural decomp osition: the net work predicts sparse vertex-lev el attributes, and the sharp b oundary is reconstructed analytically . Here w e introduce D 2 LoS 1 , a physics-informed neural netw ork that addresses the LoS b ottlenec k through v ertex-level geometric decomp osition. W e also release Ra yV erse-100 2 , a ray-lev el dataset spanning 100 diverse urban scenarios with p er-ray complex gain, angle, dela y , and complete geometric tra jectory . The main con tributions are as follo ws. 1. W e reformulate LoS map prediction from dense pixel-level classification into sparse v ertex-level visibilit y classification and pro jection p oin t regression. This formulation 1 Code is a v ailable at https://github.com/UNIC- Lab/D2LoS . 2 Dataset is av ailable at https://gith ub.com/UNIC- Lab/RayV erse . 2 a voids the spectral bias of neural net works at sharp LoS b oundaries. Com bined with a geometric post-pro cessing step that enforces hard ph ysical constrain ts, D 2 LoS reduces p er-transmitter prepro cessing complexity from O ( m log m ) to O ( M log M + n ), where M is the num b er of b oundary vertices with M ≪ m and n is the num b er of ev aluation p oin ts. In typical urban scenarios, M log M ≪ n , yielding an effectiv e cost of O ( n ). 2. Because LoS computation dep ends only on building geometry , it is inheren tly frequency-indep enden t. Once geometric ra y paths are determined, cross-band chan- nel information is obtained by up dating material parameters through uniform theory of diffraction (UTD) [ 31 ] formulations without retraining. This enables uni- fied m ulti-dimensional radio map construction cov ering received signal strength (RSS), angular pow er spectrum (APS), and pow er dela y profile (PDP) from a single pip eline. 3. W e construct Ra yV erse-100, a ra y-level dataset spanning 100 diverse urban sce- narios. Eac h record captures p er-ra y complex gain, angle of arriv al (AoA), angle of departure (AoD), propagation dela y , and complete geometric tra jectory with 3D reflection-point co ordinates. T o our knowledge, this is the first op en dataset pro viding explicit p er-ra y geometric tra jectories at this scale. W e also pro vide post- pro cessing in terfaces for coheren t sup erposition, MIMO channel matrix synthesis, and cross-band CSI generation. 4. Ev aluated against rigorous R T ground truth on unseen test scenarios, D 2 LoS ac hieves 3.28 dB mean absolute error in RSS, 4.65 ◦ angular spread error, and 20.64 ns delay spread error, while accelerating visibilit y computation by o ver 25 × . 2 Results W e ev aluate D 2 LoS on the Ra yV erse-100 dataset against three baselines. No-Geom remo ves the geometric p ost-processing from D 2 LoS and uses raw neural netw ork pre- dictions directly . RadioUNet is a U-Net architecture that predicts pixel-lev el LoS maps. RMT ransformer is a vision transformer v ariant designed for radio map estimation. All metho ds receive the same input and are trained on the same LoS corpus. The ground truth is produced by exact rotational sweep ra y tracing with UTD field computation. F or eac h ev aluation p oin t, the top-8 rays rank ed b y path gain are retained. D 2 LoS ac hiev es high-fidelity m ulti-dimensional radio maps D 2 LoS consistently outp erforms all baselines across three channel dimensions. In receiv ed signal strength (RSS) prediction, D 2 LoS achiev es a mean absolute error (MAE) of 3.28 dB and a P earson correlation of 0.954 av eraged ov er 100 test scenarios (T able 1 ). The closest baseline, No-Geom, yields an MAE of 12.65 dB and a correla- tion of 0.647. RadioUNet and RMT ransformer pro duce MAEs exceeding 32 dB with correlations b elo w 0.18, indicating near-complete failure in spatial p o w er prediction. The adv antage extends to angular and delay domains. F or the angular p o wer sp ectrum (APS), D 2 LoS achiev es an angular spread error of 4.65 ◦ and a shap e cosine similar- it y of 0.892 (T able 2 ). F or the pow er dela y profile (PDP), D 2 LoS ac hieves a dela y spread error of 20.64 ns and a K -factor error of 2.23 dB (T able 3 ). In b oth domains, 3 T able 1 : Received signal strength prediction accuracy across 100 test scenarios. Six metrics are reported as mean ± standard deviation ov er all scenarios in RayV erse-100. D 2 LoS ac hieves the lo w est error and highest correlation across all metrics. No-Geom denotes D 2 LoS without geometric post-pro cessing. RadioUNet and RMT ransformer are pixel-level LoS prediction baselines. Bold v alues indicate the b est p erformance. Metric D 2 LoS No-Geom RadioUNet RMT ransformer Bias (dB) -1.69 ± 3.82 -2.96 ± 11.76 -6.78 ± 26.30 -26.60 ± 28.39 MAE (dB) 3.28 ± 3.82 12.65 ± 10.01 32.80 ± 11.87 40.85 ± 15.98 RMSE (dB) 7.28 ± 4.57 19.92 ± 11.27 40.12 ± 11.38 48.11 ± 15.42 MSE (dB 2 ) 73.93 ± 174.32 523.75 ± 725.86 1738.76 ± 1120.59 2552.54 ± 1616.15 NMSE 0.0088 ± 0.0297 0.0826 ± 0.1481 0.2695 ± 0.2756 0.4789 ± 0.4912 Correlation 0.9537 ± 0.0603 0.6473 ± 0.3076 0.1350 ± 0.2824 0.1708 ± 0.3084 T able 2 : Angular pow er sp ectrum prediction accuracy . F our metrics are rep orted as the mean o ver all ev aluation points across 100 test scenarios. Angular spread (AS) absolute error and mean direction of arriv al (MDoA) absolute error measure first-order angular statistics. Shape cosine and shap e RMSE quantify the similarity b etw een predicted and ground-truth APS pro- files. Metric D 2 LoS No-Geom RadioUNet RMT ransformer AS Abs. Err. (deg) 4.65 11.80 22.91 23.37 MDoA Abs. Err. (deg) 17.07 37.72 70.09 74.64 Shape Cosine 0.8924 0.6667 0.3158 0.2902 Shape RMSE 0.0035 0.0090 0.0170 0.0177 RadioUNet and RMT ransformer yield shape cosine v alues below 0.32. These lo w v al- ues indicate that their predicted angular and delay profiles bear little resem blance to the ground truth. Fig. 1 provides a qualitative comparison across four represen tative scenarios. D 2 LoS repro duces b oth the LoS regions near the transmitter and the shado w b oundaries b ehind buildings. No-Geom captures the coarse spatial pattern but produces blurred transitions at building edges. RadioUNet and RMT ransformer fail to reconstruct meaningful spatial structures. RadioUNet generates near-uniform p ow er distributions that lose all shadow b oundary detail. RMT ransformer pro duces narrow beam-like arti- facts that do not corresp ond to an y physical propagation pattern. These qualitative observ ations are consisten t with the quantitativ e metrics in T ables 1 – 3 . 4 T able 3 : P o wer delay profile prediction accuracy . Six metrics are reported as the mean o ver all ev aluation points across 100 test scenarios. Delay spread (DS) and median dela y capture temporal disp ersion. K -factor error reflects the dominan t-to- scattered path ratio accuracy . Effective count measures the num ber of resolv able m ultipath comp onen ts. Metric D 2 LoS No-Geom RadioUNet RMT ransformer DS Abs. Err. (ns) 20.64 46.11 90.93 97.94 Median Delay Abs. Err. (ns) 47.91 126.67 245.72 237.56 K -factor Abs. Err. (dB) 2.23 4.61 8.77 9.41 Effective Count Abs. Err. 4.88 11.82 26.78 26.48 Shape Cosine 0.6434 0.4610 0.1743 0.1407 Shape RMSE 0.0327 0.0496 0.0743 0.0763 Geometric p ost-pro cessing is critical for b oundary-sensitiv e metrics T o isolate the contribution of geometric p ost-processing, we compare D 2 LoS with its ablated v ariant No-Geom. This v ariant uses ra w neural netw ork predictions without edge snapping or ra y-edge in tersection refinemen t. The impact of remo ving this step is substan tial across all three channel dimensions. In RSS, the MAE increases from 3.28 to 12.65 dB and the correlation drops from 0.954 to 0.647 (T able 1 ). In the angular domain, the APS shap e cosine decreases from 0.892 to 0.667, and the mean direction of arriv al error gro ws from 17.07 ◦ to 37.72 ◦ (T able 2 ). In the dela y domain, the degradation is even more pronounced. The PDP shap e cosine drops from 0.643 to 0.461, and the median delay error increases from 47.91 to 126.67 ns (T able 3 ). These results confirm that geometric post-pro cessing is not a marginal refinemen t but a critical component of the pip eline. The qualitativ e comparisons reinforce these findings. In the APS curves (Fig. 2 ), No-Geom preserv es the dominant arriv al directions but in tro duces noticeable errors in secondary p eaks. In the PDP curves (Fig. 3 ), No-Geom exhibits shifted p eak posi- tions and atten uated late-arriving comp onen ts. These shifts indicate that b oundary inaccuracies propagate into systematic path length errors in the downstream ray trac- ing. The delay domain shows a larger relativ e degradation than the angular domain. This asymmetry arises b ecause a small boundary shift ma y preserve the appro ximate arriv al angle of a reflected path while directly altering the total propagation distance. The resulting delay errors accumulate across m ultiple b ounces. This pattern is con- sisten t across all 100 test scenarios, as confirmed by the violin distributions in Fig. 5 and Fig. 6 . Pixel-lev el baselines fail at LoS b oundary reconstruction RadioUNet and RMT ransformer b oth formulate LoS prediction as dense pixel-level image-to-image translation. Their p erformance collapses across all channel dimensions. In RSS prediction, RadioUNet ac hieves a correlation of only 0.135 and RMT ransformer 5 GT RadioUNet D 2 Los No-Geom RMTransformer Fig. 1 : Qualitativ e comparison of RSS radio maps across four represen ta- tiv e scenarios. Eac h ro w corresponds to one s cenario from the Ra yV erse-100 test set. Columns from left to righ t: ground truth (GT), D 2 LoS, No-Geom, RadioUNet [ 23 ], and RMT ransformer [ 32 ]. D 2 LoS repro duces the spatial p o wer distribution with high fidelity . No-Geom captures the coarse pattern but exhibits blurred b oundaries. RadioUNet and RMT ransformer fail to reconstruct meaningful spatial structures. ac hieves 0.171 (T able 1 ). These v alues indicate that the predicted p o wer maps are nearly uncorrelated with the ground truth. The violin distributions in Fig. 4 further rev eal heavy-tailed error distributions with large inter-scenario v ariance. Some sce- narios pro duce biases exceeding − 50 dB, corresponding to order-of-magnitude pow er prediction errors. The failure is equally severe in the angular and delay domains. Both baselines yield APS shape cosine v alues b elo w 0.32 (T able 2 ) and PDP shap e cosine v alues b elo w 0.18 (T able 3 ). These shap e cosine v alues indicate that the predicted profiles are essen tially random w ith respect to the ground truth. The qualitative results rev eal the underlying cause. The APS curves in Fig. 2 show noisy angular profiles with incorrect p eak p ositions and pow er lev els for b oth baselines. The PDP curves in Fig. 3 exhibit spurious p eaks and incorrect p ow er floors, partic- ularly at large delays where reflected and diffracted paths dominate. The RSS maps in Fig. 1 further illustrate this failure mo de. RadioUNet pro duces hea vily smoothed maps that erase all shado w b oundary detail. RMT ransformer generates narrow b eam- lik e artifacts unrelated to ph ysical propagation. These patterns are consistent with the sp ectral bias of neural netw orks, whic h fav ors low-frequency functions during train- ing. The resulting blurred LoS b oundaries remov e the sharp spatial transitions that define shadow regions in urban environmen ts. This sp ectral bias is the fundamental reason wh y pixel-level formulations cannot reconstruct the fine-grained LoS structure required for accurate c hannel mo deling. 6 GT No-Geom D 2 Los RadioUNet RMTransformer Fig. 2 : Qualitative comparison of angular p o w er sp ectra at selected receiv er lo cations. Eac h row corresp onds to one receiver position from a differen t test sce- nario. The horizon tal axis is the azim uth arriv al angle and the vertical axis is the receiv ed p o wer in dBm. D 2 LoS closely trac ks the ground truth. No-Geom preserv es dominan t arriv al directions but introduces errors in secondary p eaks. RadioUNet and RMT ransformer produce noisy angular profiles with incorrect p eak positions. P er-ra y angular information enables p ost-ho c b eam pattern in tegration A k ey adv an tage of ra y-lev el output is that arbitrary transmit antenna patterns can b e applied after the propagation simulation without re-execution. F or each retained ra y , the framew ork stores the AoD in b oth azim uth and elev ation. A directional an tenna gain G ant ( ϕ AoD , θ AoD ) is then multiplied on to each ray’s complex field before pow er summation. This produces b eam-sp ecific RSS, APS, and PDP maps from the same underlying ra y data. W e demonstrate this capabilit y with a 15 ◦ half-p o w er b eam width pattern. Fig. 7 sho ws the resulting RSS maps for the same four scenarios as Fig. 1 . The directional pattern concentrates energy along the b oresight and suppresses off- axis m ultipath comp onen ts. D 2 LoS accurately captures this directional filtering effect. It preserves b oth the b eam fo otprin t and the shado w structure behind buildings. No- Geom produces blurred b eam edges due to inaccurate LoS b oundaries. RadioUNet and RMT ransformer fail to generate ph ysically meaningful directional pow er distributions. The quan titative ev aluation in Fig. 8 confirms these observ ations across all three c hannel dimensions. D 2 LoS main tains compact, lo w-error distributions consisten t with the omnidirectional results. The p erformance ranking among metho ds is preserved after b eam in tegration. This indicates that applying a directional pattern do es not amplify the relativ e errors introduced b y LoS prediction inaccuracy . Additional results with 30 ◦ , 45 ◦ , and 60 ◦ b eam widths are pro vided in the Supplemen tary Information 7 GT No-Geom D 2 Los RadioUNet RMTransformer Fig. 3 : Qualitative comparison of p o wer dela y profiles at selected receiv er lo cations. Eac h row corresp onds to one receiver p osition from a different test scenario. The horizontal axis is the propagation delay in nanoseconds and the v ertical axis is the received p o wer in dBm. D 2 LoS accurately repro duces the delay-domain structure. No-Geom exhibits shifted p eak positions. RadioUNet and RMT ransformer produce dela y profiles with spurious p eaks at large delays. and show the same trend. This post-ho c integration capabilit y is una v ailable to conv en- tional radio map methods that output only aggregate receiv ed pow er. Suc h metho ds do not preserv e p er-ra y angular information and therefore cannot apply an tenna patterns or ev aluate b eam-specific co v erage after the fact. The ray-lev el output of D 2 LoS thus offers a practical adv antage for beam management and an tenna deploymen t planning in 6G systems. D 2 LoS accelerates visibilit y computation W e compare the end-to-end pro cessing time of D 2 LoS against the traditional R T pip eline. The traditional pip eline uses the rotational sw eep algorithm for LoS prepro- cessing. Both pip elines share the same breadth-first search (BFS) path searc h [ 33 ] and UTD field computation back end. All experiments are conducted on a single NVIDIA R TX Pro 6000 GPU. Fig. 9 a shows the p er-scenario processing time for ten test maps. The traditional pipeline requires 15 to 48 min per scenario, while D 2 LoS completes the same computation in under 1 min. The speedup factors range from 25 × to 71 × , with the v ariation attributable to differences in scenario complexit y . Fig. 9 b shows the cum ulative distribution across all test scenarios. The median pro cessing time is 0.5 min for D 2 LoS and 24.9 min for the traditional pip eline, represen ting a median sp eedup of approximately 50 × . 8 D 2 L o S No-Geom R adioUNet RMTransformer 0 20 40 60 80 a) MAE (dB) D 2 L o S No-Geom R adioUNet RMTransformer 75 50 25 0 25 50 b) Bias (dB) D 2 L o S No-Geom R adioUNet RMTransformer 0.0 0.5 1.0 1.5 2.0 c) NMSE D 2 L o S No-Geom R adioUNet RMTransformer 0.5 0.0 0.5 1.0 d) Correlation D 2 L o S No-Geom R adioUNet RMTransformer Fig. 4 : Distribution of RSS prediction errors across 100 test scenarios. Violin plots show the per-scenario distribution of six metrics: a) MAE, b) RMSE, c) bias, d) MSE, e) NMSE, and f ) Pearson correlation. Black diamonds indicate the mean. D 2 LoS exhibits b oth the low est mean error and the smallest v ariance. RadioUNet and RMT ransformer sho w wide distributions with heavy tails. This acceleration is ac hiev ed without sacrificing output completeness. The D 2 LoS pip eline pro duces the same ray-lev el output format as the traditional pip eline. Eac h ray stores complex gain, AoA, AoD, propagation dela y , and complete geometric tra jectory with 3D reflection-p oin t coordinates. Fig. 9 c sho ws the cum ulative distribution of the total ray count p er scenario. The D 2 LoS distribution closely matc hes the ground truth, confirming that the learned LoS prediction preserves the ra y-level completeness of the full R T pipeline. Eac h ra y is fully c haracterized for downstream applications, including coherent sup erposition, MIMO channel matrix synthesis, and cross-band CSI generation. The combination of o ver 25 × speedup and full ray-lev el output makes D 2 LoS a practical drop-in replacement for the LoS prepro cessing stage in existing R T w orkflows. 3 Discussion The results demonstrate that accurate LoS prediction is sufficient to pro duce high- fidelit y m ulti-dimensional radio maps. In the ra y tracing pipeline, LoS determination serv es as the gating step for all downstream computations. A correct LoS map ensures that b oth the direct path and the first-level v ertices of the BFS visibility tree are correctly identified. When LoS b oundaries are inaccurate, errors propagate m ultiplicatively through the multi-bounce path searc h, corrupting all channel dimen- sions simultaneously . This mechanism explains wh y geometric p ost-processing has a 9 D 2 L o S No-Geom R adioUNet RMTransformer 0 20 40 60 a) AS Abs Err (deg) D 2 L o S No-Geom R adioUNet RMTransformer 0 50 100 150 b) MDoA Abs Err (deg) D 2 L o S No-Geom R adioUNet RMTransformer 0.0 0.2 0.4 0.6 0.8 1.0 c) APS Shape Cosine D 2 L o S No-Geom R adioUNet RMTransformer 0.000 0.005 0.010 0.015 0.020 0.025 0.030 d) APS Shape RMSE D 2 L o S No-Geom R adioUNet RMTransformer Fig. 5 : Distribution of APS prediction errors across 100 test scenarios. Violin plots sho w: a) angular spread error, b) MDoA error, c) APS shap e cosine, and d) APS shap e RMSE. D 2 LoS ac hieves concentrated low-error distributions. The No- Geom v ariant shows moderate degradation. RadioUNet and RMT ransformer pro duce near-random angular predictions. stronger impact on dela y-domain metrics than on angular-domain metrics: a small b oundary shift may preserve the approximate arriv al angle of a reflected path, but it directly alters the total propagation distance, producing systematic delay errors that accum ulate across m ultiple bounces. The complete failure of RadioUNet and RMT ransformer highlights a fundamental limitation of pixel-lev el LoS prediction. Neural net works exhibit sp ectral bias, fa voring lo w-frequency functions during training. The resulting blurred LoS b oundaries remo ve the sharp shadow edges that define urban m ultipath structure. D 2 LoS circum v ents this b y predicting sparse vertex attributes instead of dense pixel maps. Binary visi- bilit y lab els and approximate pro jection coordinates are both low-frequency targets. The sharp LoS b oundary is then reconstructed analytically , preserving the geometric precision that do wnstream ray tracing requires. A key adv antage of the LoS-based decomp osition is its inherent frequency inde- p endence. The LoS computation dep ends only on building geometry , not on carrier frequency . F requency en ters solely through the UTD interaction co efficients, which can b e updated without re-executing visibility computation or path searc h. This dis- tinguishes D 2 LoS from existing radio map metho ds that require retraining for each frequency band. F urthermore, the p er-ray angular output enables post-ho c an tenna pattern integration, as demonstrated b y the b eam-sp ecific results across 15 ◦ , 30 ◦ , 45 ◦ , and 60 ◦ b eam widths. The ability to ev aluate arbitrary beam patterns from a single 10 D 2 L o S No-Geom R adioUNet RMTransformer 0 50 100 150 200 250 300 a) DS Abs Err (ns) D 2 L o S No-Geom R adioUNet RMTransformer 0 200 400 600 800 b) Median Delay Abs Err (ns) D 2 L o S No-Geom R adioUNet RMTransformer 0 5 10 15 20 25 30 c) K -factor Abs Err (dB) D 2 L o S No-Geom R adioUNet RMTransformer 0.0 0.2 0.4 0.6 0.8 1.0 d) PDP Shape Cosine D 2 L o S No-Geom R adioUNet RMTransformer Fig. 6 : Distribution of PDP prediction errors across 100 test scenarios. Violin plots show: a) delay spread error, b) median delay error, c) K -factor error, d) effectiv e count error, e) PDP shap e cosine, and f ) PDP shap e RMSE. D 2 LoS maintains compact error distributions. The gap b et w een D 2 LoS and No-Geom is larger in the dela y domain than in the angular domain. ra y tracing computation provides substan tial time savings for an tenna deploymen t planning in m ulti-band 6G systems. The RayV erse-100 dataset provides ray-lev el ground truth that existing datasets do not offer. Neither RadioMapSeer nor DeepMIMO exp oses explicit p er-ray geo- metric tra jectories with 3D reflection-p oint coordinates. This tra jectory information is essential for environmen t-aw are beam trac king, RIS placemen t optimization, and radar-comm unication co-design. Sev eral limitations should b e noted. The 2.5D building mo del introduces errors for complex ro oftop geometries. The 2D × 2D decomposition excludes ov er-ro oftop diffrac- tion paths. The ev aluation is conducted at street-lev el heigh t (1.5 m) and retains only the top-8 ra ys p er point. The geometric post-pro cessing uses a fixed searc h radius that ma y benefit from adaptive scaling. F uture work will extend the building mo del, incor- p orate o ver-rooftop diffraction, and in tegrate measured c hannel data through transfer learning to bridge the gap b etw een sim ulation and real-w orld deploymen t. 4 Metho ds En vironmen t representation and problem form ulation The propagation en vironment is enco ded as a top-down binary occupancy map E ∈ { 0 , 1 } H × W with H = W = 257 pixels at a spatial resolution of ∆ r = 1 m. 11 GT RadioUNet D 2 Los No-Geom RMTransformer Fig. 7 : RSS radio maps with a 15 ◦ directional b eam pattern. The same sce- narios as Fig. 1 are sho wn after post-ho c beam integration. D 2 LoS accurately captures the directional filtering effect, preserving b oth the b eam fo otprin t and shadow struc- ture. RadioUNet and RMT ransformer fail to pro duce meaningful directional patterns. D 2 L o S No-Geom R adioUNet RMTransformer 0 20 40 60 80 a) MAE (dB) D 2 L o S No-Geom R adioUNet RMTransformer 40 20 0 20 40 60 80 b) Bias (dB) D 2 L o S No-Geom R adioUNet RMTransformer 0.00 0.05 0.10 0.15 0.20 0.25 c) NMSE D 2 L o S No-Geom R adioUNet RMTransformer 0.50 0.25 0.00 0.25 0.50 0.75 1.00 d) Correlation D 2 L o S No-Geom R adioUNet RMTransformer D 2 L o S No-Geom R adioUNet RMTransformer 0 20 40 60 a) AS Abs Err (deg) D 2 L o S No-Geom R adioUNet RMTransformer 0 50 100 150 b) MDoA Abs Err (deg) D 2 L o S No-Geom R adioUNet RMTransformer 0.0 0.2 0.4 0.6 0.8 1.0 c) APS Shape Cosine D 2 L o S No-Geom R adioUNet RMTransformer 0.000 0.005 0.010 0.015 0.020 0.025 0.030 d) APS Shape RMSE D 2 L o S No-Geom R adioUNet RMTransformer D 2 L o S No-Geom R adioUNet RMTransformer 0 50 100 150 200 250 a) DS Abs Err (ns) D 2 L o S No-Geom R adioUNet RMTransformer 0 200 400 600 800 b) Median Delay Abs Err (ns) D 2 L o S No-Geom R adioUNet RMTransformer 0 5 10 15 20 25 30 c) K -factor Abs Err (dB) D 2 L o S No-Geom R adioUNet RMTransformer 0.0 0.2 0.4 0.6 0.8 1.0 d) PDP Shape Cosine D 2 L o S No-Geom R adioUNet RMTransformer Fig. 8 : Prediction accuracy with a 15 ◦ half-p o w er b eam width an tenna pat- tern. Violin plots sho w p er-scenario error distributions after beam pattern in tegration using p er-ray AoD. Left: RSS metrics. Center: APS metrics. Right: PDP metrics. D 2 LoS main tains compact, low-error distributions consisten t with the omnidirectional results. Additional b eam widths (30 ◦ , 45 ◦ , 60 ◦ ) are provided in the Supplementary Information. Building fo otprin ts are extracted from OpenStreetMap (OSM) and approximated as quadrilateral prisms. The vertices of each fo otprin t p olygon serve as candidate reflec- tion and diffraction points. Per-building heights are obtained from OSM attributes when av ailable; a default v alue of 20 m is assigned otherwise. Giv en a transmitter at p s = ( x s , y s ), the goal is to determine a binary LoS map L ∈ { 0 , 1 } H × W , where L ( x r , y r ) = 1 indicates that pixel ( x r , y r ) is visible from p s . The netw ork input is a 257 × 257 × 4 tensor comprising: the binary o ccupancy map 12 630 631 632 633 634 635 636 637 638 639 Map ID 0 10 20 30 40 50 Processing Time (min) 69× 57× 47× 37× 25× 67× 58× 71× 43× 29× a) Traditional Pipeline D 2 L o S ( O u r s ) 0 10 20 30 40 50 Processing Time (min) 0.0 0.2 0.4 0.6 0.8 1.0 Cumulative Probability 24.9 0.5 b) Traditional Pipeline D 2 L o S ( O u r s ) 0.0 0.5 1.0 1.5 2.0 2.5 3.0 T otal R ay Count 1e7 0.0 0.2 0.4 0.6 0.8 1.0 Cumulative Probability c) GT D 2 L o S No-Geom R adioUNet RMTransformer Fig. 9 : Computational efficiency comparison b etw een D 2 LoS and the tra- ditional R T pip eline. a) P er-scenario pro cessing time for ten test maps. Sp eedup factors range from 25 × to 71 × . b) Cum ulative distribution of pro cessing time. The median is 0.5 min for D 2 LoS and 24.9 min for the traditional pipeline. c) Cumulativ e distribution of the total ray count per scenario. All exp eriments use a single NVIDIA R TX Pro 6000 GPU. E , a Gaussian-blurred transmitter lo cation heatmap H Tx with σ = 3 pixels, and tw o spatial co ordinate grids X coord and Y coord . The ray tracing pip eline is decomp osed into tw o stages (Fig. 10 ): LoS prepro cessing, whic h determines m utual visibility among all geometric primitiv es, and BFS m ulti- b ounce path search, which enumerates v alid propagation paths. D 2 LoS replaces the LoS prepro cessing stage while preserving the standard path search and UTD field computation back end. V ertex-lev el LoS reformulation In a 2D en vironment comp osed of p olygonal obstacles, the LoS region b oundary as seen from a p oin t source p s is piecewise-linear. Each linear segment is defined b y a building vertex v i visible from p s and its pro jection p oin t v pro j i on a more distant building edge. The pro jection point is computed via ra y casting: a ray from p s passes through v i and extends until it first in tersects a building edge e j that is farther from p s and not parallel to the ray: v pro j i = p s + t ∗ i · ( v i − p s ) , t ∗ i = min j t > 1 ( p s + t · d i ) ∈ e j , d i × n e j = 0 , (1) where d i = v i − p s and n e j is the direction v ector of edge e j . Tw o prediction targets are defined for eac h building v ertex v i : a binary visibility lab el c i ∈ { 0 , 1 } indicating whether v i is visible from p s , and the pro jection point co ordinates ˆ v pro j i = ( ˆ x pro j i , ˆ y pro j i ), defaulting to v i for non-b oundary v ertices. All M building vertices are predicted sim ultaneously , av oiding the need to pre-select which v ertices determine the LoS b oundary . The net work predicts low-frequency attributes rather than a dense high-frequency b oundary map. The sharp LoS b oundary is reconstructed analytically from the predicted v ertex attributes in the p ost-pro cessing stage. 13 Environment Encoding OSM (OpenStreetMap) a Network Input 2D Occupancy Grid 2D Occupancy 257 257 Binary Map OSM (OpenStreetMap) Architecture Map Learned V isibility D 2 Los Core V ertex Le vel Decomposition U-Net V isibility Classification Projection Coordinate map Physical Refinement Geometric Post-processing + LoS Map Raw predict point Snapped to the nearest edge Refined point resulted by ray-edge intersection 2D occupancy grid LoS map Channel Computation R T Backend + Multi-Dimensional Output … … K=4 BFS visibility tree Rx Tx RSS Heatmap MIMO Channel APS PDP unified multi-dimensional D 2 Los Core V ertex Level Decomposition O (m logm) Complexity Timeline O (n) Corss-band: update Fig. 10 : Overview of the D 2 LoS framework. The pip eline tak es a binary o ccu- pancy map and transmitter p osition as input. The D 2 LoS netw ork predicts vertex-lev el visibilit y and pro jection coordinates. Geometric p ost-processing enforces ph ysical con- strain ts to pro duce an exact LoS map. A BFS path searc h and UTD field computation yield p er-ra y channel parameters. Cross-band information is obtained by up dating material parameters without re-executing visibility computation. Net w ork architecture and loss function W e employ a U-Net enco der-deco der with tw o mo difications at the bottleneck lay er. A trous spatial pyramid p ooling (ASPP) applies dilated conv olutions with rates { 1 , 6 , 12 , 18 } to capture o cclusion effects at multiple spatial scales. Sp ectral feature mo dulation follo ws the F ourier neural operator (FNO) paradigm: spatial features are transformed to the frequency domain via real FFT, modulated b y learned complex- v alued weigh ts, and transformed back via inv erse FFT. This pro vides a global receptiv e field in a single lay er and captures long-range shadow connectivit y that lo cal con volutions cannot efficiently mo del. The deco der pro duces tw o output heads via sub-pixel upsampling with co ordinate atten tion: a visibility classification map ˆ M ∈ [0 , 1] H × W and normalised pro jection co ordinates ˆ P ∈ [0 , 1] H × W × 2 . During inference, predictions are extracted at kno wn building vertex pixel lo cations, effectively implementing sparse vertex-lev el prediction through a dense net work arc hitecture. The comp osite loss function is L total = L F o cal + λ 1 L Dice + λ 2 L MaskedL1 . (2) F o cal loss with γ = 2 . 0 addresses class im balance b etw een visible and o ccluded v ertices. Dice loss with λ 1 = 1 . 0 enforces spatial connectivit y of predicted LoS regions. The 14 co ordinate regression head uses a masked L1 loss computed only at building-vertex pixels: L MaskedL1 = P ∥ ˆ P − P GT ∥ 1 · 1 ( M GT > 0 . 5) P 1 ( M GT > 0 . 5) , (3) ensuring that represen tational capacity concentrates on geometrically meaningful b oundary regions. W e set λ 2 = 20 . 0 based on h yp erparameter search. Geometric p ost-pro cessing and 3D extension Ra w neural netw ork predictions con tain residual regression errors in the pro jection co ordinates. W e exploit the physical constrain t that pro jection p oin ts must lie on building edges through a tw o-step refinement. In Step 1, for each predicted pro jection p oint ˆ v pro j i , the nearest building edge e ∗ j within a search radius R search = 5 m is iden tified. In Step 2, the intersection of the ra y from p s through vertex v i with edge e ∗ j is computed: v refined i = p s + t ∗ ( v i − p s ) , t ∗ = ( a − p s ) × ( b − a ) ( v i − p s ) × ( b − a ) , (4) where a and b are the endp oin ts of e ∗ j . The refined p oin t is accepted if t ∗ > 1 and the in tersection lies within the edge segmen t; otherwise, the ra w prediction is retained. A global path-clearance c heck verifies that the refined ray does not in tersect other buildings. The complete LoS map is reconstructed b y selecting b oundary v ertices V bnd = { v i | c i = 1 , v refined i = v i } , constructing segments [ v i , v refined i ], sorting them angularly with respect to p s , taking the union of unobstructed angular sectors, and rasterising on to the grid to pro duce ˆ L ∈ { 0 , 1 } H × W . T o extend to 3D visibility , w e adopt the 2D × 2D decomposition: LoS 3D ( p s , p r ) ≈ LoS 2D-H ( p s , p r ) ∧ LoS 2D-V ( p s , p r ) . (5) The horizon tal c heck LoS 2D-H is computed by D 2 LoS. The vertical chec k LoS 2D-V ev al- uates whether the elev ation angle of the direct path clears the heights of all interv ening buildings. Under the 2.5D extruded prism mo del, this decomp osition is mathematically exact (Supplemen tary Theorem S3). The transmitter and receiver heights are input parameters; the curren t ev aluation uses h tx = h rx = 1 . 5 m. Ov er-ro oftop diffraction paths are excluded from the current framework, as discussed in the limitations. Ra y tracing bac kend With LoS relationships determined, an N -ary visibility tree is constructed ro oted at the transmitter. V ertex-to-vertex LoS adjacency is precomputed once p er scenario using the exact rotational sweep algorithm. D 2 LoS provides transmitter-to-vertex vis- ibilit y , forming the first lev el of the tree. Multi-b ounce paths are en umerated via breadth-first search (BFS) with a maximum depth of K = 4, cov ering up to four com bined reflections and diffractions. The search is executed with GPU-parallel graph tra versal. 15 F or eac h v alid path, the complex electric field is computed as the pro duct of inter- action co efficien ts and free-space propagation factors along all segments. In teraction co efficien ts include F resnel reflection co efficien ts and UTD diffraction co efficien ts fol- lo wing the Luebbers lossy-dielectric extension. Two n umerical stabilit y mechanisms are applied: an env elop e clamp ensuring that diffracted field magnitude do es not exceed half the incident field, and a forward-scatter smo othing for deflection angles below 30 ◦ (Supplemen tary Theorem S2 and Supplementary Remark 1). Default material parameters at the reference frequency of 3.5 GHz are ϵ ′ r = 5 . 31 and σ = 0 . 0326 S/m. A t each ev aluation point, all arriving rays are rank ed by path gain and the top N ray = 8 ra ys are retained, capturing o ver 98% of the total receiv ed energy across all scenarios. Eac h retained ray stores: complex gain, AoA and AoD in azim uth and elev ation, propagation delay , complete geometric tra jectory with 3D interaction-point co ordinates, in teraction t yp e at each p oint, and material index of eac h interacting surface. The RSS output is computed via incoherent pow er summation ov er all retained ra ys. Because per-ray phase information is fully preserved, coheren t sup erp osition is a v ailable through the p ost-processing interface. The geometric ra y paths are frequency-indep enden t. T o obtain c hannel information at a differen t carrier frequency , users sp ecify the target frequency and corresp ond- ing material parameters ϵ ′ r ( f ) and σ ( f ). The framework re-ev aluates all in teraction co efficien ts along the stored geometric tra jectories without re-executing visibility com- putation or path search. Similar to [ 34 ], the narro wband MIMO channel matrix for an N t × N r arra y system is H ( f ) = N ray X p =1 α p a R ( θ R,p , ϕ R,p ) a H T ( θ T ,p , ϕ T ,p ) e − j 2 πf τ p , (6) where α p is the complex path gain, τ p is the delay , and a R , a T are the receive and transmit array steering vectors. Dataset construction and training configuration T o train D 2 LoS, we extracted 701 urban top ographies from OSM cov ering diverse building densities and street la youts. Eac h en vironmen t is rasterised in to a 257 × 257 grid. F or eac h scenario, m ultiple transmitter p ositions are sampled and the ground- truth LoS map and pro jection point co ordinates are computed using the exact rotational sweep algorithm. The 701 scenarios are strictly partitioned: scenarios 0–630 for training and v alidation, and scenarios 631–700 as a completely unseen test set. T o provide ra y-level ground truth for end-to-end ev aluation, we constructed Ra yV erse-100 by selecting 100 scenarios from geographically distinct regions. F or each scenario, the full R T pip eline is executed: exact LoS computation, BFS path enumera- tion with K = 4, and UTD field computation at ev ery grid p oin t. The output con tains the top-8 per-ray multi path parameters. The RayV erse-100 scenarios are drawn from the test partition to ensure no o verlap with D 2 LoS training data. Built on UTD, the dataset exp oses op en material parameter interfaces for cross-band CSI generation. 16 P ost-pro cessing interfaces for coheren t superp osition, MIMO c hannel matrix syn thesis, and antenna pattern integration are provided. D 2 LoS is trained on NVIDIA R TX 4090 and A100 GPUs using AdamW with a cosine annealing learning rate schedule. The initial learning rate is 1 . 8 × 10 − 3 , the batc h size is 64, and training runs for 120 ep ochs. All metrics rep orted in T ables 1 – 3 are computed as mean ± standard deviation ov er the 100 independent test scenarios. No scenario in the test set ov erlaps with the training data geographically or topologically . Supplemen tary Theorem S1: Complexit y Analysis of D 2 LoS Theorem 1 (Computational complexity reduction) Given m building vertic es and n evalua- tion p oints, D 2 L oS r educ es the p er-tr ansmitter L oS prepr o c essing c omplexity from O ( m log m + n ) to O ( M log M + n ) , wher e M is the numb er of pr e dicte d b oundary vertic es. In typic al urb an sc enarios, M ≪ m and M log M ≪ n , so the effe ctive p er-transmitter c ost is O ( n ) . Under GPU par al lelisation with sufficient cor es, the wal l-clo ck time is b ounde d by a c onstant indep endent of b oth m and n . Pr o of Classic al b aseline. The rotational sw eep algorithm computes the complete LoS p olygon for a single transmitter in O ( m log m ): all m edges are sorted angularly and sw ept. Ev aluation of n receiver p oints against this p olygon costs O ( n ) via angular binary search. The total p er-transmitter cost is O ( m log m + n ). D 2 L oS c ost de c omp osition. D 2 LoS replaces the O ( m log m ) p olygon construction with three op erations. Step 1: CNN infer enc e. The net work processes a fixed H × W input tensor with H = W = 257. F or a U-Net with L lay ers eac h of bounded filter size, the computation cost is O ( L · H · W ). Since L , H , and W are all fixed constants independent of m and n , the total inference cost is a constan t C CNN . Step 2: Ge ometric p ost-pr o cessing. F or each of the M predicted b oundary vertices, we iden tify the nearest building edge within a search radius R search . W e assume a uniform grid- based spatial index is precomputed for eac h scenario in O ( | E | ) time, where | E | is the total n umber of building edges. Given this index, eac h query retriev es at most k candidate edges, where k ≤ π R 2 search · ρ edge and ρ edge is the maximum local edge densit y . Since ρ edge is b ounded by the building geometry and R search is a fixed constan t, k is b ounded b y a constan t indep enden t of m . Each ray-edge intersection test costs O (1). The total cost of geometric p ost-processing is therefore O ( M · k ) = O ( M ). Step 3: L oS b oundary r asterisation. The M b oundary segments are sorted angularly with resp ect to p s in O ( M log M ). The sorted b oundary is then rasterised onto the H × W grid by scanline trav ersal in O ( n ), where n = H × W . The total rasterisation cost is O ( M log M + n ). T otal c ost. Combining the three steps: T D 2 LoS = C CNN + O ( M ) + O ( M log M + n ) = O ( M log M + n ) . (S1) In typical urban scenarios, m ≈ 1500–3000 and M ≈ 20–80 (i.e., only 2–5% of build- ing vertices lie on the LoS boundary for a given transmitter). Therefore M log M ≤ 80 × log 2 (80) ≈ 506, while n = 257 2 = 66 , 049. Since M log M ≪ n , the effective complexity sim- plifies to O ( n ), compared with O ( m log m + n ) for the classical metho d. The impro vemen t factor in the p olygon construction step is m log m/ ( M log M ) ≥ 30 × for typical v alues. 17 GPU p ar al lelisation. The three steps parallelise as follo ws. CNN inference maps to tensor- core parallelism with wall-clock time determined by net work depth, not spatial resolution. This is a constant T CNN on any mo dern GPU. The M edge-snapping and ray-edge inter- section operations are indep enden t and execute in O (1) wall-clock time with M parallel threads. Angular sorting of M elemen ts can b e p erformed via parallel merge sort in O (log 2 M ) w all-clo c k time. The n p oin t-in-p olygon ev aluations are indep endent; each tests membership against the sorted angular b oundary in O (log M ) via binary search. With n parallel threads, this step has O (log M ) w all-clo c k time. The total wall-clock time under GPU parallelisation is: T wall = T CNN + O (1) + O (log 2 M ) + O (log M ) = O ( T CNN + log 2 M ) . (S2) Since b oth T CNN and log 2 M are bounded constants independent of m and n , the w all- clo c k time p er transmitter is O (1) with resp ect to the scenario size. □ Supplemen tary Theorem S2: UTD Numerical Stabilit y and Field Con tin uit y Theorem 2 (P oint wise diffracted field b ound and shado w b oundary con tinuit y) Consider the Luebb ers UTD diffr action c o efficient D for a lossy diele ctric we dge with exterior angle nπ . The fol lowing pr op erties hold: (a) At the shadow b oundary ( ϕ − ϕ ′ = π ), the diffr acte d field satisfies | E d | = 0 . 5 · | E i | , ensuring that the total field E total = E i + E d is c ontinuous acr oss the b oundary. (b) F or al l observation angles, | D | is b ounde d ab ove by its value at the shadow b oundary. Ther efor e, the envelop e clamp | D | max = 0 . 5 do es not alter the physic al solution and serves only as a numeric al safeguar d. Pr o of Part (a): Shadow b oundary limit. The Luebb ers UTD diffraction co efficien t consists of four terms: D = 4 X i =1 D i , D i = − e − j π/ 4 2 n √ 2 π k C i · cot π + β i 2 n F k L i a + ( β i ) , (S3) where β i ∈ { ϕ − ϕ ′ , ϕ + ϕ ′ } with appropriate sign combinations, C i ∈ { 1 , 1 , R 0 , R n } are the face reflection co efficien ts, and F ( X ) = 2 j √ X e j X R ∞ √ X e − j t 2 dt is the F resnel transition function. A t the inciden t shadow boundary where β 1 = ϕ − ϕ ′ → π , the cotangent factor in D 1 has a p ole: cot π + β 1 2 n → ∞ . Sim ultaneously , the transition function argument satisfies a + ( β 1 ) → 0, so F ( k L 1 a + ( β 1 )) → 0. Applying L’Hˆ opital’s rule to the product: lim β 1 → π cot π + β 1 2 n F k L 1 a + ( β 1 ) = n r 2 π k L 1 e j π/ 4 . (S4) Substituting back into D 1 and multiplying by the free-space spreading factor √ L 1 / (4 π d ) yields | E (1) d | → 0 . 5 · | E i | at the shado w b oundary . The remaining terms D 2 , D 3 , D 4 in volv e ϕ + ϕ ′ com binations that do not pro duce poles at ϕ − ϕ ′ = π and contribute finite corrections. Their sum preserves the total limit of 0 . 5 · | E i | by the standard UTD con tinuit y condition, whic h requires the total field to equal 0 . 5 · E i at the shadow b oundary by construction of the F resnel transition function. Part (b): Global bound. 18 Aw ay from the shadow boundary , a + ( β i ) > 0 and the F resnel transition function satisfies | F ( X ) | ≤ 1 for all X ≥ 0, with | F ( X ) | → 1 as X → ∞ . Meanwhile, the cotangent factors remain b ounded when β i is a wa y from ± nπ . The pro duct | cot( · ) · F ( · ) | achiev es its maximum at the shadow b oundary where the L’Hˆ opital limit applies, and decreases monotonically as the observ ation angle mov es aw ay from the b oundary . This monotonic decay is a well-kno wn prop ert y of the UTD diffraction co efficient for conv ex w edges with n ≥ 1 (see Kouyoumjian and Pathak, Pro c. IEEE, 1974). Therefore, | D ( ϕ ) | ≤ | D ( ϕ = ϕ ′ + π ) | for all observ ation angles ϕ . The en velope clamp | D | max = 0 . 5 does not clip an y ph ysically correct solution. It acts solely as a guard against floating-p oin t ov erflow when cot( · ) and F ( · ) are ev aluated independently near the shadow b oundary , where their pro duct is finite but each factor individually div erges. Numeric al implementation. In floating-p oint arithmetic, finite-precision cancellation in the transition function F ( X ) for small X can pro duce spurious large v alues b efore the product is formed. The env elope clamp provide s a post-ho c correction: | E clamped d | = min | E computed d | , 0 . 5 · | E i | . (S5) This ensures that numerical artifacts do not violate the ph ysical b ound established in P art (b). □ R emark 1 (F orward-scatter smoothing) F or near-grazing forw ard scattering with deflection angle 0 < θ < 30 ◦ , the four UTD cotangent terms partially cancel, producing a small net diffraction coefficient with rapid oscillation due to the comp eting signs of D 1 – D 4 . These oscil- lations are sensitiv e to small p erturbations in w edge geometry and are not reliably reproduced in discretised building models where edge p ositions are kno wn only to pixel-lev el precision (∆ r = 1 m). W e replace the oscillatory solution with a monotonic linear atten uation in the log domain: L smooth ( θ ) = 6 . 02 + 30 − 6 . 02 30 ◦ · (30 ◦ − θ ) [dB] , θ ∈ [0 ◦ , 30 ◦ ] . (S6) A t θ = 30 ◦ , L smooth = 6 . 02 dB, matching the UTD env elop e clamp and ensuring C 0 con ti- n uity . At θ = 0 ◦ , L smooth = 30 dB, reflecting the ph ysical exp ectation of strong atten uation for forward-diffracted rays. This smo othing is a mo delling c hoice v alidated by the end-to-end RSS accuracy rep orted in the main text. Supplemen tary Theorem S3: Geometric V alidit y of 2D × 2D Decomp osition Theorem 3 (Exactness of 2D × 2D LoS decomp osition) Consider a set of buildings { B 1 , . . . , B N } under the 2.5D mo del, wher e e ach building is an extrude d right prism B i = P i × [0 , h i ] with non-overlapping fo otprints ( P i ∩ P j = ∅ for i = j ), p olygonal fo otprint P i , and height h i > 0 . F or any tr ansmitter p s = ( x s , y s , h tx ) and r e c eiver p r = ( x r , y r , h rx ) lo c ate d outside al l buildings, the ful l 3D dir e ct-p ath L oS test is e quivalent to: LoS 3D ( p s , p r ) = LoS 2D - H ( p s , p r ) ∧ LoS 2D - V ( p s , p r ) , (S7) wher e LoS 2D - H is the horizontal interse ction test on the 2D pr oje cted ray and LoS 2D - V is the vertic al elevation test against building heights. This e quivalenc e holds with zer o appr oximation err or. 19 Pr o of Setup. Let R 3D ( t ) = r 2D ( t ) , z ( t ) parameterise the direct ray from p s to p r with t ∈ [0 , 1], where r 2D ( t ) = (1 − t )( x s , y s ) + t ( x r , y r ) and z ( t ) = (1 − t ) h tx + t h rx . Note that z ( t ) is linear and therefore monotonic or constan t o ver any sub-interv al. Ne c essary and sufficient c ondition for o c clusion. The ray is occluded by building B i if and only if there exists t ∗ ∈ (0 , 1) suc h that R 3D ( t ∗ ) ∈ B i . By the Cartesian pro duct structure B i = P i × [0 , h i ], this decomp oses as: ∃ t ∗ ∈ (0 , 1) : r 2D ( t ∗ ) ∈ P i ∧ 0 ≤ z ( t ∗ ) ≤ h i . (S8) Case 1: No horizontal interse ction. If r 2D ( t ) / ∈ P i for all t ∈ (0 , 1), then no t ∗ satisfying Eq. (S8) exists, and the ray clears B i . No vertical chec k is needed. Case 2: Horizontal interse ction exists. Suppose the 2D pro jected ra y in tersects P i . The in tersection consists of one or more in terv als [ t in , t out ] ⊂ (0 , 1). The ray is inside B i in the v ertical dimension if and only if z ( t ∗ ) ≤ h i for some t ∗ ∈ [ t in , t out ]. Since z ( t ) is linear, its minim um ov er [ t in , t out ] is min z ( t in ) , z ( t out ) . The condition z ( t ∗ ) ≥ 0 is alwa ys satisfied since h tx > 0 and h rx > 0. Therefore, the ray clears B i v ertically if and only if: min z ( t in ) , z ( t out ) > h i . (S9) Glob al L oS c ondition. The ray has a clear LoS if and only if it clears every building. Since the footprints are non-ov erlapping, the horizon tal intersection tests are indep enden t across buildings. The global condition is: LoS 3D = N ^ i =1 h r 2D ( t ) / ∈ P i , ∀ t ∈ (0 , 1) | {z } no horizontal intersection ∨ min z ( t i in ) , z ( t i out ) > h i | {z } clears ro oftop i . (S10) This is precisely the conjunction of LoS 2D-H and LoS 2D-V . The decomp osition in tro duces no approximation b ecause: 1. Each building B i is a Cartesian pro duct of a 2D fo otprin t and a 1D heigh t interv al, making horizontal and vertical dimensions separable. 2. The ray heigh t z ( t ) is linear, so its extremum o ver any interv al is attained at an endp oin t. 3. Building footprints are non-ov erlapping, so per-building tests are indep enden t. Therefore Eq. (S7) holds exactly under the stated assumptions. □ R emark 2 (Non-conv ex fo otprin ts) When a building fo otprint P i is non-conv ex, the horizon- tal ray-footprint intersection ma y consist of multiple disjoint interv als { [ t ( k ) in , t ( k ) out ] } K k =1 . The v ertical chec k in Eq. (S9) is then applied independently to each in terv al. The decomposi- tion remains exact b ecause the linearit y of z ( t ) and the Cartesian pro duct structure hold regardless of fo otprin t conv exity . R emark 3 (Limitations of the 2.5D assumption) The 2.5D prism assumption requires eac h building to hav e a uniform height h i . This do es not hold for buildings with complex ro oftop geometries such as pitc hed ro ofs, domes, or ro oftop equipment. In such cases, the actual ro oftop surface is a function h i ( x, y ) rather than a constan t, and the v ertical c heck in Eq. (S9) m ust b e replaced by: min t ∈ [ t in ,t out ] z ( t ) − h i r 2D ( t ) > 0 , (S11) whic h cannot b e ev aluated from endp oint v alues alone when h i ( x, y ) is non-linear. The appro ximation error is b ounded b y max ( x,y ) ∈ P i | h i ( x, y ) − ¯ h i | , where ¯ h i is the uniform height used in the 2.5D model. 20 Supplemen tary Results: Beam P attern Integration The main text demonstrates p ost-hoc b eam pattern integration with a 15 ◦ half- p o w er b eam width. Here we pro vide the complete set of results across four b eam widths (15 ◦ , 30 ◦ , 45 ◦ , 60 ◦ ) and supplemen tary qualitative comparisons. In all cases, the an tenna gain pattern G ant ( ϕ AoD , θ AoD ) is applied to p er-ra y AoD after the ray tracing computation, without re-executing visibilit y determination or path search. 15 ◦ b eam width: qualitativ e APS and PDP The main text presents 15 ◦ b eam RSS maps and quan titative violin distributions. Supplemen tary Figs. 1 and 2 show the corresp onding APS and PDP qualitative com- parisons. The narro w 15 ◦ b eam acts as a stringen t test of p er-ra y AoD accuracy: small angular errors in the predicted rays are amplified b y the sharp beam roll-off, caus- ing misclassified rays to be either strongly atten uated or incorrectly retained. D 2 LoS repro duces the b eam-filtered APS profiles with correct dominant peak p ositions and sidelob e suppression. In the PDP domain, the narrow beam remov es most off-axis m ultipath, leaving only a few dominant dela y comp onents. D 2 LoS captures b oth their p ositions and relative p ow er lev els, whereas RadioUNet and RMT ransformer pro duce dela y profiles that b ear no resemblance to the ground truth. GT No-Geom D 2 Los RadioUNet RMTransformer Fig. 1 : APS comparison with a 15 ◦ b eam pattern. The directional pattern narro ws the angular spread and amplifies the dominan t arriv al direction. D 2 LoS repro- duces the b eam-filtered angular profile. No-Geom preserves the general shap e but in tro duces secondary p eak errors. RadioUNet and RMT ransformer produce profiles unrelated to the ground truth. 21 GT No-Geom D 2 Los RadioUNet RMTransformer Fig. 2 : PDP comparison with a 15 ◦ b eam pattern. The beam pattern sup- presses off-axis m ultipath, reducing the num b er of resolv able delay comp onen ts. D 2 LoS correctly captures this filtering effect. RadioUNet and RMT ransformer pro duce dela y profiles with incorrect pow er levels and spurious peaks. 30 ◦ b eam width Increasing the b eamwidth to 30 ◦ admits more off-axis multipath in to the receiv ed signal. This relaxes the angular selectivity compared to the 15 ◦ case, making the b eam-filtered c hannel closer to the omnidirectional baseline. As shown in Fig. 3 , D 2 LoS main tains compact error distributions across all three c hannel dimensions. The RSS MAE remains within 1 dB of the omnidirectional result, and the APS shap e cosine stays abov e 0.85. No-Geom shows mo derate degradation, while RadioUNet and RMT ransformer contin ue to pro duce heavy-tailed error distributions. The qualitativ e RSS maps (Fig. 4 ) confirm that D 2 LoS preserv es the wider beam footprint and shado w b oundaries. The APS and PDP curves (Figs. 5 and 6 ) sho w that D 2 LoS trac ks both the dominant and secondary m ultipath comp onen ts under the 30 ◦ b eam. 45 ◦ b eam width A t 45 ◦ b eam width, the directional filtering b ecomes mild and the b eam-specific chan- nel approaches the omnidirectional case. Fig. 7 shows that the error distributions for D 2 LoS are nearly identical to the omnidirectional violin plots in the main text. This is exp ected: when the b eam is wide enough to capture most m ultipath comp onents, angular errors in individual ra ys ha ve limited impact on the aggregated metrics. The RSS maps (Fig. 8 ) sho w only subtle differences from the omnidirectional maps, pri- marily at the b eam edges where sligh t p o w er attenuation is visible. The APS and PDP curv es (Figs. 9 and 10 ) closely match the omnidirectional results for D 2 LoS, 22 D 2 L o S No-Geom R adioUNet RMTransformer 0 20 40 60 80 a) MAE (dB) D 2 L o S No-Geom R adioUNet RMTransformer 40 20 0 20 40 60 80 b) Bias (dB) D 2 L o S No-Geom R adioUNet RMTransformer 0.0 0.1 0.2 0.3 c) NMSE D 2 L o S No-Geom R adioUNet RMTransformer 0.50 0.25 0.00 0.25 0.50 0.75 1.00 d) Correlation D 2 L o S No-Geom R adioUNet RMTransformer D 2 L o S No-Geom R adioUNet RMTransformer 0 20 40 60 a) AS Abs Err (deg) D 2 L o S No-Geom R adioUNet RMTransformer 0 50 100 150 b) MDoA Abs Err (deg) D 2 L o S No-Geom R adioUNet RMTransformer 0.0 0.2 0.4 0.6 0.8 1.0 c) APS Shape Cosine D 2 L o S No-Geom R adioUNet RMTransformer 0.000 0.005 0.010 0.015 0.020 0.025 0.030 d) APS Shape RMSE D 2 L o S No-Geom R adioUNet RMTransformer D 2 L o S No-Geom R adioUNet RMTransformer 0 50 100 150 200 250 300 a) DS Abs Err (ns) D 2 L o S No-Geom R adioUNet RMTransformer 0 200 400 600 800 b) Median Delay Abs Err (ns) D 2 L o S No-Geom R adioUNet RMTransformer 0 5 10 15 20 25 30 c) K -factor Abs Err (dB) D 2 L o S No-Geom R adioUNet RMTransformer 0.0 0.2 0.4 0.6 0.8 1.0 d) PDP Shape Cosine D 2 L o S No-Geom R adioUNet RMTransformer Fig. 3 : Prediction accuracy with a 30 ◦ b eam pattern. D 2 LoS main tains com- pact, low-error distributions across RSS, APS, and PDP metrics, consistent with the 15 ◦ case. while RadioUNet and RMT ransformer remain unable to pro duce physically meaningful outputs regardless of beamwidth. 60 ◦ b eam width The 60 ◦ b eam width represents the widest tested configuration and the mildest direc- tional filtering. As shown in Fig. 11 , D 2 LoS retains low-error, compact distributions that are effectiv ely indistinguishable from the omnidirectional case. The RSS maps (Fig. 12 ) differ from the omnidirectional maps primarily in a sligh t o verall pow er offset due to the finite an tenna gain. The APS and PDP curves (Figs. 13 and 14 ) con- firm that D 2 LoS accuracy is indep endent of beamwidth. T aken together with the 15 ◦ results, these findings demonstrate that the per-ray angular information pro duced by D 2 LoS is sufficiently accurate to supp ort b eam-specific analysis from narrow p encil b eams to near-omnidirectional patterns, all from a single ra y tracing computation. 1 Data a v ailabilit y Data is a v ailable at h ttps://github.com/UNIC- Lab/Ra yV erse . 23 GT RadioUNet D 2 Los No-Geom RMTransformer Fig. 4 : RSS radio maps with a 30 ◦ b eam pattern. The wider b eam pro duces broader spatial co verage compared to the 15 ◦ case. D 2 LoS preserves b oth the b eam fo otprin t and shado w structure. 2 Co de a v ailabilit y Data is a v ailable at h ttps://github.com/UNIC- Lab/D2LoS . References [1] Zheng, Y., Chen, J.: A radio map approach for reduced pilot csi trac king in massiv e mimo net works. IEEE T ransactions on Signal Pro cessing (2025) [2] W ang, X., Zheng, P ., Cheng, N., Sun, R., Chen, J., T ao, K., Yin, Z., Liu, Z., Zeng, Y.: Radio diff-turbo: Light weigh t generative large electromagnetic model for wire- less digital twin construction. In: IEEE INFOCOM 2025 - IEEE Conference on Computer Communications W orkshops (INF OCOM WKSHPS), pp. 1–6 (2025). h ttps://doi.org/10.1109/INFOCOMWKSHPS65812.2025.11152929 [3] W ang, X., Zhang, Q., Cheng, N., Sun, R., Li, Z., Cui, S., Shen, X.: Radio diff- k 2 : Helmholtz equation informed generative diffusion mo del for m ulti-path aw are radio map construction. IEEE J. Sel. Areas Commun. 44 , 2318–2333 (2026) h ttps: //doi.org/10.1109/JSA C.2025.3641105 [4] Zeng, Y., Chen, J., Xu, J., W u, D., Xu, X., Jin, S., Gao, X., Gesb ert, D., Cui, S., Zhang, R.: A tutorial on en vironment-a ware comm unications via channel kno wledge map for 6G. IEEE Comm un. Surveys T uts. 26 (3), 1478–1519 (2024) 24 GT No-Geom D 2 Los RadioUNet RMTransformer Fig. 5 : APS comparison with a 30 ◦ b eam pattern. D 2 LoS closely tracks the ground truth angular profile under the wider b eam. [5] W ang, Z., Zhang, J., Du, H., Niyato, D., Cui, S., Ai, B., Debbah , M., Letaief, K.B., P o or, H.V.: A tutorial on extremely large-scale MIMO for 6G: F undamentals, signal processing, and applications. IEEE Commun. Surveys T uts. 26 (3), 1560– 1605 (2024) [6] Liu, B., Gao, S., Liu, X., Cheng, X., Y ang, L.: Wifo: Wireless foundation mo del for channel prediction. Science China Information Sciences 68 (6), 162302 (2025) [7] Eyceoz, T., Duel-Hallen, A., Hallen, H.: Deterministic channel mo deling and long range prediction of fast fading mobile radio channels. IEEE Comm unications Letters 2 (9), 254–256 (2002) [8] Khu wa ja, A.A., Chen, Y., Zhao, N., Alouini, M.-S., Dobbins, P .: A survey of c hannel modeling for uav comm unications. IEEE Communications Surv eys & T utorials 20 (4), 2804–2821 (2018) [9] Kammoun, A., Khanfir, H., Altman, Z., Debbah, M., Kamoun, M.: Preliminary results on 3d channel mo deling: F rom theory to standardization. IEEE Journal on Selected Areas in Communications 32 (6), 1219–1229 (2014) [10] Deschamps, G.A.: Ra y tec hniques in electromagnetics. Pro c. IEEE 60 (9), 1022– 1035 (1972) [11] T ang, J., Bian, D., Li, G., Hu, J., Cheng, J.: Optimization Metho d of Dynamic Beam Position for LEO Beam-Hopping Satellite Comm unication Systems. IEEE Access 9 , 57578–57588 (2021) 25 GT No-Geom D 2 Los RadioUNet RMT ransformer Fig. 6 : PDP comparison with a 30 ◦ b eam pattern. The wider b eam retains more m ultipath comp onen ts than the 15 ◦ case. D 2 LoS reproduces the delay structure accurately . [12] Ha, T.N., Romero, D., L´ op ez-V alcarce, R.: Radio maps for b eam alignment in mm wa ve comm unications with location uncertaint y . In: 2024 IEEE 99th V ehicular T echnology Conference (VTC2024-Spring), pp. 1–7 (2024). IEEE [13] Oh, S., Myung, N.-H.: MIMO channel estimation metho d using ra y-tracing propagation mo del. Electronics Lett. 40 (21), 1 (2004) [14] Chen, W., Chen, J.: Learning blo c k age and reflection geometry for mimo b eam map construction. In: ICC 2025-IEEE In ternational Conference on Communica- tions, pp. 2321–2326 (2025). IEEE [15] Hoffmann, M., Kryszkiewicz, P .: Beam managemen t driv en b y radio en viron- men t maps in o-ran architecture. In: 2023 IEEE International Conference on Comm unications W orkshops (ICC W orkshops), pp. 54–59 (2023). IEEE [16] Hoydis, J., A ¨ ıt Aoudia, F., Cammerer, S., Nimier-David, M., Binder, N., Marcus, G., Keller, A.: Sionna rt: Differentiable ray tracing for radio propagation mo d- eling. In: 2023 IEEE Globecom W orkshops (GC Wkshps), pp. 317–321 (2023). IEEE [17] He, D., Ai, B., Guan, K., W ang, L., Zhong, Z., K ¨ urner, T.: The design and appli- cations of high-p erformance ray-tracing sim ulation platform for 5g and b ey ond wireless communications: A tutorial. IEEE communications surveys & tutorials 21 (1), 10–27 (2018) 26 D 2 L o S No-Geom R adioUNet RMTransformer 0 20 40 60 a) MAE (dB) D 2 L o S No-Geom R adioUNet RMTransformer 40 20 0 20 40 60 b) Bias (dB) D 2 L o S No-Geom R adioUNet RMTransformer 0.0 0.1 0.2 0.3 c) NMSE D 2 L o S No-Geom R adioUNet RMTransformer 0.50 0.25 0.00 0.25 0.50 0.75 1.00 d) Correlation D 2 L o S No-Geom R adioUNet RMTransformer D 2 L o S No-Geom R adioUNet RMTransformer 0 20 40 60 a) AS Abs Err (deg) D 2 L o S No-Geom R adioUNet RMTransformer 0 50 100 150 b) MDoA Abs Err (deg) D 2 L o S No-Geom R adioUNet RMTransformer 0.0 0.2 0.4 0.6 0.8 1.0 c) APS Shape Cosine D 2 L o S No-Geom R adioUNet RMTransformer 0.000 0.005 0.010 0.015 0.020 0.025 0.030 d) APS Shape RMSE D 2 L o S No-Geom R adioUNet RMTransformer D 2 L o S No-Geom R adioUNet RMTransformer 0 50 100 150 200 250 300 a) DS Abs Err (ns) D 2 L o S No-Geom R adioUNet RMTransformer 0 200 400 600 800 b) Median Delay Abs Err (ns) D 2 L o S No-Geom R adioUNet RMTransformer 0 5 10 15 20 25 30 c) K -factor Abs Err (dB) D 2 L o S No-Geom R adioUNet RMTransformer 0.0 0.2 0.4 0.6 0.8 1.0 d) PDP Shape Cosine D 2 L o S No-Geom R adioUNet RMTransformer Fig. 7 : Prediction accuracy with a 45 ◦ b eam pattern. Error distributions are nearly iden tical to the omnidirectional results, confirming that the wide beam captures most multipath energy . [18] W ang, X., T ao, K., Cheng, N., Yin, Z., Li, Z., Zhang, Y., Shen, X.: RadioD- iff: An effectiv e generative diffusion mo del for sampling-free dynamic radio map construction. Ieee T rans. Cognit. Commun. Netw orking, Early Access, 1–13 (2024) [19] Zhang, S., Wijesinghe, A., Ding, Z.: Rme-gan: A learning framework for radio map estimation based on conditional generativ e adv ersarial netw ork. IEEE Internet Things J. 10 (20), 18016–18027 (2023) [20] W ang, X., Y uan, T., Cao, Y., Cheng, N., Sun, R., Zh uang, W.: iradio diff: Ph ysics- informed diffusion model for indo or radio map construction and localization. In: ICC 2026 - IEEE International Conference on Communications, pp. 1–6 (2026) [21] Xiucheng W ang, N.C. Y uhao Pan: A tutorial on learning-based radio map construction: Data, paradigms, and physics-a warenes. arXiv preprint arXiv:2603.17499 (2026) [22] Guo, J., W en, C.-K., Jin, S., Li, G.Y.: Ov erview of deep learning-based csi feed- bac k in massive mimo systems. IEEE T ransactions on Communications 70 (12), 27 GT Ra dioUNet D 2 Los No-Geom RMT ransformer Fig. 8 : RSS radio maps with a 45 ◦ b eam pattern. The co verage pattern is close to omnidirectional with mild directional shaping at the b eam edges. 8017–8045 (2022) [23] Levie, R., Y apar, C ¸ ., Kut yniok, G., Caire, G.: RadioUNet: F ast radio map estima- tion with con v olutional neural netw orks. IEEE T rans. Wireless Commun. 20 (6), 4001–4015 (2021) [24] W ang, X., Zhang, Q., Cheng, N., Chen, J., Zhang, Z., Li, Z., Cui, S., Shen, X.: Radio diff-3d: A 3d × 3d radio map dataset and generative diffusion based b enc hmark for 6g environmen t-a ware comm unication. IEEE T rans. Netw. Sci. Eng. 13 , 3773–3789 (2026) https://doi.org/10.1109/TNSE.2025.3590545 [25] Y apar, C ¸ ., Levie, R., Kutyniok, G., Caire, G.: Real-time outdo or lo calization using radio maps: A deep learning approach. IEEE T ransactions on Wireless Comm unications 22 (12), 9703–9717 (2023) https://doi.org/10.1109/TW C.2023. 3273202 [26] W olfle, G., Gsc hw endtner, B.E., Landstorfer, F.M.: Intelligen t ra y tracing-a new approac h for field strength prediction in micro cells. In: 1997 IEEE 47th V ehicular T echnology Conference. T echnology in Motion, v ol. 2, pp. 790–7942 (1997). https: //doi.org/10.1109/VETEC.1997.600437 [27] Long, K., W ang, W., W u, Y., Liu, Y.: A fast ray tracing algorithm for urban areas. In: 2022 IEEE 10th Asia-Pacific Conference on Antennas and Propa- gation (APCAP), pp. 1–2 (2022). h ttps://doi.org/10.1109/APCAP56600.2022. 10069838 28 GT No-Geom D 2 Los RadioUNet RMT ransformer Fig. 9 : APS comparison with a 45 ◦ b eam pattern. D 2 LoS closely matc hes the ground truth. The wider b eam preserves most angular features from the omnidirec- tional case. [28] Choi, H., Oh, J., Chung, J., Alexandropoulos, G.C., Choi, J.: Withray: A v ersatile ra y-tracing sim ulator for smart wireless environmen ts. IEEE Access 11 , 56822– 56845 (2023) [29] V alenzuela, R.: A ra y tracing approac h to predicting indoor wireless transmission. In: IEEE 43rd V ehicular T echnology Conference, pp. 214–218 (1993). IEEE [30] Y ang, C.-F., W u, B.-C., Ko, C.-J.: A ray-tracing metho d for mo deling indo or wa ve propagation and p enetration. IEEE transactions on Antennas and Propagation 46 (6), 907–919 (1998) [31] Tsingos, N., F unkhouser, T., Ngan, A., Carlbom, I.: Mo deling acoustics in virtual en vironments using the uniform theory of diffraction. In: Pro ceedings of the 28th Ann ual Conference on Computer Graphics and In teractive T echniques, pp. 545– 552 (2001) [32] Li, Y., Zhang, C., W ang, W., Huang, Y.: Rm transformer: Accurate radio map construction and co verage prediction. In: 2025 IEEE 101st V ehicular T echnology Conference (VTC2025-Spring), pp. 1–5 (2025). IEEE [33] Beamer, S., Asanovi ´ c, K., Patterson, D.: Direction-optimizing breadth-first searc h. Scien tific Programming 21 (3-4), 137–148 (2013) [34] Alkhateeb, A.: Deepmimo: A generic deep learning dataset for millimeter w av e and massive mimo applications. arXiv preprin t arXiv:1902.06435 (2019) 29 GT No-Geom D 2 Los RadioUNet RMTransformer Fig. 10 : PDP comparison with a 45 ◦ b eam pattern. The dela y profile is close to the omnidirectional case. D 2 LoS maintains accurate reproduction of m ultipath struc- ture. 30 D 2 L o S No-Geom R adioUNet RMTransformer 0 20 40 60 a) MAE (dB) D 2 L o S No-Geom R adioUNet RMTransformer 40 20 0 20 40 60 b) Bias (dB) D 2 L o S No-Geom R adioUNet RMTransformer 0.0 0.1 0.2 0.3 c) NMSE D 2 L o S No-Geom R adioUNet RMTransformer 0.50 0.25 0.00 0.25 0.50 0.75 1.00 d) Correlation D 2 L o S No-Geom R adioUNet RMTransformer D 2 L o S No-Geom R adioUNet RMTransformer 0 20 40 60 a) AS Abs Err (deg) D 2 L o S No-Geom R adioUNet RMTransformer 0 50 100 150 b) MDoA Abs Err (deg) D 2 L o S No-Geom R adioUNet RMTransformer 0.0 0.2 0.4 0.6 0.8 1.0 c) APS Shape Cosine D 2 L o S No-Geom R adioUNet RMTransformer 0.000 0.005 0.010 0.015 0.020 0.025 0.030 d) APS Shape RMSE D 2 L o S No-Geom R adioUNet RMTransformer D 2 L o S No-Geom R adioUNet RMTransformer 0 50 100 150 200 250 300 a) DS Abs Err (ns) D 2 L o S No-Geom R adioUNet RMTransformer 0 200 400 600 800 b) Median Delay Abs Err (ns) D 2 L o S No-Geom R adioUNet RMTransformer 0 5 10 15 20 25 30 c) K -factor Abs Err (dB) D 2 L o S No-Geom R adioUNet RMTransformer 0.0 0.2 0.4 0.6 0.8 1.0 d) PDP Shape Cosine D 2 L o S No-Geom R adioUNet RMTransformer Fig. 11 : Prediction accuracy with a 60 ◦ b eam pattern. Error distributions are effectively indistinguishable from the omnidirectional case, confirming robustness across all tested beamwidths. 31 GT RadioUNet D 2 Los No-Geom RMTransformer Fig. 12 : RSS radio maps with a 60 ◦ b eam pattern. D 2 LoS accurately reproduces the near-omnidirectional co v erage with mild directional shaping. GT No-Geom D 2 Los RadioUNet RMTransformer Fig. 13 : APS comparison with a 60 ◦ b eam pattern. The angular profile is close to the omnidirectional case. D 2 LoS maintains full accuracy . 32 GT No-Geom D 2 Los RadioUNet RMTransformer Fig. 14 : PDP comparison with a 60 ◦ b eam pattern. Delay structure matc hes the omnidirectional case closely . D 2 LoS repro duces it accurately . 33
Original Paper
Loading high-quality paper...
Comments & Academic Discussion
Loading comments...
Leave a Comment